Using a weekly market profile can really improve your entries.
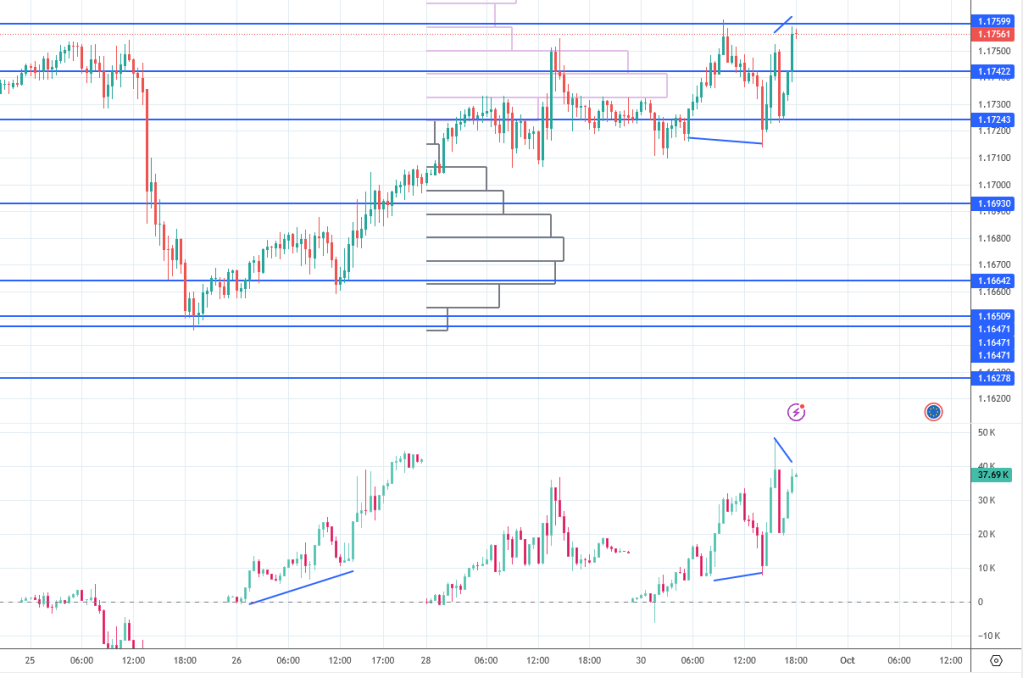
There are two typical rejection zones. One, the easier one to spot is the POC. What you need to be conscious of is that the 10-pip zone towards it is all hot, and if you go over the POC by 8 pips, that’s just a slight overshoot.
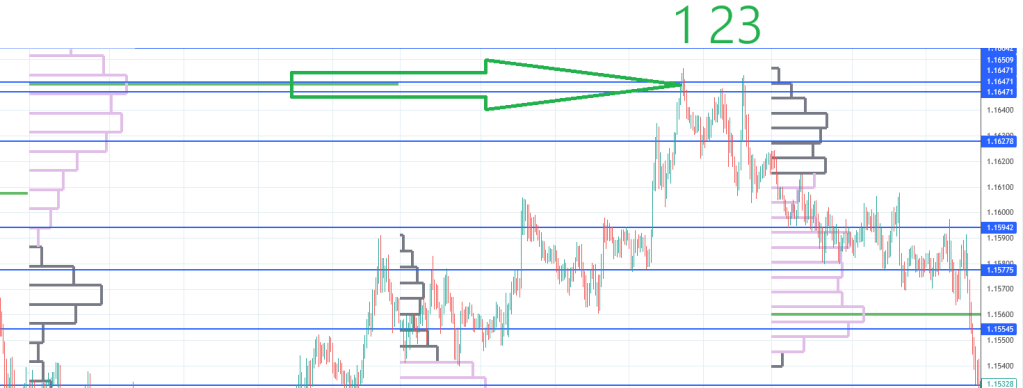
One recurring theme is having to see multiple failures, but at least 2.
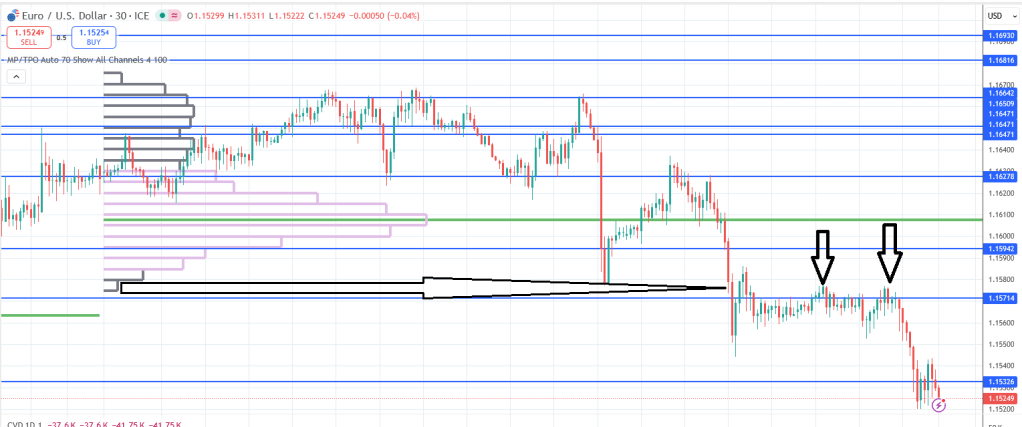
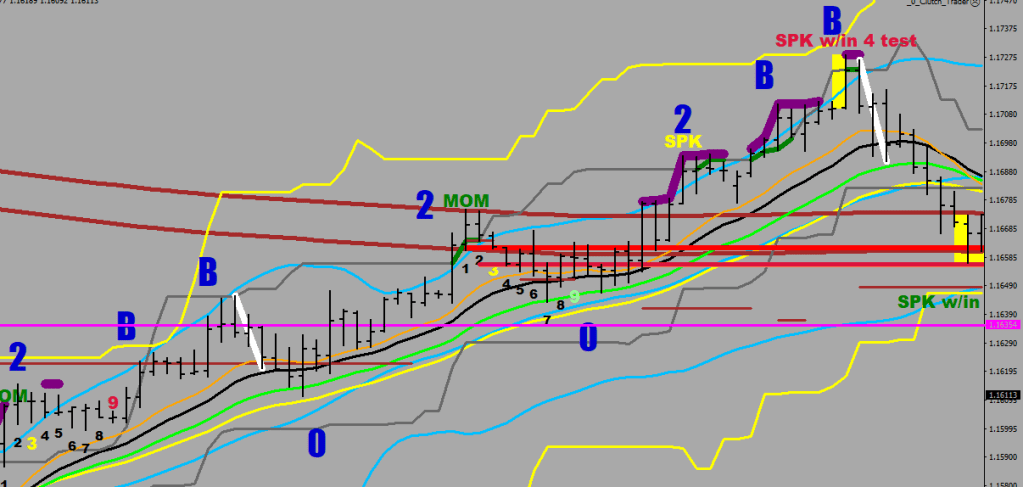
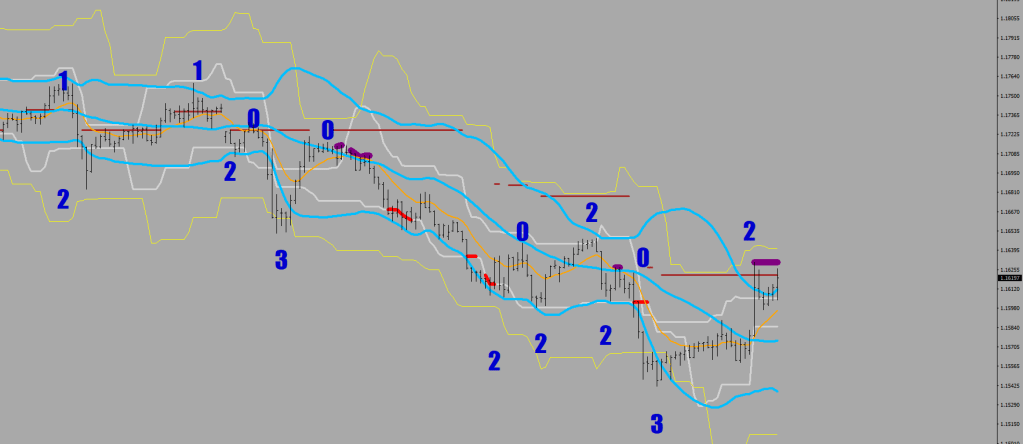
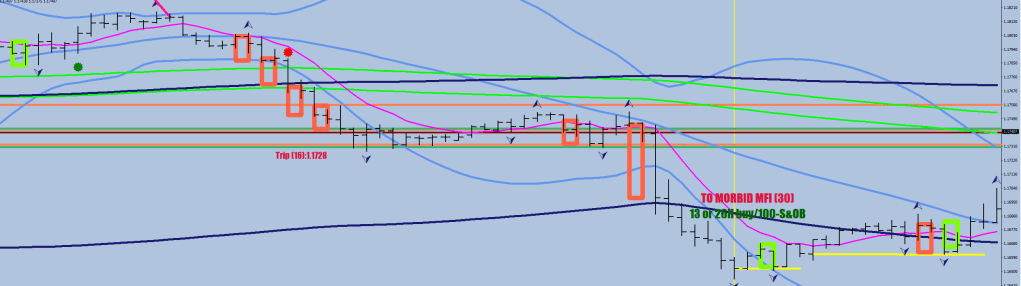
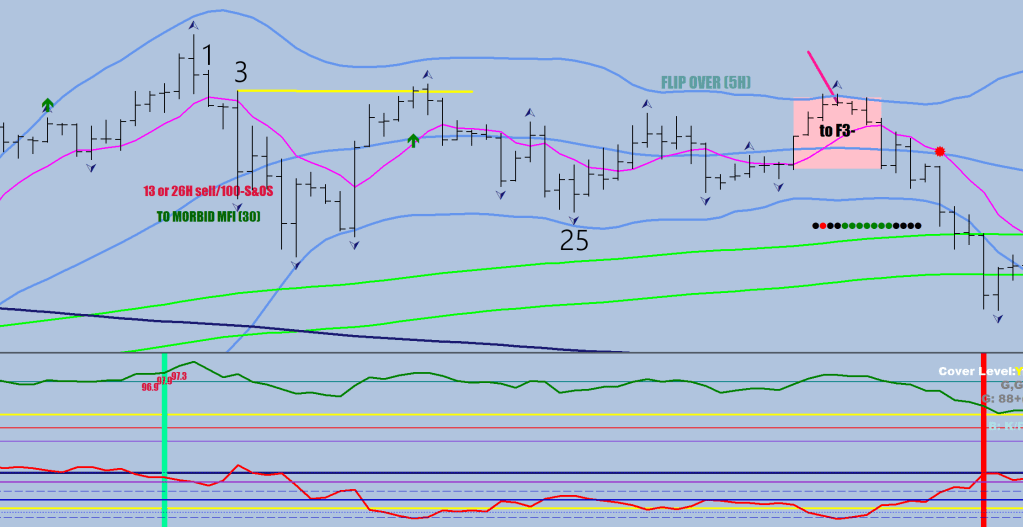
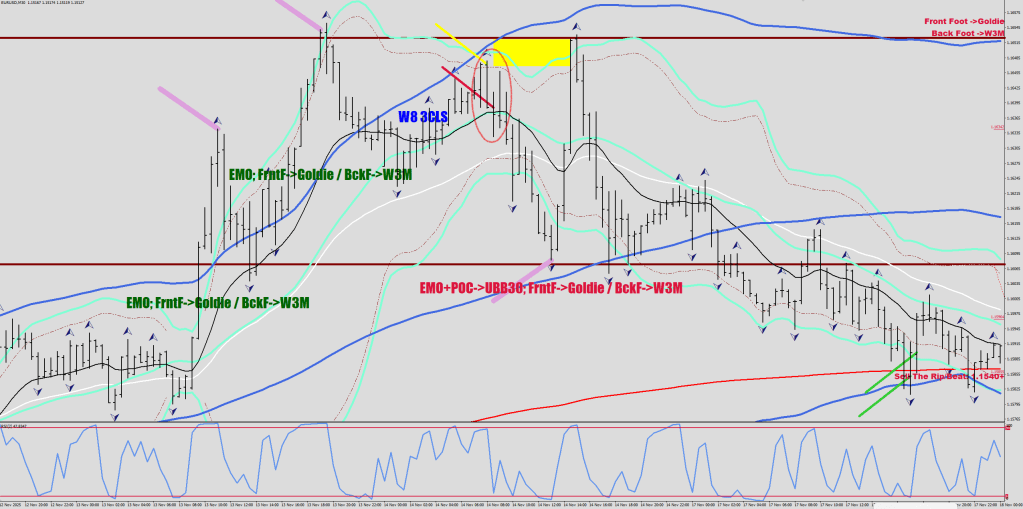
Zooming in, you see where the market turns into a sell-the-rip. A move from beyond the dotted line (3-pips shy of the 30BB on the 30 min), which ends up closing back inside the 16 EMA by 2 pips within the next 2 candles. The Maroon lines are various POCs.
I have not started making indicators for TradingView, and don’t think I would, as you can only have 2 plots for free.
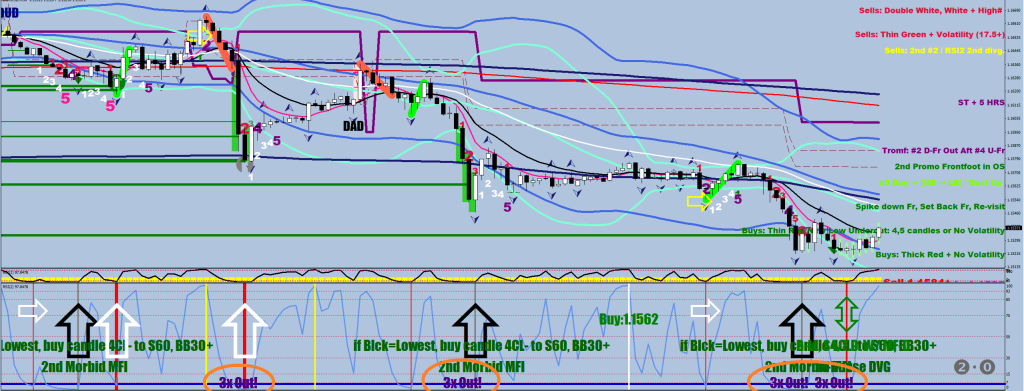
After the behavior has changed, you can put out pending orders, scale into a short towards the POC, say one third of the maximum size you have in mind, 8pips out, one third 4 pips out, and the rest at the POC.
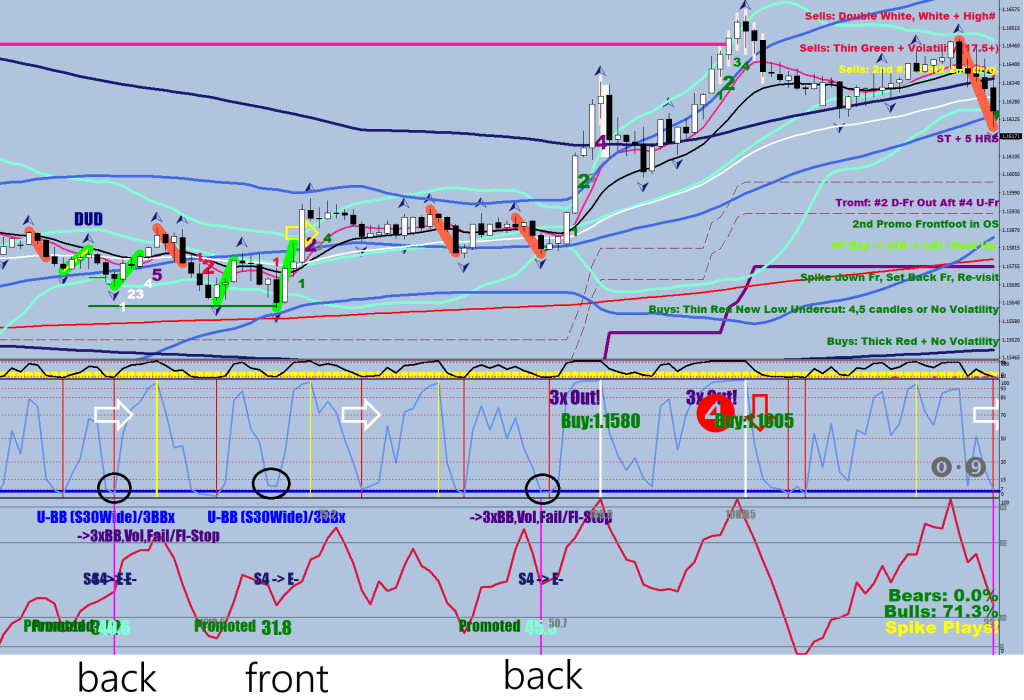
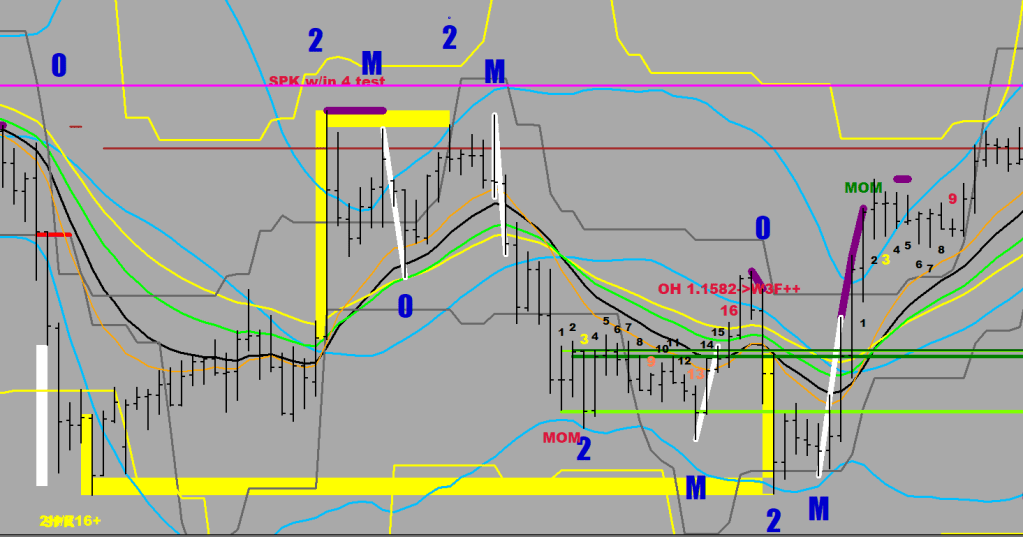
As you can see, the first leg down after the behavior change does bounce back hard from the lower POC, but there is also a sign of acceleration to the downside: the 4 consecutive closes outside the 30BB, marked up by the purple line. The following setback, the 1.5-hour rip back to the upper POC, was the liquidity break. You should therefore be suspicious of moves covering great distances in a short amount of time, seemingly out of nowhere.
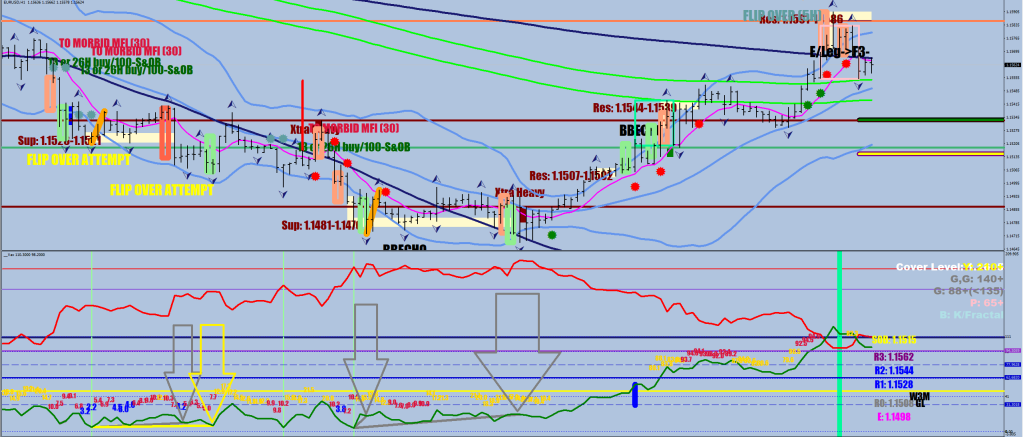
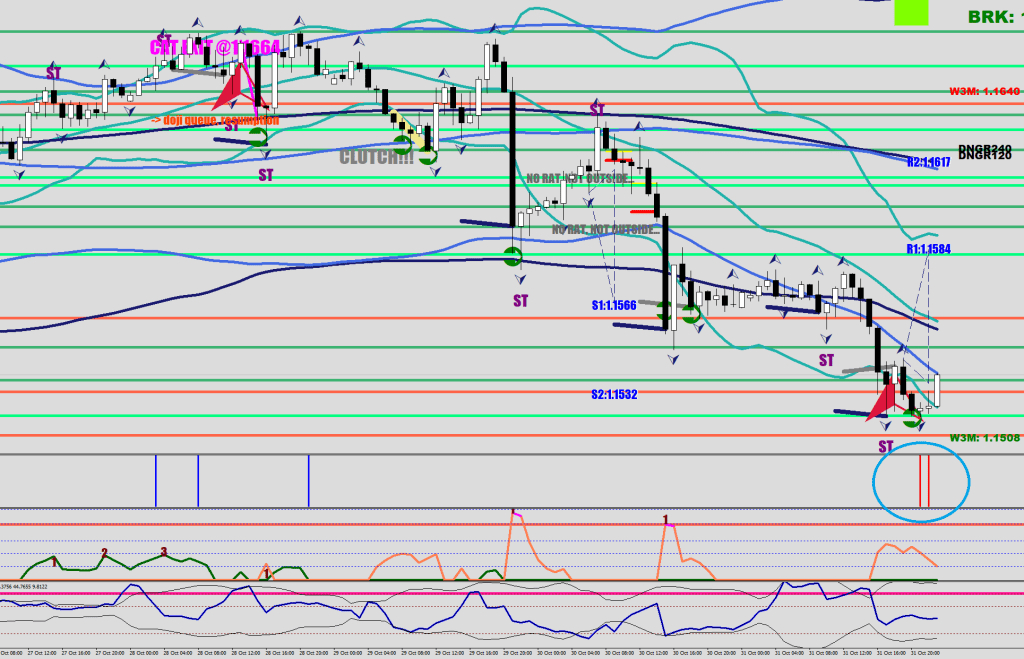
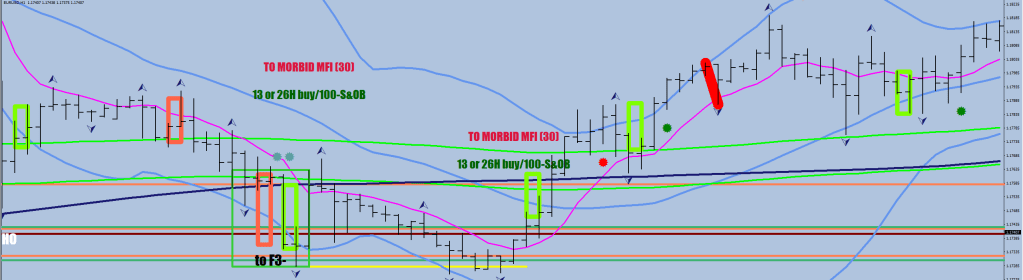
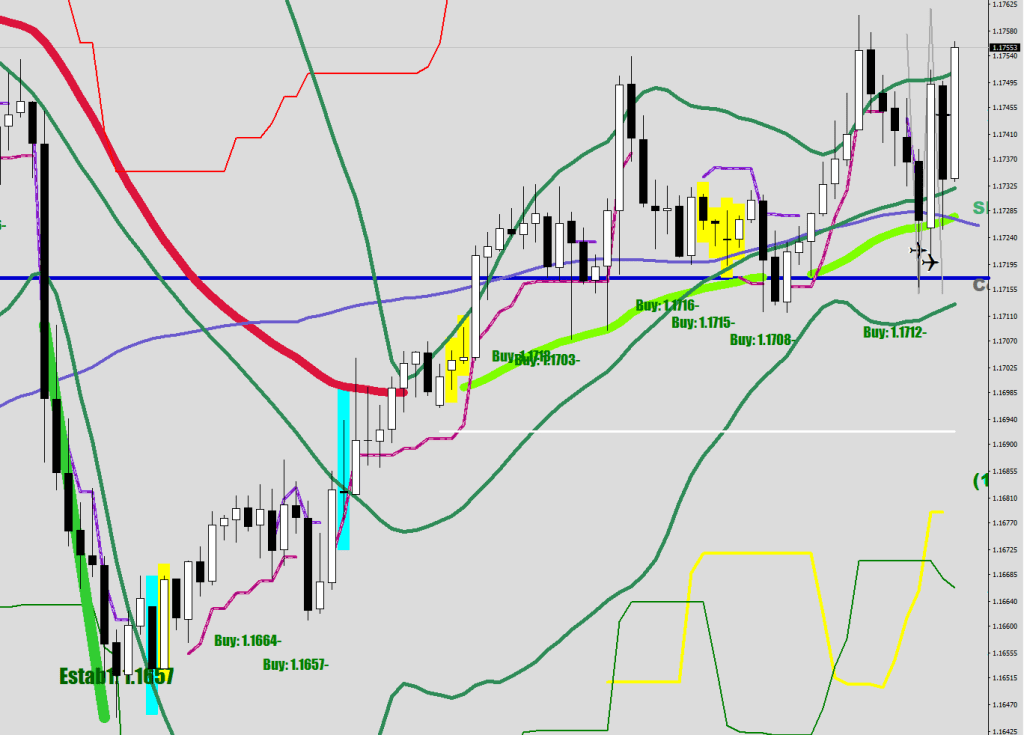
Then the market finds resistance at the 30 SMA / E-44, and gets to break the lower POC.
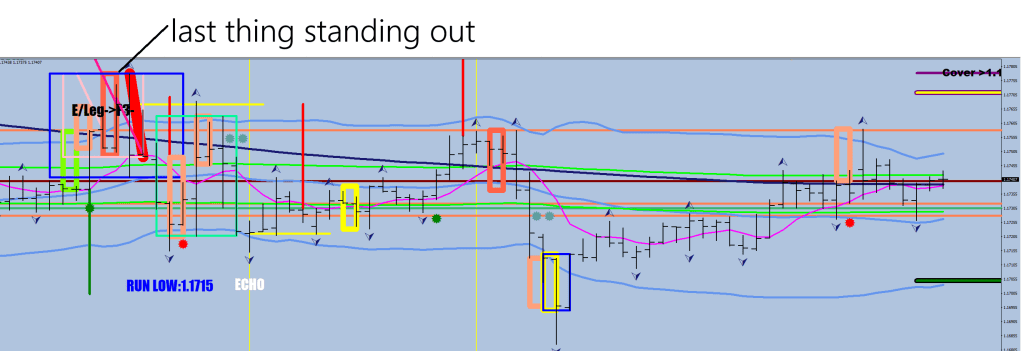
Then there was buy the dip again, with the ceiling being the back tests from below.

The dip in this constrained box meant the moves below the 50% mark between the next two POCs.
The mode flipped again, and there was a kiss goodbye to the now upper POC-s force field. Since there was a lot more interaction with the lower field before this back test, what you should have done as a pro trader is to give a discount on your spread, i.e., put 2/3 of your size out 8-pip shy and another third at 4 (went unfilled).
The break this time went into overdrive.
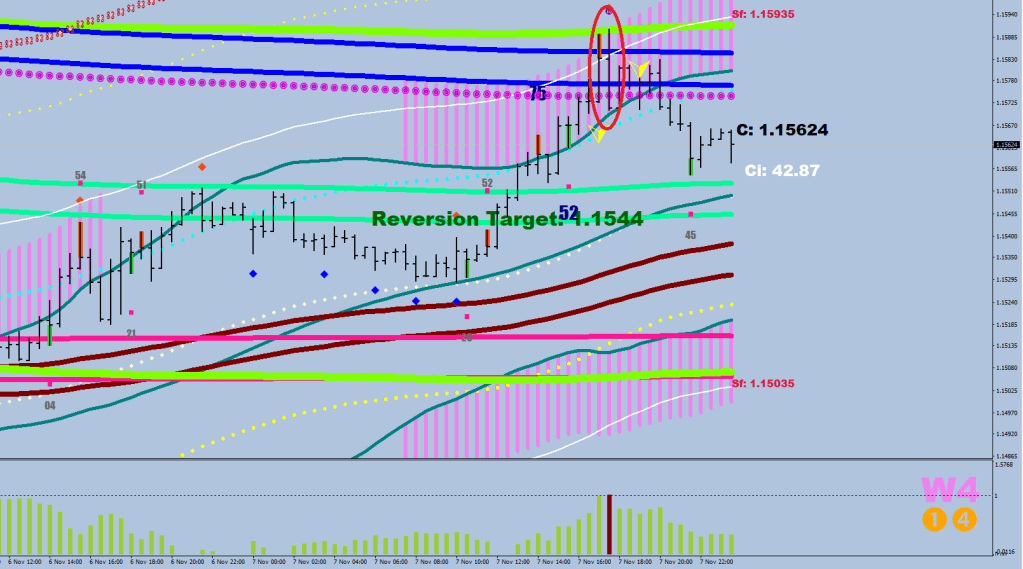
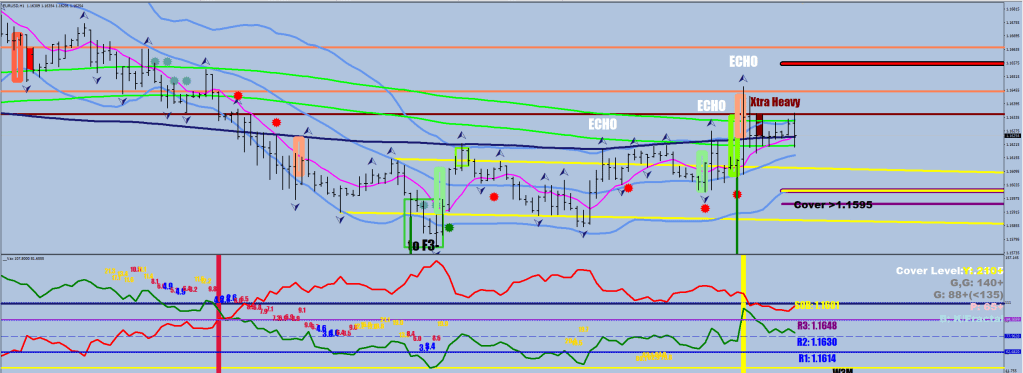
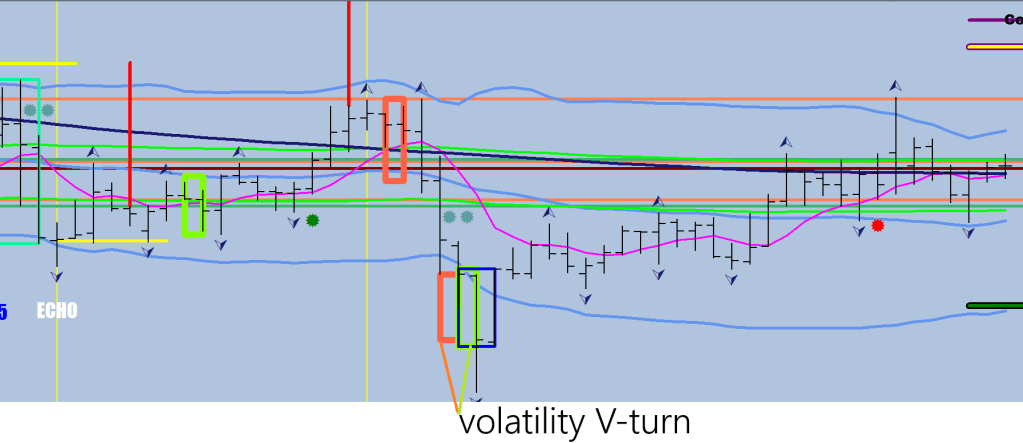
After the buy-flip impulse, you could have taken a long in the green box: more than 50% away from the top, and exited 10-12 pips away from the POC, considering the major acceleration to the downside; one run had 8 closes outside the BB. The better trade was, of course, selling against the POC, at 12 pips out, as that was all you got. Looking at the green oval, one thing should pop in your mind: the violence of it again was a hint for a liquidity break.

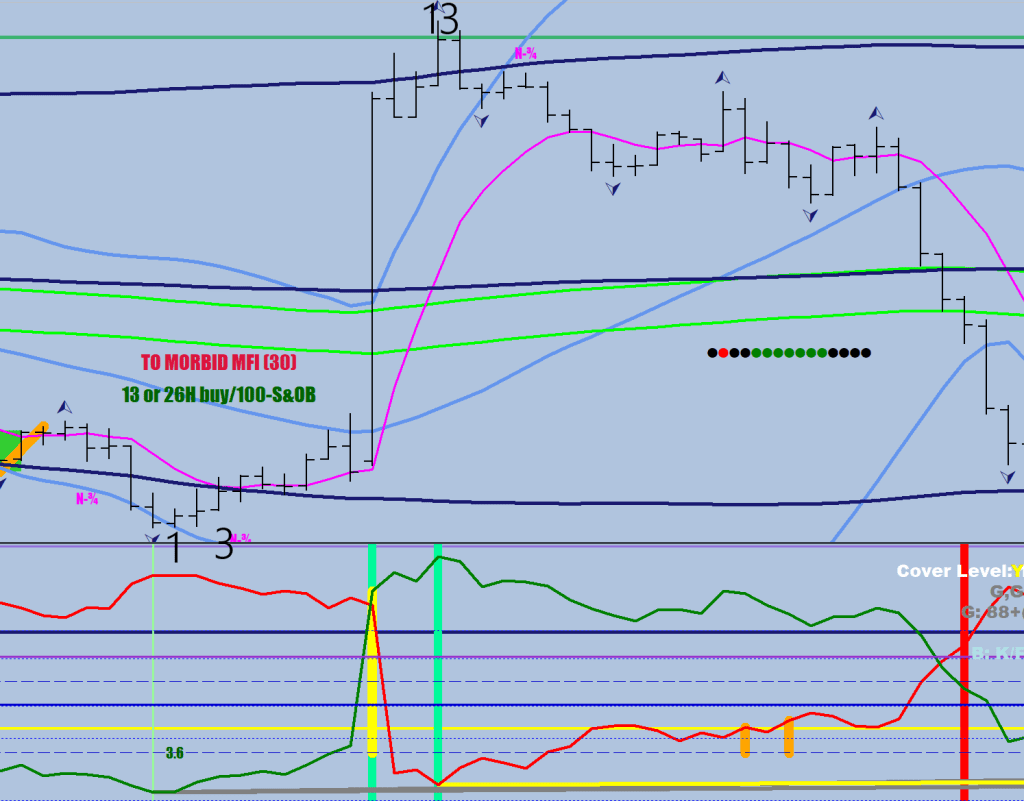
That is what you get after an acceleration: the counter move would be a temporary setback before a continuation.
Now we have stalled out at the lower POC. The market hasn’t flipped mode, so the 50%+ would be a good place to enter (the rip) for running over the lower POC. Also, there will be another POC print in the mix, probably not far above it.
The mode would have to change. It could be done with the next leg down, with a slightly lower low that does not get past the lower POC by 10+ pips.
One remark is that I shift up the TradingView POCs when transferring them from the ICE chart to MT4 by up to 3 pips.
Also, if you were a scammer, you could sell the POCs as for instance, Voodoo lines for $90 per month and call the Monthlies Tree Lines and the Yearlies Snow Lines, etc. Just an idea.