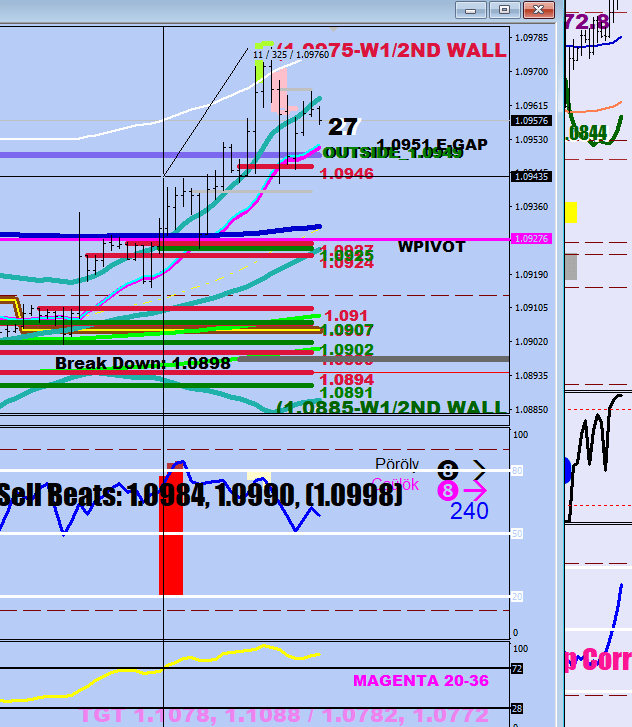
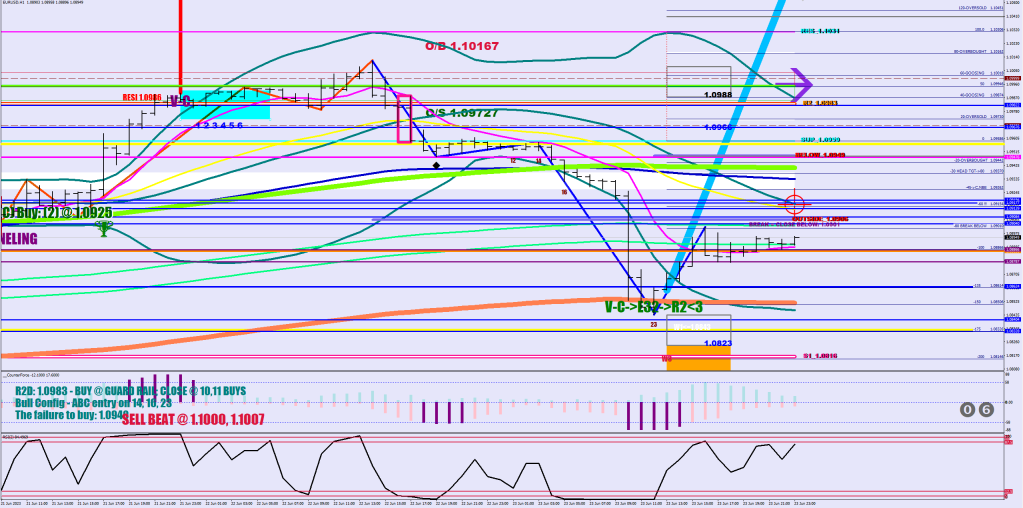
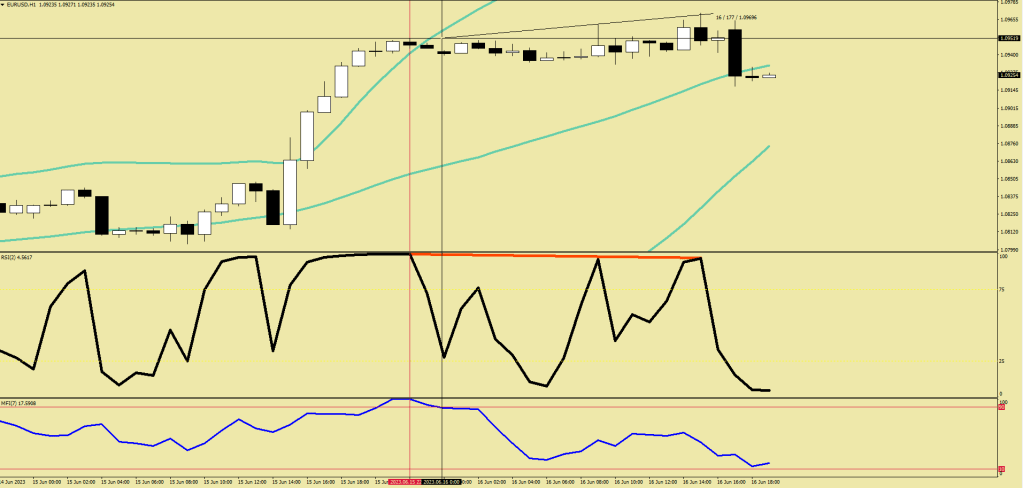
Let’s roll the Summer Doldrums!
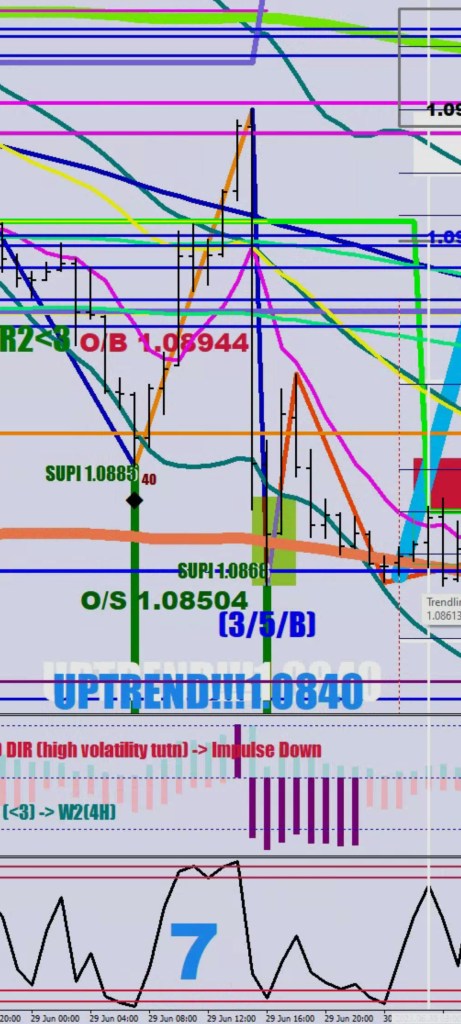
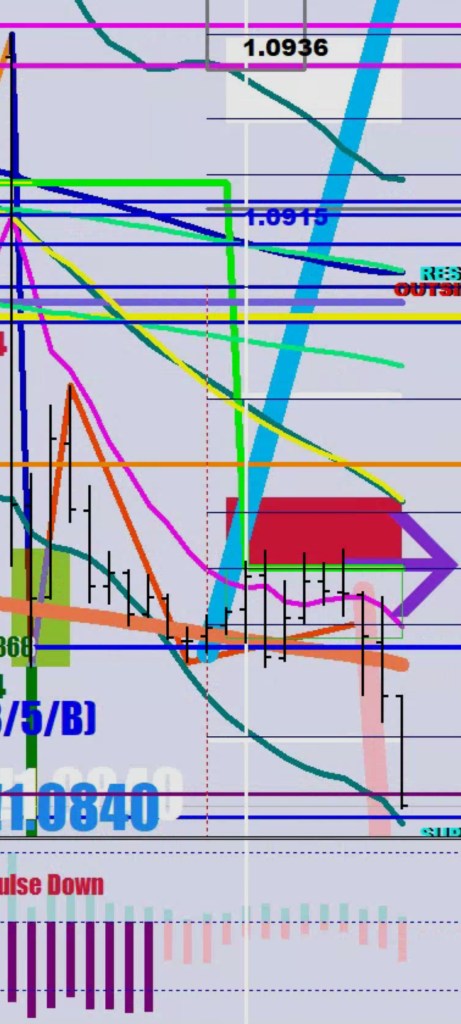
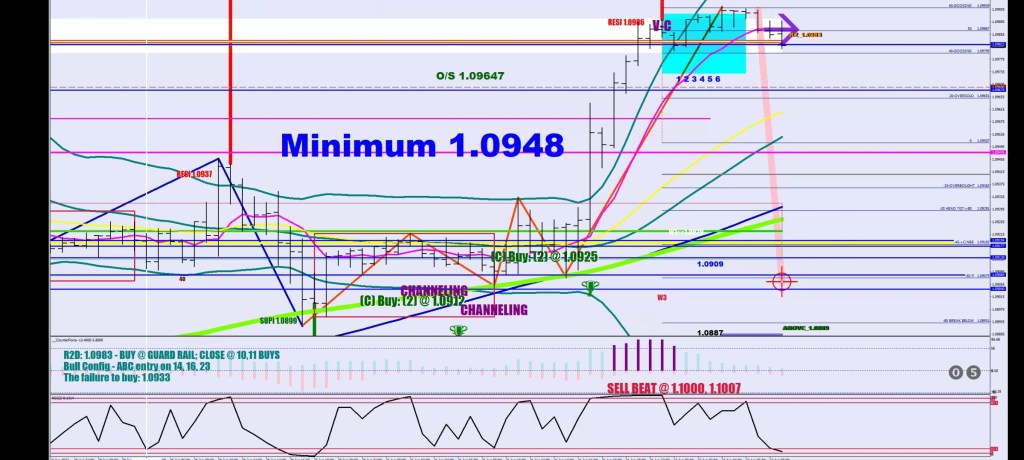
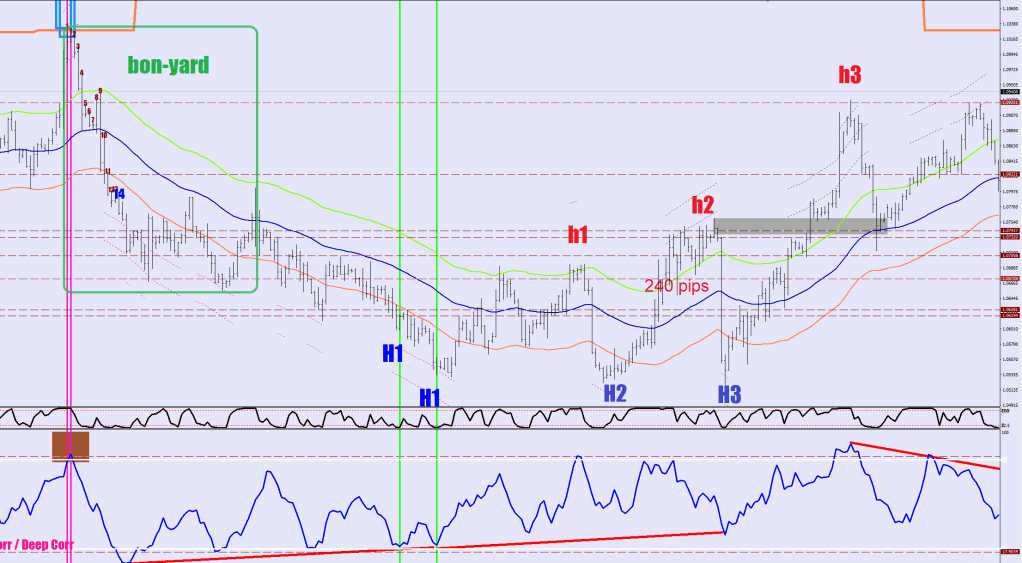
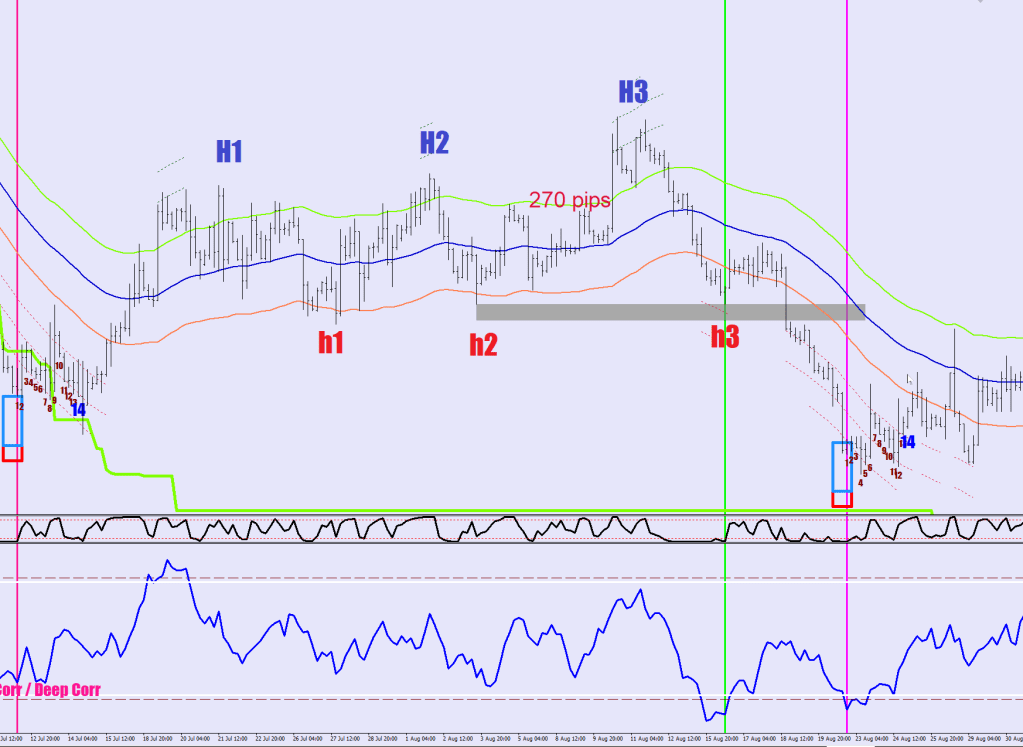
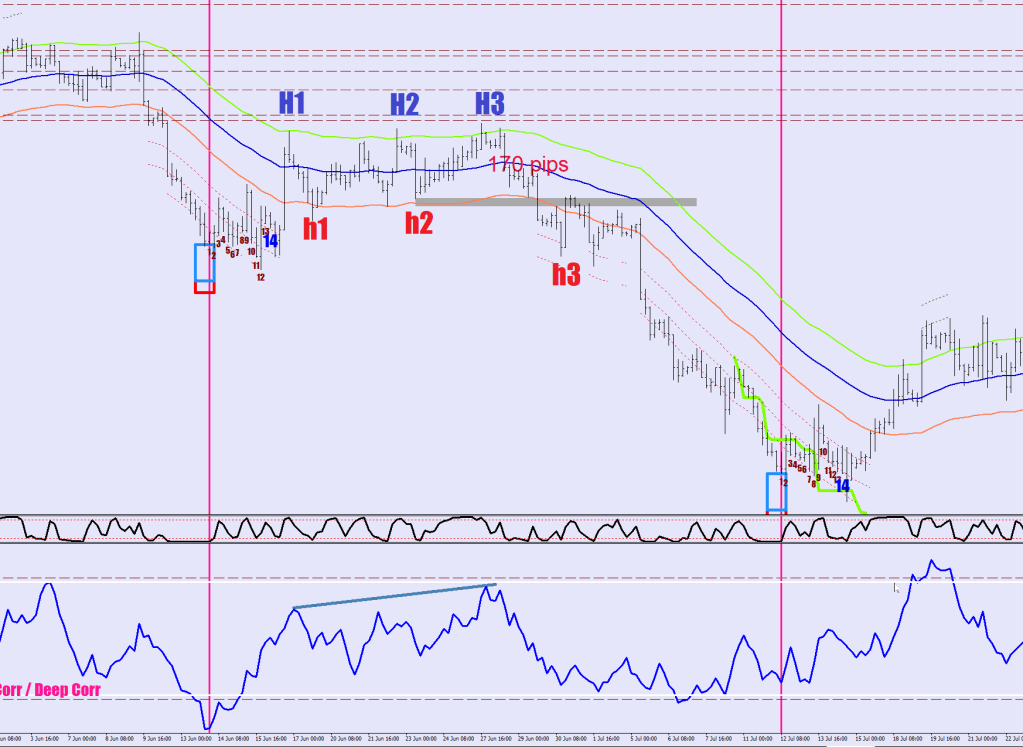
Concentrate on the tricolor flags.

They mark hourly closes where a sudden quest for liquidity is launched from.
The idea is to get hedged for these moves – automatically, and take off the hedges after 6 hours.
if (i>0 && RSI2[i+1]<10 && Close[i]>iBands(symbol,0,30,2,0,PRICE_MEDIAN,MODE_LOWER,i) && Close[i]<iBands(symbol,0,30,2,0,PRICE_MEDIAN,MODE_LOWER,i)+120*Point && Low[i+1]<iBands(symbol,0,30,2,0,PRICE_MEDIAN,MODE_LOWER,i+1) && Close[i]>Open[i] && Close[i+1]<Open[i+1]){The condition above, the hedger below. Spent minimum time, hijacked another hedger and changed the hedge conditions. Surplus lines, yes, but they won’t make it any slower.
#include <stdlib.mqh>
extern int magic_number1 = 51;
extern int magic_number2 = 52;
extern int magic_number3 = 53;
extern int magic_number4 = 54;
extern int highRSI = 100;
extern int lowRSI = 0;
extern double Ratio = .6;
extern double MarginCallPercentage = 100;
extern bool rope_trade_allowed = true;
extern double FSize=32;
#property copyright "by Macdulio in 2023"
#property link "https://forexfore.blog"
#property description "SUMMER DOLDRUMS HEDGER"
int profits;
double RSI2[];
double nakedshorts[];
double nakedlongs[];
double open_price1;
double stop_loss_price1;
double take_profit_price1;
double open_price2;
double stop_loss_price2;
double take_profit_price2;
double open_price3;
double stop_loss_price3;
double take_profit_price3;
double open_price4;
double stop_loss_price4;
double take_profit_price4;
double OrderOpenPrice;
double OrderProfit;
string symbol = Symbol();
int init() {
return(0);
}
int deinit() {
return(0);
}
int start() {
ArrayResize(RSI2, 600);
ArrayInitialize(RSI2, 0);
int i, counter;
int counted_bars=IndicatorCounted();
int longcount, shortcount;
double nlongs;
double nshorts;
double longaveragebuffer;
double shortaveragebuffer;
int order_type;
double dt14 = iHigh(NULL,240,iHighest(NULL, 240, MODE_HIGH, 1590));
double db14 = iLow(NULL,240,iLowest(NULL, 240, MODE_LOW, 1590));
double median = (db14+dt14)/2;
for(i=100; i>=0; i--)
RSI2[i]=iRSI(symbol,0,2,PRICE_MEDIAN,i);
//Print("High RSI: "+highRSI);
//Print(RSI2[0]);
profits = 0;
int hstTotal=OrdersHistoryTotal();
counter = 0;
for(i=OrdersTotal()-1; i>=0 ; i--)
{
if(OrderSelect(i,SELECT_BY_POS,MODE_TRADES)==false)
{
Print("Access to orders list failed with error (",GetLastError(),")");
break;
}
if (OrderType() == OP_BUY)
{
nlongs = nlongs+OrderLots();
longcount = longcount+1;
longaveragebuffer = longaveragebuffer+(OrderOpenPrice()*OrderLots());
}
if (OrderType() == OP_SELL )
{
nshorts = nshorts+OrderLots();
shortcount = shortcount+1;
shortaveragebuffer = shortaveragebuffer+(OrderOpenPrice()*OrderLots());
}
// }
}
// Full Hedge for shorts
if (nlongs<nshorts &&
RSI2[2]<10 && iClose(symbol,60,1)>iBands(symbol,60,30,2,0,PRICE_MEDIAN,MODE_LOWER,1) && iClose(symbol,60,1)<iBands(symbol,0,30,2,0,PRICE_MEDIAN,MODE_LOWER,1)+120*Point && iLow(symbol,60,2)<iBands(symbol,60,30,2,0,PRICE_MEDIAN,MODE_LOWER,2) && iClose(symbol,60,1)>iOpen(symbol,60,1) && iClose(symbol,60,2)< iOpen(symbol,60,2)){
open_price2 = NormalizeDouble(Ask, Digits);
stop_loss_price2 = NormalizeDouble(0.0,Digits);
take_profit_price2 = NormalizeDouble(0.0,Digits);
for (i = OrdersTotal() - 1; i >= 0; i--)
if (OrderSelect(i, SELECT_BY_POS))
if (OrderMagicNumber() == magic_number2) {
order_type = OrderType();
if (order_type == ORDER_TYPE_BUY) {
if ((NormalizeDouble(OrderOpenPrice(), Digits) != open_price2) || (NormalizeDouble(OrderStopLoss(), Digits) != stop_loss_price2) || (NormalizeDouble(OrderTakeProfit(), Digits) != take_profit_price2)) {
if (!OrderModify(OrderTicket(), open_price2, stop_loss_price2, take_profit_price2, OrderExpiration()))
Print("Error: ", ErrorDescription(_LastError));
}
break;
}
else if (order_type == ORDER_TYPE_BUY)
break;
}
if (i < 0)
if (OrderSend(symbol, OP_BUY, NormalizeDouble(nshorts-nlongs,2), open_price2, 3, stop_loss_price2, take_profit_price2, magic_number2+" SUMMER DOLDRUMS HEDGER BUY 0/0", magic_number2) < 0)
Print("Error: ", ErrorDescription(_LastError));
}
////////////Sell Hedge
// Full Hedge For Longs
if (nlongs>nshorts &&
RSI2[2]>90 && iClose(symbol,60,1)<iBands(symbol,60,30,2,0,PRICE_MEDIAN,MODE_UPPER,1) && iClose(symbol,60,1)>iBands(symbol,0,30,2,0,PRICE_MEDIAN,MODE_UPPER,1)-120*Point && iHigh(symbol,60,2)>iBands(symbol,60,30,2,0,PRICE_MEDIAN,MODE_UPPER,2) && iClose(symbol,60,1)<iOpen(symbol,60,1) && iClose(symbol,60,2)>iOpen(symbol,60,2)){
open_price4 = NormalizeDouble(Bid, Digits);
stop_loss_price4 = NormalizeDouble(0.0,Digits);
take_profit_price4 = NormalizeDouble(0.0,Digits);
for (i = OrdersTotal() - 1; i >= 0; i--)
if (OrderSelect(i, SELECT_BY_POS))
if (OrderMagicNumber() == magic_number4) {
order_type = OrderType();
if (order_type == ORDER_TYPE_SELL) {
if ((NormalizeDouble(OrderOpenPrice(), Digits) != open_price4) || (NormalizeDouble(OrderStopLoss(), Digits) != stop_loss_price4) || (NormalizeDouble(OrderTakeProfit(), Digits) != take_profit_price4)) {
if (!OrderModify(OrderTicket(), open_price4, stop_loss_price4, take_profit_price4, OrderExpiration()))
Print("Error: ", ErrorDescription(_LastError));
}
break;
}
else if (order_type == ORDER_TYPE_SELL)
break;
}
if (i < 0)
if (OrderSend(symbol, OP_SELL, NormalizeDouble(nlongs-nshorts,2), open_price4, 3, stop_loss_price4, take_profit_price4, magic_number4+" SUMMER DOLDRUMS HEDGER SELL 0/0", magic_number4) < 0)
Print("Error: ", ErrorDescription(_LastError));
}
return(0);
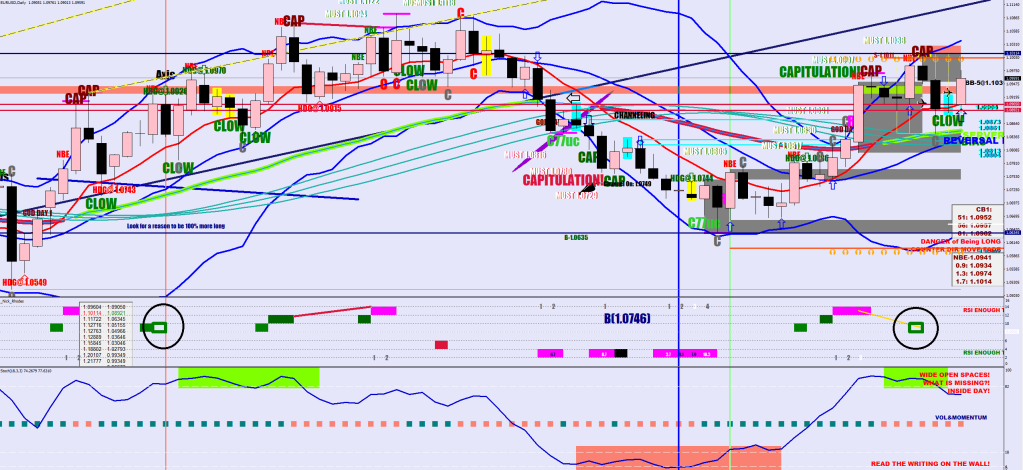
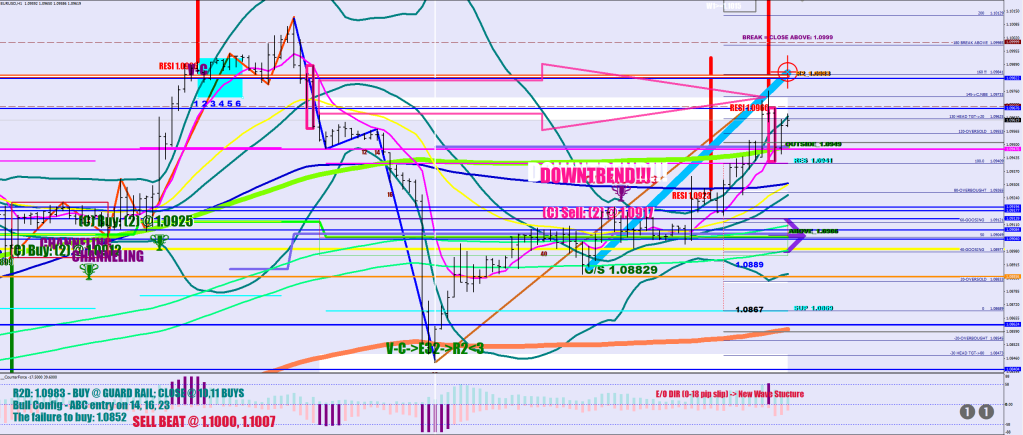
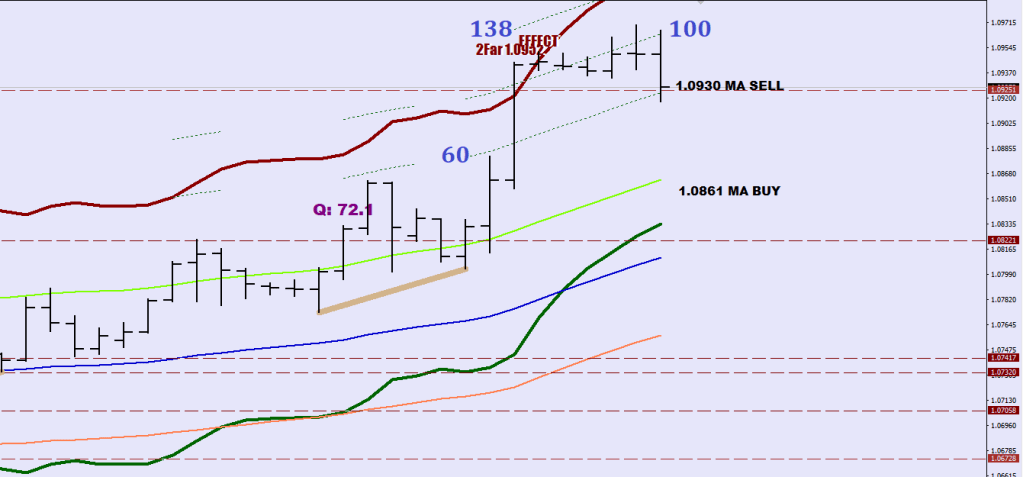
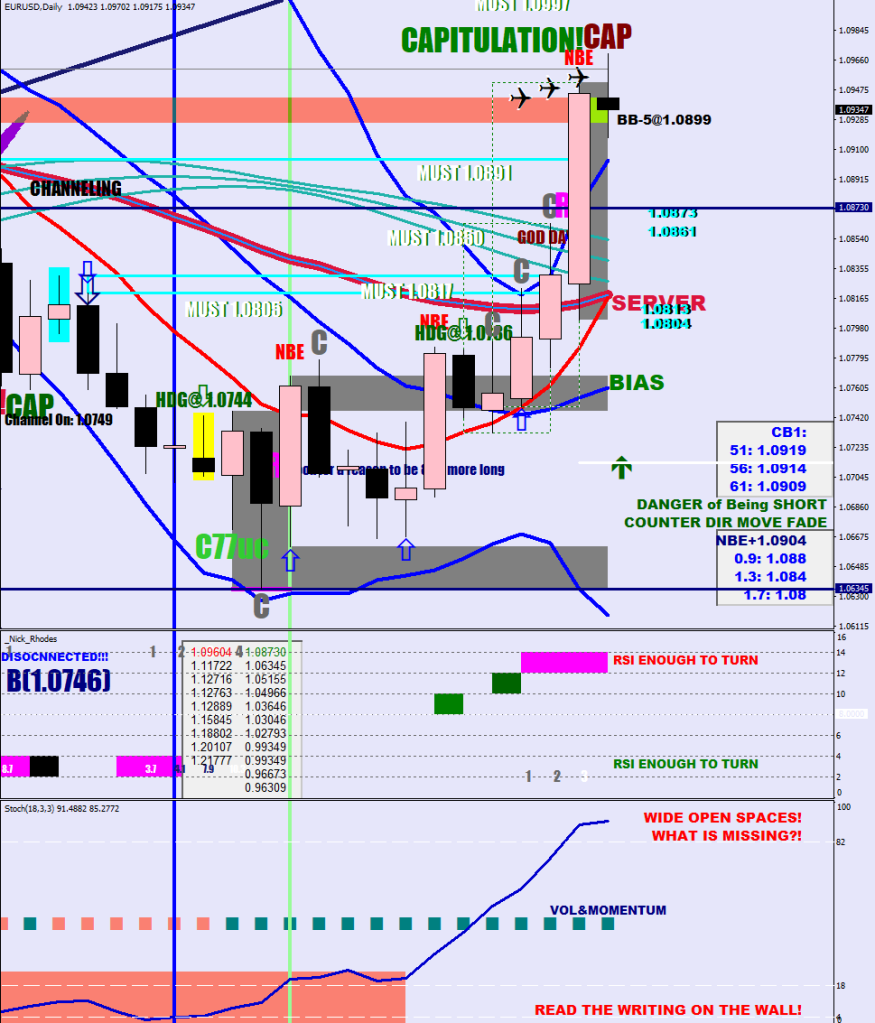
}May have its use in an uptrend too.