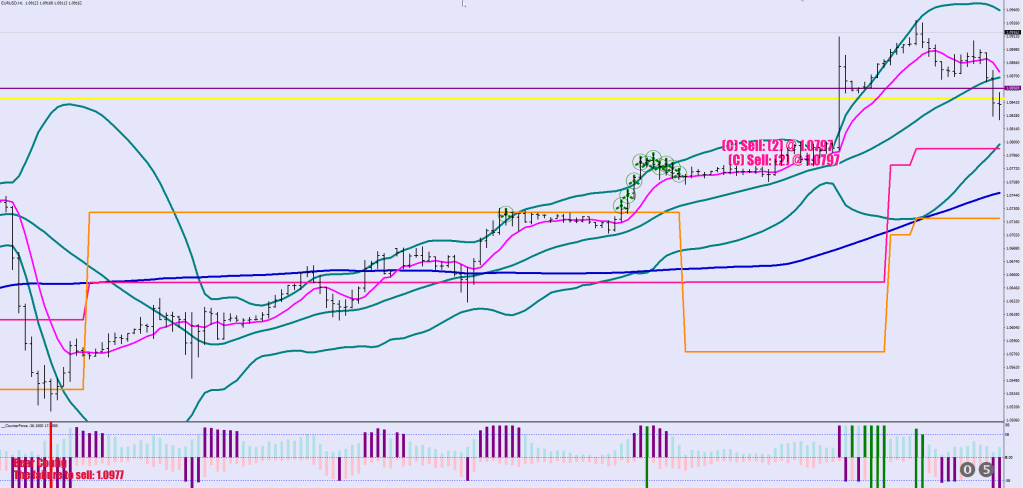
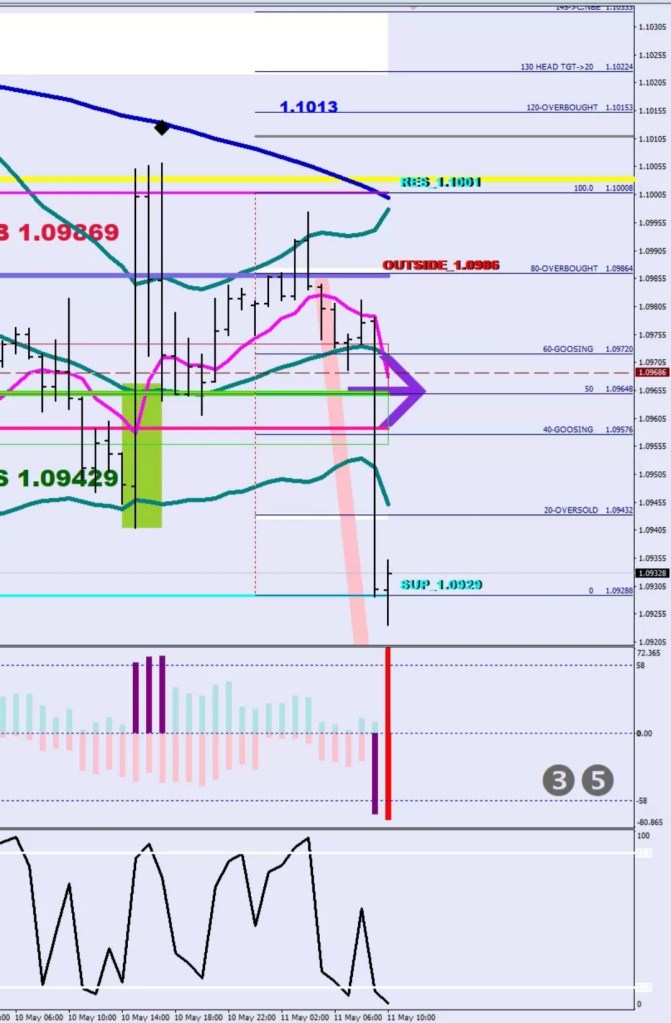
L 3 I

The 3 ingredients for trading are:

Wave Structure, Time and Scaling (in & out).

Of these 3 the second one that has been the hardest for me to figure out.

Noone has anything on the subject. What is up with the 5-hour metric? How is support and resistance made? Not by volume.

Emini-watch is looking in the right place, but takes neasuring time overtly complicated with his sine wave triplets.

I’ll just leave the subject hanging for now, and talk about the Black Natural and the Black in the Magenta Nick Rhodes prints.

The downside natural is the following:

///downside 
////black natural
   if ((Low[i]<Low[i+1] && RSI2[i]>RSI2[i+1] && (RSI2[i+1]<2 || RSI2[i+2]<2 )) || (RSI2[i+1]<2 && RSI2[i]>2 && RSI2[i+6]<2)){
         score[i]=-4; 

…and has no relevance currently.

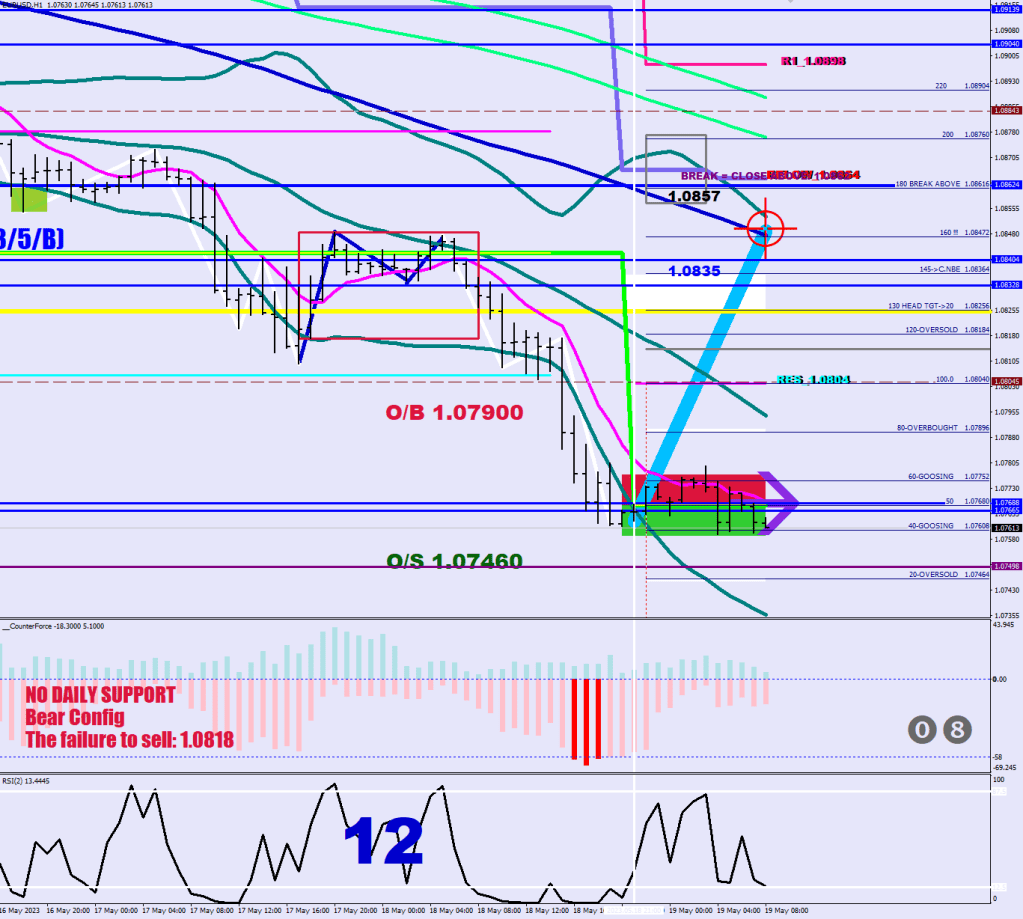
(B: 1.0746) in blue
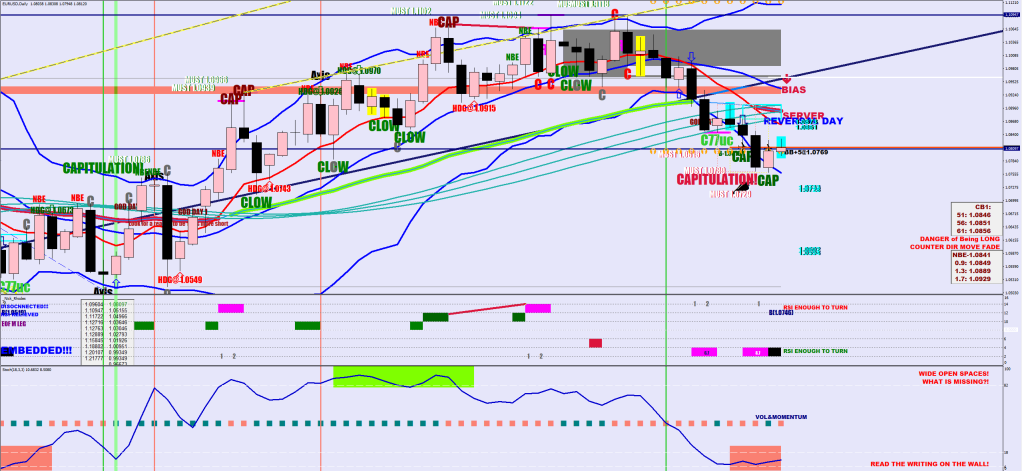
The Black in the Magenta is the following:

if ((Low[i]<Low[i+1] && RSI2[i]>RSI2[i+1] && ((RSI2[i+1]<4 && RSI2[i+1]>2) || (RSI2[i+2]<5 && RSI2[i+2]>2))) || (RSI2[i+1]<5 && RSI2[i]>5 && RSI2[i+6]<5)){
         score[i]=-3; 

Translation: RSI2 is rising and the previous RSI2 was a magenta print or the one before that was a non-magenta print or the RSI 2 has been waving up and down at the bottom line of 5.

Can this call a bottom? It certainly has before.

The 1.05 low was tested 3 times and the 8th and the 14th days made an attempt on this “black” low and managed a fake out to an extent of 13 and 14 pips.
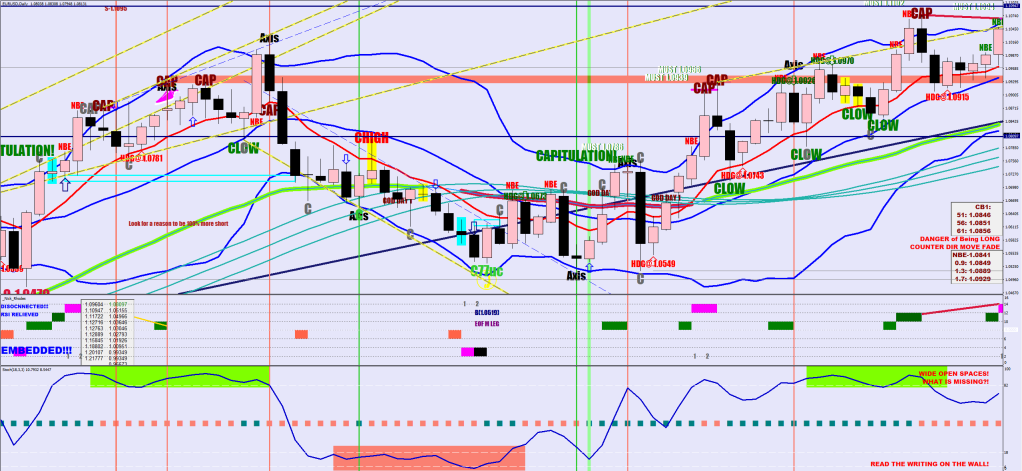
There was a (B: 1.0519) associated. The actual low was 1.05155 12 days later.

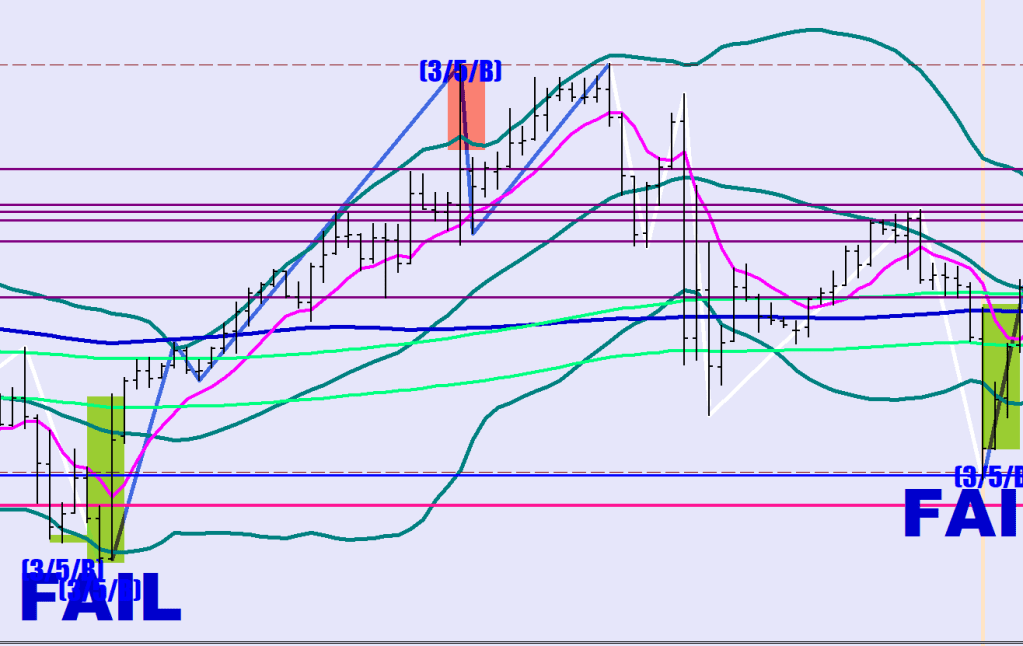
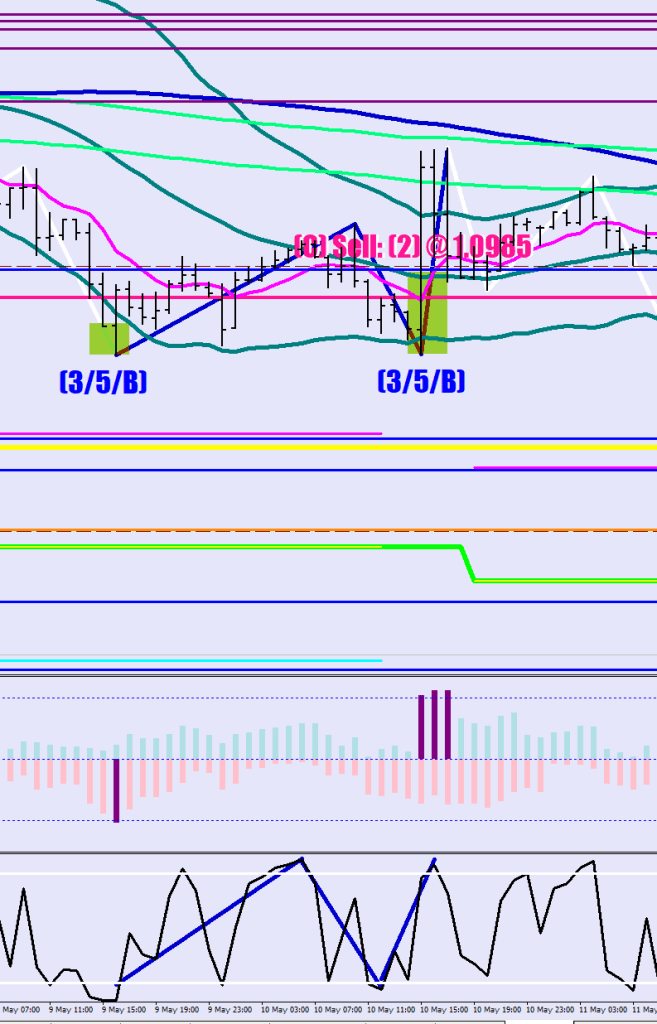
It actually seems more reliable on the downside than the Natural Black, of which there are 3 examples below:

Either way, the theme is that the 19-sample Bollinger high would be hit before the low next, but that’s not to say that the lower one would not be challenged at all, just that price would end up falling short from it. Also, hitting the upper band would take at least 10, at most 19 days.

It is also unusual to see two pro volume candles so close to each other.

New companion logo

Zero Sum Pain

How do you know that you are alive if you’ve never been dead?

New definions for a better work environment.

1 Hour Chart.

An end of an ABC correction is the best entry for a continuation move.

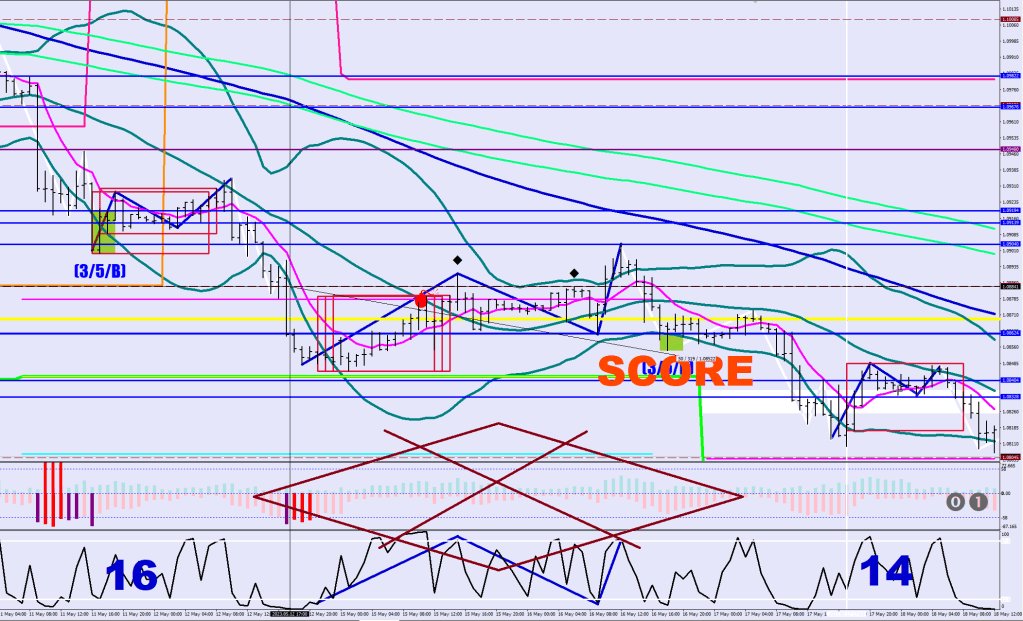
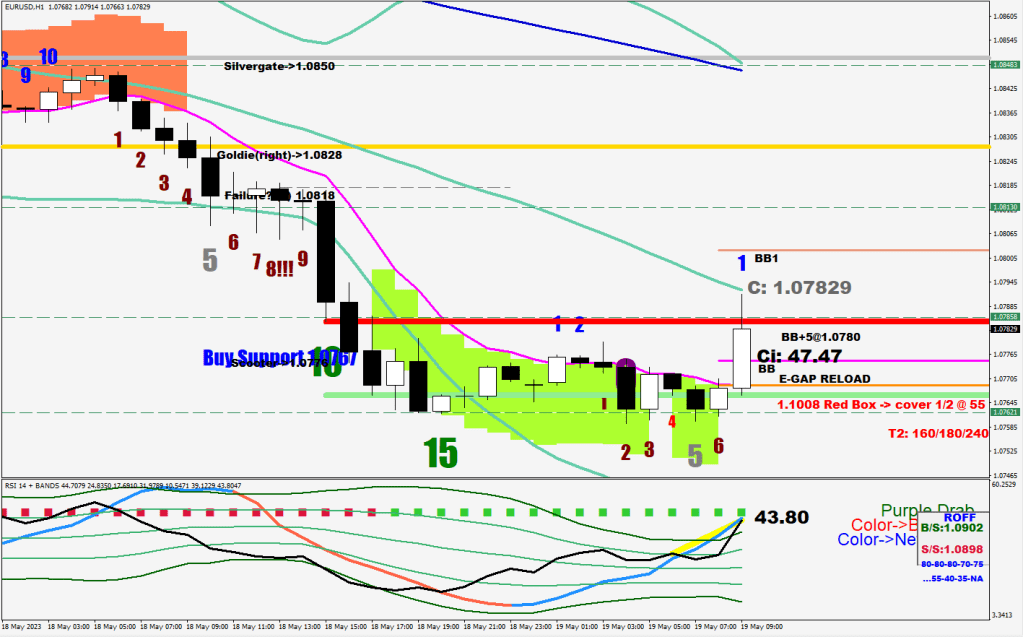
The Loneliness should be measured from an Oversold (<20) / Overbought (>80) RSI2 HL2 reading. It may make a lower low / lower high as part of a giration, but the important parts are: not reaching beyond the BB30 on the other side even at the end of the C print and a challenge of the swing level made by Wave A within 14 hours. You should scale in after the 14th hour and add on the 16th. A Loneliness ABC may only make it beyond the S30 by the end of the C wave and has little counter directional volatility (meaning the B leg is not going to register in the deep field).

Since the B leg did not go deeply oversold, the 14th and 16th hours are of importance. I stamp this kind of a correction with numbers.
A Disregard ABC is not about the number of hours, but i.e. about the B wave going deeply oversold (<12.5) and the C going deeply overbought (>87.5). The C is likely going to get outside the BB30, but it does not have to. Important pieces of this one is starting from deeply oversold / deeply overbought condition and the counter directional leg is attest of the increased volatiliy. There are running flat and explanding flat variations of this one. It should also be said that the next 5-wave structure would not be able to take out the starting point (A) within the first leg.

After a Lonleliness ABC you are likely to get a Disregard one and vice versa.

A Score is getting from one side of the BB to the other within 7 hours.

A Break (in this environment) means a swing high / swing low made over the other half of the BB main line within 7 hours and breaking it within 11.

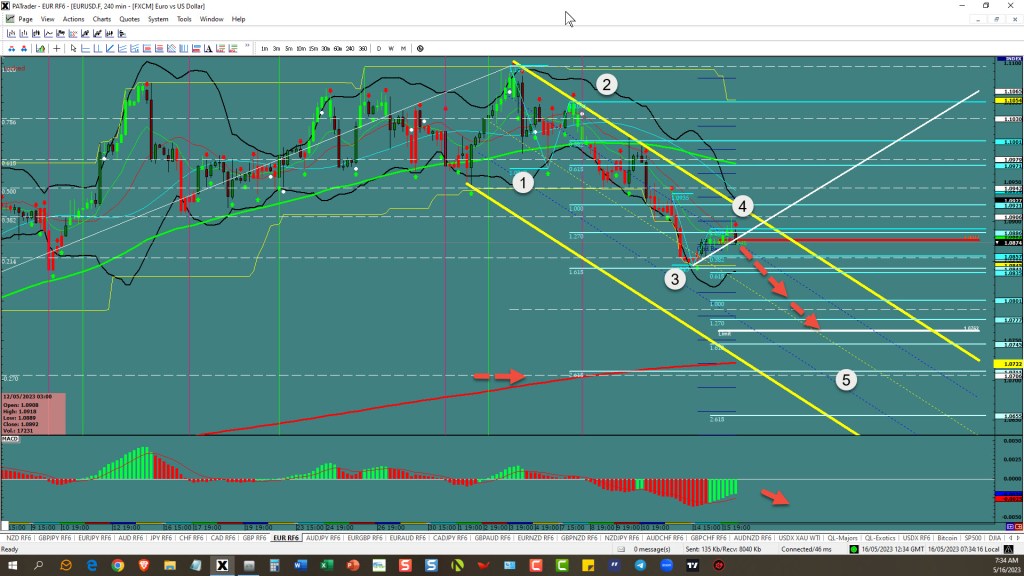
The current structure did not start from a deeply oversold condition, and after the new low there was a break up. I would think that there should be a 5th wave up before an ABC prints down. There seems to be a continuation divergence between Wave 2 and Wave 4.

Other. After clearing the daily S2 level, there was a 50-hour signal Blockout.

This is how the 3rd set of Red bars was actually the 2nd set.

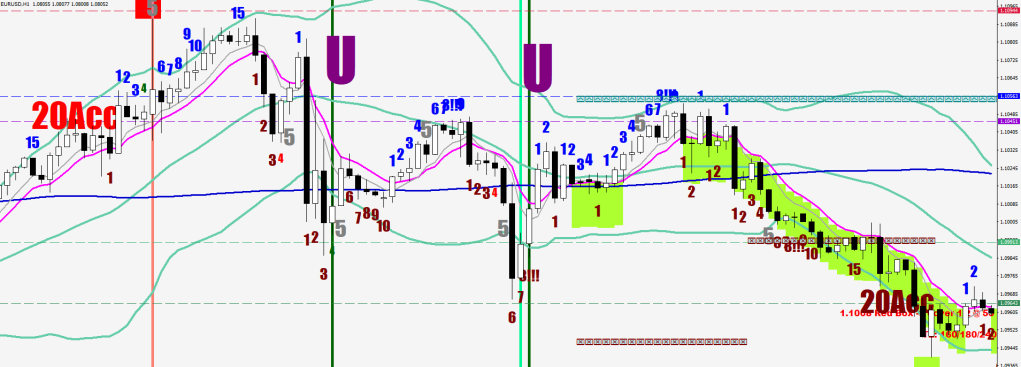
I now call 20+ hours of buying / selling occuring in an uninterrupted manner on one side of the 8 EMO an Acceleration. It will always come with a follow through (at least one 15-hours block). There has to be a surprise cockfags Break print preceeding.

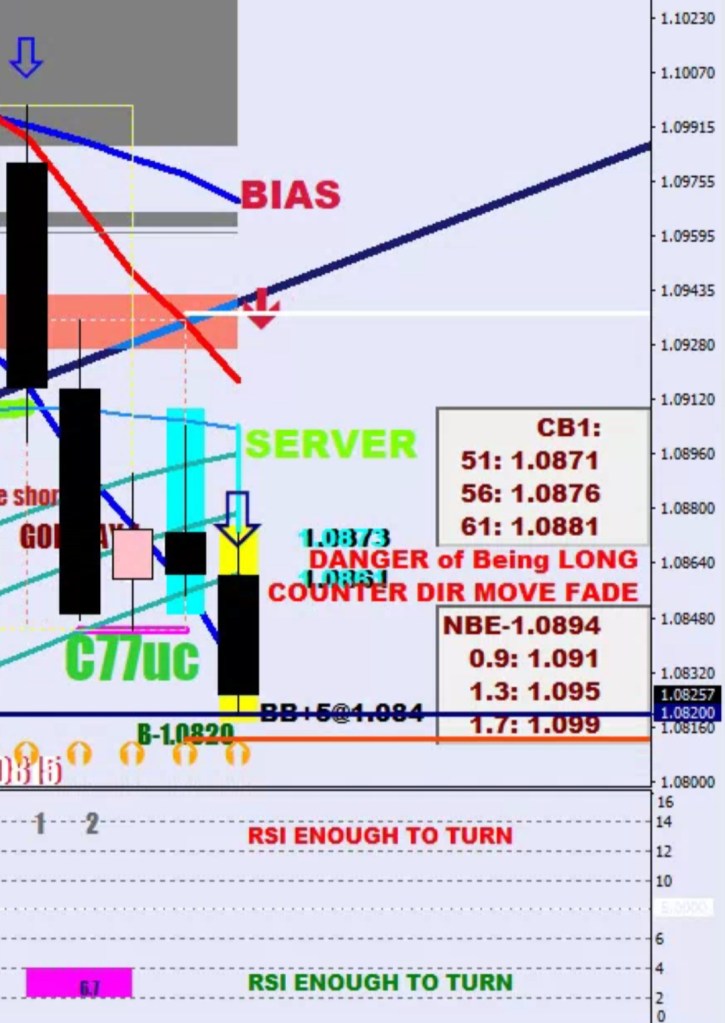
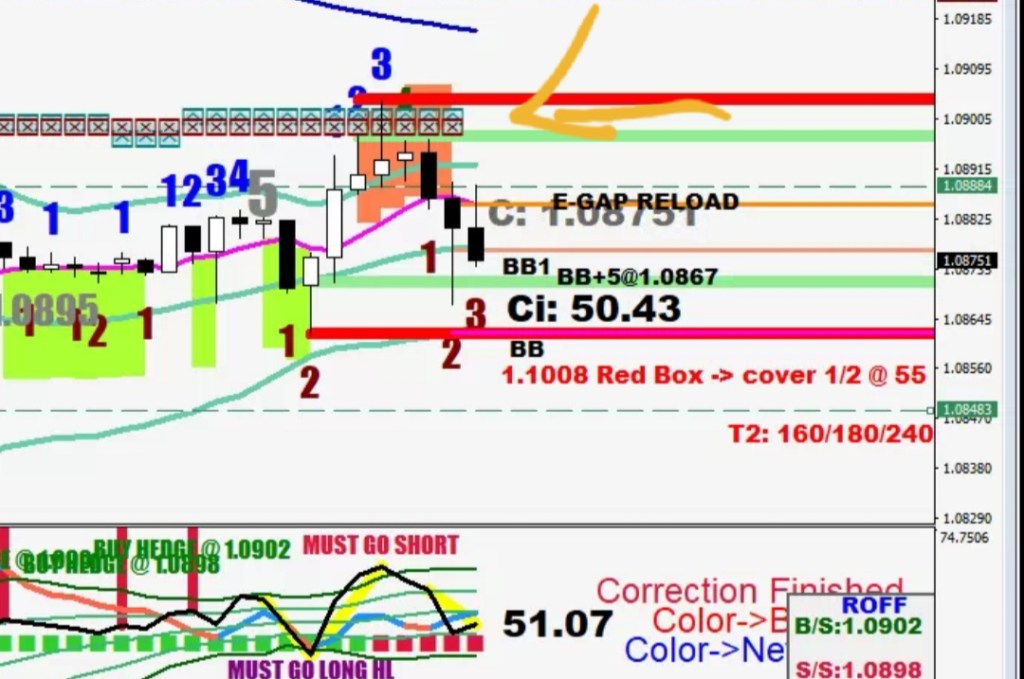
The danger is still the cyan candle, 1.0873+

Losing the embedding would mean a return to the 20 SMA. Otherwise the E9 +42 pips could be a good sell or the daily R1 at 1.0898.

Going Out With a Spank

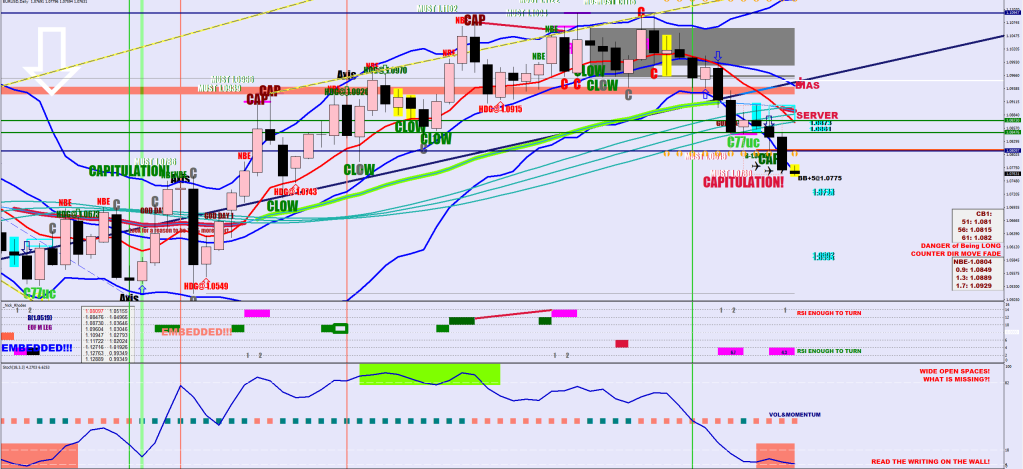
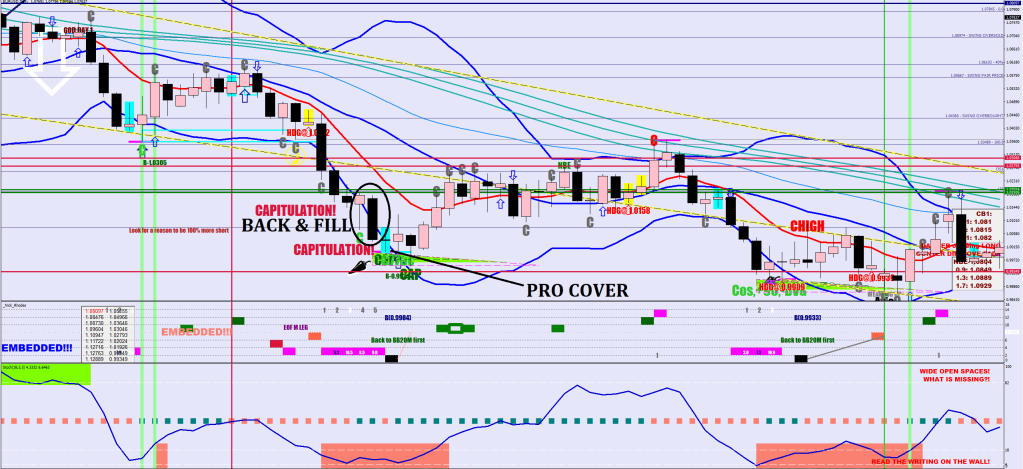
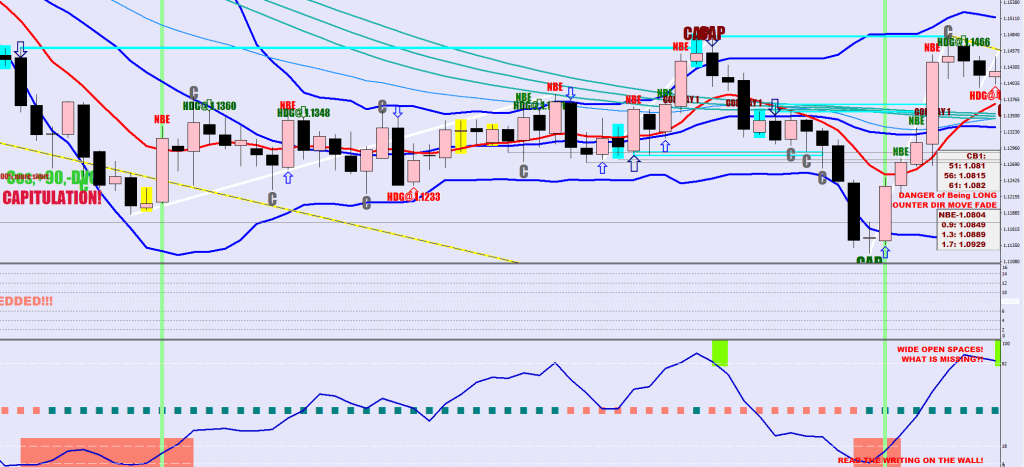
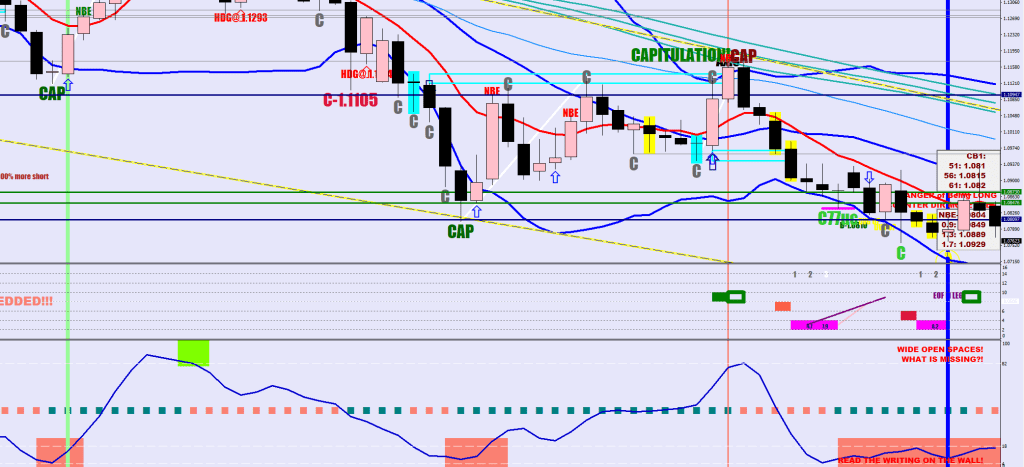
My definition of a capitulation currently is starting out with a non CAP print: a daily candle that closes outside the 19-sample bollinger and the 44 sample EMA (HL2), but does not settle back from its end more than 27 pips.

Close[i-1]<Open[i] && Close[i-1]<Low[i]+270*Point && Close[i-1]<iMA(symbol,0,44,0,MODE_EMA, PRICE_MEDIAN,i-1)-100*Point
        && Low[i]<iBands(symbol,0,19,2,0,PRICE_CLOSE,MODE_LOWER,i)

What is the point of this if you don’t know where the end of the capitulation would be?

The point is to bring attention to yesterday’s close that was aggressive enough that all the re-balancing got tapped into for a continuation. This could mean having to hedge if you are wrong footed.

What is most important is how the current day would play out. A small bodied doji would be a major exclamation mark. A good sized body would be a major win for the bears especially if they could again afford to sell more at the close.

So a Capitulation is a form of an end game, where the stakes are high.

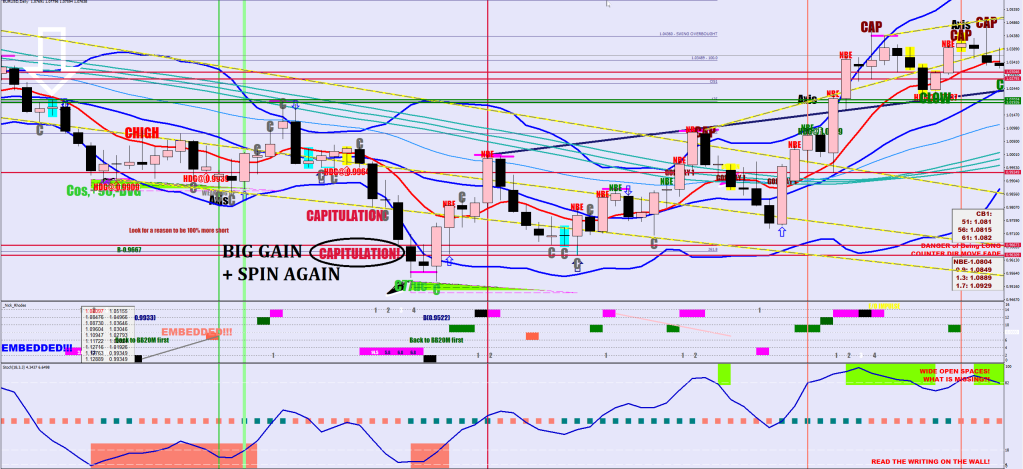
The next one had a Back & Fill for 2 days, then the Pros decided to cover (Cyan),

There is not a single outcome as you can see.

I ended up putting back a filter that at first looked like a double down on a condition, yet it eliminated a whole bunch of prints.

 && Close[i-1]-Low[i-1]<270*Point

Yes, that’s more like how I always intended it to be.

A fluctuation maximum extra would be my guidance for the reversal, up to 45 pips beyond yesterday’s low. If 50 pips gets exceeded, look for another 100 after that.

This was unusual to see the Green Cap to be broken like that, there may be a slight beat at times, but I have no example of pros doubling down and an overrun like that. At least not on the downside.

Slight beat below if you can call it even that.

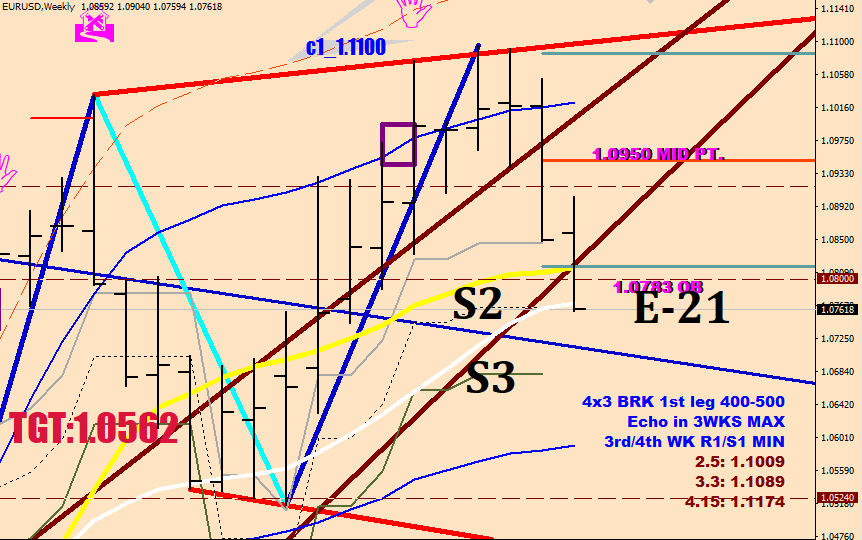
Price is sitting on the Weekly S2 as it is getting challenged the first time. The White line is the 21 EMA.

Daily R1 just got adjusted to 1.0898

The pink rabbi says shalom


The rest is just mood enhancer.

Abandoned faces, what are we pimping for?

So get Freddy, get Freddy!

Who wants to live together?

Penguin Park

Alternation of the ABCs. For one just hear me out.

The two signs that won’t be ignored.

After 5 Waves up, 5 Waves down. Equilibrium.

Then…

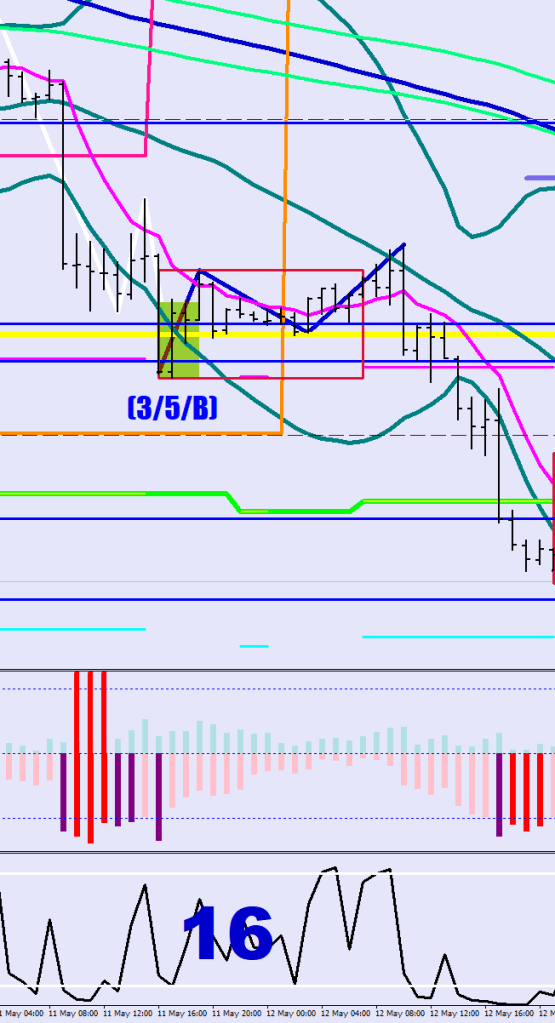
Little Bit Of Loneliness (16)

16 Hours of Solitary Confinement. Top Bollinger Band isn’t reached in 16 Hours. Time Out Failure.

Then…

Little Bit of Disregard

Se how the RSI2 goes into overbought (87.5) oversold (12.5) and overbought (87.5) plus the C wave gets outside the 30-Sample BB on top.

Then…

Little Bit Of Loneliness (16)

Little Bit of Disregard

Whose turn was it again?

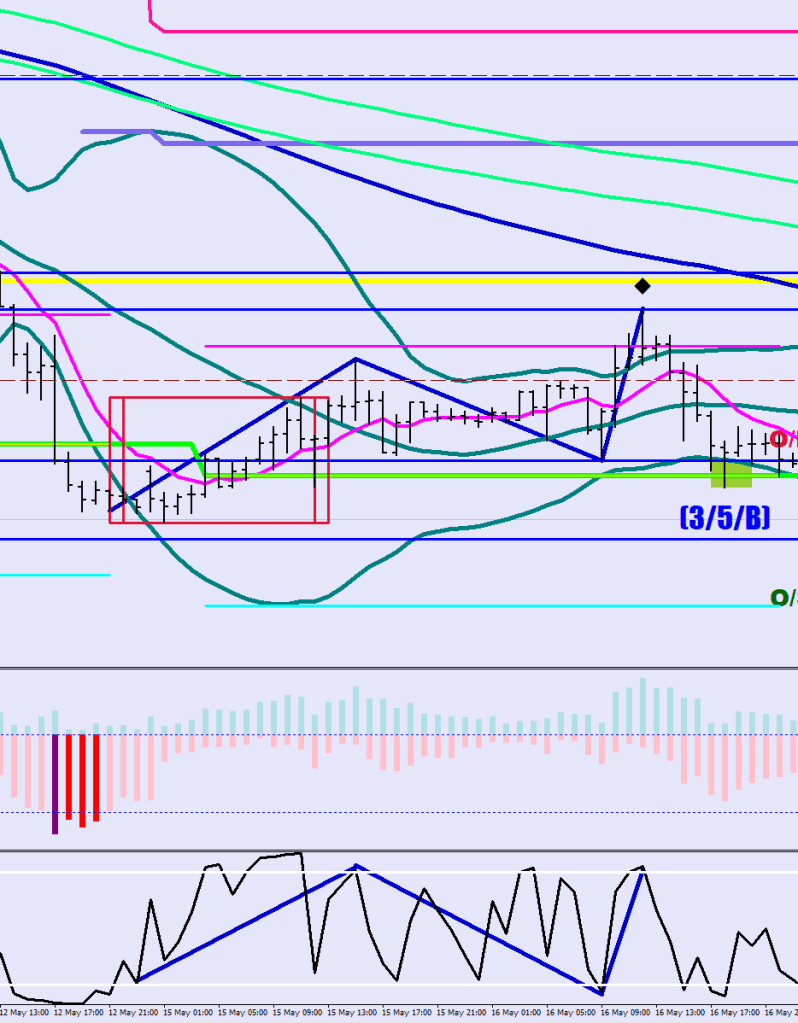
The Downtrend. The Downtrend is where the Volatility Breach Reversals (Green Boxes) get broken. The downtrend will end once a 5 wave move becomes possible: the first 6 hours of buying after a lower low would need to take price over the upper Bollinger Band.

What to expect once the high is in? 10 hours of selling below the 8 EMO, but a lower low at a very minimum.

Proctory Lap

The interptetation of this was 1 0818 + 6-8 pips most likely (1.0824-26) or a bit below

The reality was 1.08205

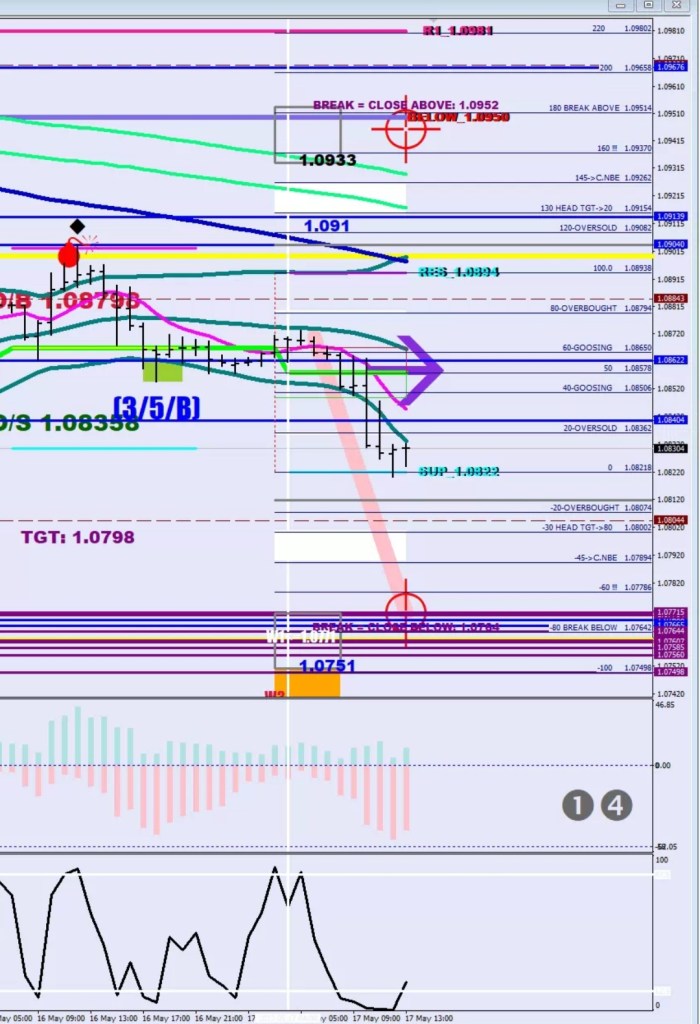
Now the question becomes, will this down move continue?

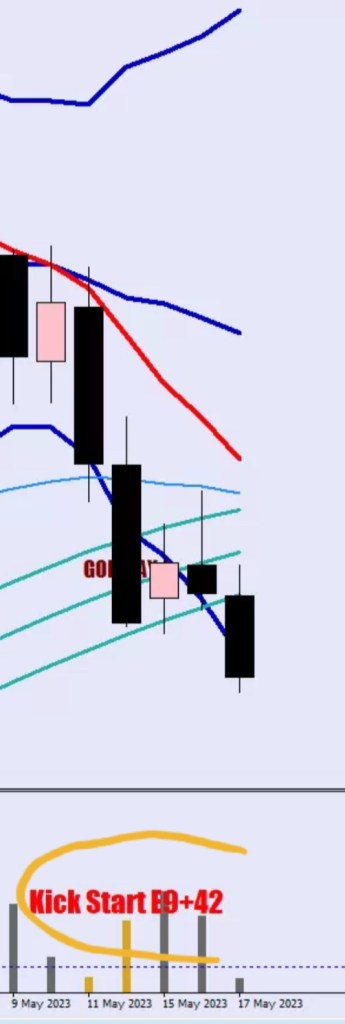
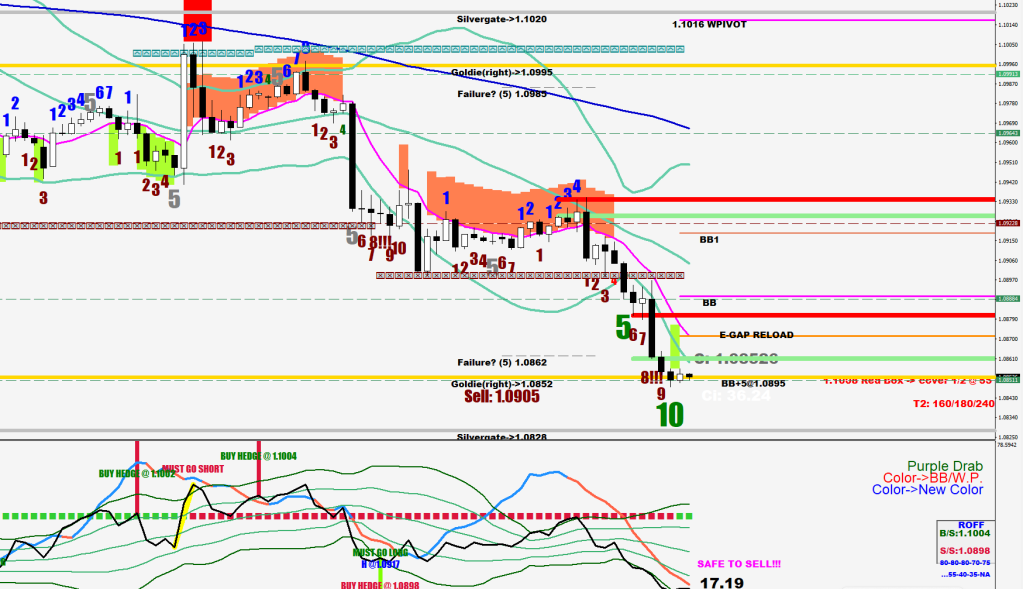
The pro volume print made yesterday is bothersome. Normally I would say, Kick Start E9+42 pips.

The wrench in the AI machine is the long wick on the cyan doji.

They could double down on 1.0873. If they don’t, currently 1.0950 is the 109.5 statistical resistance line, and 1.0981 aka R1 would remain a return candidate if no red print would occur on the CounterForce (not likely).

Intricacies Of A Pink Rabbit

You’ve got snails

Pink, as I said before is like a White, but it starts out with an already relatively high energy state, namely 45+ reading. This normally happens at the very end of a move, for all the hurdy jerkiness is happening to gain enough energy to be able to break out of a structure (this mostly means reversal.)

 if (ExtMapBuffer[i+1]>46) ObjectSet("FOCUS"+IntegerToString(i),OBJPROP_COLOR,clrPink);

If you look at the sequence of Measuring Leg, Postpartum Mobile and Ecce Hubris, you’ll find that the energy state draws ever higher values. M<P<E (<XX)

It is strongest before the dawn.

You have missed mummifications

It’s not radio science, it is but catching a bit of radio captivity.

Just wait until you can see the white of the pink rabbit’s eye.

Tige of the eyer. It’s never too late to pixellate.

So anyways, I decided to plot the middle of the squeeze boxes in blue just before this happened:

These lines are not hand drawn or after the fact. Try to appreciate the diffrence. I’ll spare you the zoom in.

  if (iHigh(symbol,0,iHighest(symbol,0,MODE_HIGH,15,i))-iLow(symbol,0,iLowest(symbol,0,MODE_LOW,15,i))<360*Point && iLow(symbol,0,i+15)<iBands(symbol,0,30,2,0,PRICE_MEDIAN,MODE_LOWER,i+15) &&  iLow(symbol,0,i+14)<iBands(symbol,0,30,2,0,PRICE_MEDIAN,MODE_LOWER,i+14) 
    && iLow(symbol,0,iLowest(symbol,0,MODE_LOW,3,i+11))>iBands(symbol,0,30,2,0,PRICE_MEDIAN,MODE_LOWER,i+11) 
   && iLow(symbol,0,iLowest(symbol,0,MODE_LOW,3,i+12))<iLow(symbol,0,iLowest(symbol,0,MODE_LOW,10,i))
   //
   
   ){
       ObjectCreate("Frier"+DoubleToStr(i), OBJ_RECTANGLE, 0, Time[i+15], iLow(symbol,0,iLowest(symbol,0,MODE_LOW,15,i)), Time[i], iHigh(symbol,0,iHighest(symbol,0,MODE_HIGH,15,i)));
         ObjectSetInteger(0,"Frier"+DoubleToStr(i),OBJPROP_COLOR,clrCrimson);
         ObjectSetInteger(0,"Frier"+DoubleToStr(i),OBJPROP_BACK,0);
         ObjectSetInteger(0,"Frier"+DoubleToStr(i),OBJPROP_WIDTH,3);
   
    ObjectCreate("Frieri"+DoubleToStr(i), OBJ_HLINE, 0, Time[i+15], (iLow(symbol,0,iLowest(symbol,0,MODE_LOW,15,i))+iHigh(symbol,0,iHighest(symbol,0,MODE_HIGH,15,i)))/2);
         ObjectSetInteger(0,"Frieri"+DoubleToStr(i),OBJPROP_COLOR,clrBlue);
         ObjectSetInteger(0,"Frieri"+DoubleToStr(i),OBJPROP_BACK,0);
         ObjectSetInteger(0,"Frieri"+DoubleToStr(i),OBJPROP_WIDTH,3);
   }

When someone draws a million lines and nothing specific

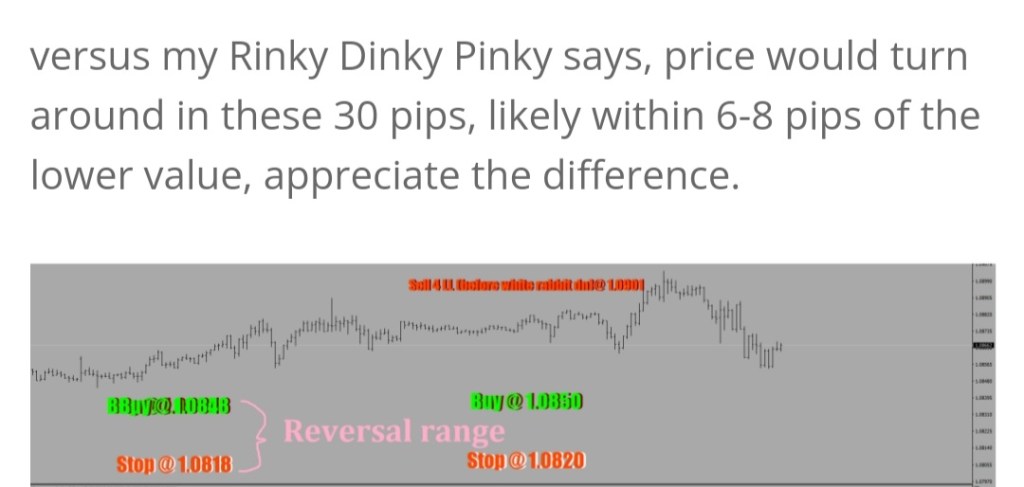
versus my Rinky Dinky Pinky says, price would turn around in these 30 pips, likely within 6-8 pips of the lower value, appreciate the difference.

Pinkerton Detective Agency

Ama living in a Brooks, ama living in a Gerhard Brooks.

Being Zilch Malchowich is all about wearing comfort socks. Try to get rich selling socks and chewing gum in the Philippines.

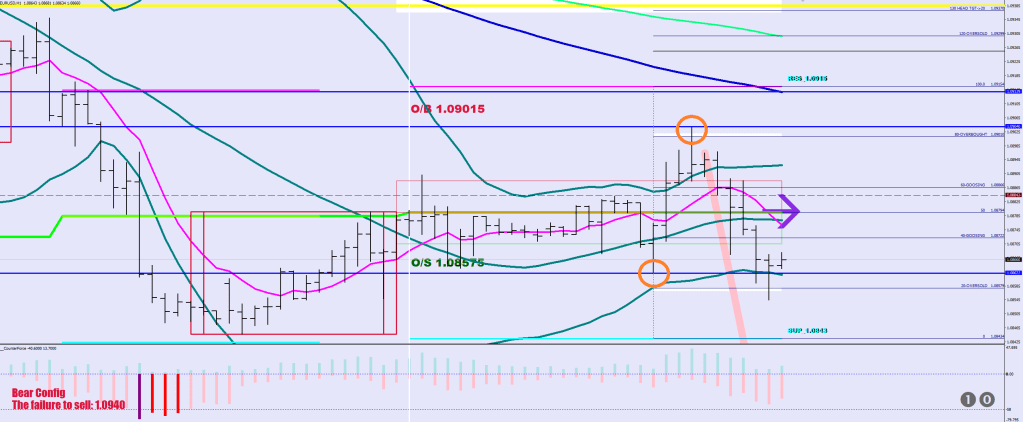
Image below showing double resistance above.

RSI14 HL2 was high enough to flip the direction with a 2 std dev breach.

You are in luck, as I decided not to talk about Pippoletto’s disregard for people listening to his show. He always seems to start the broadcast when the parner takes a turn for the shower, right after sex and this can clearly be heard in the background.

Mambo #6

We’re gonna do a song that you never heard before.

Rambo Italiano.

Sequential analysis

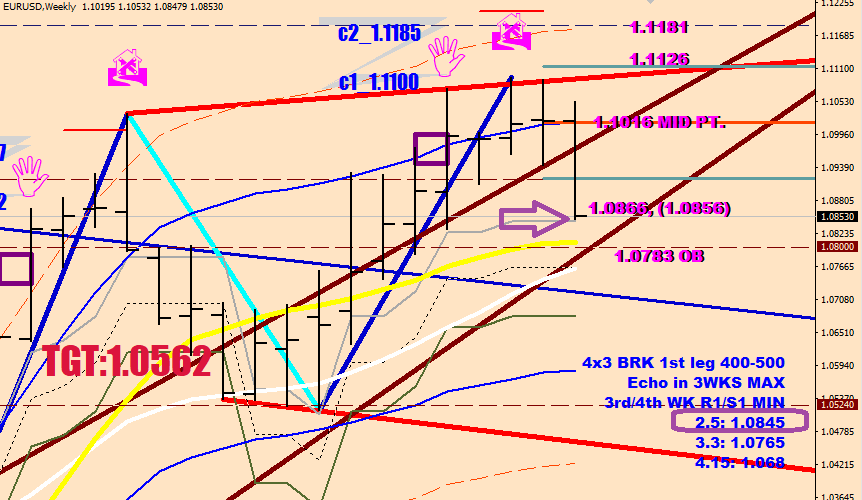
1st image: the importance of the S1 in this current uptrend.

Wave 2 and Wave 4 of A both had bounced off this very level. Even the B wave down ricosheted from it, after a re-alignment with an ABC move.

The downtrend was a lot more volatile. Seriously, the largest dip below the S1 so far was less than 4 pips!

I guess I killed the punchline. The sequential analysis can tell you with good odds if the price is in

  • a Push (hand) beyond the 14-sample Window envelope (Blue)
  • in an Echo (House icon) after a pullback to the purple square – or most likely time is up for this move (3 weeks beyond the push max.)
  • or performing a return (back from the House icon) to one of the 3 support / resistance lines (“HOME”) (or just arrived at one)

S1 is 250 pips from the last Echo print.

I believe this may have been the Wave 2 of Wave C, and yes, we are headed back up to 1.23

Let’s Rabbit guidance

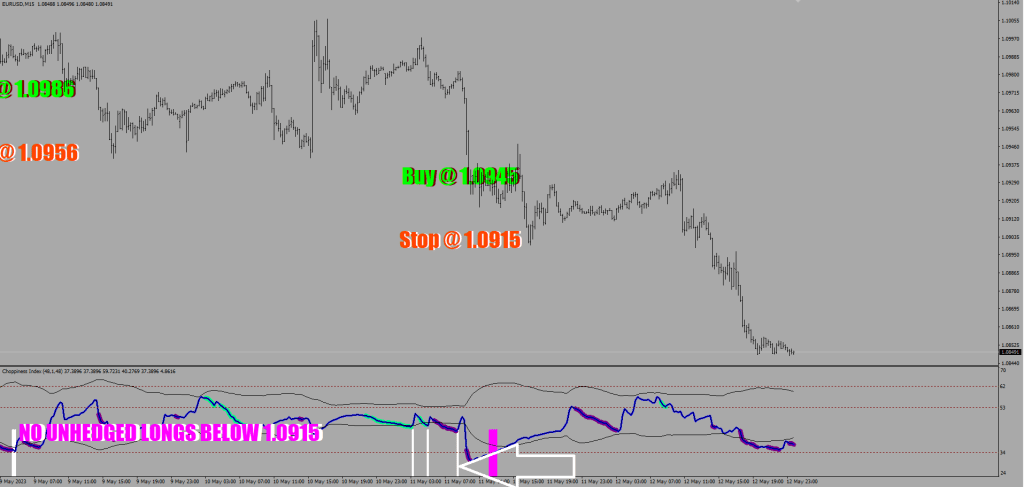
A rabbit is an energy surge measured by Choppiness.

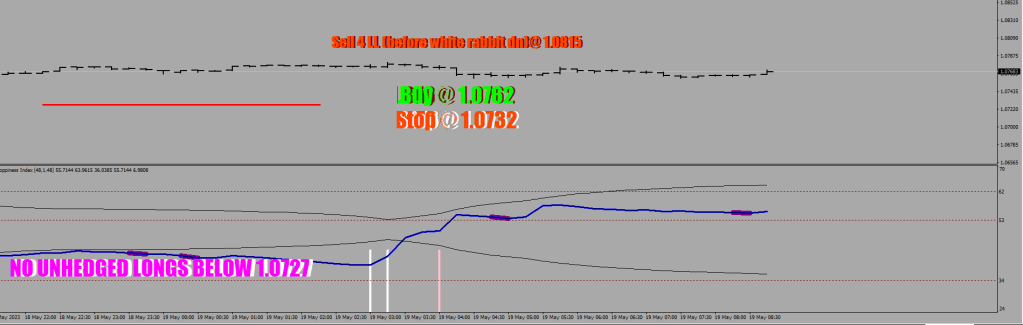
The White arrow shows the last White Rabbit. A Rabbit is a 30-pip range, where price may turn around. When the stop is surpassed, the Rabbit is broken. Hedging is a must.

The Magenta strip is a sign of deep exhaustion, it guarantees a lower low (or higher high based on the direction).

The Rabbit that broke its neck, broke the internet.

I’m the one to be the one, but my butthole is confused.

Somebody is posting strawberry eating rabbits on Twitter.

I wish I had a Rabbit in a Hat.

16 Tonneau

I don’t know & I don’t undestand.

16 hours of attaining no counter directional volatility expansion is a call for a continuation entry.

You can always find a level afterwards that was nearby at the time. This is why I told you that time was more important than any price level.

But what’s your edge from there on? Taking price oversold yet again (now within the new consolidation range)? Below the zero price becomes overbought again (need to change those labels).

imagine numbers above the candles in the box

Squeeze highight (16 sample range that is less than 1/2 fluctuation size in width)

if (iHigh(symbol,0,iHighest(symbol,0,MODE_HIGH,15,i))-iLow(symbol,0,iLowest(symbol,0,MODE_LOW,15,i))<360*Point && iLow(symbol,0,i+15)<iBands(symbol,0,30,2,0,PRICE_MEDIAN,MODE_LOWER,i+15) &&  iLow(symbol,0,i+14)<iBands(symbol,0,30,2,0,PRICE_MEDIAN,MODE_LOWER,i+14) 
    && iLow(symbol,0,iLowest(symbol,0,MODE_LOW,3,i+11))>iBands(symbol,0,30,2,0,PRICE_MEDIAN,MODE_LOWER,i+11) 
   && iLow(symbol,0,iLowest(symbol,0,MODE_LOW,3,i+12))<iLow(symbol,0,iLowest(symbol,0,MODE_LOW,10,i))
   //
   
   ){
       ObjectCreate("Frier"+DoubleToStr(i), OBJ_RECTANGLE, 0, Time[i+15], iLow(symbol,0,iLowest(symbol,0,MODE_LOW,15,i)), Time[i], iHigh(symbol,0,iHighest(symbol,0,MODE_HIGH,15,i)));
         ObjectSetInteger(0,"Frier"+DoubleToStr(i),OBJPROP_COLOR,clrCrimson);
         ObjectSetInteger(0,"Frier"+DoubleToStr(i),OBJPROP_BACK,0);
         ObjectSetInteger(0,"Frier"+DoubleToStr(i),OBJPROP_WIDTH,3);
   }

You have just turned 5 waves into 7 costing you 16 tons of hardware. Where do you want to go from here?

Made a support after 5 hours of selling, then broke it. Made another support after 10 hours of selling. That is the current range.

A lower low come Sunday is quite possible, but the “return home” Weekly S1 move could be considered complete.

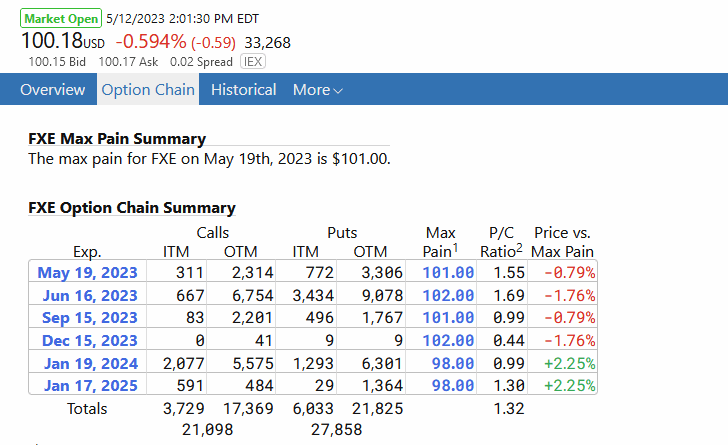
Apologies for saying that there would be an opex this Friday. The next one is on the 19th of May.

Dynamics (In Motion)

Things are changing rapidly currently.

I thought I would explain some of the dynamics a little more.

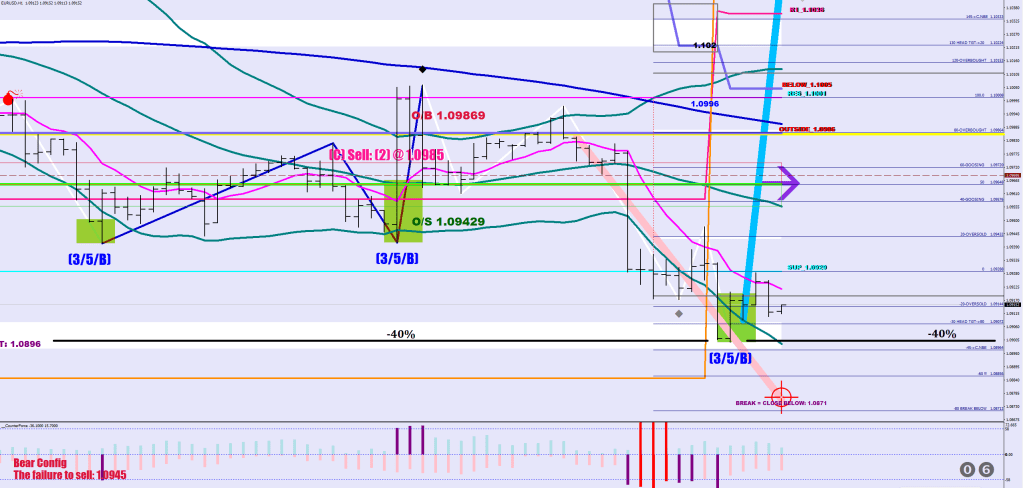
The first thing to understand better is the failure level, which is 40% outside the statistical range (pendulum) drawn around the condolidation weight. I drew in the black line for you. That line has been in place since the last CI cross over above 53.

 ObjectCreate("Pick", OBJ_RECTANGLE, 0, Time[i],taxi[0]+570*Point, Time[0],  taxi[0]+680*Point);
                      ObjectSetInteger(0,"Pick",OBJPROP_COLOR,clrWhite);
                      ObjectSet("Pick",OBJPROP_WIDTH,1);
                      ObjectSet("Pick",OBJPROP_BACK,1);

The white field is 57-68 pips away from the TAXI line, which is the consolidation mean, and as I mentioned before, the failure level is about 60 pips out. It is also about 10 pips shy of the Goldilocks level, which if it was hit would grant further rights for a no break extension move.

The second thing is the re-emergence of the red CounterForce signals. With a 6-hour delay this would eliminate the current S1 and S2 levels and use these lines from then on to represent R1 and R2.

If you follow the black arrow heads, you can see how the S1 line is yielding to the new born R1. S2 does the same for R2.

For the code, see the CounterRejoyce blog entry.

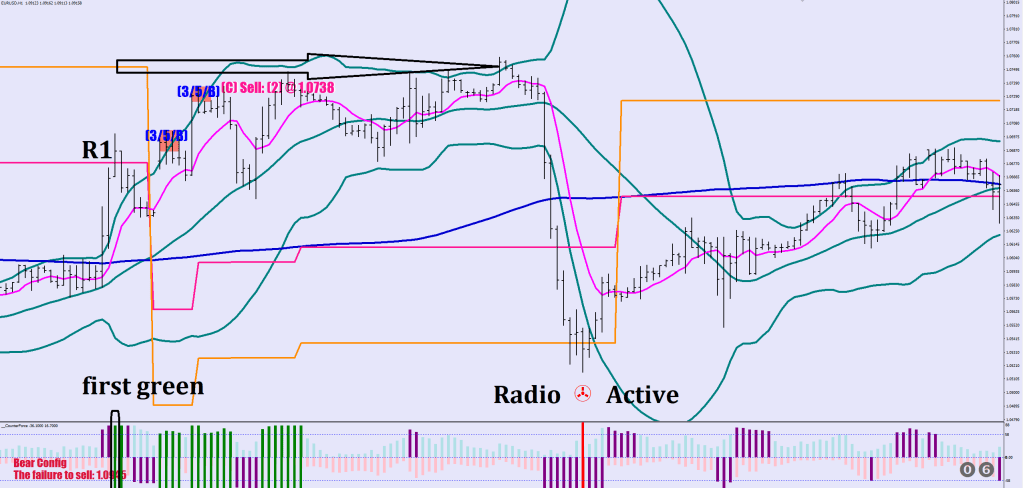
Now, let’s pull up an example of what preceeds a radioactive close.

For a radioactive close outside you would need the S2 to be re-applied, so counter-intuitively enough you would need Green Stretch Marks appear which would mean at least a 58+ pips stretch upwards. I highligthed the first green that coincided with a move above the R1. See how the S2 although was removed, price ended up coasting all the way to where it at was prior. It is also a possibility currently that price could make it to the where the S2 was, at 1.0885 – barring the Opex Futures expiration level to be adjusted by tomorrow. It now stands at 100.50 on FXE and that would mean price to settle at least 30 pips higher than where it is at at the monent (1.0916).

By the way, the radioactive print saw no continuation on the example above, as there was no close below the low of that candle. Multiple flips of resistance and support configs are also possible as you can see.

I have already talked about the stages of the start of a run including the signal blockout hours.

Autumn Leaves

I started posting in 2017. I had views of a single entry reaching 200+. Hitting new lows again, yesterday’s post had 2 views so far. Time out & some stuff to indulge with if you like to use your imagination and perhaps solve some things along the way.


Autumn leaves, but does it, really? You are about to decide between working for The Toothpaste Management or the National Whale Services for the remainder of your time. As one big human falafel, writing is no longer of your concern.

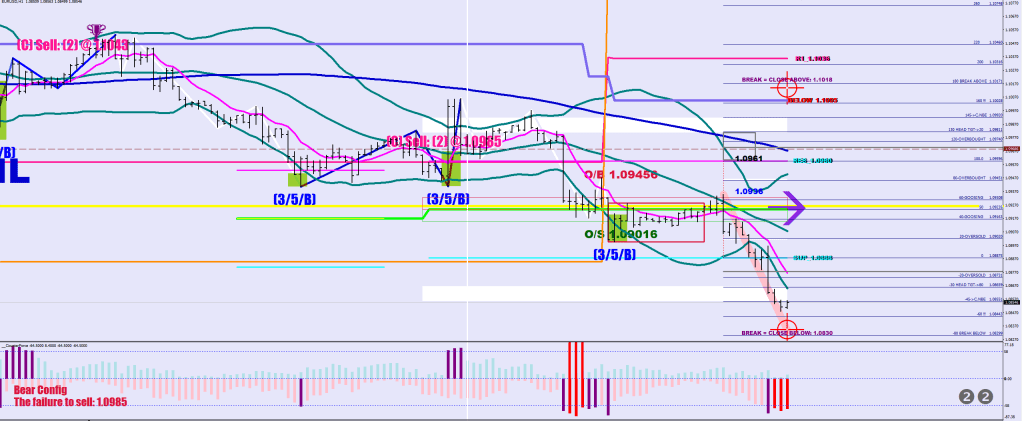
The first red print since the 1.07x low would change the config to bearish and would plot the R1 at 136 pips up from the low, currently this would mean 1.1060.