

The 3 ingredients for trading are:
Wave Structure, Time and Scaling (in & out).
Of these 3 the second one that has been the hardest for me to figure out.
Noone has anything on the subject. What is up with the 5-hour metric? How is support and resistance made? Not by volume.
Emini-watch is looking in the right place, but takes neasuring time overtly complicated with his sine wave triplets.
I’ll just leave the subject hanging for now, and talk about the Black Natural and the Black in the Magenta Nick Rhodes prints.
The downside natural is the following:
///downside
////black natural
   if ((Low[i]<Low[i+1] && RSI2[i]>RSI2[i+1] && (RSI2[i+1]<2 || RSI2[i+2]<2 )) || (RSI2[i+1]<2 && RSI2[i]>2 && RSI2[i+6]<2)){
         score[i]=-4;
…and has no relevance currently.
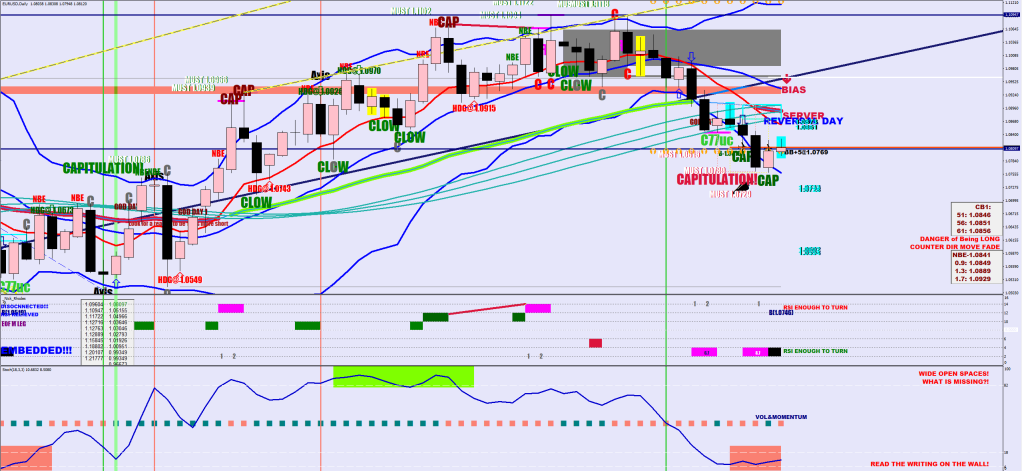
(B: 1.0746) in blue
The Black in the Magenta is the following:
if ((Low[i]<Low[i+1] && RSI2[i]>RSI2[i+1] && ((RSI2[i+1]<4 && RSI2[i+1]>2) || (RSI2[i+2]<5 && RSI2[i+2]>2))) || (RSI2[i+1]<5 && RSI2[i]>5 && RSI2[i+6]<5)){
         score[i]=-3;
Translation: RSI2 is rising and the previous RSI2 was a magenta print or the one before that was a non-magenta print or the RSI 2 has been waving up and down at the bottom line of 5.
Can this call a bottom? It certainly has before.
The 1.05 low was tested 3 times and the 8th and the 14th days made an attempt on this “black” low and managed a fake out to an extent of 13 and 14 pips.
There was a (B: 1.0519) associated. The actual low was 1.05155 12 days later.
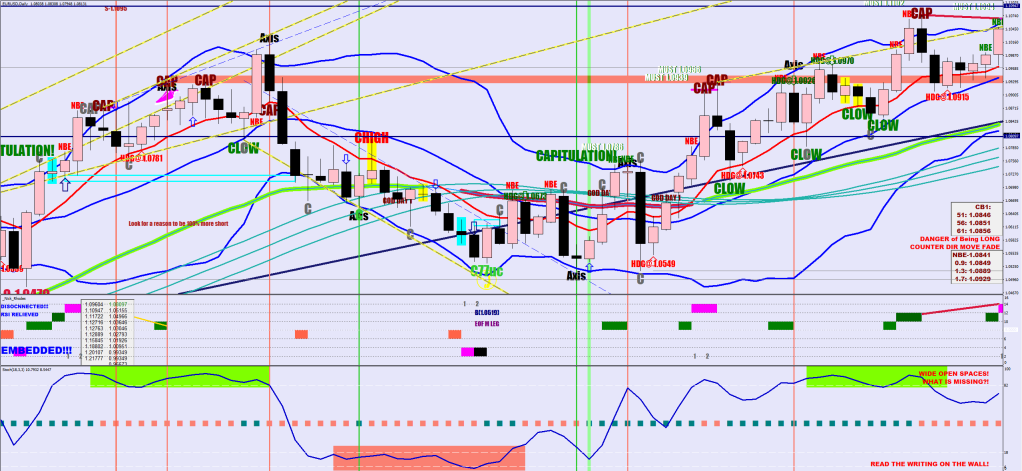
It actually seems more reliable on the downside than the Natural Black, of which there are 3 examples below:

Either way, the theme is that the 19-sample Bollinger high would be hit before the low next, but that’s not to say that the lower one would not be challenged at all, just that price would end up falling short from it. Also, hitting the upper band would take at least 10, at most 19 days.
It is also unusual to see two pro volume candles so close to each other.
New companion logo

