
What happens after a measuring leg (M) prints? A mean reversion.
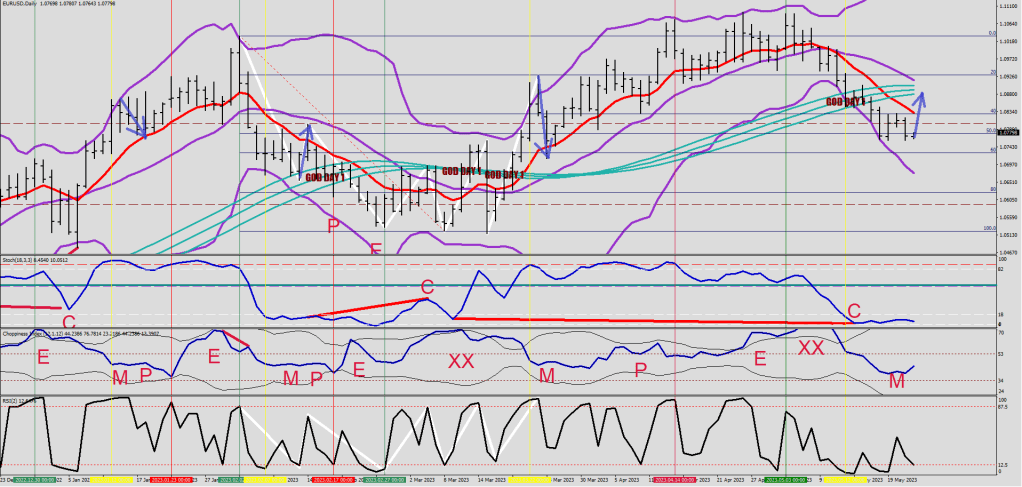
I personally call the E9 HL2 Daily the mean (in Red). 414 sample HIGH to LOW band on 30 mins, 207 sample on the Hourly (usually displayed in light Green as in Green River).
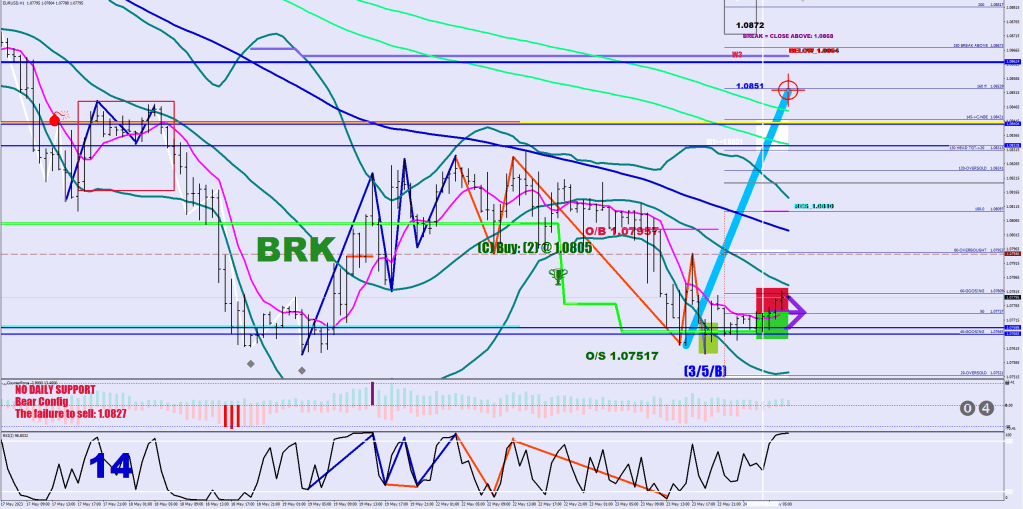
I actually have come up with the inclusion of the current volatility to get a more precise truning point for an overshoot, as the image shows below. 1.08714 looks like a good number for a commitment.

Another aiming function was finding the swing low at a 3x fluctuation maximum stretch and using the value at the opposit end of the Green River, image below.

This image also shows how price is being kept from a mean reversion by selling the Lower Guard Rail (Yellow Green / Chartreuse).
See, the mean reversion is usually not stopping dead at the mean, but rather going to the location where the mean was at the moment of making the volatility crush call. (Purple line is 3x fluctuation maximum out, plots 1.0885)
It is also a statistical fact that a mean reversion takes about 2 days on average (1 to 3), see first image – so now you have some idea about the by when.
Do not let the current “No Volatility” fool you. The market has just regained its composure after 5 waves up and another 5 waves down.
Not what Elliott would teach you, that’s for sure.
The volatility breach reversal YellowGreen box highlights the end of Wave 5 (or Wave 3).
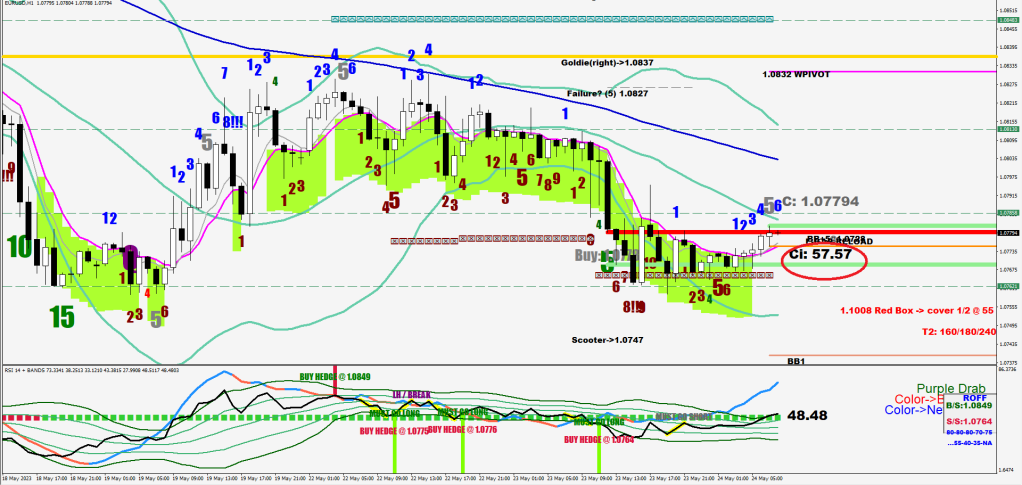
This is a very capable, rested market with a 57+ Ci reading. A break on the upside (Risk Off) level is at 1.0849, and you could have a fake out move for up to 25 more pips, therefore I would say 1.0875 is the most likely target for this Wave 2 up.
