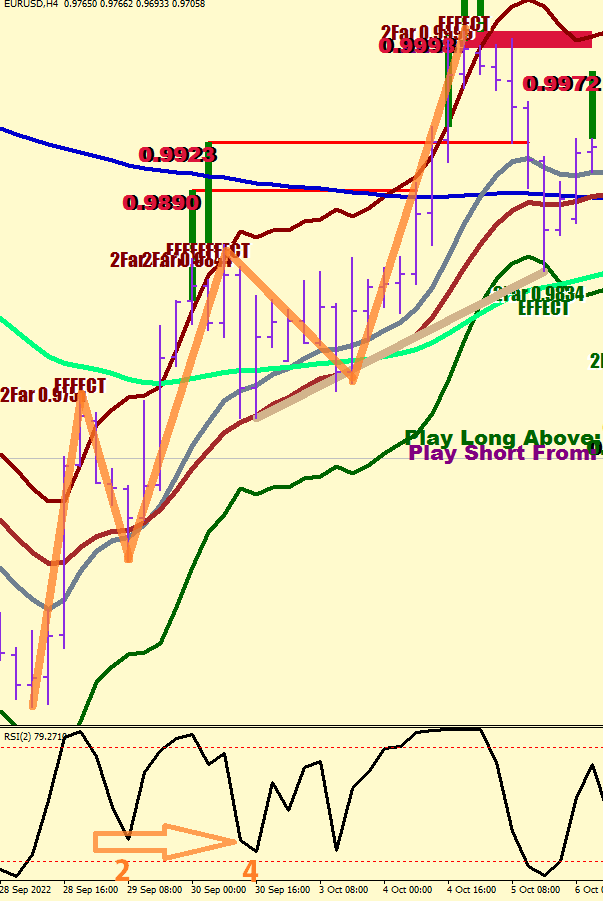
What does Elliott Wave say about Wave 3? That it cannot be the weakest of the 3? It is time to choose a different profession, dear.
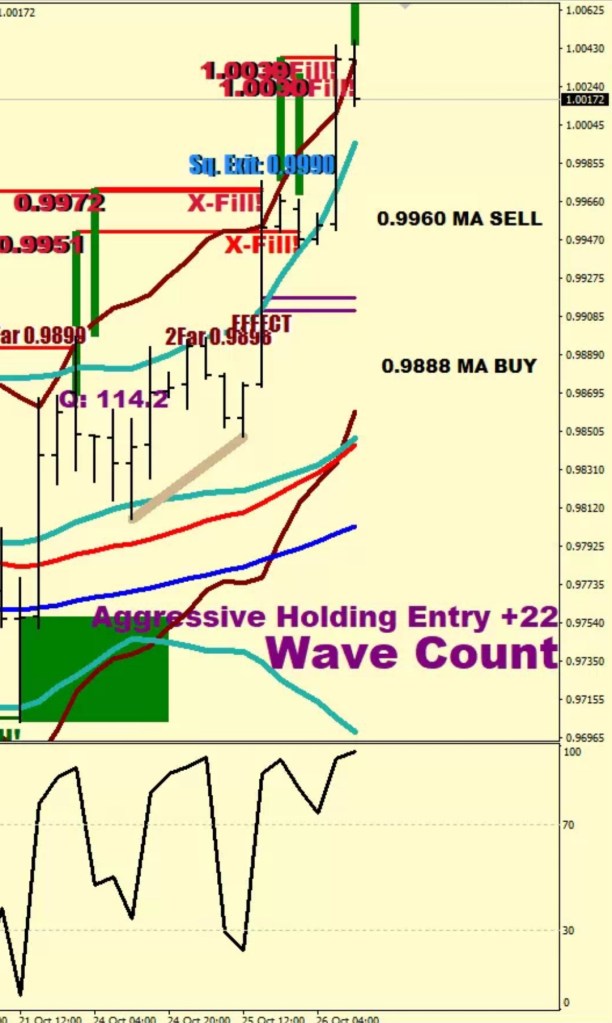
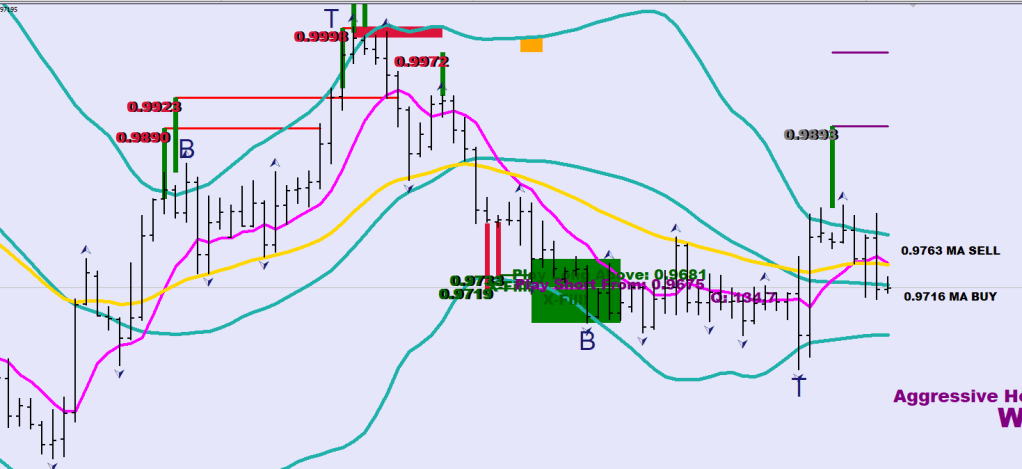
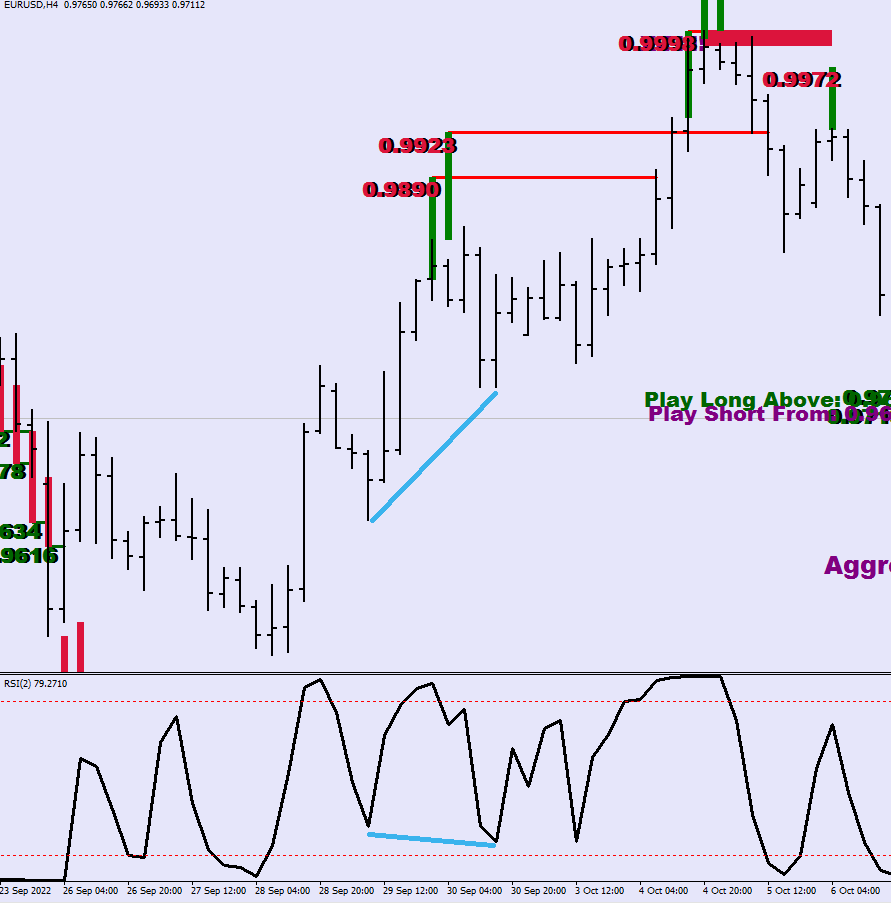
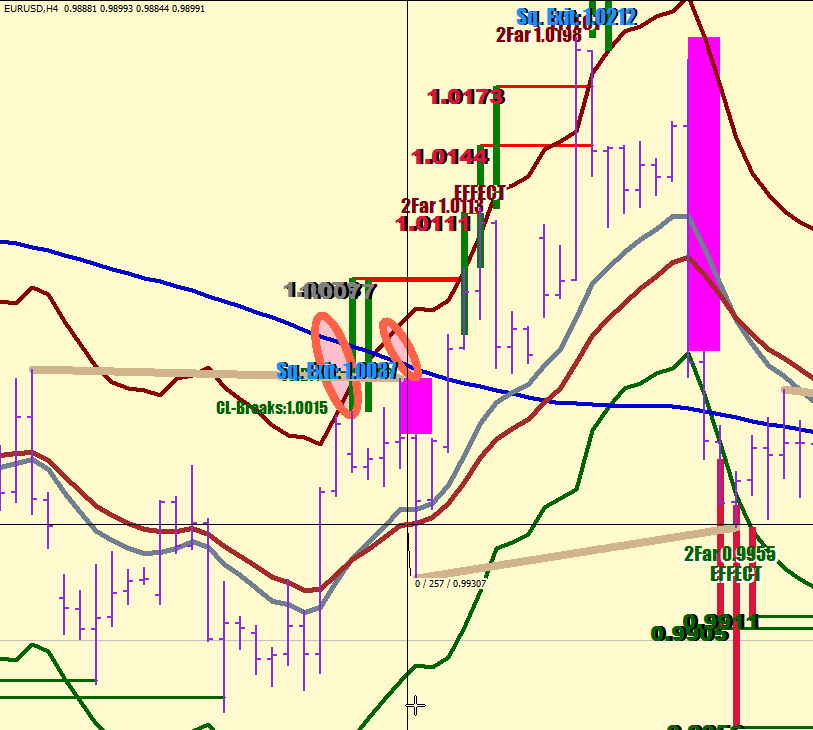
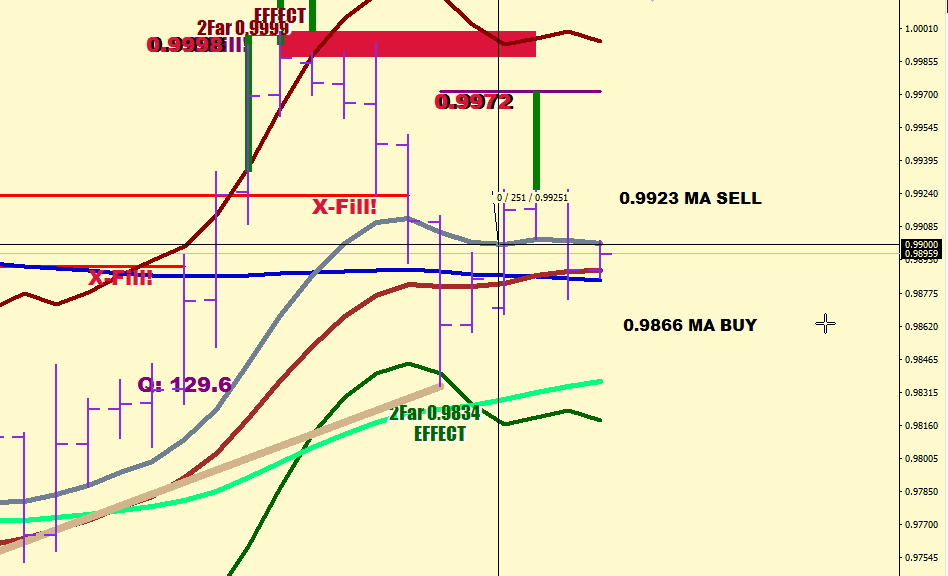
Clear as the sunlight at night that Wave 2 and Wave 4 had their RSI continuation divergence set – auto plot in Khaki. Wave 3 was the weakest of the 3. There’s a squaring exit at 0.999.
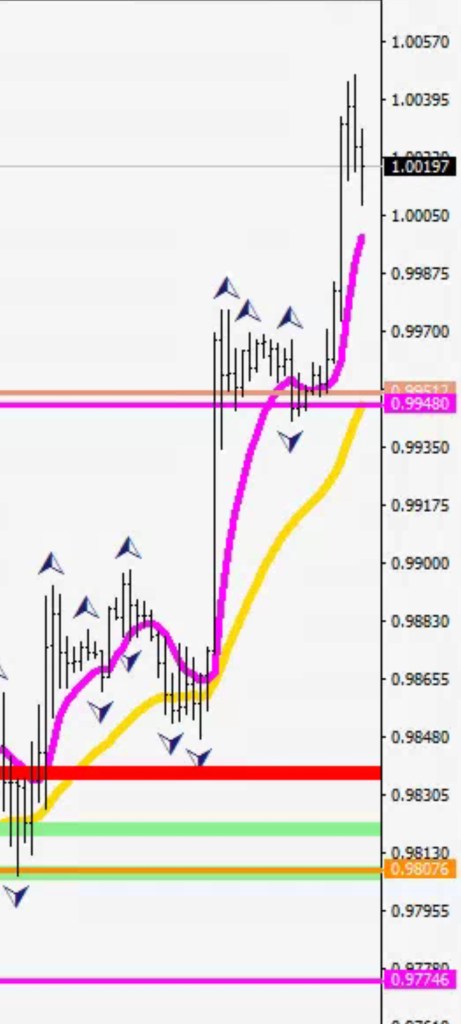
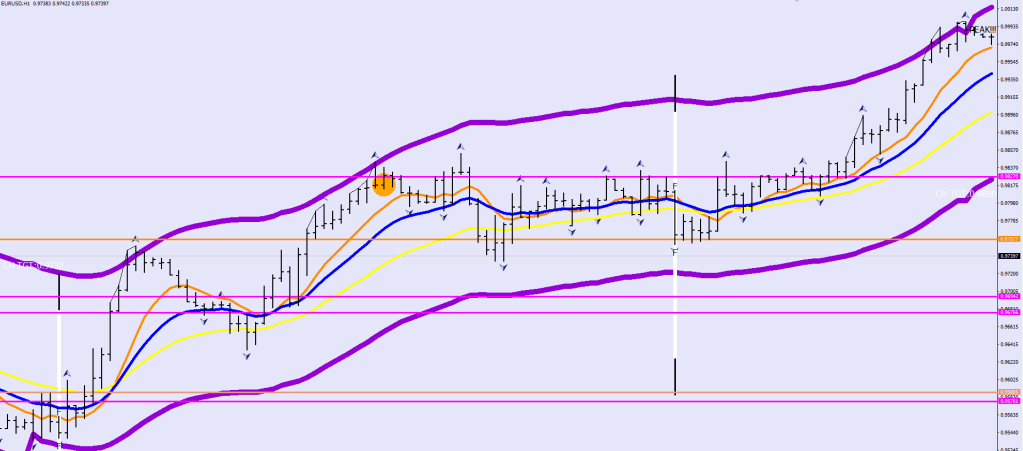
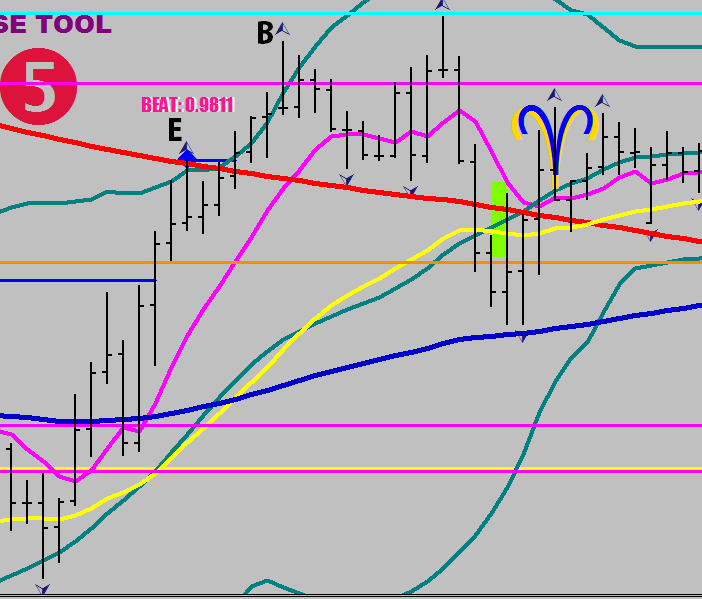
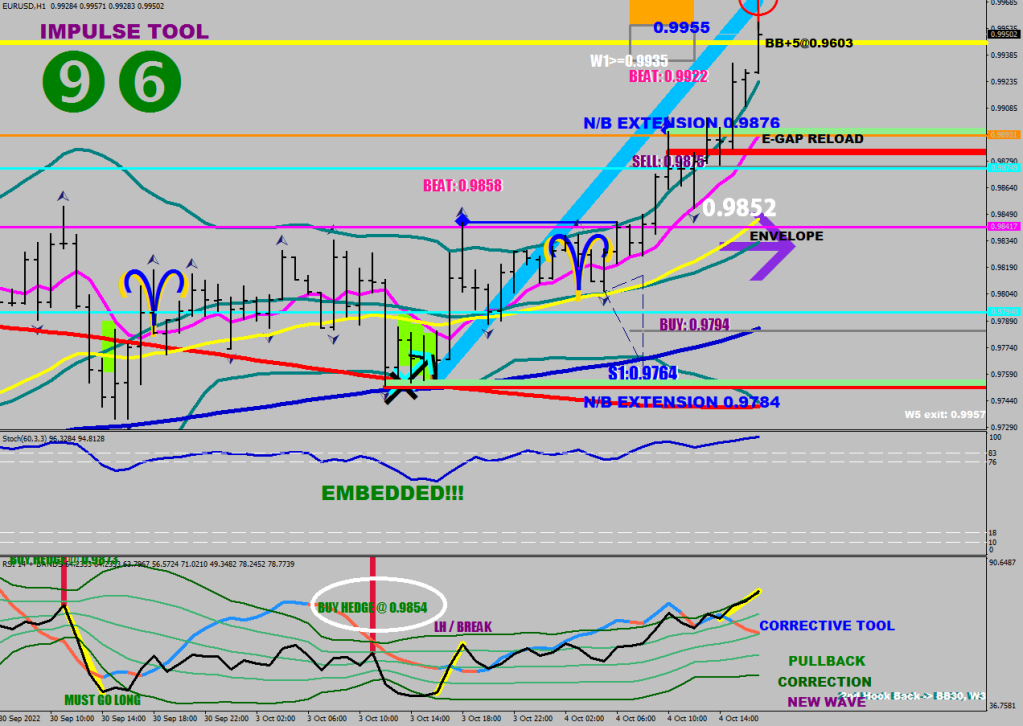
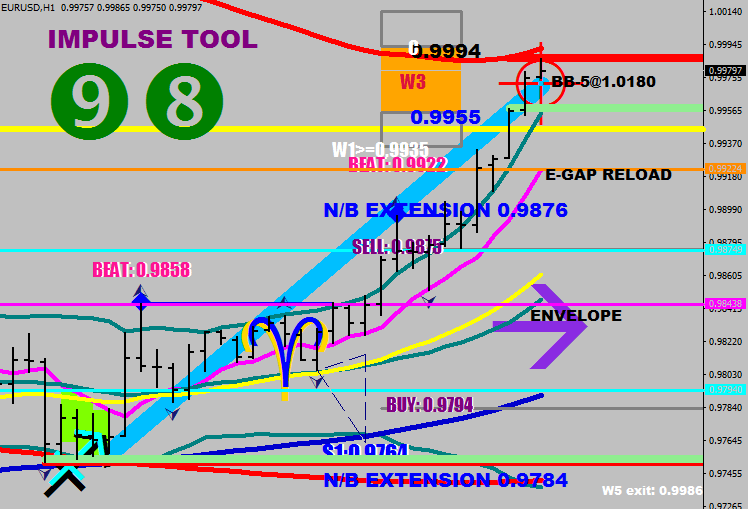
Wave 5 started from beyond the E-32 (Yellow), the Thrust of Wave 5 started from the E8O (Magenta).
Let’s evaluate the encounter with God.
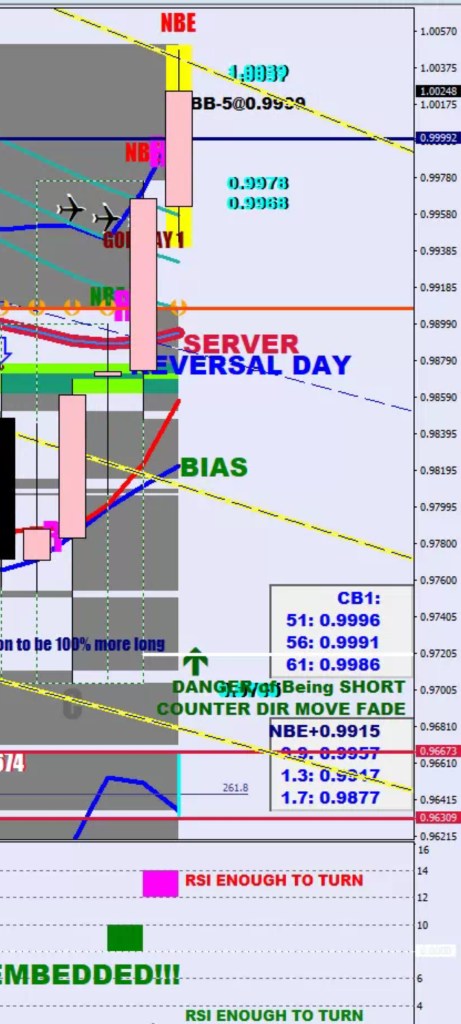
It was the 3rd kind, the non-typical one that blew through and is due to do at least Kiss Good bye on day 3.
The last time around they managed to stretch the band 5.5 folds on the upside before it produced that 9.3x stretch on the downside.
You already know the sound track for this one. White lines, the more I see the more I do.
Get higher, Baby!
So what’s the plan here? Shorting back to God, then wait. No shorting above God after a Kiss Goodbye, but by all means all out shorting upon the break of the Kiss Goodbye Low.
God (the middle line) is not far from Today’s low, but would coast lower with tomorrow’s start. The angle is not particularly bullish still.
KGB: lay all your kisses on me.
Capitulation may be the correct verdict.
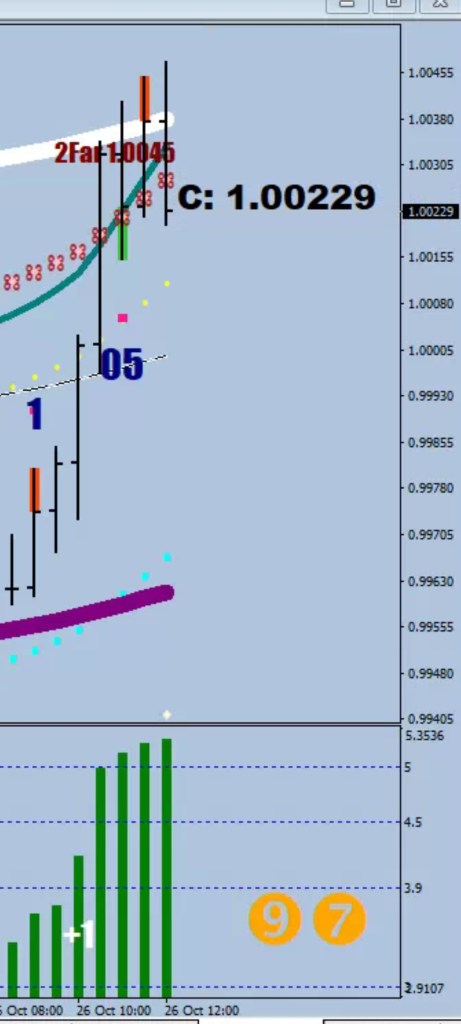
Momentum got stretched to 11 days instead of 9 with Yesterday’s close above God. A slight beat come next day is a possibility still.
I have found some of the answers more than once, so my exercise is coming up with reminders for myslef.
A W4 can make its own support / resistance. Once returning within the volatility bracket, out of 3 fractals the furthest open / close would become this level.
int ucounter=0;
int dcounter=0;
double llevel;
double ulevel;


llevel=1000;
i=21;
while (i<100)
{
   if (High[i]<iBands(symbol,0,30,2,0,PRICE_MEDIAN,MODE_UPPER,i)+50*Point && High[i+1]>iBands(symbol,0,30,2,0,PRICE_MEDIAN,MODE_UPPER,i+1)+50*Point) break;
   i++;
}
if (i<100){
 j=i;
 while(j>0){
   if (iFractals(symbol,0,MODE_LOWER,j)) {dcounter++; if (Close[j]<llevel) llevel=Close[j];}
   if (dcounter>2) break;
  j--;
 }
}
if (j>0){
   ObjectDelete( "Gent");
   ObjectCreate( "Gent", OBJ_HLINE, 0,  Time[0], llevel);
               ObjectSet("Gent", OBJPROP_COLOR, clrCyan );
               ObjectSet("Gent", OBJPROP_WIDTH, 3 );
               ObjectSet("Gent", OBJPROP_RAY_RIGHT, false );
               ObjectSet("Gent", OBJPROP_STYLE, 1 );

               deletetxt1("CLine");
               ObjectCreate("CLine"+IntegerToString(j), OBJ_TEXT, 0, Time[j], llevel-20*Point);
                 ObjectSetText("CLine"+IntegerToString(j), " BUY: "+DoubleToStr(NormalizeDouble(llevel,4),4), 14, "Impact", White);
   ObjectSet("CLine"+IntegerToString(j),OBJPROP_BACK,0);
       ObjectCreate("CLineL"+IntegerToString(j), OBJ_TEXT, 0, Time[j], llevel-20*Point);
   ObjectSetText("CLineL"+IntegerToString(j), "BUY: "+DoubleToStr(NormalizeDouble(llevel,4),4), 14, "Impact", Purple);
   ObjectSet("CLineL"+IntegerToString(j),OBJPROP_BACK,0);

}
What is one of the rules of Elliott Wave? That a Wave 1 and a Wave 4 cannot overlap? Lunacy.
Misery, why don’t you come to me? At this point the upper BB is trending lower.In order the W4 support to work, the 4H RSI’s 20 SMA has to give its blessing, otherwise opt for the S1 / R1 for an entry.
This is still a Wave 4 until the Overdrive band gets popped on the downside approving the down move as a Wave1 down.
Overdrive starts at 9690
A bit of New Wave is in order here
…
Xtension fill, lower overdrive band missed & the stronger move called Wave 5 impulse up.
Ira is cute. He has his bugs and incositencies such as keep calling the 200-week average 4.5 years long and keep saying that Euro is making up 40% of the DXY when it is more like 54%) and therefore very lovable.
I don’t know what it was. A flash rally. They come out of nowhere, and that one did.
It’s gotta be algorithm trades, I can’t think of anything else.
50 years of charting and running a brokerage apparently does not come naturally with wave counting.
There is a bit of difference between Trust and a Thrust. I can’t think of anything else.
Thrusts come out of nowhere at the end of a Wave 5, just beyond the Beat of Wave 3, just outside the 4-hour, 30-sample HL2 BB.
I was wrong for looking for an ABC correction on the way up. I corrected myself and learned a lot of things, such as traits of certain Waves. I now have a better concept of what a wave 1 does and what are the best continuation entries.
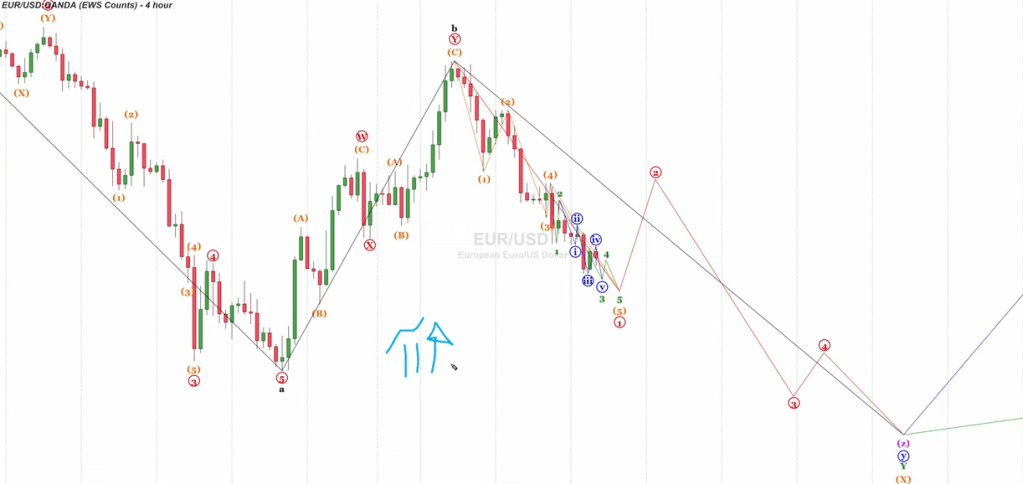
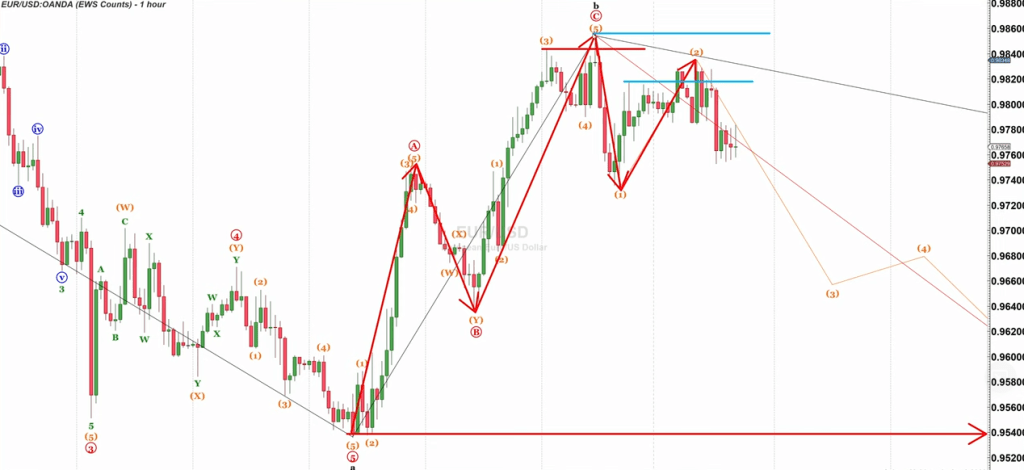
To save face after posting videos and charts this Spelliot is showing an ABC for wave 1, 2 and 3, then this guy goes on and adds another ABC for leg five and just turns the first ABC move into 4 legs – say what?
What were you thinking deciding to make the lie live on and beget ever fatter, hoping that no one notices? You thought that I was just gonna say, your sexy is secret with me, safe?
Did you say that this correction was rather strong?! No shit, Sherlock! 5 waves impulse structure in excess of 325 pips is a complete change of trending direction.
Now you are looking for a Wave 2 up and an undercut of the low? A 9.3x stretch from the mean to the downside was good enough for the year. Would they thank you for keeping them out of trading and losing to you instead? Gradually, of course, how else would you peel a cat?
I, unlike you am basing wave structures on tangible things, such as overdrive bands, moving averages and RSI2 divergences. For instance a Wave 4 is a shot over the bow signaling that the next break would be a turn for real, it sets up a continuation divergence / gets further out on the MA ribbon, effectively losing ground, but I bet you did not know that.
This is a continuation divergence between the Wave 2 and the Wave 4 lows. The low of Wave 4 is not necessarily the end of Wave 4. How are you doing?
You probably didn’t know that a no break extension can extend a wave for a bit longer either.
Question mark: challenge of the low. Within 5-5.5 hours they must be able to close below the low, otherwise the break out attempt was a failure. Where’s the 5.5 hours coming from? A trading session is 6.5 hours long. Maybe from there.
32/6*8=42.7 pips
You just like to write “QWERTYUIOP” on every chart for some reason (admittedly looks very scientific) and charge every human being you can scam into $79 per month for it – and you can pay $149 if you are double the loser.
What is an exhaustion? A beat? A thrust? Overdrive bands? Separation? Channeling? No break extension? Fluctuation maximum?
Exactly.
Stay out of the line of my sight and stop taking other people’s money, Dr. Doxey, what you are doing is criminal! I despise low lives like you.
R1 calculation
 i2=1;
   while (i2<500){
      i=i2+3;
      if (iFractals(Symbol(),0,MODE_UPPER,i2))
      while (i<i2+16 ){
            if ( RSI2[i2]>RSI2[i] && iFractals(Symbol(),0,MODE_UPPER,i) && High[i2]<=High[i]-10*Point ) break;
         i++;}
      if (iFractals(Symbol(),0,MODE_UPPER,i)  && iFractals(Symbol(),0,MODE_UPPER,i2) && RSI2[i2]>RSI2[i] && High[i2]<=High[i]-10*Point) break;
               i2++;}

  ObjectCreate("Ellipse3_1ffx",OBJ_TEXT, 0, Time[i2-3], High[i2]+450*Point);
            ObjectSetText("Ellipse3_1ffx", " R1:"+DoubleToStr(NormalizeDouble(High[i2]+420*Point,4),4), 17, "Impact", clrWhite);
             ObjectCreate("Ellipse3_1ffy",OBJ_TEXT, 0, Time[i2-3], High[i2]+450*Point);
            ObjectSetText("Ellipse3_1ffy", "R1:"+DoubleToStr(NormalizeDouble(High[i2]+420*Point,4),4), 17, "Impact", clrBlue);
Admittedly, I have explored every single edge in trading and made them parts of an indicator on an EA.
The Great Wall of China is the E-36 channel. Yea, no, Forex channels do not have straight lines for walls.
What was really missing until now was the wave structure nuances.
Look at what knowledge the Holy Graph has decrypted for safe keeping below.
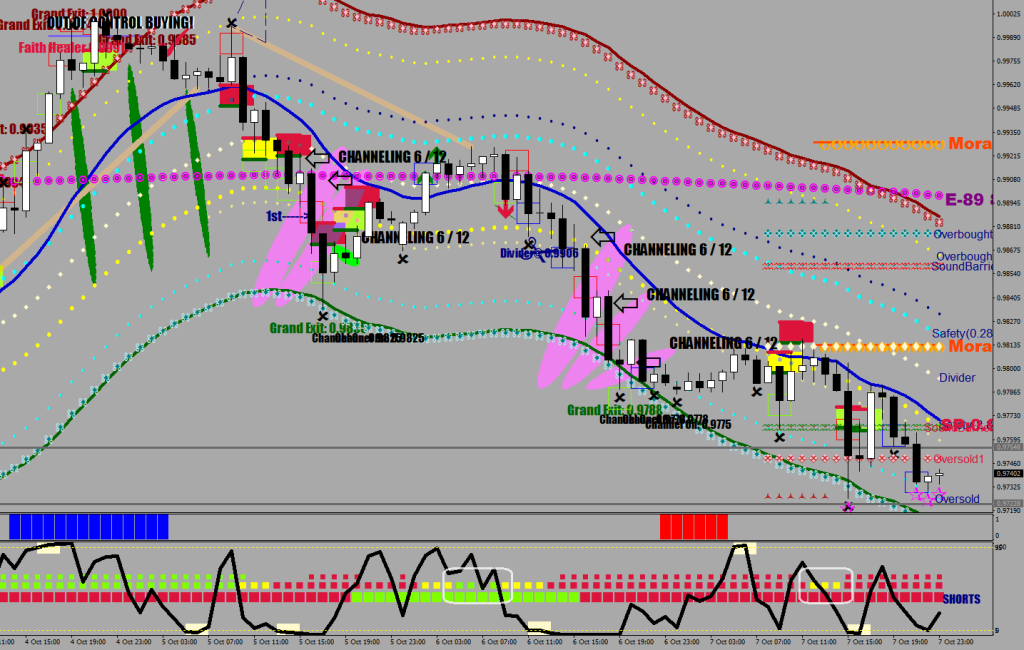
The great rows of fire.
Concentrate on the middle row. Green means the last 3 closes were above the Suppressor line (E16 HL2).
Admittedly, FX volatility had to get back to the level it used to be at to see constant channeling and impulse waves galore.
I had these lines below for targeting for many years. Almost never used them, and they just gave way for the 8-EMO targeting under the label of CODE 8. The question is the timing. Curious.
Yet I was not able to say that the Wave3 hasn’t ended yet, why?
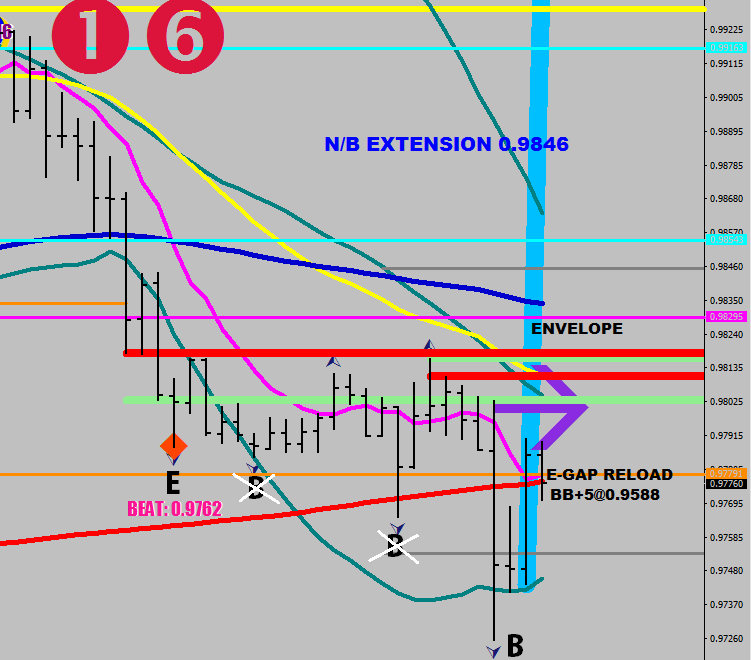
When I did not know any better, so earlier today I was looking for a second leg up of a Wave 4. I wanted to trade in the crossed out fractals for a Beat. If you go back and look at all my thrust finder plots, there isn’t a single one that does not require the fractal to spike outside the 30 sample BB.
So, let’s play a quiz now.
The nonfarm payrolls is due to come out today. The market just printed the second crossed out B fractal. You know that this is a Wave 3 down and you are still missing the Beat. You watch as they let the volatility bracket make its way leaving room for a spike in excess of 80 pips with 15-16 on the outside making for a great trap.
Does it matter what number the news would bring when the market is set up to make this trap-round-trip? Do you really think that there could had been any different outcomes other than finishing the Wave 3?
All beats & thrusts have to prove max volatility effort by going outside the BB30
I was looking for the it’s braining, man song and found this instead.
YouTube is a goldmine. This reminded me when my daughter was 3 years old and was singing, “Nationwide is on your side”. No it didn’t.
First, two incredible target projections for two different Wave ones.
It is important to throw in some values here and there when you are spending half of your time with suicidal thoughts.
Now, let’s move on with the liturgia. I am a moving averages guy. Who would say something like that in this day and age? Total retro stuff.
I have the means to figure the end point & get a fill for a Wave 1.
What can I do about a Wave 2?
I can plot an 11 & a 17-sample HL2 EMAs and perhaps a 52 on the 4-hour and notice that price often makes a false move away from this band to the tune of up to 25 pips and these points tend to be the best entries and these entries tend to coincide with Wave 2 terminal points.
25.7 pips26.4 pips
Typically, there would be a spike into the Overdrive bands made by a Wave 1 into the new direction.
16.4 pips? I’m not saying not to scale in starting from the outer MA or even from between them.25.1 pips.
This however is the idea behind placing the bulk of the volume 22-pips out.
Overdrive bands calculation

E32L[i]=iMA(NULL,0,8,0,MODE_EMA, 1,i);

ODU[i]=E32L[i]+FMax*23.5*Point;
ODD[i]=E32L[i]-FMax*22.5*Point;

where FMax is 6/5 FSize and the FSize is 32

double FMax = FSize*6/5;
The downside is more of a mix of conditions, not a displacement.
So this so called “C” was suspiciously impulse looking with that EBT structure.
Wave 4 ended in a 4-hour continuation divergence. Everything stayed over the 120EMA (in Blue). Think of the first low as the stochastic bracket’s low, and the re-visit as buying the oversold.
Wave 2 is a bow back to volatility had broken or where volatility breaks
Wave 4 is a bow back to beyond E32, a scare on a previous swing high / swing low fractal
B stays within 1-2 STD on the RSI while going beyond E-32 with opposite OS/OB BB location
This was an ABC move up. What next? There was a liquidity grab with the cut above, the bias is down.
Is this ABC a Wave 1 up or would there be a Wave 1 down from here? Another bow back up first?
Ok. Let’s explore the continuation first.
Where would Wave 2 go to given the early definitions?
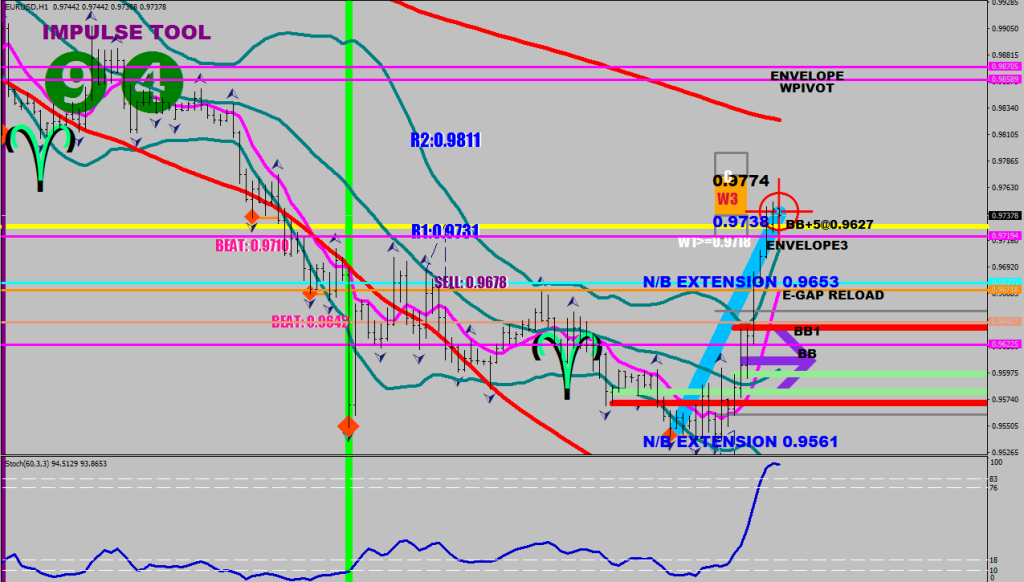
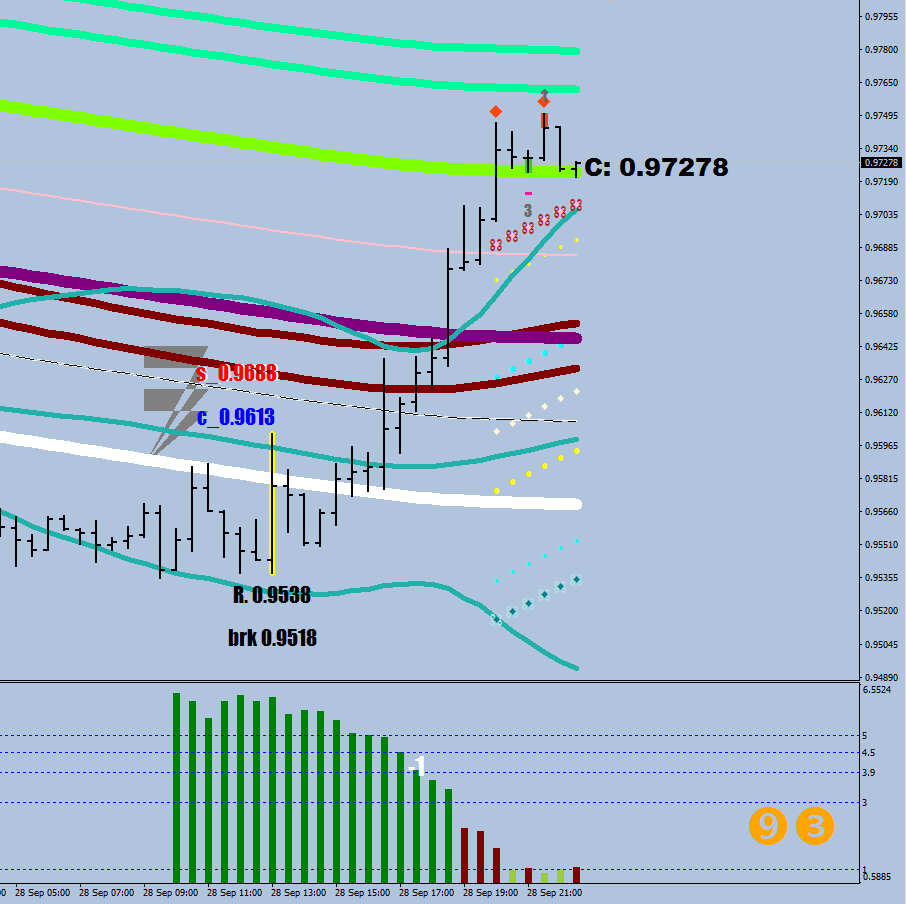
Just by chance the Goldilocks line is going across that hourly close where the volatility was broken: 0.9678. For a continuation move I would give 40% chance of this playing out.
Taking out the swing low that B made would be an extra liquidity grab (thick red line at 0.9635). For a continuation move I would give 55% change of this playing out.
As it stands, due to the volatility squeeze, it would not take much to break the volatility bands, therefore even a dip below the current swing low (thick green) at 0.9733 would work in combination with the previous swing high close (3rd fractal cyan line) may be a buy. I would give 5% chance for this to be playing out as a continuation move and closer to zero in the absence of Daily Upside Embedding.
If we get a bow back up first especially, we could see a full Wave structure to the downside. This could be yet another 5-wave sequence. I’m afraid the RSI bands are not wide enough for a sideways ABC movement. A typical ABC has similar length A and C legs and the RSI bands are holding cozily at 2 SD.
A Wave 1 down would most likely end after 2 fractal prints outside the 30-sample BB.
Example:
I personally don’t think that you are going to see a new lower low unless the whole world becomes unglued.
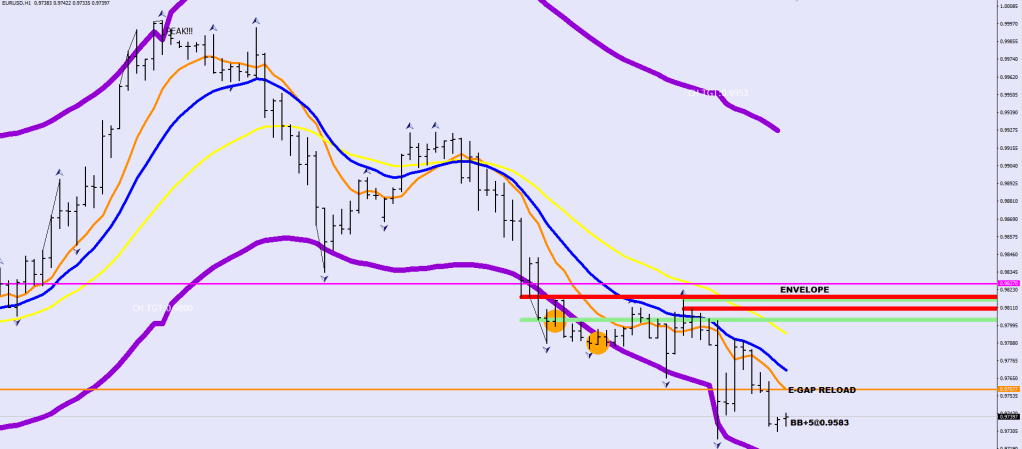
Frankly, this current move down is a failed Wave 1 attempt, it does not qualify for a Wave A and I do not see how any structure could be started from here without bowing back a little further up to at least .98318 first / outside the upper BB.
Could this start motoring up with a Wave 3 from here? Not without the aforementioned 5% chance single fractal undercut of the thick green.
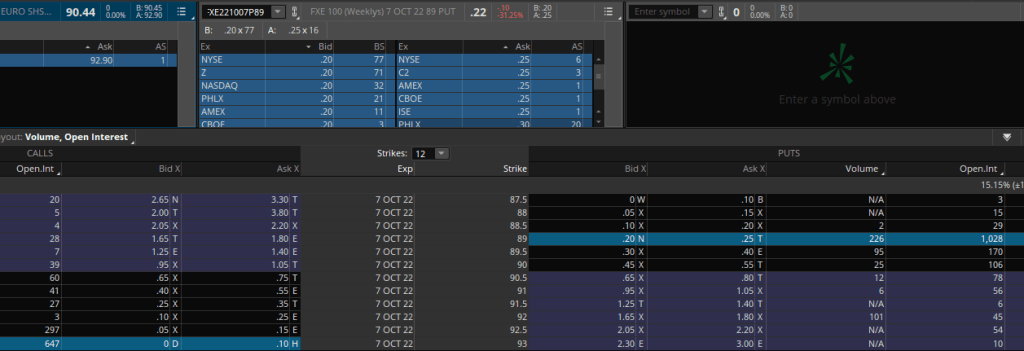
For the 7th of October, the close should be below FXE92.5 and above FXE89.
Most money lost would be at 91, which translates to .9850+
I’m telling you how things work for real. That’s all I ever do.
Back on the DM track
Charms in limited supply
Firstly, not all waves / moves end up being part of a wave structure.
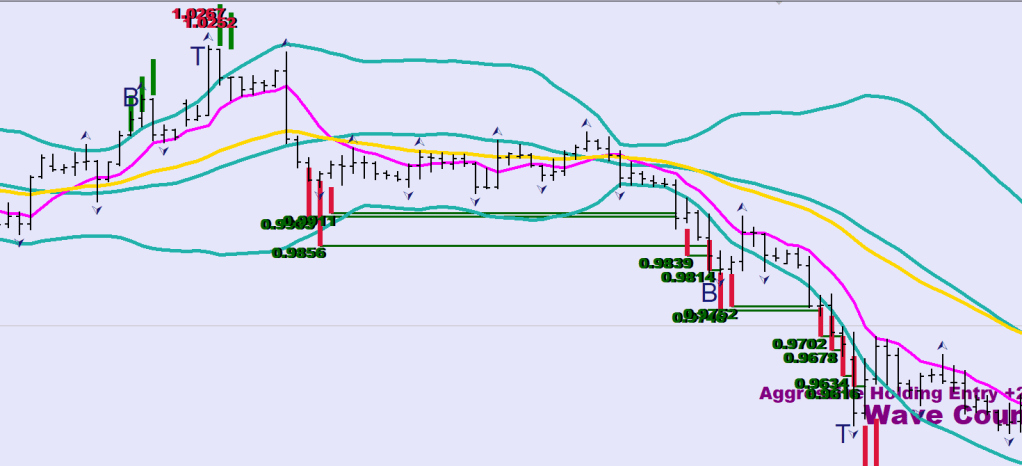
Wave 5 ended with a thrust and since the volatility has been bending price back and forth.
Thrust the Green.
The highlighted filter picks up this last one.
  if (Close[i]>iBands(symbol,0,30,2,0,PRICE_MEDIAN,MODE_LOWER,i)-100*Point && Low[i+2]<iBands(symbol,0,30,2,0,PRICE_MEDIAN,MODE_LOWER,i+2)-120*Point && Low[i+2]>iBands(symbol,0,30,2,0,PRICE_MEDIAN,MODE_LOWER,i+2)-960*Point && Low[i+2]<iLow(symbol,0,iLowest(symbol,0,MODE_LOW,95,i+3))
  && Close[i+4]>iBands(symbol,0,30,2,0,PRICE_MEDIAN,MODE_LOWER,i+4)-100*Point && iStochastic(symbol,0,60,3,3,MODE_SMA,0,MODE_MAIN,i+2)>2

// small decline of bands, 8EMA back 56-64 pips && daily stochastic greater than deeply oversold
 && (( (iBands(symbol,0,30,2,0,PRICE_MEDIAN,MODE_LOWER,i+14)-iBands(symbol,0,30,2,0,PRICE_MEDIAN,MODE_LOWER,i+2))<200*Point
 && iMA(symbol,0,8,0,MODE_EMA, PRICE_OPEN,i+2)+640*Point>Low[i+2]
 && iMA(symbol,0,8,0,MODE_EMA, PRICE_OPEN,i+2)-560*Point>Low[i+2]
 && iStochastic(symbol,0,60,3,3,MODE_SMA,0,MODE_MAIN,i+2)>9 && iStochastic(symbol,0,60,3,3,MODE_SMA,0,MODE_MAIN,i+2)<19)
 ||
// tight bands
 (((iBands(symbol,0,30,2,0,PRICE_MEDIAN,MODE_UPPER,i+2)-iBands(symbol,0,30,2,0,PRICE_MEDIAN,MODE_LOWER,i+2))<540*Point && Close[i+2]>iBands(symbol,0,30,2,0,PRICE_MEDIAN,MODE_LOWER,i+2)
// or oversold RSI14 and not deeply oversold stochastic (wave 3 beat)
 || (iRSI(symbol,0,14,PRICE_MEDIAN,i+2)<20 && iStochastic(symbol,0,60,3,3,MODE_SMA,0,MODE_MAIN,i+2)>10)
//or stoch coming out of deeply oversold, above 8
|| (iStochastic(symbol,0,60,3,3,MODE_SMA,0,MODE_MAIN,i+2)>8 && iStochastic(symbol,0,60,3,3,MODE_SMA,0,MODE_MAIN,i+2)>iStochastic(symbol,0,60,3,3,MODE_SMA,0,MODE_MAIN,i+3) && iStochastic(symbol,0,60,3,3,MODE_SMA,0,MODE_MAIN,i+3)>iStochastic(symbol,0,60,3,3,MODE_SMA,0,MODE_MAIN,i+4) && Low[i+2]<iBands(symbol,0,216,2.5,0,PRICE_MEDIAN,MODE_LOWER,i+2))
)

// 8-EMA at least 19 pips above BB
 && iMA(symbol,0,8,0,MODE_EMA, PRICE_OPEN,i+2)-iBands(symbol,0,30,2,0,PRICE_MEDIAN,MODE_LOWER,i+2)>190*Point ))  ){
New legs came from the E-32, final pushes came from the E-8.
A thrust can have an undercut, no problem. This typically won’t be more than 12 pips. Beyond 20 pips something else is happening, so use a moratorium of this size.
Here you can see that the 20-pip moratorium was never crossed by the undercut of the Thrust.
That indefinable nothing
Embedding is a promissory note for a Lower Low or a Higher High – or else the embedding itself has to cease to be.
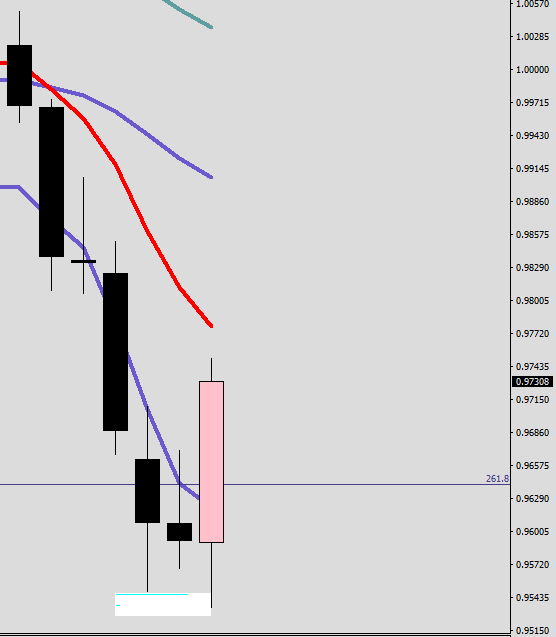
Daily embedding explains why it was a safe and logical bet to see a lower low after the inside day.
It had to happen
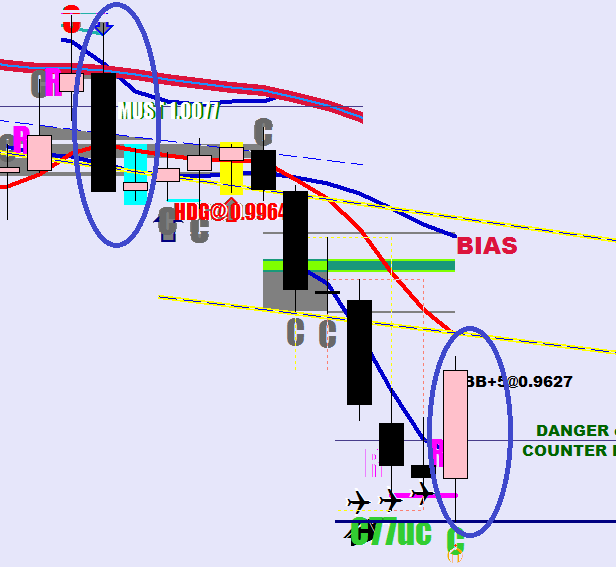
The upper oval move’s mirror image is what is happening now.
Finding the right words – ending a problem
Curiously, the 109 swing low & swing high displacements (dermia lines) almost coincide at 0.9646 and 0.9640.
After a swing high is made, a swing low would be necessary.
The first, maximum volatility move was 240 pips long. Since the move put the price below the 9-day EMA at once, I think an extra 30 pips was gained beyond the 210-pip usual upper limit. The Swing high was only made 3 days out and the retracement was 95 pips. Now you see why I used to have a rule of not fading within 150 pips of the high / low: price never re-visited that trap area. This current move has made it to 216 pips so far. It has not yet taken out the mean, but is above the Guard rail.If the high is in, a 95-pip retracement would put the low at 0.9655.
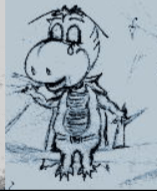
Bob was the name of a dragon I invented back in school.
Always was a bit more abnormal than weird. Personal preference.
They may want to kill the 92 weekly puts this Friday on FXE. Scratch that, that’s 300 pips up.
Probably gonna expire a smidge lower than it is after a new swing low and back. Above 89.5 by 1 hour before the close.





























 ForexFore - Internals, indicators, algorithmic trading