Aleš’s Lessons #5 – Pursuit

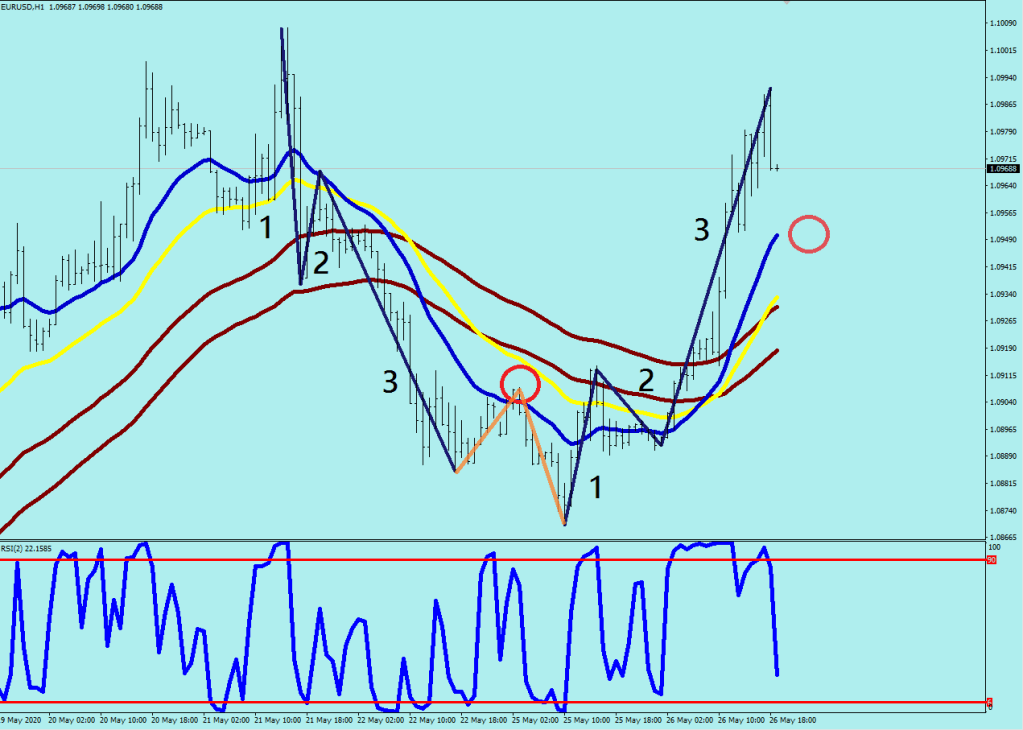
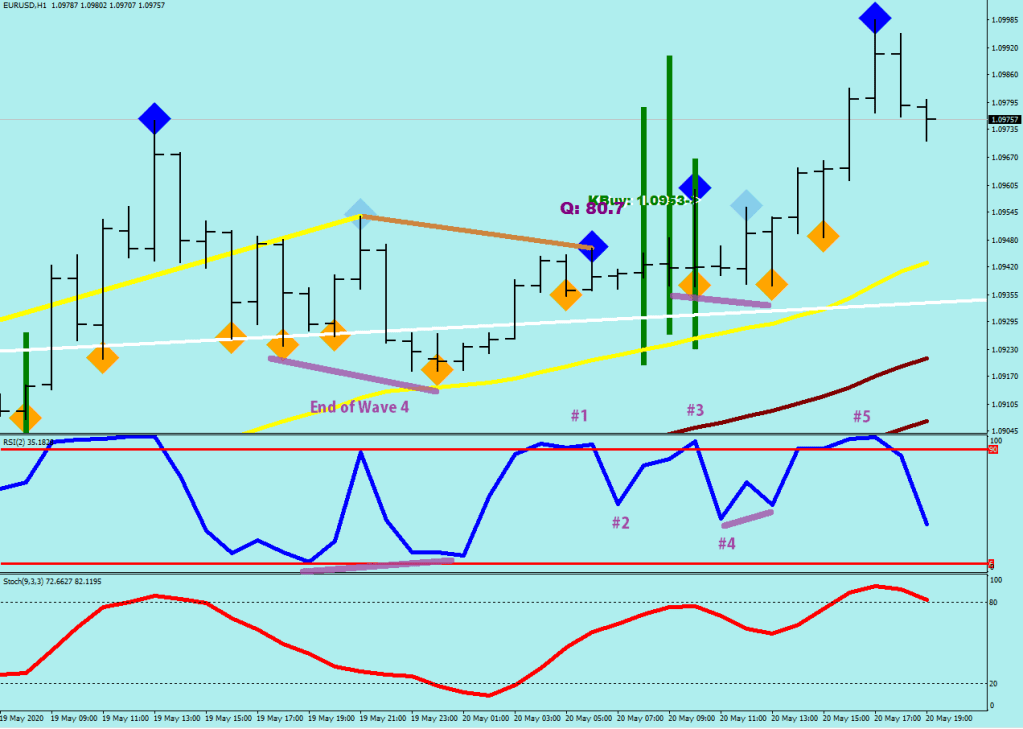
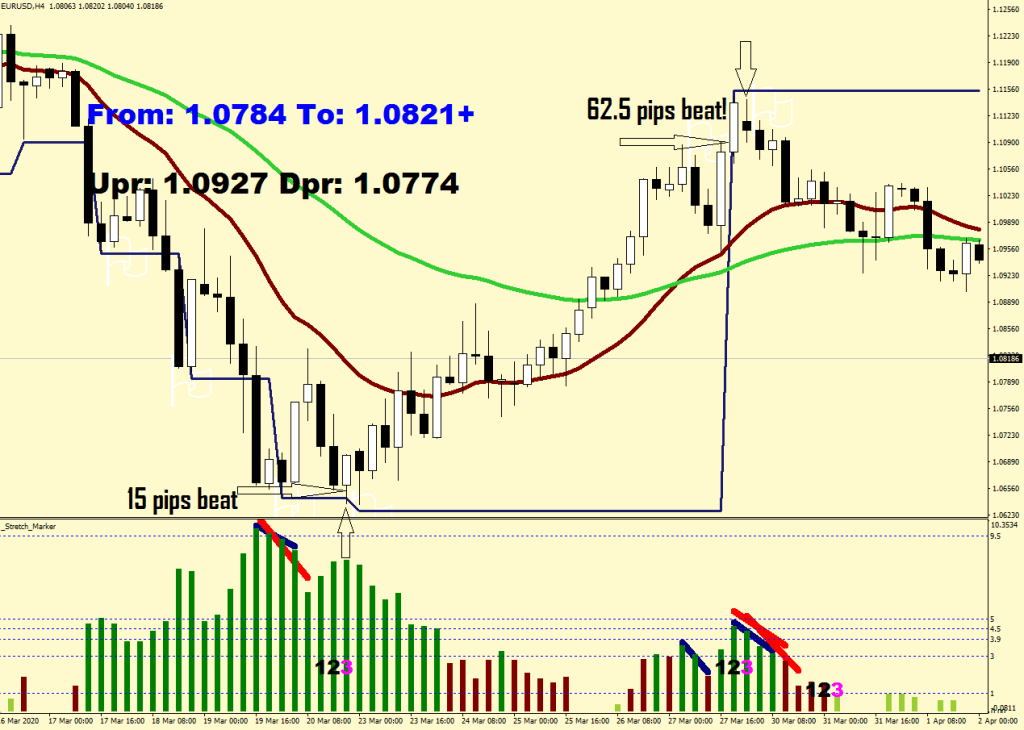
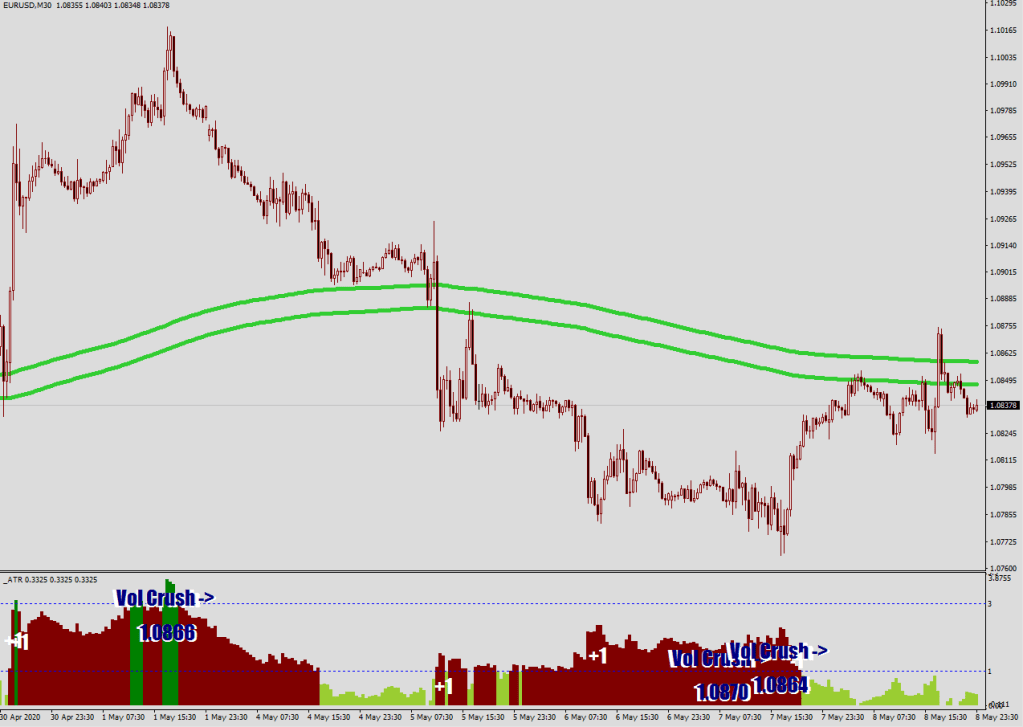
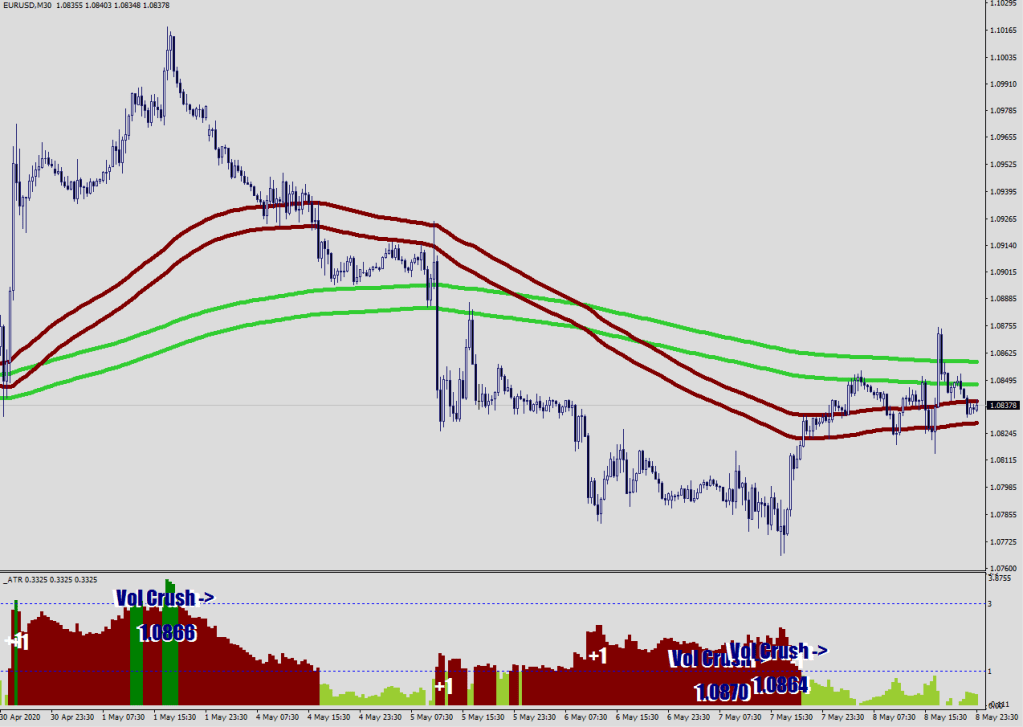
This is all the current history on the 5 min available.

On the 1st image the Support plots don’t reach as far. What do you see here?

  1. Market is engaged with the upside
  2. Market is in pursuit of a break on the upside (Navy line, later)
  3. Price went parabolic (beyond magenta) – in need of a correction
  4. Correction ends just shy of S2
  5. Market does not engage with the downside
  6. E-135 does not serve as a resistance on the way up
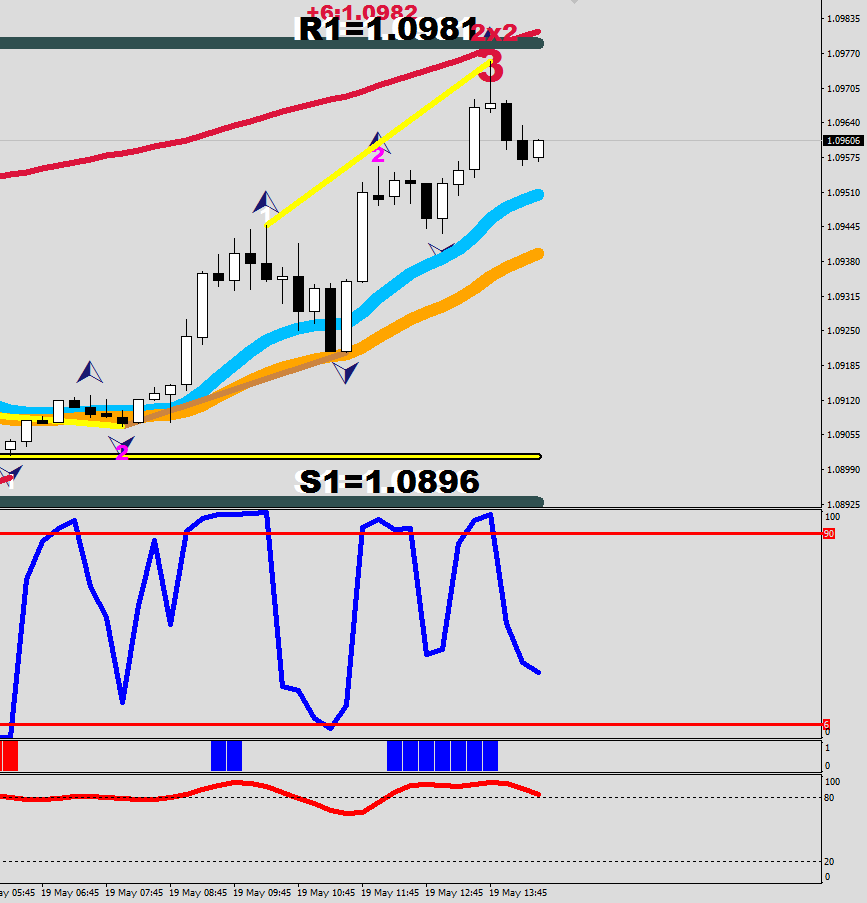
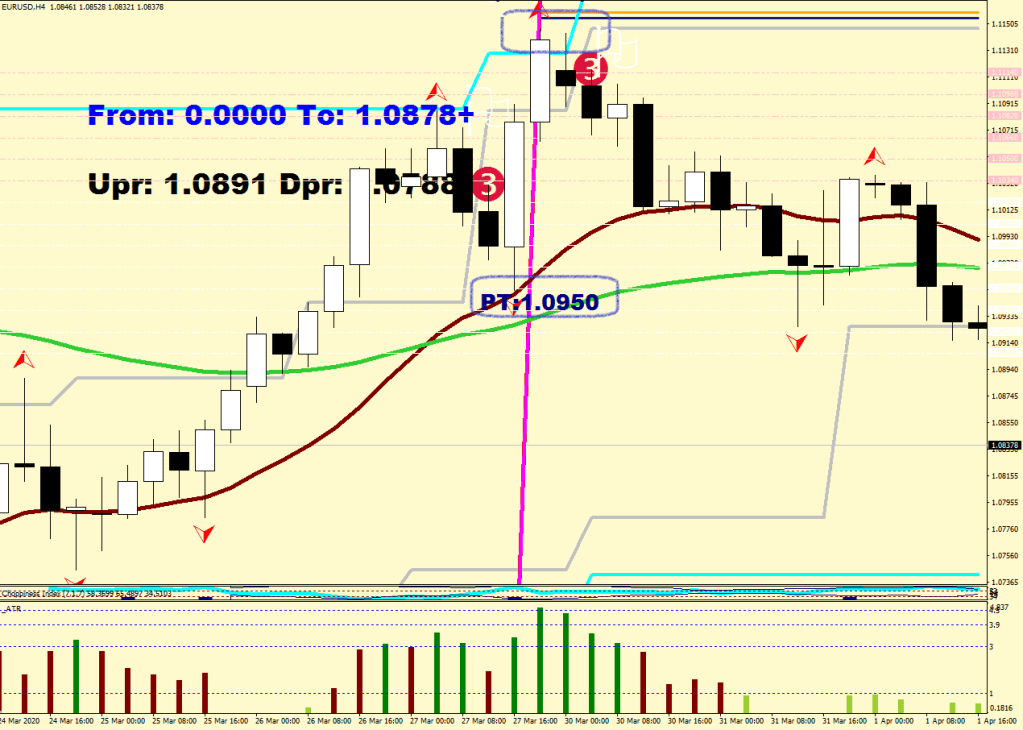
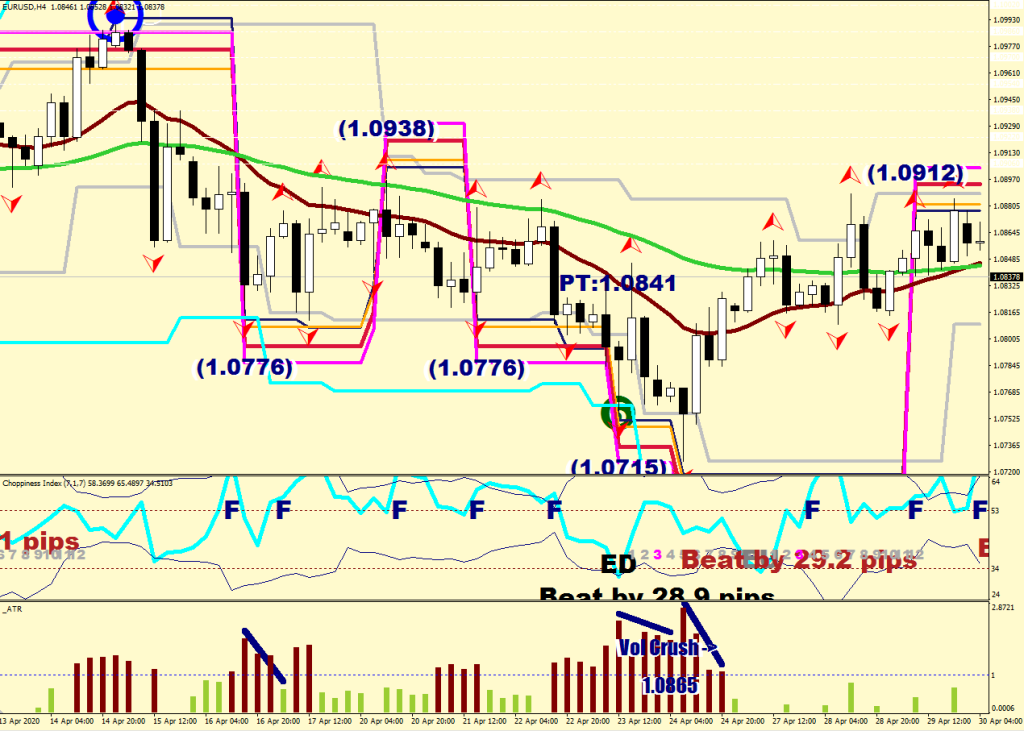
The next leg up.

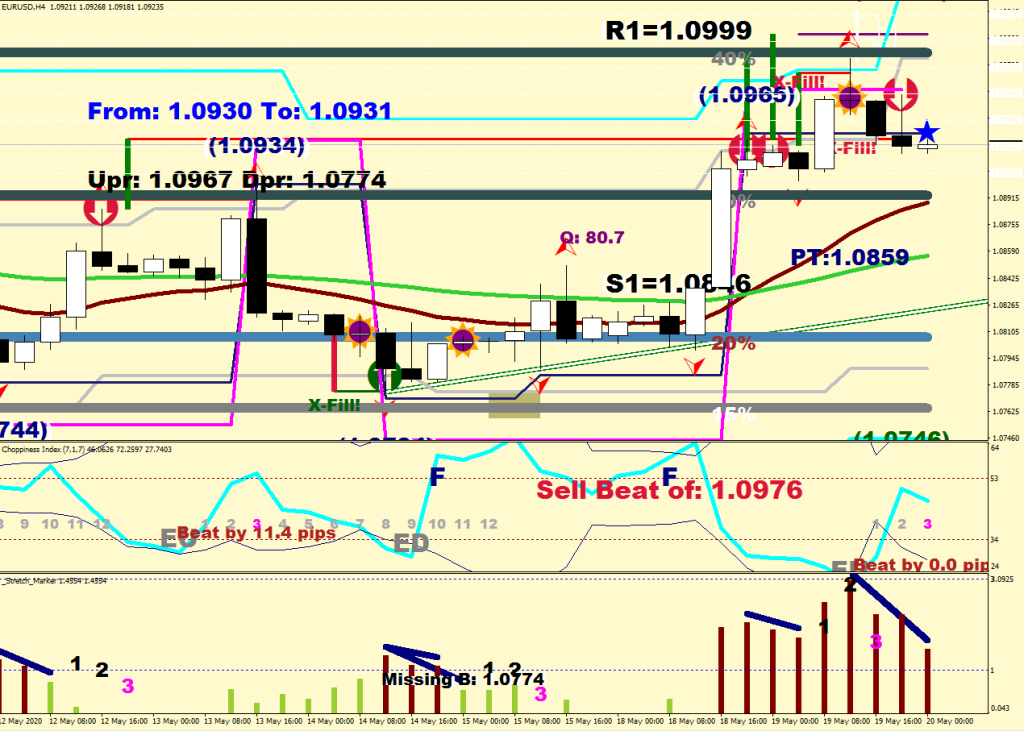
  1. The Market re-visits the previous parabolic tail and makes a beat over it (less than 10 pips this time)
  2. The Market is still engaged with the upside, but there are caution flags: the second run up should had reached the break out level (in Navy, later)
  3. On the way down S3 gets overshot – it is a beat still, but upside potential is limited
  4. Price finds resistance at E-135 => the Market has turned direction

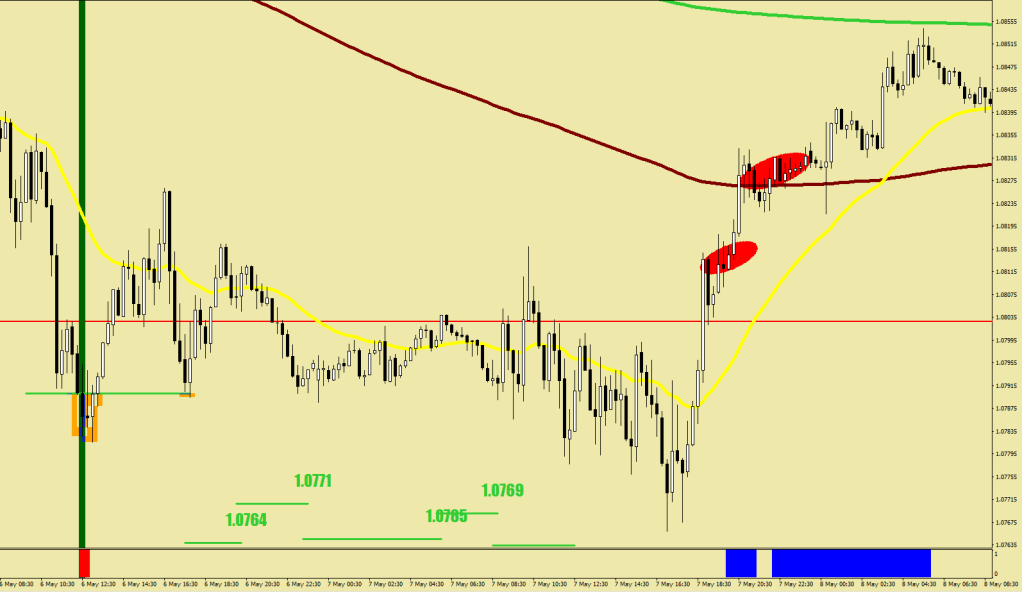
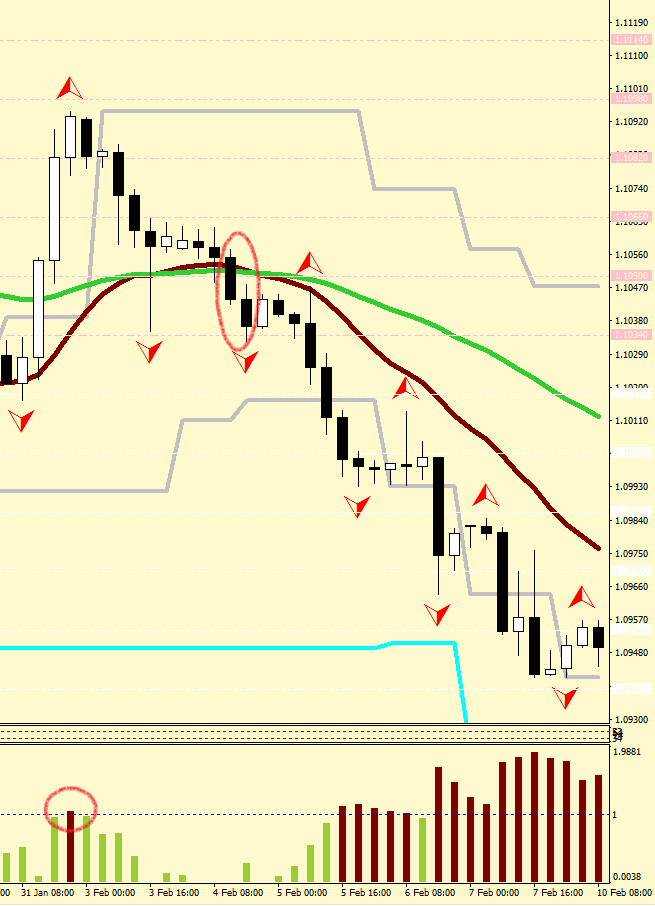
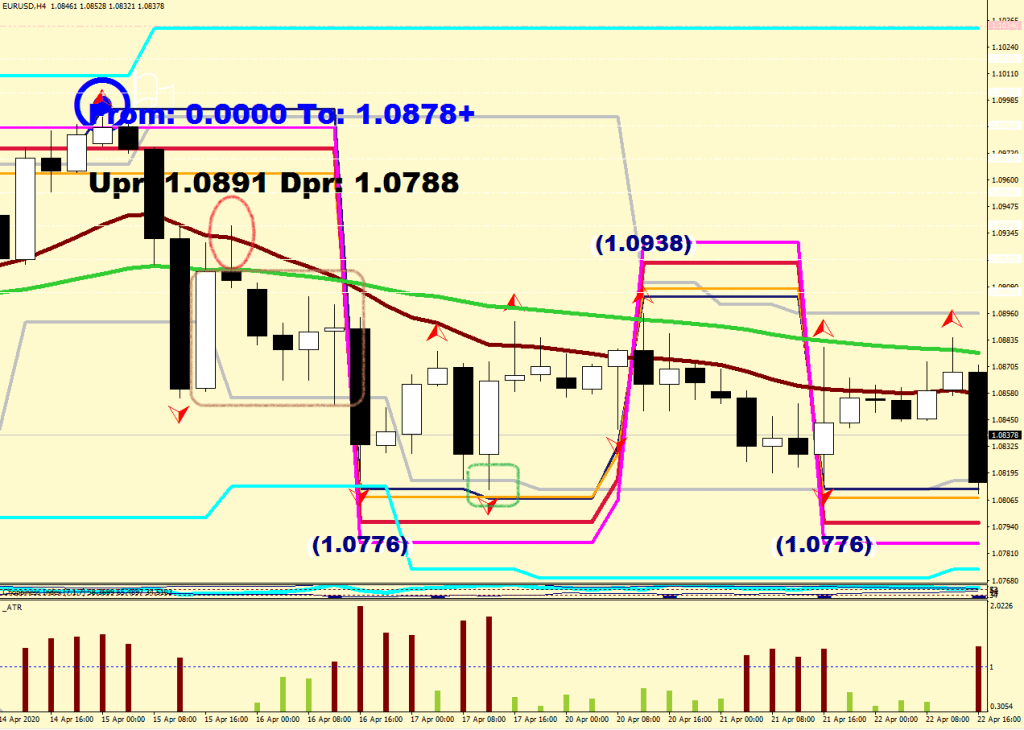
The market starts stair stepping down until things get over-heated to the downside

  1. The First parabolic move (circle #1) gets a quick reaction – like going into water that is too cold
  2. The Second parabolic move gets a bigger reaction
  3. There is a quick beat of this para move that brings about a relief rally
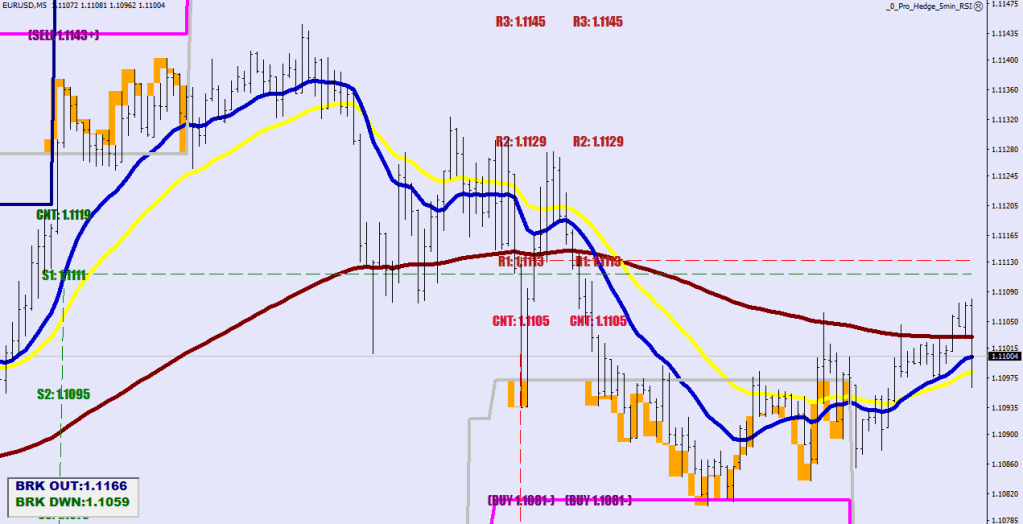
  4. The Market currently is in engaged with the downside, and it is in a pursuit of a break out
  5. R1 resists on the upside (very limited upside motion / volatility)
  6. The Pursuit of the break out fizzles out without reaching the Green break out level and R1 gets violated on the upside instead
  7. The Market has turned back up
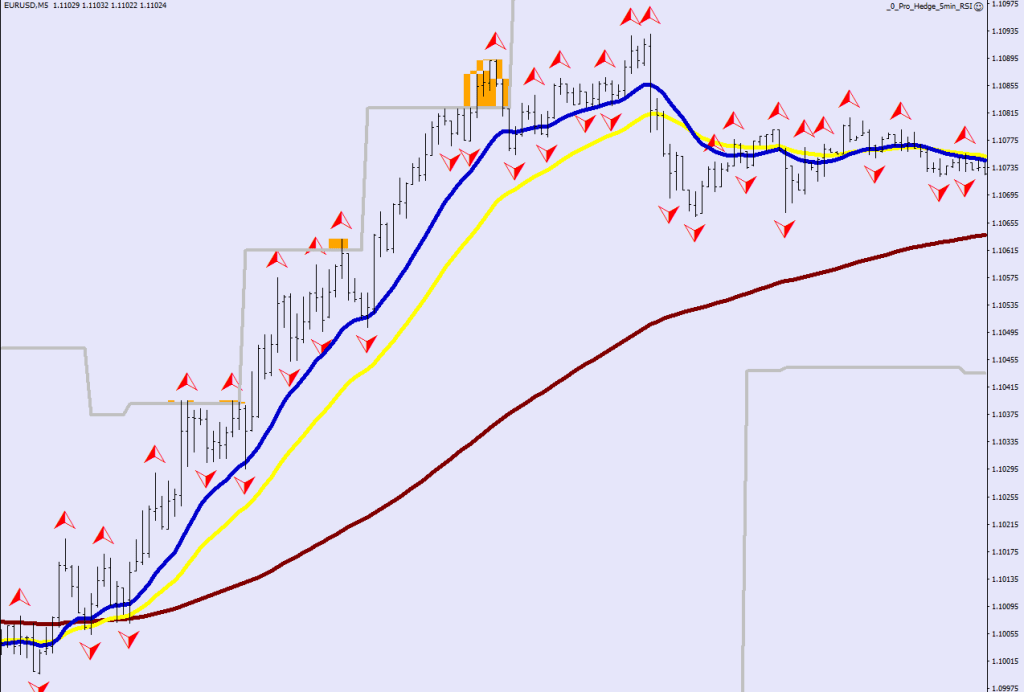
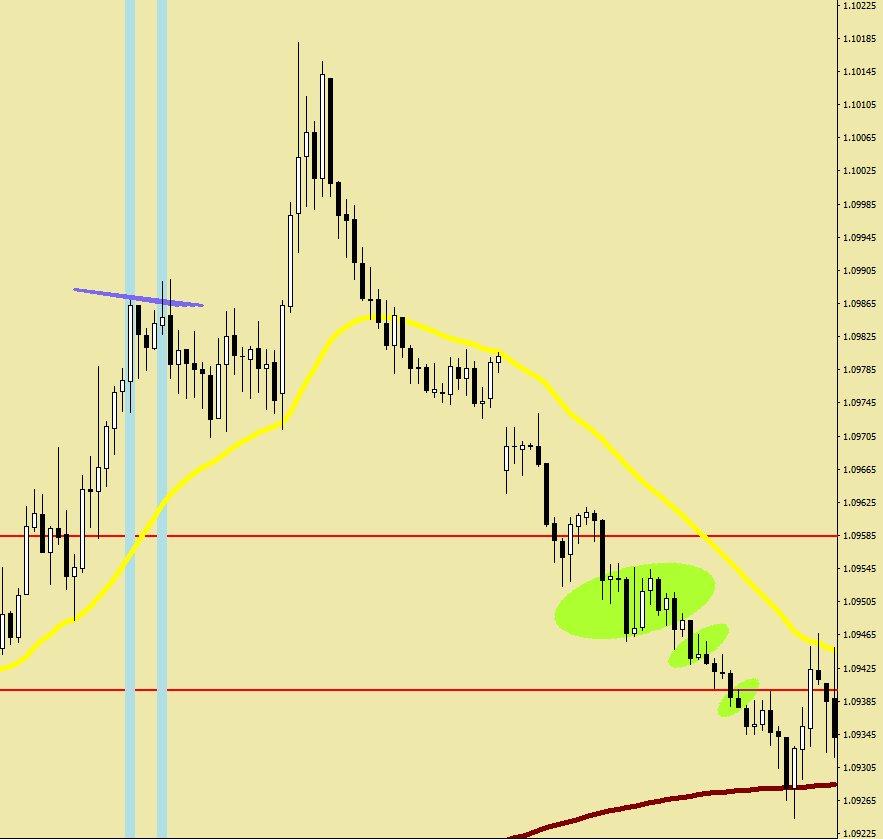
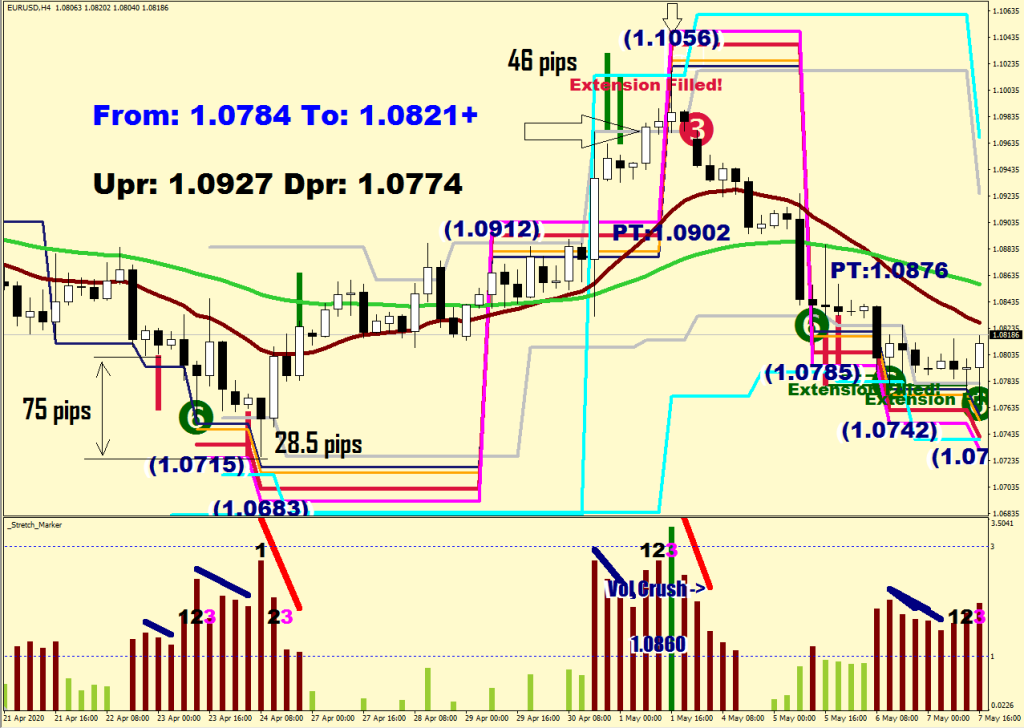
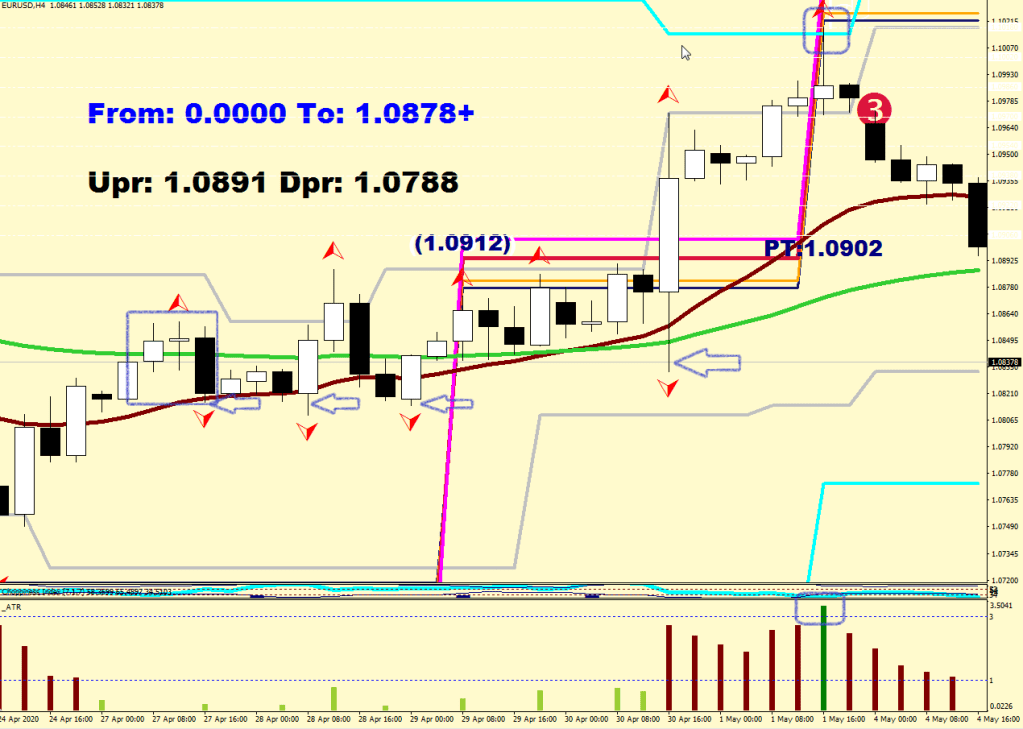
  1. The Market goes ballistic on the upside
  2. The Parabolic tail goes beyond the magenta – in Pursuit of a break out
  3. The gray neckline, where price went parabolic (arrow), does not get violated – this is still the same wave up – likely a Wave 3
  4. The Break out is finally happening – the Navy line
  5. There are 3 attempts, but the break out only registers about 11 pips, so it is unsuccessful (<16 pips) => back to the last continuation level of 1.0938 (CNT on the screen)
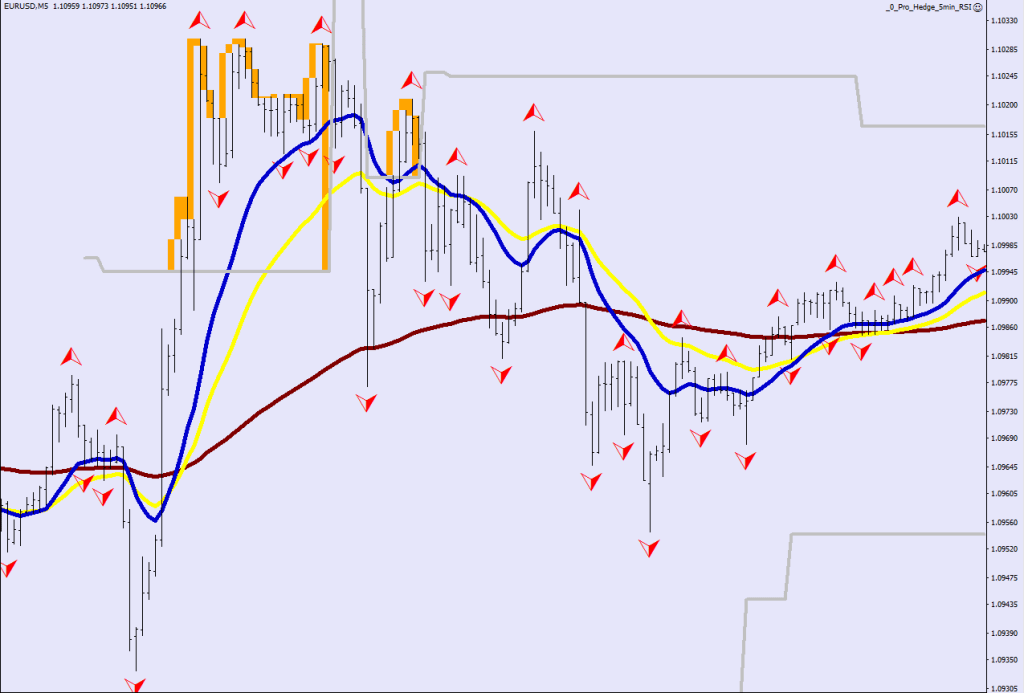
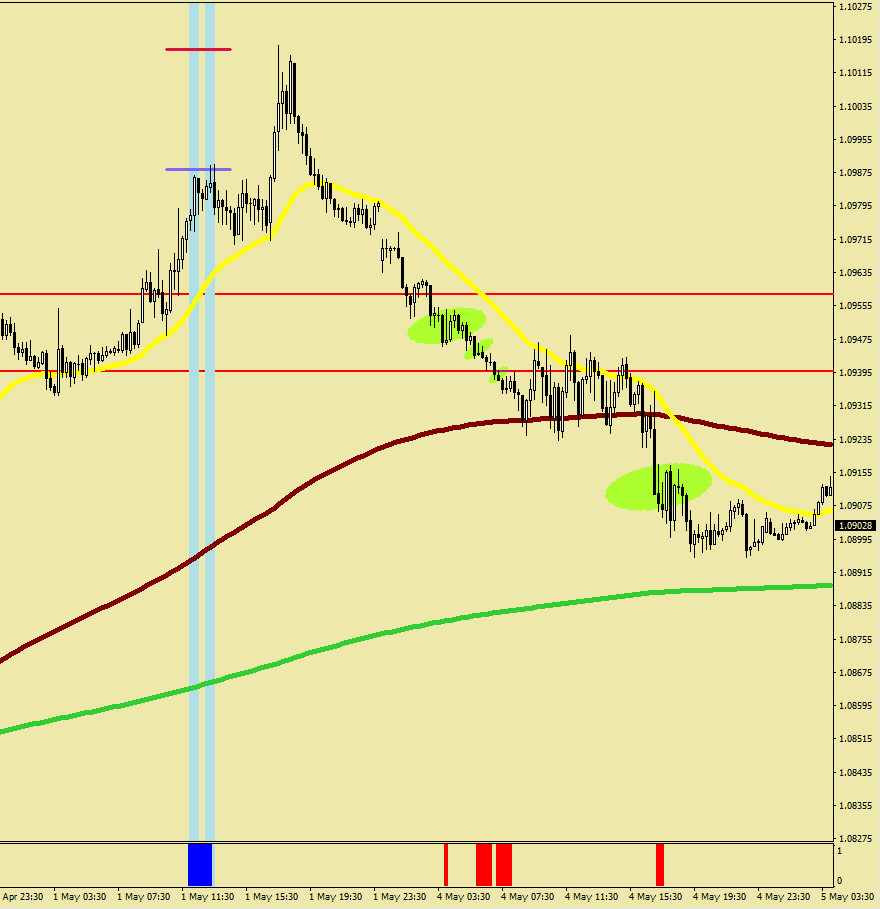
  1. Here you see the next parabolic move that is in instant pursuit of ta break out.
  2. 3 Attempts in quick succession, but the break out isn’t happening.
  3. With one more parabolic (echo) wave up the support levels (and the break out level) gets re-adjusted
  4. S3 is the next buy after the capital failure
  5. E-135 on the way up yields to the move
  1. The next leg up starts after a quick spooling around the E-135
  2. It overheats a couple of times, and keels back to the continuation level – just shy of S1 – this is likely still the same wave – most likely a Wave 5
  3. They buy the 3 pullbacks just beyond the E-16 – this is definitely a Wave 5
  4. Price is in Pursuit of a break out

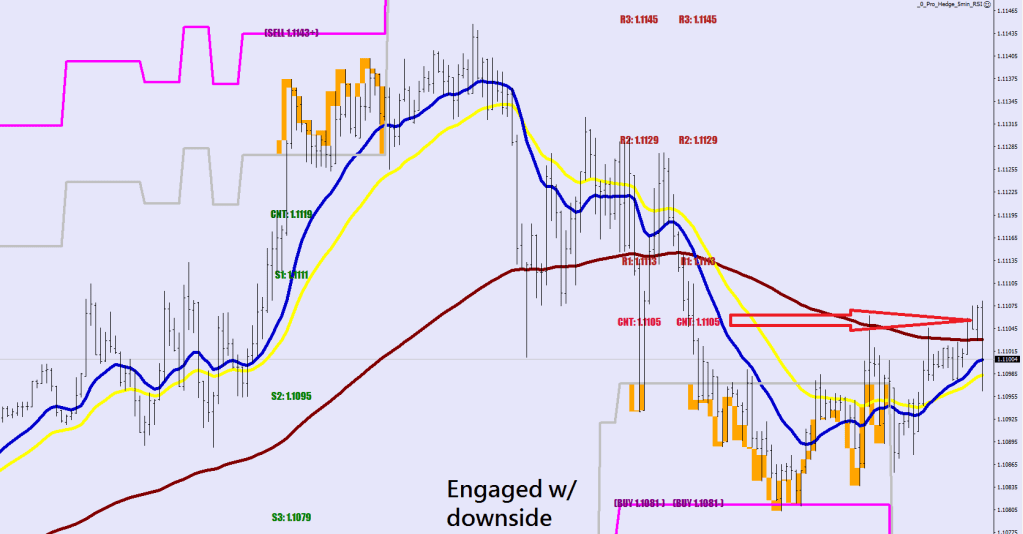
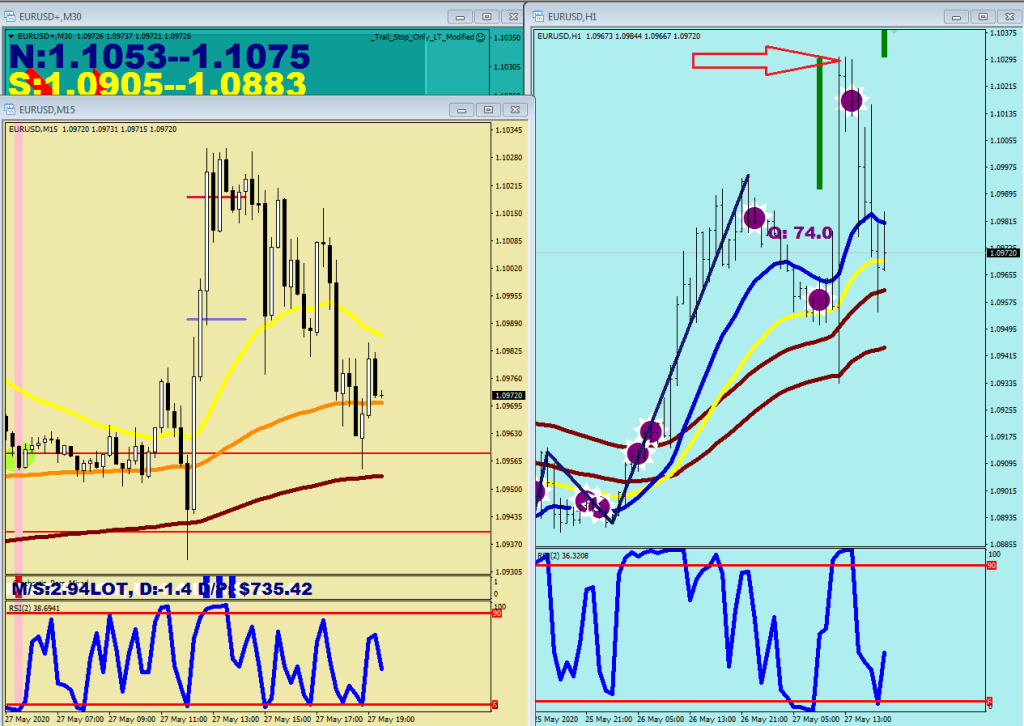
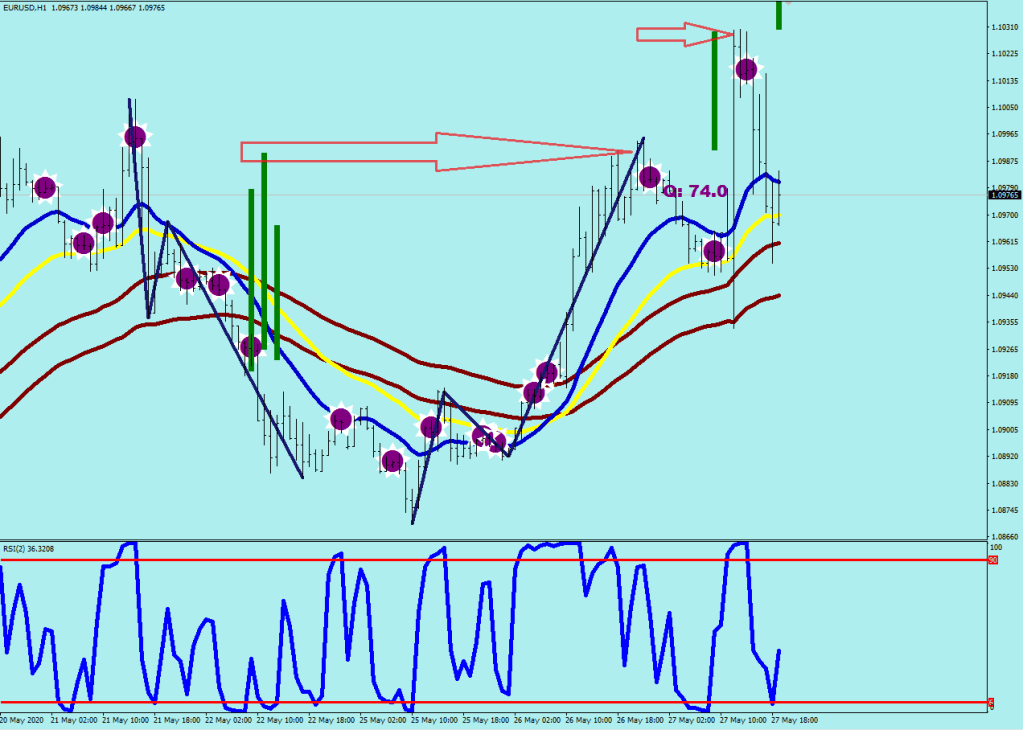
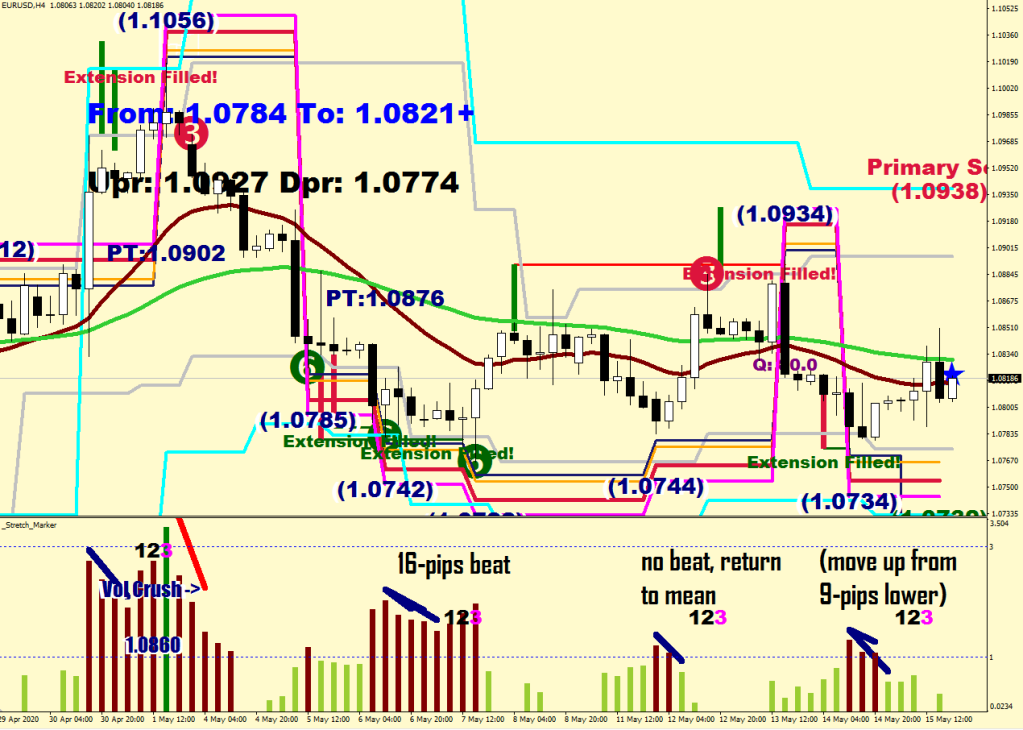
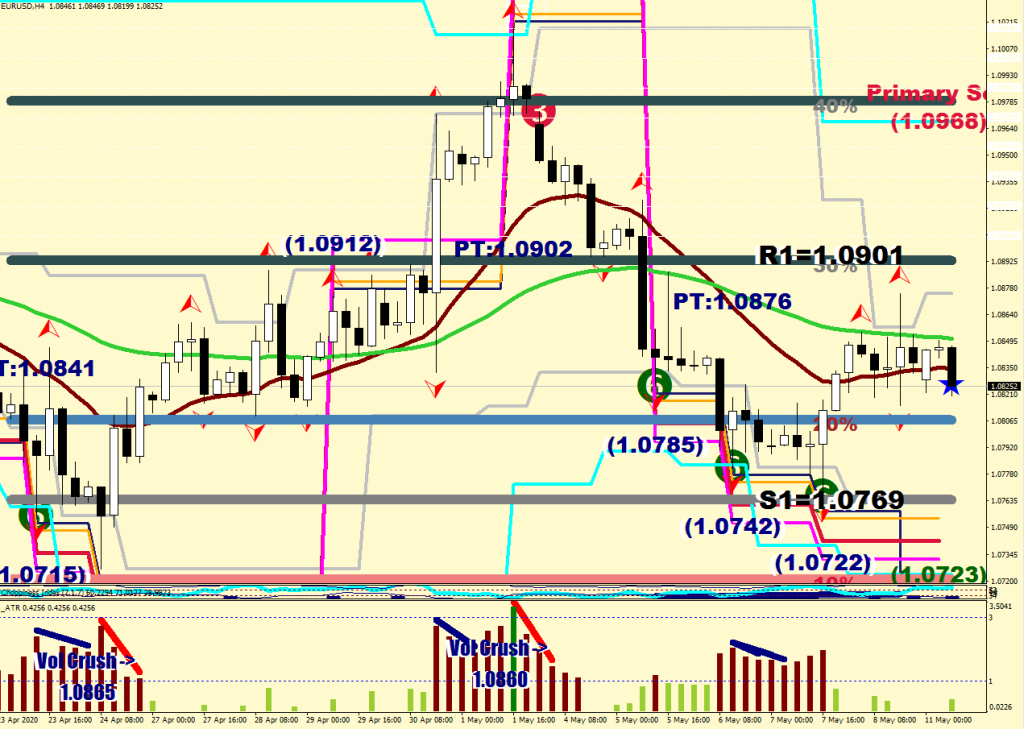
Which brings us to last Friday

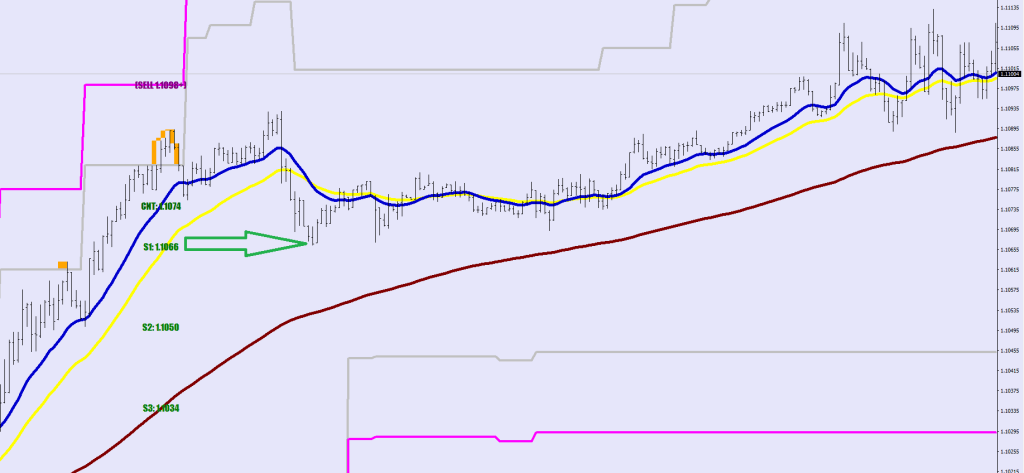
  1. The break-out finally happened (>16 pips)
  2. A large correction to S3 is logical & was almost reached
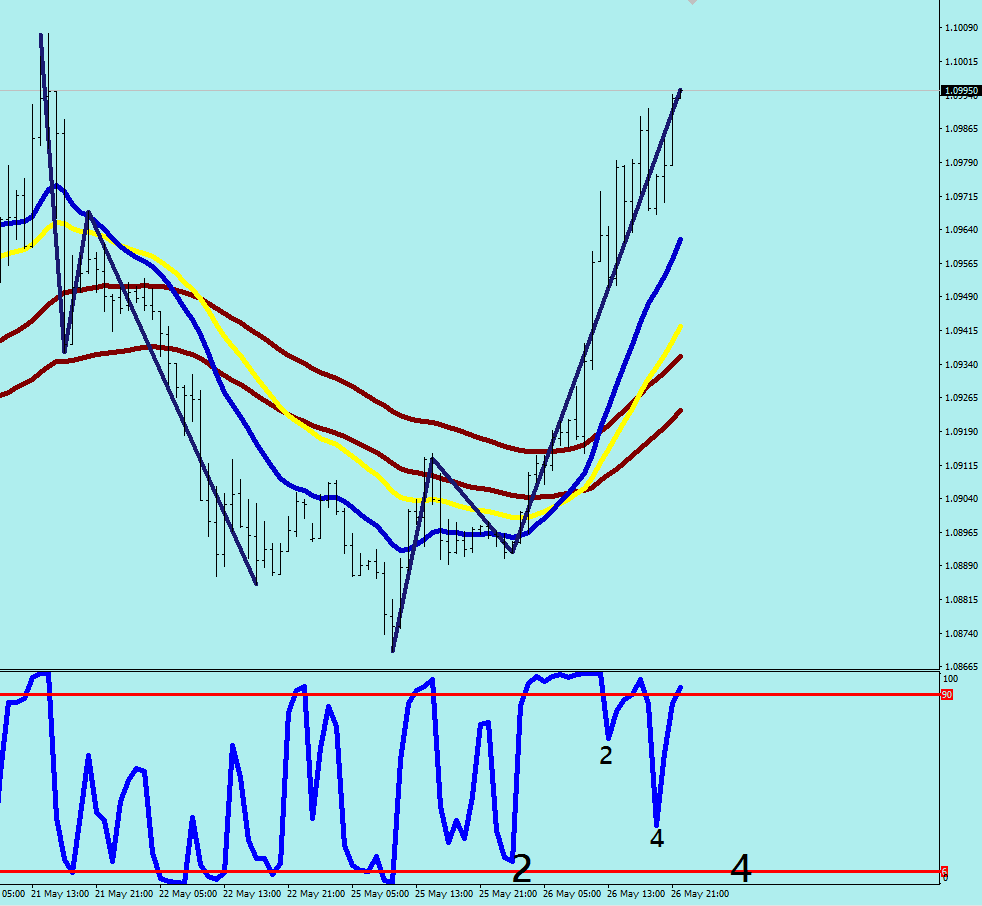
  3. The market engaged with the downside
  4. It is in Pursuit of break on the downside
  5. Price only made it back to the E-135 where it failed (shy of R1)
  6. It is still the same wave down, most likely a Wave 1 which in theory should come in contact with Mr. Maroon before it ends
  7. Mr. Maroon currently is from 1.1056, but it is coming closer of course
  8. A Mean Reversion would take price back to 1.0960
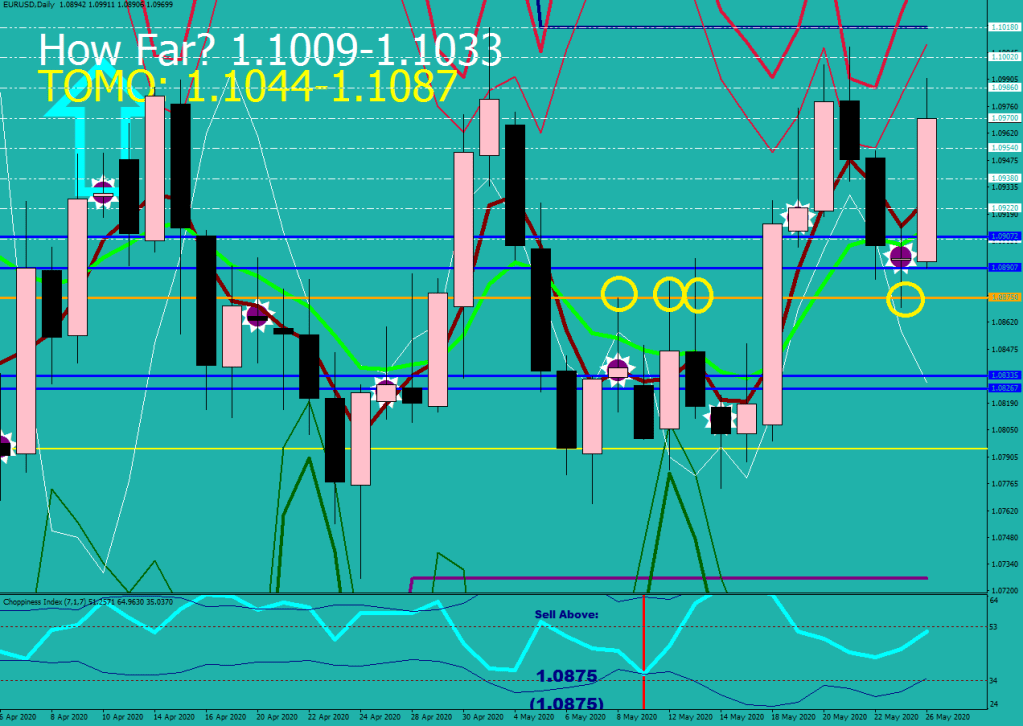
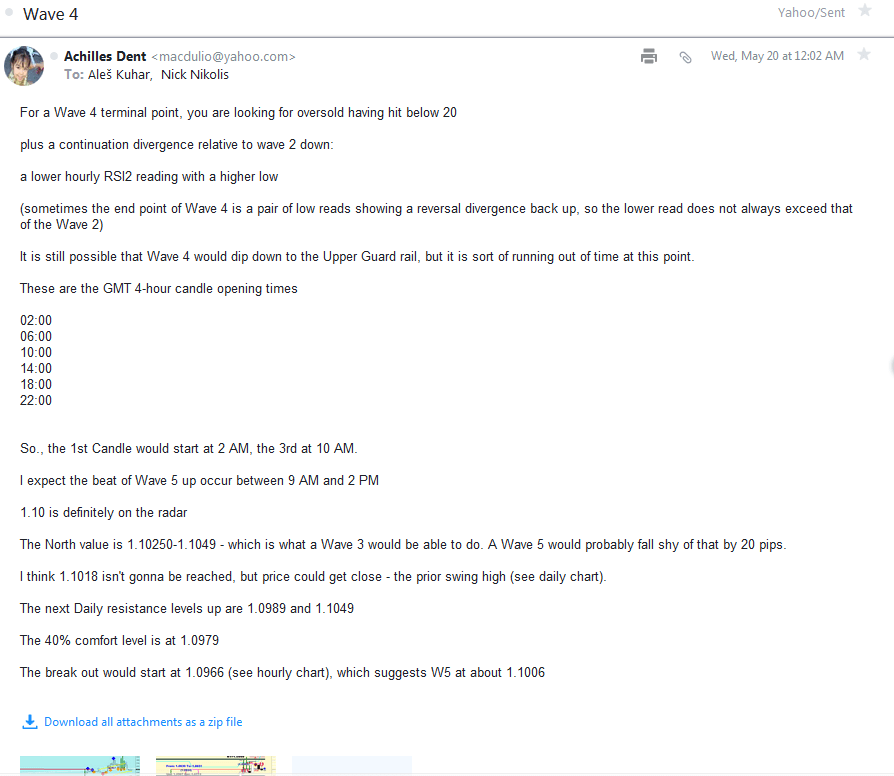
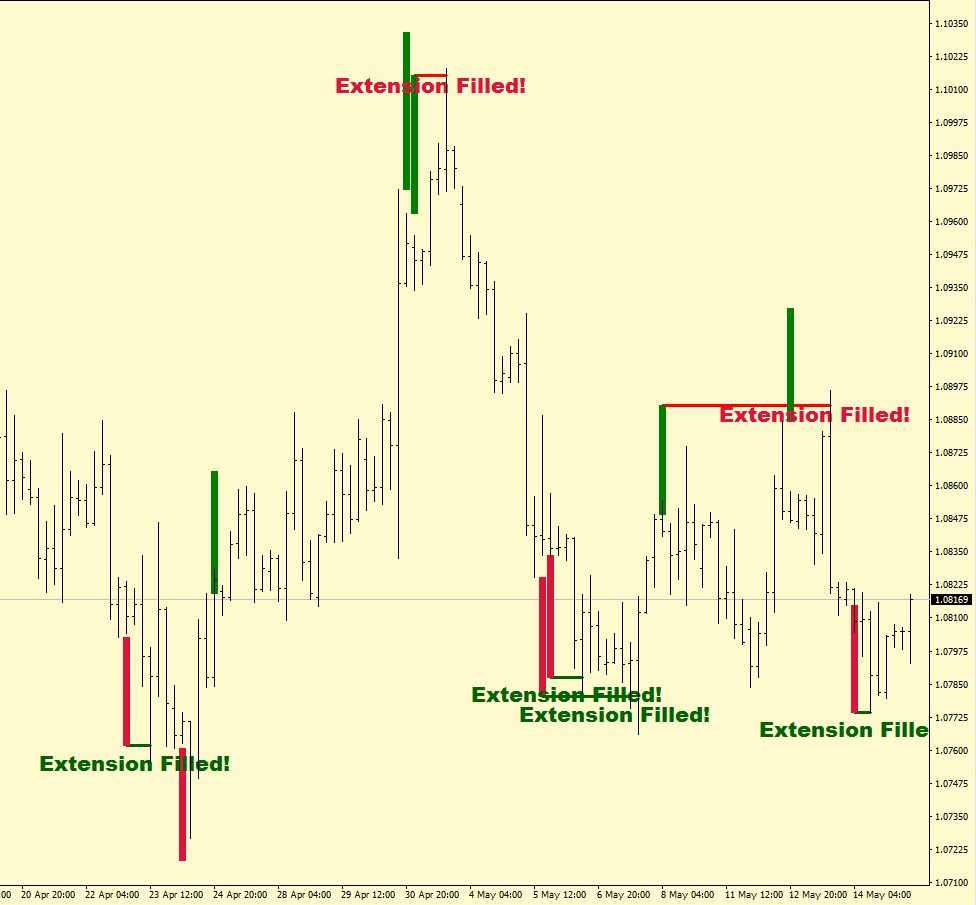
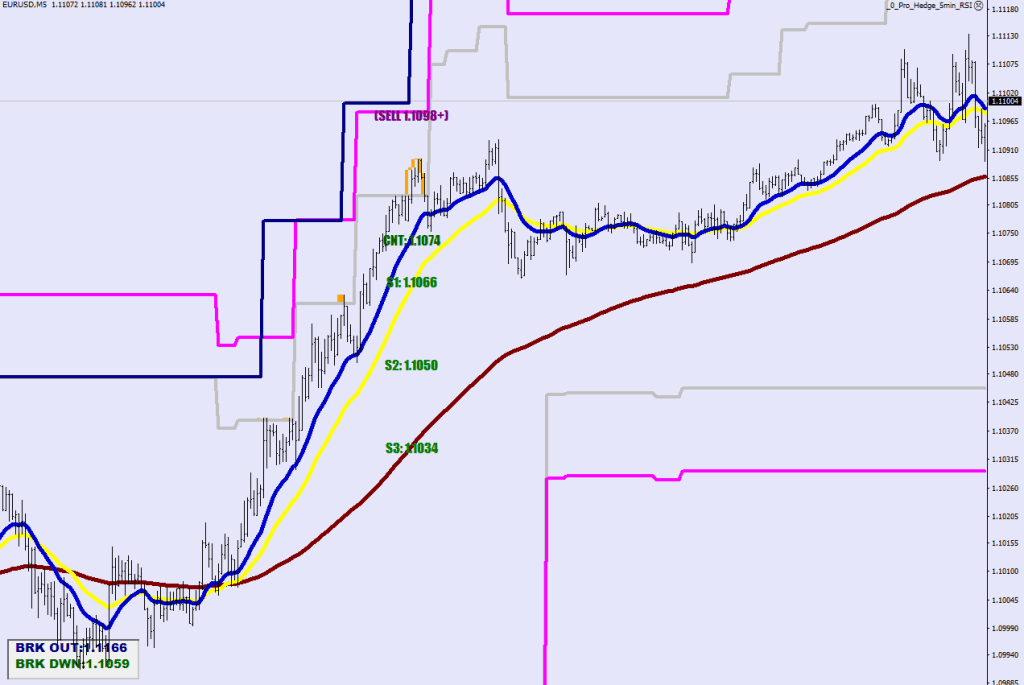
Extension fill – added for a more complete picture

R1 and S1 now held out

Parabolic Tail – 5 min

Fractals, that barely made it back beyond the E-16 invoke the new Fluctuation Sized range limit. If you still had any doubts, that the Euro’s fluctuation size is 32 pips – well, check it!

There’s a prelude & then there is an opportunity to get in on the exponential move – until not enough rest is made and you catch up with the limit.

The moving averages are: E16 Blue, E32 Yellow & E135 Brown

Change Lookback value for more history.

If a Wave 4 runs in high octane in 3rd gear (dip below E32 is a buy) then a parabolic tail is kerosene and 5th gear (E16).

#property copyright "by Macdulio" 
#property link      "forexfore.blog" 
#property description "Parabolic Tail for 5 min."
#property indicator_chart_window
#property indicator_buffers 2


//--- input parameters
extern int lookback = 70;
extern double FSize=32;
double FMax = FSize*6/5;
//--- buffers
double E16[], E32[];
double HiBuffer30[],LoBuffer30[];

//+------------------------------------------------------------------+
//| Custom indicator initialization function                         |
//+------------------------------------------------------------------+
int init()
  {
   
//---- indicators
               
   SetIndexBuffer(0,HiBuffer30);
   SetIndexStyle(0,DRAW_LINE,2,4,Silver);
   SetIndexLabel(0, "FSize Plus");

   SetIndexBuffer(1,LoBuffer30);
   SetIndexStyle(1,DRAW_LINE,2,4,Silver);
   SetIndexLabel(1, "FSize Minus");
 
//----
   return(0);
  }
int deinit()
  {
//----
   ObjectsDeleteAll();
//----
   return(0);
  }
int start()

  {

   int    i;           
  
  string symbol = Symbol();

     ArrayResize(E16, Bars); 
  ArrayInitialize(E16, EMPTY_VALUE); 
  ArrayResize(E32, Bars); 
  ArrayInitialize(E32, EMPTY_VALUE); 


//--------------------------------------------------------------------


 for(i=Bars-100; i>=0; i--){ 
 
     E16[i]=iMA(symbol,5,16,0,MODE_EMA, PRICE_MEDIAN,i);
     E32[i]=iMA(symbol,5,32,0,MODE_EMA, PRICE_MEDIAN,i);
 
 }
 
deletetxt1("ORANGINA"); 
 
  for(i=lookback; i>=0; i--){ 
 
     HiBuffer30[i]=HiBuffer30[i+1];
     LoBuffer30[i]=LoBuffer30[i+1];
   
     if (E16[i]>E32[i] && E16[i+1]>E32[i+1] && E16[i+2]>E32[i+2] && E16[i+3]>E32[i+3] && E16[i+4]>E32[i+4] && E16[i+5]>E32[i+5] && Low[i]<E16[i] 
     && iFractals(symbol,0,MODE_LOWER,i)
     ) HiBuffer30[i]=Low[i]+FSize*10*Point;
     if (E16[i]<E32[i] && E16[i+1]<E32[i+1] && E16[i+2]<E32[i+2] && E16[i+3]<E32[i+3]  && E16[i+4]<E32[i+4] && E16[i+5]<E32[i+5] && High[i]>E16[i] 
     && iFractals(symbol,0,MODE_HIGH,i)
     ) LoBuffer30[i]=High[i]-FSize*10*Point;


     if (High[i]>HiBuffer30[i]){
         ObjectCreate("ORANGINA"+i, OBJ_RECTANGLE, 0,  Time[i+2], High[i], Time[i], HiBuffer30[i]);
    ObjectSetInteger(0,"ORANGINA"+i,OBJPROP_COLOR,clrOrange);
    ObjectSet("ORANGINA"+i,OBJPROP_BACK,1);
    ObjectSet("ORANGINA"+i,OBJPROP_WIDTH,5);}
    
    
       if (Low[i]<LoBuffer30[i] ){
         ObjectCreate("ORANGINAL"+i, OBJ_RECTANGLE, 0,  Time[i+2], Low[i], Time[i], LoBuffer30[i]);
    ObjectSetInteger(0,"ORANGINAL"+i,OBJPROP_COLOR,clrOrange);
    ObjectSet("ORANGINAL"+i,OBJPROP_BACK,1);
    ObjectSet("ORANGINAL"+i,OBJPROP_WIDTH,5);}
      
     
}  		
  		
  	
//----
   return(0);
  }
  
void deletetxt1(string what){
   for(int iObj=ObjectsTotal()-1; iObj >= 0; iObj--){
      string   on = ObjectName(iObj);
      if(StringFind(on, what) == 0)  ObjectDelete(on);
}  }

now with levels

Pay attention to how price came back only to the last Continuation level after making that quick dip. Support 3 was bought right after.
Support 1 was bought.
Currently the market is engaged with the downside. The continuation level was not exceeded successfully.

Aleš’s Lessons #4 – Wave 3

The 5 waves down wasn’t too hard to figure I hope.

On the 4 Hour you can see the trend line that they purchased again.

I know, this volatility crush did not make it to 1.0865, it was bought right below 1.0870.

Look, how crucial that 1.0875 has been!

Back to the Waves.

Nobody’s teaching this, it is my finding – thanks to using my own moving averages and plotting the highs and the lows out of habit.

Wave 1, 2 and 3 all cross through Mr. Maroon, Wave 4 and 5 usually does not make it beyond E32, they usually start from between E16 (Blue) and E32 (Yellow).

What makes a Wave 3 a Wave 3? It is the only wave capable to sustain a move beyond the sound barrier / brownies and usually would make a run to the daily potential, which is 1.0-1.3x the ATR of the last 3 days.

This is why the LEMA 30 RFC plots a giant #3 when the fluctuation maximum gets exceeded by a wave. As you can see, the starting point of Wave 5 down was also apt.

The 15-min ATR plots the orange field of where the end of Wave 3 is expected to land – in this case it was from 1.0973-1.0995

Rules of a Wave 3: do not defy a Wave 3.

Hints of riding the Wave 3:

You buy every 5-minute pullback to / beyond the local E-32 until (when it is above the E-135) the last absolute high exceeds the previous absolute high by more than 5 pips.

The criteria that I used for the auto hedger is that the highest high of the last 10 bars has to be larger than the highest high of the bars from 11 to 37.

As for the Stochastic Bars Stripy, I’m not sure if I’m going to make any changes, as for the strike out may seem on the early side, but the range (station) it called accurately.

They say a top is a process, a bottom is an event. There is some truth to that.

Here you can see Wave #1 failing at the Sound Barrier.

For Wave 5 now you are looking at 1.1050 with a slight chance of roll over in the low 1.103x-s

The Energy Bands would likely be from 1.1046 to 1.1091

The 50% comfort level is at 1.1065

Wave 4 down is due. They made it rally into the close as they always do to leave the cash market with maximum pain.

They improved on the last high by 3.9 pips (<5).

Wave 5 up was an extension fill (Projected Distance 240)

(so was Wave 3)

Adding The Greenery

Tops and bottoms. The Name of the game.

You may have seen this last shot.

You have not seen some of the past history.

I worked on the bottom – projections.

Projected distance and the “Forest” are some of my oldest ideas, they were in my book, the Computer Aided Trading, and they are still relevant today.

The Forest works when nothing else does: the market is merely making steps in a direction without any conviction.

The Green lines are a version of the Forest.

What does the Forest say? Ding-ding-ding-ding ding diring – buy here & here.

In this case only the first number gets its fill – & projected distance above clips the top.

See, there are no stochastic bars below, and I can still give you the buy level.

The Pink is a warning that things may be flipping up soon – and sometimes it would turn the price without further enforcement.

Here’s the worst example I could find, where I missed the top by 30 pips (from the horizontal needle). Hmm… What does that number remind you of? Well, a fluctuation size is 32 pips for the Euro. The train never left the station, just pulled forward all the way to the end.

Let’s implement the close-to-the-other-end-of-the-station-marker then…

Better.

It would further explain this move, although the strike out was in the right place already.

So is this the smartest thing I’ve ever done? Aside from creating a hedger making use of the strike outs and considering to make a cropper with the same conditions but a bit delayed as a step two, yes.

Stochastic Bars Stripy is born.

The Smartest Thing

I have over 3,200 connections on LinkedIn.

I put them with this question:

What is the smartest thing you have ever done in your life?

There was an image I posted with the question.

I was expecting some interesting stories and reflection on past lives, any aspect of them, freely.

This is what I got instead:

Bummer…

Aleš’s Lessons #3 – Thinking Ahead

This was the email I sent out to my 2 students at midnight.

In text format:

For a Wave 4 terminal point, you are looking for oversold having hit below 20
plus a continuation divergence relative to wave 2 down:
a lower hourly RSI2 reading with a higher low
(sometimes the end point of Wave 4 is a pair of low reads showing a reversal divergence back up, so the lower read does not always exceed that of the Wave 2)

It is still possible that Wave 4 would dip down to the Upper Guard rail, but it is sort of running out of time at this point.

These are the GMT 4-hour candle opening times
02:00
06:00
10:00
14:00
18:00
22:00

So., the 1st Candle would start at 2 AM, the 3rd at 10 AM.
I expect the beat of Wave 5 up occur between 9 AM and 2 PM
1.10 is definitely on the radar
The North value is 1.10250-1.1049 – which is what a Wave 3 would be able to do. A Wave 5 would probably fall shy of that by 20 pips.
I think 1.1018 isn’t gonna be reached, but price could get close – the prior swing high (see daily chart).

The next Daily resistance levels up are 1.0989 and 1.1049
The 40% comfort level is at 1.0979
The break out would start at 1.0966 (see hourly chart), which suggests W5 at about 1.1006

Yes, that is R1=1.0999 up there. Automatic as everything is with me.

The actual beat high was 1.0999 and came 1 hour 15 minutes after my suggested window.

Wave count

Kbuy = Kangaroo Tail Buy

Take a Purple Peak

15-min AI – real time

Aleš’s Lessons #2 – Advice Highlights

We left off with this choice:

When you have a missing beat, you need to consider the possibility that it would stay without beat for a while: it may be a higher low or a lower high, thus it is a root of a new trend -> trend line. I made the plot automatic.

Price broke through every resistance level in one day, so now it could make a reach for the energy bands.


Daily Resistance levels:

1.0951

1.0989

1.1049

The Sell / Beat at 1.0947 in red sounds about right. The purple dash represents a liquidity break. A liquidity beak falls short of a full lambda move, for they step in and buy it up aggressively.

On the 15-minute you need to see a fractal without stochastic bar print (yellow example).

This was the entry.

I would consider Wave 3 finished now with this wave 5 of Wave 3 print.

Next there should be a Wave 4 down which would make the hourly 9-sample stochastic go oversold at least once (<20) and the hourly RSI2 twice (<6). Keep an eye on E32 in yellow for the start of the last Wave (5) up, which may attempt to fill the latest extension beam(s). An extremely deep Wave 4 would walk into Wave 1. I’m mentioning this because the Wave 3 up printed a “shape” which is likely going to reject price down real good due to the parabolic end. Look for a hourly ABC correction to go long again.

wave 5 of Wave 3

They managed to play this up to the Primary Sell Level filling an extension as well along the way. The target is Mr. Maroon.

The market is now more than 3x stretch away from the mean.

Primary Sell was hit, the extension was filled, the energy bands were hit and a prior trendline got back tested.

& the RSI2 divergence got doubled down on

Aleš’s Lessons #1 – Mean Reversion Timing

Hi,
For timing the mean reversion this is what I was talking about with the 12 hours. The following trades I refer to as “Secondary entries”.

The blue trend lines are to draw attention to the prolonged decline in the distance from the mean, they set off the counter. (The Red in general is a confirmation line).
I marked up the reversals that are defined by a beat of the current outlier and time: 8-12 hours or 2-3 4-hour candles. So, work out when the 3rd candle would start by comparing the broker’s time with your time zone.I am for instance 2 hours behind, so if the 3rd 4-hour candle was to start printing at 16:00, i should start looking for the beat of the outlier from 13:00 (the last hour of the 2nd candle). You can place pending orders too, but you would not know the entire size of the beat, which in an extreme case can be as much as 65 pips. So spread out your orders, pace them. A typical beat would be 4-20 pips, so you do want the placing orders maybe at 4, 8, 12 pips out – and add later. What you are aiming for is a mean reversion, so check where the green line was on the previous candle and use that as a reference.

The image that shows a 5-pips beat (on cue) is a shallow one. So a 4-pips pending order would get a fill, but no other. You could add to the position upon crossing back above the low of the candle (buy stop) a few pips out or above the high of the candle it prints.

Take some of the risk off the table when physically touching the green line (1/4 – 1/2) and adjust the remainder’s stop loss to somewhere in gains.

What about the chaotic looking bottom with the overall 75 pips beat?There is a projected distance beam, and you should not be buying before it gets its match. Start buying at that level.
When the extension was filled, the bottom was less than 30 pips away.
What happens when there is no beat in the next 12 hours? Price went after the projected distance value on the upside (a move was in progress still – an alternative approach would be to get in on the extension fill and target the missing beat). The beat may arrive later. In the last example the 9-pip beat was reverted back to the mean – and it was an extension fill as well.

Set the lookback value higher to browse more history on the indicator. A 4H time frame comes with about 162x candles of buffer.


Mac

Extension Filled

Fibonacci is only in your head.

If you want to say closer than 2/3 of the way, why isn’t “less than” 66% good enough for you, what do you need that 61.8% for?

Fibonacci does not own a patent for “Extension” just as 50% and 150% are not Fibonacci Numbers. The market progresses in 50% increments, not 62.8 and not 25.7

A low volatility market can turn on a dime, and any low volatility market does not exceed a stretch of 3x maximum fluctuation size from the mean.

Shouldn’t you be trying to figure out the maximum fluctuation size of your instrument, the identity of the mean and obtain a Projected Distance 240 from me in exchange for some donation? I certainly think so.

     if (iHigh(NULL,240,i+1)-iLow(NULL,240,i+3)>ATRAVG[1] && iHigh(NULL,240,i+1)>iHigh(NULL,240,i+3)) {
             LowBuffer[i]=iHigh(NULL,240,i+1);
             HighBuffer[i]=iHigh(NULL,240,i+1)+(iHigh(NULL,240,i+1)-iLow(NULL,240,i+3))*.5; 
             
             if (Period()==240 && i>2){
               j=i-1;
               while (j>0){
                  if (High[j]>HighBuffer[i] && Close[j]<HighBuffer[i]) break;    
                 j--;            
               }
               if (High[j]>HighBuffer[i] && Close[j]<HighBuffer[i] ) {
               
                                
                 ObjectCreate(0,"Projected"+i,OBJ_TREND,0,Time[i],HighBuffer[i],Time[j],HighBuffer[i]);
                 ObjectSetInteger(0,"Projected"+i,OBJPROP_RAY_RIGHT,false);
                 ObjectSet("Projected"+i,OBJPROP_COLOR,clrRed);
                 ObjectSet("Projected"+i,OBJPROP_WIDTH,3); 
                 ObjectSet("Projected"+i,OBJPROP_BACK,1); 
                 
                  ObjectCreate("Projected"+IntegerToString(j), OBJ_TEXT, 0, Time[j+2], HighBuffer[i]+20*Point);  
                ObjectSetText("Projected"+IntegerToString(j), "Extension Filled!", 16, "Arial Black",  clrCrimson);
                 
                 
                 }
             }
             
         }

Welcome to my world of qualifying moves and target projections.

The Mean Reverting Instrument

I’m starting to get fed up with the countless cowboys popping up on YouTube channeling their misunderstanding of how the market works, their pseudo knowledge.

We’ll start nice and slow, so that everyone would be able to follow.

This is a 4-hour chart.

The important plots are

– the Green River (E52 median)

– Mr. Maroon (E17 median)

– Fractals

– Stretch Marker (on the bottom saying ATR) free source in my post, Disappearing Volatility

– and the latest version of 36 Only VRLD – that is attainable from me in exchange for a donation.

We pick up at the end of January.

On the Stretch Marker Below, you can see a move failing to sustain above 1x stretch from the mean. This is our current starting point.

Then price made a 2-candle crack & close below the Green River.

All systems go to the downside.

The market was trending lower ever missing the middle of Mr. Maroon and staying off of the cyan line, which is a displacement of the swing lows by a fluctuation maximum of the EUR/USD –

until the following thing(s) happened.

The volatility started declining. See slanted blue lines. Mr. Maroon was popped and violated again (Primary target fill). There were 4 fractals lining up at approximately the same height.

I will let you circle where the Green River was crossed over with two closes and there was no weekend gap potential.

All systems no go to the upside.

The first cyan encounter was a bust for the candle just ripped through and never looked back.

The second encounter made its reaction, but the Primary Target was not reached, the move failed next to Mr. Maroon – makes sense to lighten nearby.

Something ridiculously important happened on the bottom. Price went beyond 4x stretch from the mean. From here on the cyan line switches from Primary Sell to Spiral Buy.

Everything is a buy: break-outs at the Cyan line as well as all the beats at the other side or Mr. Maroon. The whole thing goes exponential until the stretch from the mean reaches a 9.5 multiplier, and price becomes unable to sustain above the Cyan fluctuation maximum displacement. This is the primary failure which had its target set at the last read of Mr. Maroon at 1.1236 and the secondary failure followed soon after with a reach & fail for the top (with volatility having started to decline). The secondary fail’s target is the location of the mean, which was at 1.1138 at the previous 4-H candle.

After that you see a cross over of the Green River, then a failed attempt to break above it.

The consolidation that takes places below the Green River comes with playable upside. The Primary Buy can’t fulfill its full length target, only manages a touch of Mr. Maroon further down, right after the Secondary Buy gets called in with a re-visit of the low, which does ultimately manage full length at 1.1220 and change.

All systems go to the downside again.

On the way down the Cyan (Maximum Beat) line fails to hold, and the Cyans transition from Primary Buy to Spiral Sell with the stretch from the mean rising above 4x again.

We end up with a mirror image more or less of the reversal at the top: 9.5x stretch from the mean, a 3-candle volatility drop, which sets the primary target as shown by the arrow, and the secondary buy gets called in at the re-visit and slight beat of the low.

The Green River gets crossed over again, the pullback to Mr. Maroon is a buy again until a Primary Sell appears at the cyan line failure.

There is no secondary entry this time: this is a continuation lower low down. P.T. on the screen.

You get to circle the first failure for crossing over the Green River on the image above.

But the Green River does get crossed. You get 20+ hours of consolidation to get in on a short as close as possible to the Green River.

The bottom is very familiar again. A failure at the Cyan line is the Primary Entry with its target listed – and there is a the 3-bar volatility decline. The Secondary entry shows up as an RSI2 divergence (Yellow bulls eye) with its slight beat. The Secondary Target is 1.0909 or so.

After the Green River gets crossed over, the pullback to the other side of Mr. Maroon (& the River) is a buy.

There is a problem this time: price failing to sustain above 1x stretch from the mean, although it tries 3 times. The bulls eye dot is the RSI2 divergence that the beat sets up, and this makes for the next continuation swing Lower High.

The Green River gets crossed over, there is no way back, a consolidation occurs at the other Bank.

The Primary Buy signal gets missed by a few pips. A Secondary Buy emerges with the close range potential of touching the Green River. Counter direction has its limitations.

The other side of the Green River can be utilized for a continuation entry down for it is a lower high again.

The familiar bottom again. Cyan violation = Primary Buy, re-visit / undercut (this time by 25 pips) is the Secondary Buy.

On the way up the Green River gets crossed over and the buying at the other Side of Mr. Maroon / Green River persists.

A Primary Sell sets up with the Cyan violation at a healthy 3x stretch from the mean. Target prints. The is no Secondary sell opportunity granted with the gap down over the weekend.

The Green River was crossed down. A consolidation took place below with an additional rejection. The Primary and Secondary buys both got their exits filled.

Price from here can go both ways, there is no Edge here, the last move was up, but price did not cross over the Green River yet. It would be easier to consolidate below the river, maybe even fail it again, but this could be all waived by a gap up and stay or a quick move up and a consolidation on the other side.

Although I can’t give you a call here, at least now you have something appropriate in your head about how the market really operates.

Introducing the color of confirmation