On the trading floor back in 2014 I remember how puzzled I was over these s1,s2,s3 “statistical” support and resistance plots on my neighbor’s screen. I was always sceptical of the one size fits all solutions.
6 years later I feel like I am the only person in the world that can figure an R1 and an S1 accurately.
See, there is no instrument independent calculation. The measuring points for the upside never coincide with the downside’s, they are not opens or closes, they have nothing to do with trading sessions, trading ranges, so not even ATR.
How can you get all of the above wrong and arrive at the right conclusion?
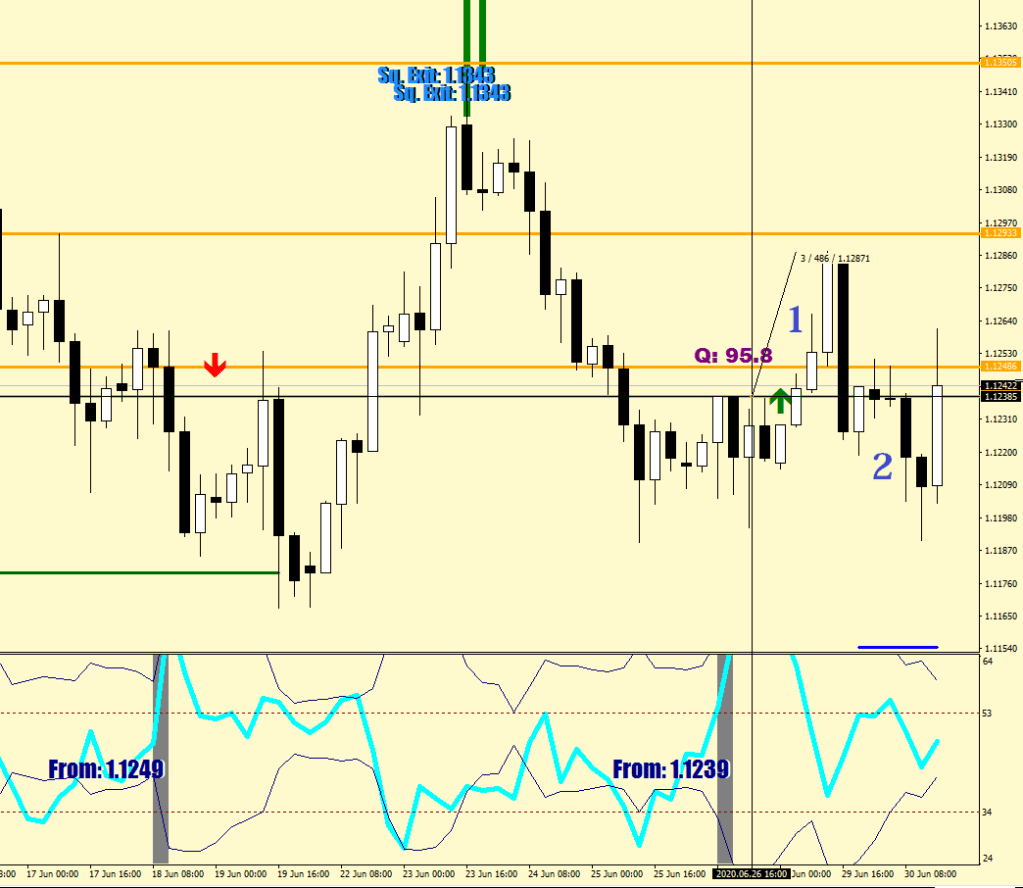
I posted this image the other day.
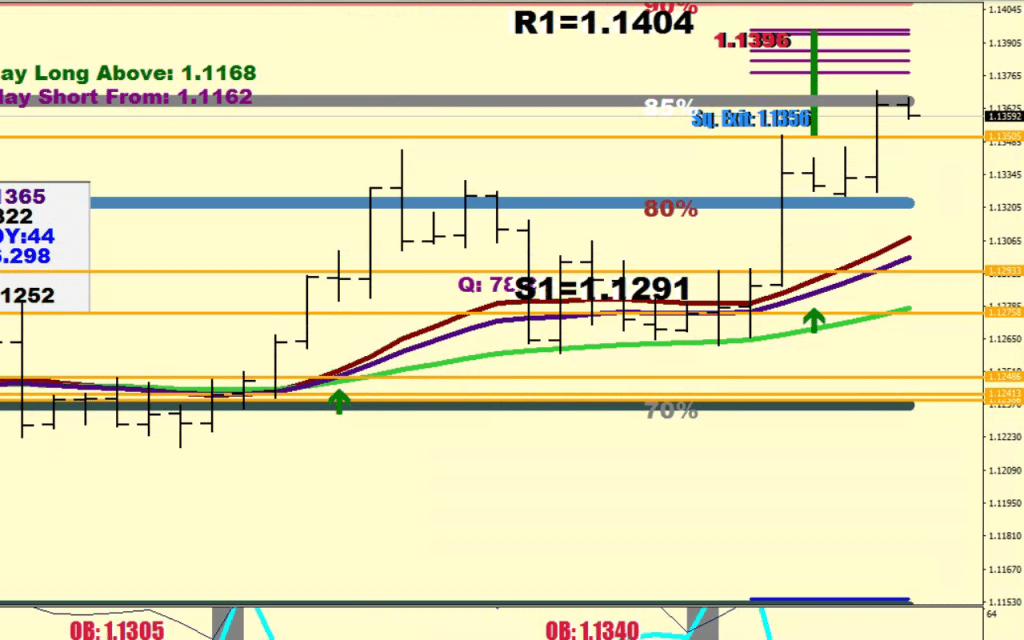
What followed was a dip to 1.12625 and a rally to 1.1352. How does this relate to my S1 and R1 calculations? You tell me.
Why should it had been obvious to take this long side trade?
You still had a Cat. A buy signal in effect.
Play long above…
And the Cat. B buy was valid till 1.1243
Therefore your entry risk at S1 was low, 20 pips or so, and the probability of hitting R1 was high.
As for R2 and S1 I don’t think that a single line could be defined, so ignore them for now.
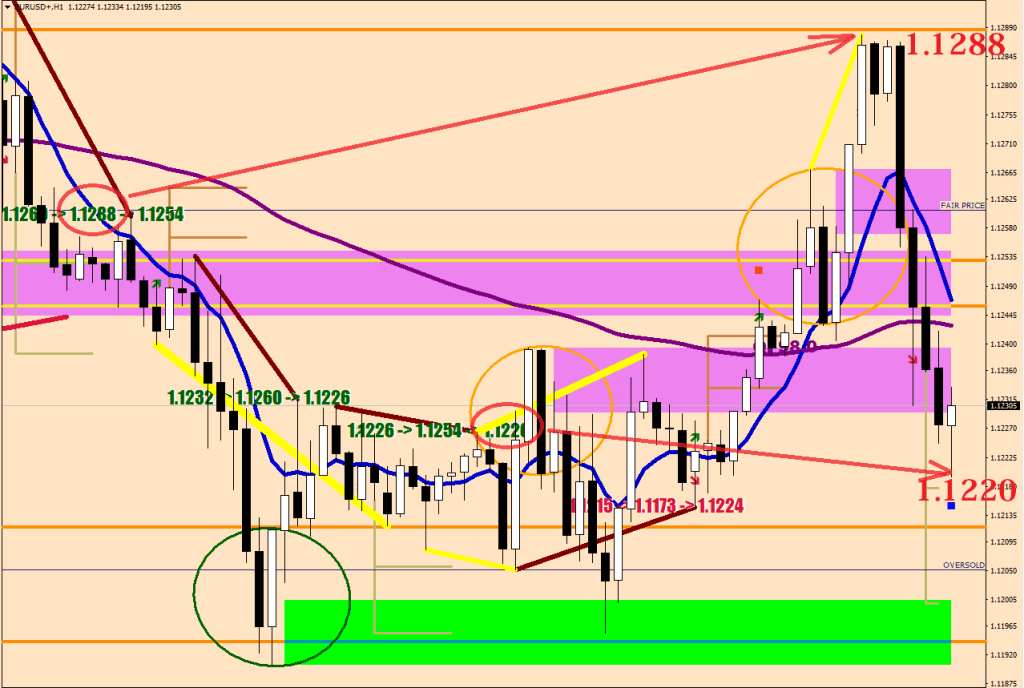
As for the measuring points, just remember this: they are the ending fractals of a continuation divergence.
Very impressed with someone in South Africa who went to look up my “Trading In Range” and “Volatility Whips” articles that were written in 2019. He obviously has been reading since, but whats unusual is that he remembered where to come back to for an advice. The term, volatility whip was invented by me, so there is no way anyone would be looking for it not having been to my blog.
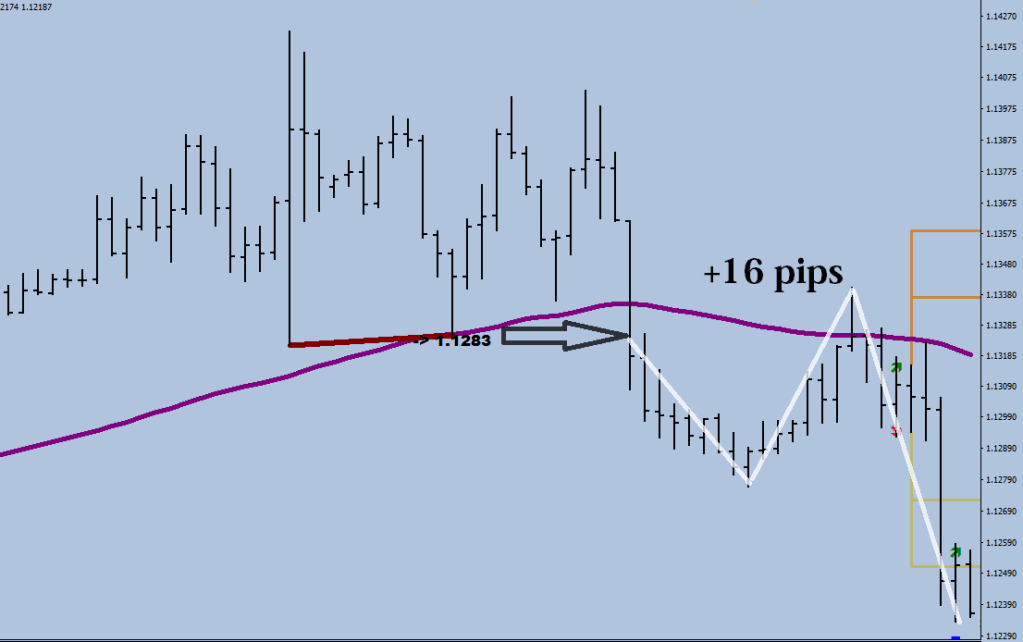
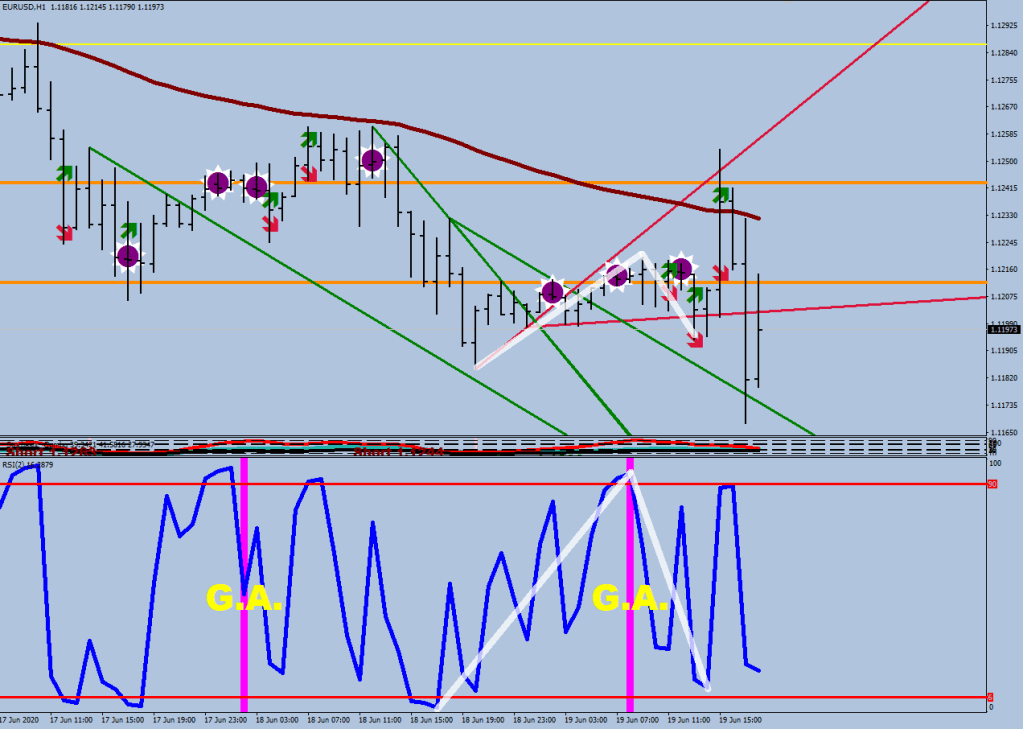
I drew the whip in white, A 9+ pip break in either direction would be a buy and could mean the next Wave 1.
Trading should be about practicing safe trading methods, and making money a side effect.
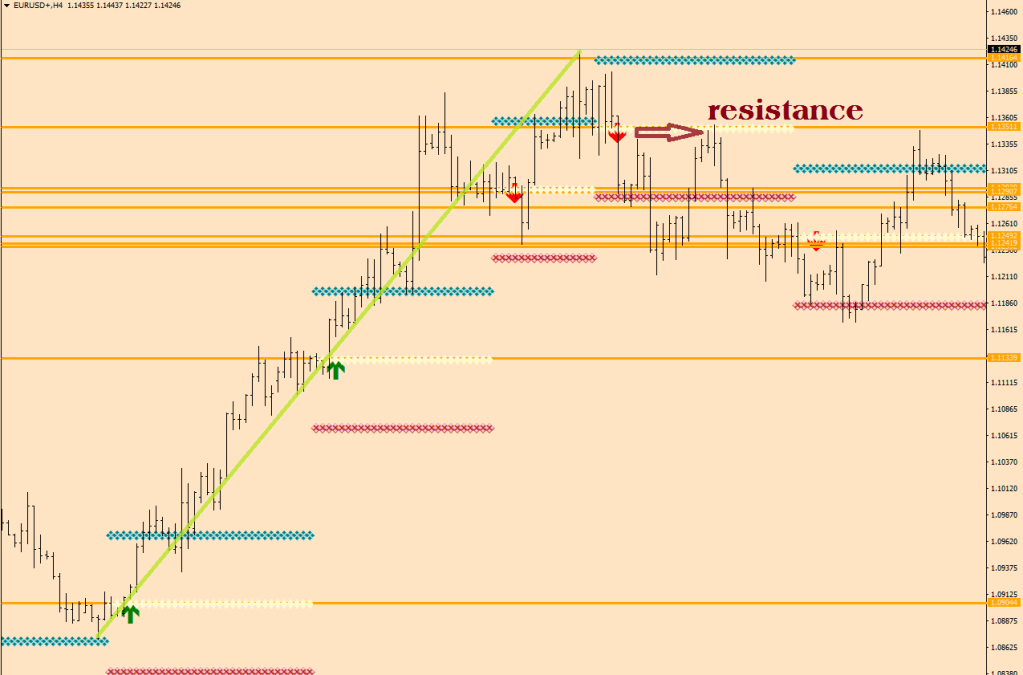
When price made a consolidation level, you would ultimately see a break out.
The break out would be of 2 steps: a pick of a direction and then the break-move that would go undisturbed until reaching an unfinished business level (i.e. an extension).
The important give away here is that the market would show you the direction to proceed in before hand.
In this first example the market upon having reached a high level of consolidation,
makes the opening move
retraces back to the starting point (and a little bit beyond)
makes the break
In this second example the market upon having reached a high level of consolidation,
makes the opening move
retraces back to the starting point (and a little bit beyond)
makes the break
In this third example the market upon having reached a high level of consolidation,
makes a move in the wrong direction
makes a larger move in the opposite direction that also turns out to be the wrong direction upon encountering the extension
returns to the starting point
One thing that can be pointed out immediately is that those first moves that were made in the direction of the future break were larger than 60 pips from the consolidation level, whilst the move in the wrong direction stayed below 60 pips.
Now we have another high charge, but neither of the first two attempts have reached 60+ pips distance, they got to 49 and 49 pips away from the consolidation level before returning to the consolidation level.
Are there any edges here, how could you have made low risk trades here?
You could have utilized the decision distance on the first push away: fade the first move away from the mean at 45, 55 and 65 pips distance for a move back towards the consolidation level. If the opening move went beyond 60 pips, aim for re-capturing only 70% of the way back.
Now let’s look at the hourly continuation divergence-breaks for a second to see if there is a similar theme to be found about how the market breaks out.
How did this breakout happen (eerily similar looks to the fluctuation maximum whip) – the sequence of the events was
makes the opening move
retraces back to the starting point (and a little bit beyond)
makes the break
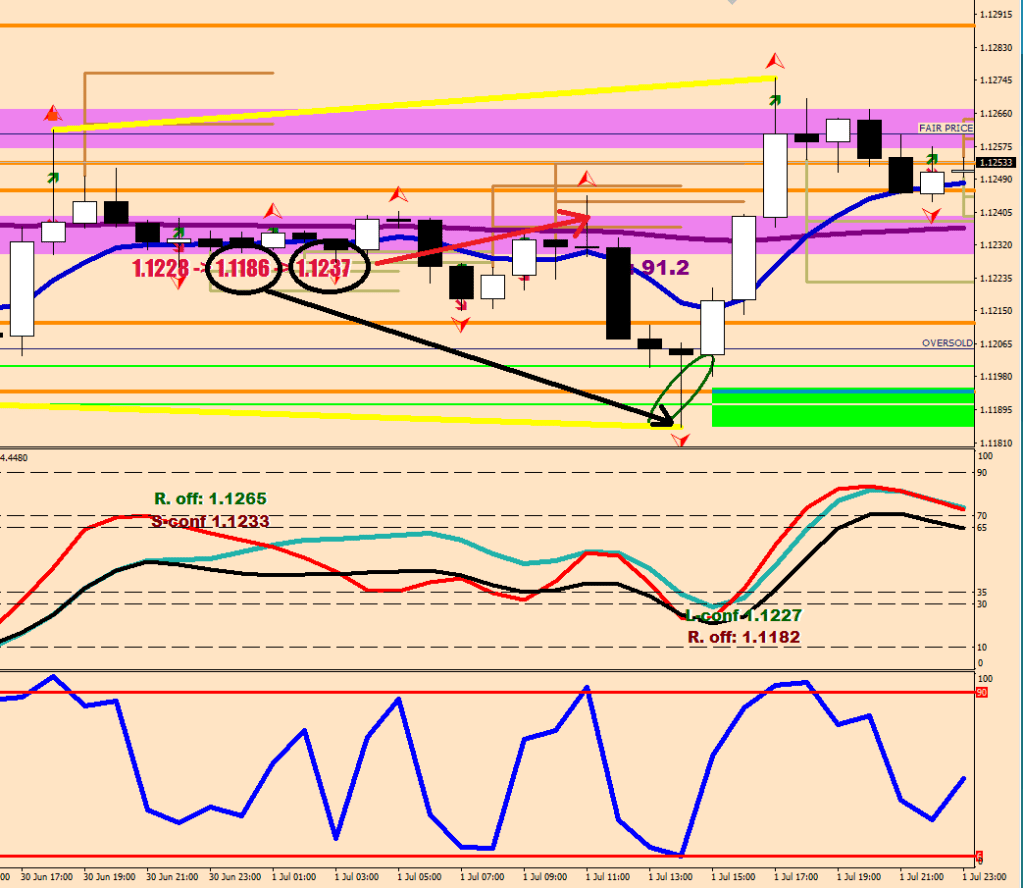
Of course in this case the break out only got to the end of the next support, and there were other warning signs such as the RSI2 squares: the first RSI2 reading gets the move going, the second winds it down – and there was a beat for a good measure. Yes, on the upside you are showing a starting RSI2 maximum (buying exhaustion).
The point to be had here is that for a safe entry wait until a continuation divergence break, then put a limit order 10 or so pips beyond the divergence point & get ready for a ride.
How? By utilizing the Free Trade concept. Once you are in gains, you put a protective stop loss (perhaps a trailing one) at 1, 2, 3 pips beyond your entry – now you cannot lose on this trade.
For me, the auto trading on my desktop takes care of it all: I set the stop loss to code “2” for a short, and I would get locked in 1 pip after 4 in gains, 3 pips after 8 in gains and then beyond 20 pips the lock in gets pulled at 16 pips behind (1/2 fluctuation size).
I got stopped out with $20 gains right after I could had taken $90 and soon after there was an opportunity to take $140, yet I am happy with what happened: I haven’t lost anything and have dry powder to play the next pullback after the initial move. I practiced disciplined trading. I should had payed more attention to the limitation around the consolidation level (+- 50 pips) and cut the positions for optimum gain. But this is how I can shape myself up to perfect, low risk trades. By noticing the sequence, by acting on them and factoring in the possible obstacles.
The following image shows how multiple continuation divergences can be broken one by one. In this sequence the price came back by 35 pips beyond the break point, but if you only started buying 10 pips+ beyond, your maximum draw down would had been 25 pips, and there was at least 70 pips to be had.
Those 3 upper brown divergence lines got knocked out one by one.
As for sizing, your total risk should little enough that you could withstand a 60 pips move against you – the explanation was on this page earlier. They know well that most retail traders cannot take a 40-pip move against them, hence the fluctuation maximum is somewhere around 42-45 pips.
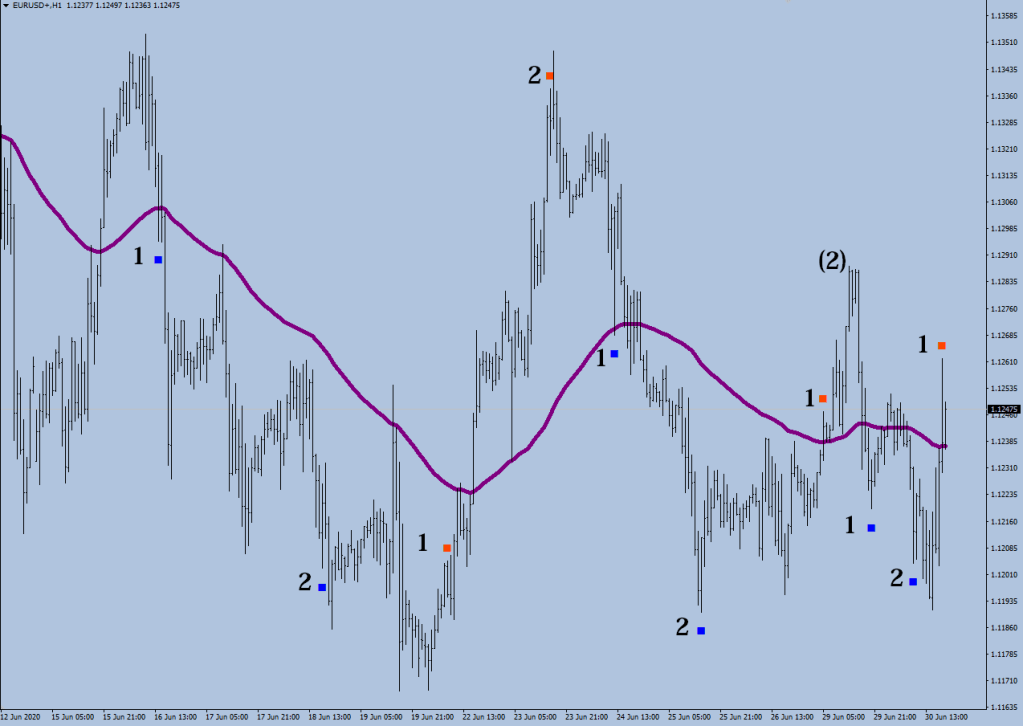
Below: see how you can use RSI2 in exchange for choppiness exhaustion readings. The (2) did not make it to a 98-read, it only reached 96, so that does not show.
…
This continuation divergence break, however minute it was, lived.
Cat A signals: Extension fill (scale in fade) Full Charge = Reset (no direction) 4H Exhaustion Beat + Forest (high base) Aim: 80+ pips
Cat B signals: Cover Longs + overbought Comfort Level (>70) Cover Shorts + oversold Comfort Level (<30) Cover Shorts + spike low Cover Shorts + spike high Beat of 2nd RSI2 square plot in the same leg Beat of 15min stochastic bar + Forest Aim: 60+ pips
Cat C signals: Continuation divergence break (pullback entry, scale in, trail) Aim: 50+ pips
Trade 1: breaking the continuation divergence low (RSI2) -> 42 pips target (fluctuation maximum) if the 89 Iguana does not cut this short
Trade 2: the stop out = long back beyond the continuation divergence trigger low – examples show 6 to 24 pips slack
Trade 3: new low – I would cover upon seeing a spike
(the EMA restricted trade turned around at the EMA, 32 pips away / fluctuation size)
A continuation divergence as a reminder is a higher low with a more oversold oscillator reading or a lower high with a more overbought oscillator reading.
Let’s talk about this purple colored reptilian creature for a moment, for to better understand the obstacles, we must.
This Sechuan Leguan aka 89 EMA can spit in you cabbage soup. Not that you would notice it.
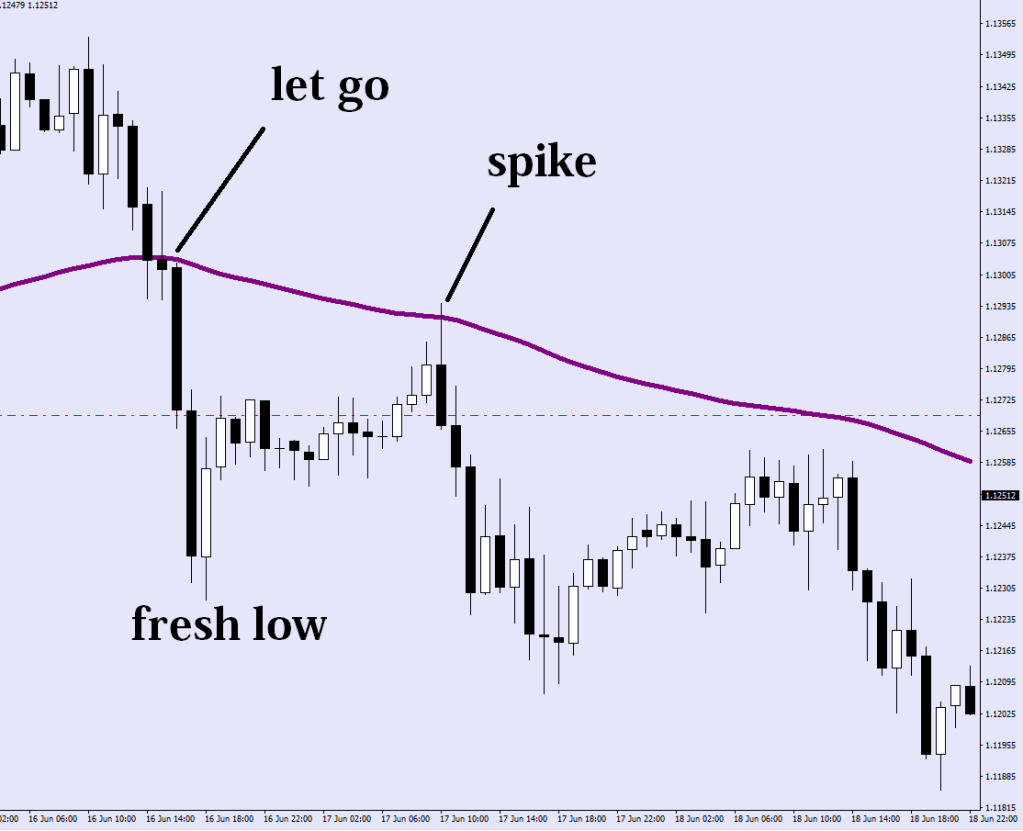
The point is that it has an eight ball, which has three sides, square – says on the first triangular side, spike on another and let go on the third.
No, I don’t know how Milligan comes here.
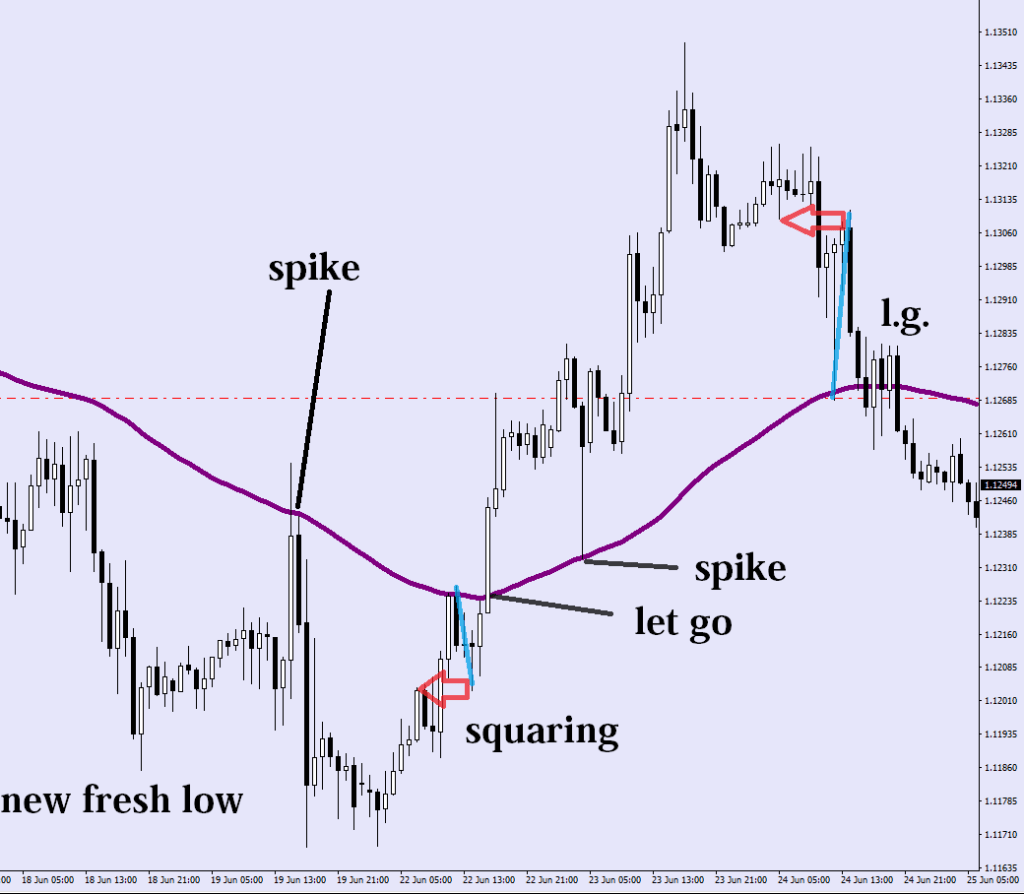
The act of squaring – examples
This squaring that takes place at this EMA is an opportunity to dump excess longs/shorts for 20 to 50 pips better price.
A let go is what follows a squaring – and at times they appear as a combo like on the image above.
Practice their logic on the image below. The theme is squaring, let go and spike always in this sequence, and sometimes you get multiple spikes.
Notice the fresh high before a spike on the upside and a lower high that brought on squaring instead of another spike.
Hopefully you are starting to understand now the difference between the racer and the eraser.
Appendix
…
Cover Shorts + spike = Category B Buy; Cover Longs + spike = Category B Sell
Notice the inside bar 2x fork lining up with the Iguana for a possible spike.
spike ~ candle closing back up / down by 12-14 pips+, stands out and occurs out of medium term overbought / oversold – or originate froma reptilian but the latter is in the direction of the movement, not against it
I also plotted the by now filtered extension projections, but the basic idea is still having a qualified move (large enough during a time limit) pointing to 50% more to be accomplished further down the road.
The last change I made was changing the ATR filter to a fixed size measurement.
Now, the images & the conclusions.
Enter with a size that can bear draw down of 60 pips. At 60 pips draw down from the consolidation level (Enter) if price went against you, hedge. At 70-pips you double the size of the counter holdings. You hold them into the next extension fill, where you scale out. You take off the original holding 40 pips back from the extension fill level (see article about Squaring).
consider the configuration and the price’s relationship for a preferred side to play
you can use Maroon for a target, and Mr. Green as well
look at how the last wave structure started from the cover longs area wave 1, 3 and 5 all ended in selling going crazy – to cover shorts
currently in a volatility whip where the hourly rsi maxes out on the upside then on the downside
this was the volatility whip – the purpose of this motion is to calibrate the market + work up some volatility for the next move (it brings the starting point closer to Maroon)
the volatility whip isn’t part of the wave structure
God Almighty only works in the direction of the current wave structure (a continuation)
you can see that the indicator did not call the cross down a short, because the longer term stochastic was too oversold
I had written the filter right the first time around (refer to what I said about using Maroon as a target)
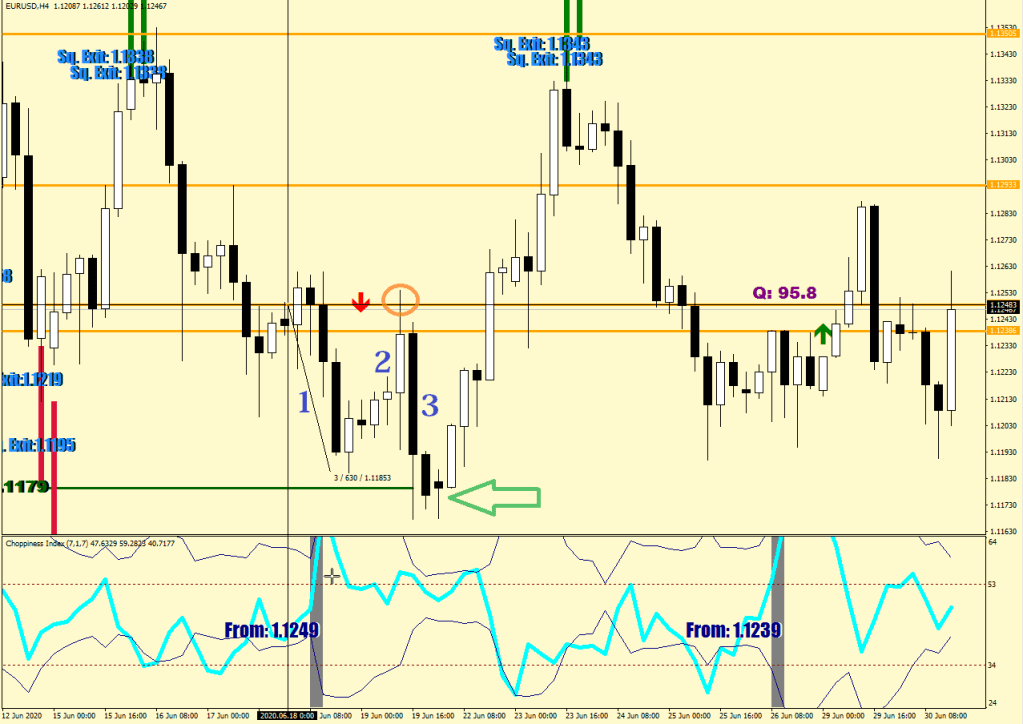
wave 1 started when the whip finished (after 5 waves down) and it was a wave 1 because it managed to reach beyond Maroon
wave 1 always fails back to the other side of Maroon (minimum) or 2 dojis down (normally) or it can even make a lower low if necessary
wave 2 came down to check in with the unfinished extension fill at 1.1179 before traveling abroad
the rally tagged the Mean (green line) – aka Secondary Target
“the Green River can stop a move, any move”
believe or not, you are now in a wave 3 up – the count remains until the low of wave 2 gets violated at 1.11683
and now whilst nobody understands what is happening, you can
…
price drove into the forest and hit a tree
Interestingly enough, the peak was at 1.12543
…
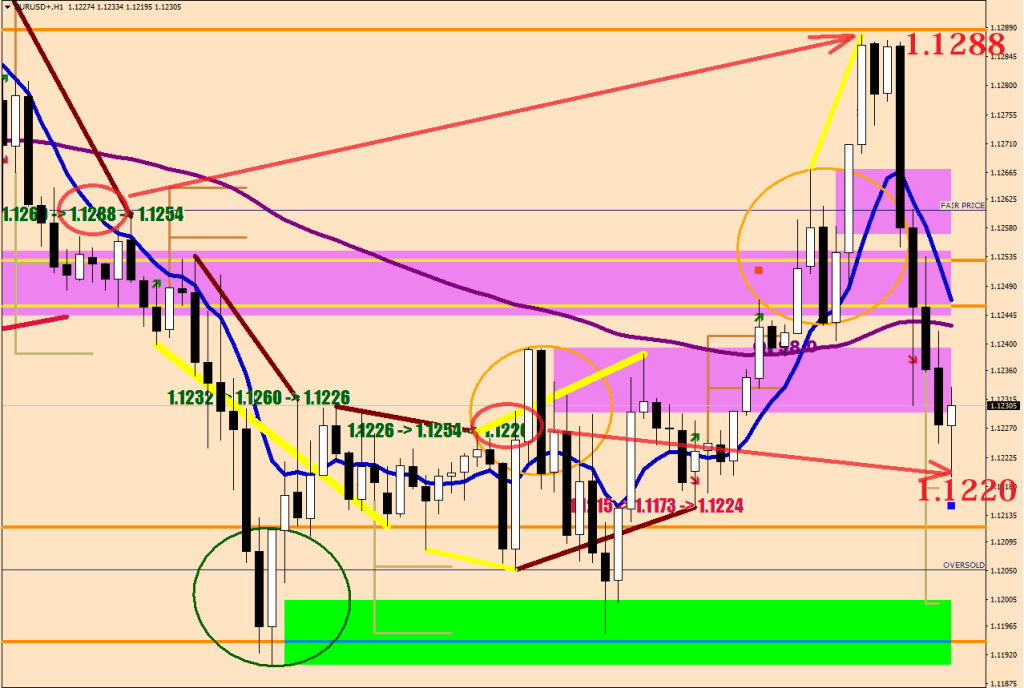
Currently in a buy zoneThe opposition calls this a break of the beat at 1.1179, and has a count 1 issued. The break should run to a 4-H exhaustion + beat and count would be at 7 or 8 by then. 4x 4 hours to go if the selling prevails. If this is a break, it is a rather weak one. You were in 2 pips gains at the close?! The last cyan zone is different from the others. It is not a resistance tha became a support but more of a resistance not properly backtested with an empty area between the new support and the old resistance. We were having that back test yesterday. Look for candle sequences of 1-0-1 (white-black-white / black – white – black) to find a spot of a show down where a decisive action was made.
…
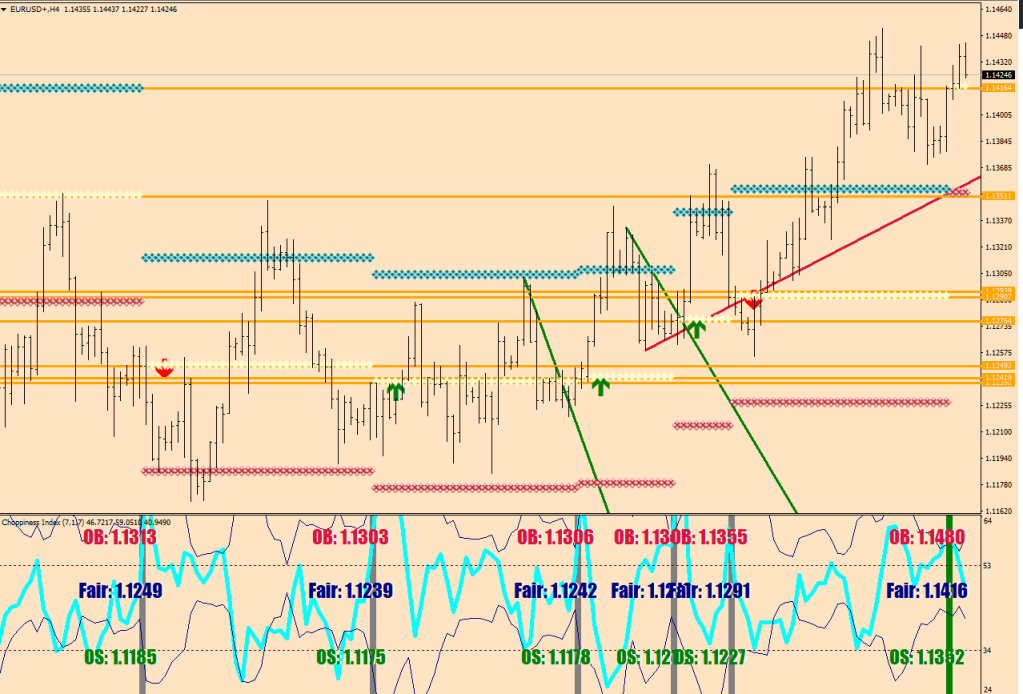
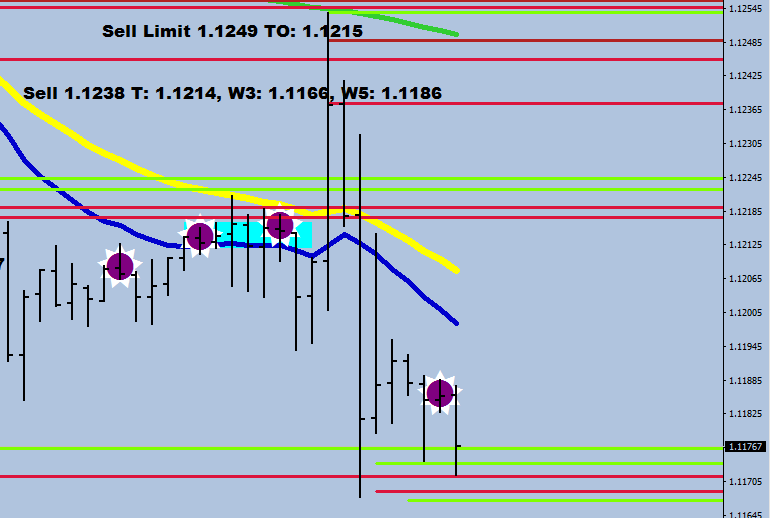
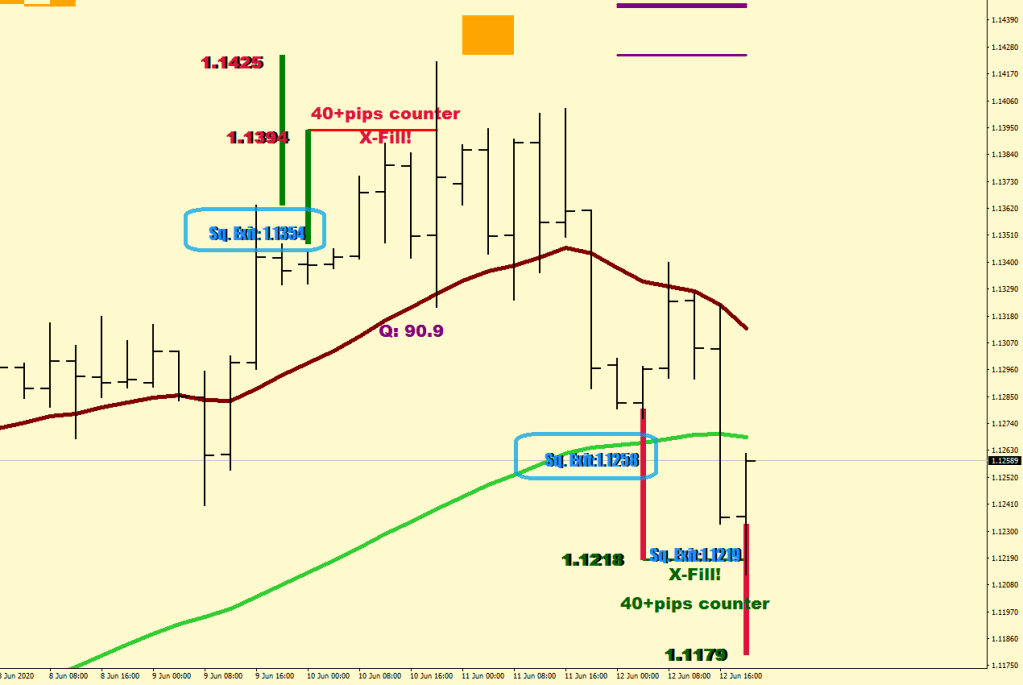
Ok, I surrender. The market is trading away from the peak charge – it was back tested at 1.1249. The smallest move came out of this kind of charge was 126 pips, but there are examples for up to 250 pips.
The next two support lines down are 1.1191 and 1.10949
I’d like to propose the utilization of the extension fills for squaring.
There are not many points on the chart where you can have 40+ pip reaction with a guarantee.
Say you start following rules for a change.
You figure a maximum personal risk.
You know your risk off level at the time of placing the orders.
If you get hedged in, you wait out the opportunity for squaring.
In real life, this is how it goes:
You open a position with 1/3 of your personal risk. The market moves against you. You add another 1/3 11 pips out. Market surpasses. You place your last 1/3, again 11 pips out. You knew at the start that you are going to be forced into a hedge.
Your risk off level should be 42 pips away (fluctuation maximum) from your 1st order, 31 pips away from the 2nd and 20 from the 3rd. With even chunks of positions you would have a draw down of 31 pips overall locked in.
The hedge would be sacred until the next projected distance level – encounter.
You are coming up against the green lines & values.
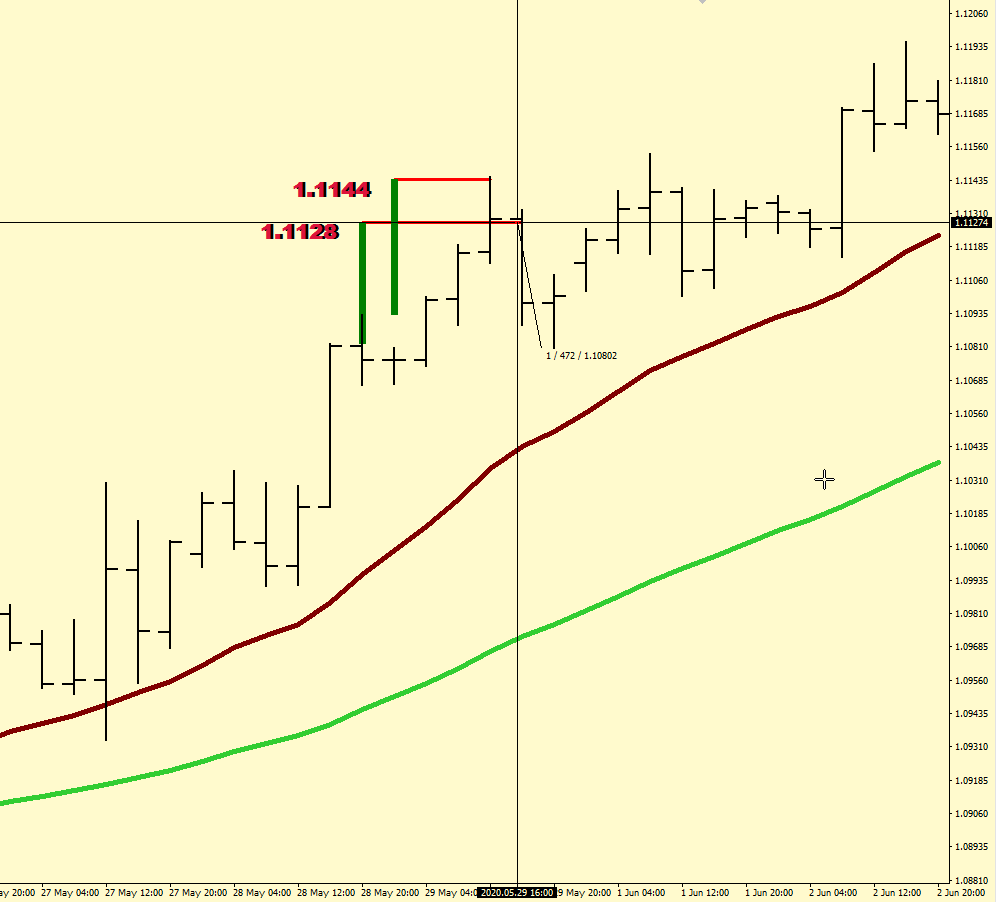
You close off the long hedge at 1.1128 and the shorts 40 pips lower (1.1088).
This way you would have some gain despite of the swaps charged in the meantime.
Now, what would happen if on top of opening up the hedge you would also add to your naked position 11-pips out (at 1.1139) another 1/3?
You already know the short exit level, so why not make that 51-pip gain?
What would happen if the market was to rally another 27 pips after going naked?
You already placing a pending short for the duration of squaring 11 pips out at 1.1405. Place another one as well 22 pips out and make that 62 pips trade as well, not?
The last such squaring opportunity happened on Friday.
The 51, 62-pip trades were not hit, but they should be taken off now that the squaring move hit its 40+ pip target.
I’ll let you figure the values on the last image.
Where do you take off your short hedge?
Where do you add to your short?
Where do you add for the 2nd time?
How much was the excess if the high came in at 1.10077?
The commuter market is any market that is not embedded in the overbought / oversold field and is sustaining above / below the mean.
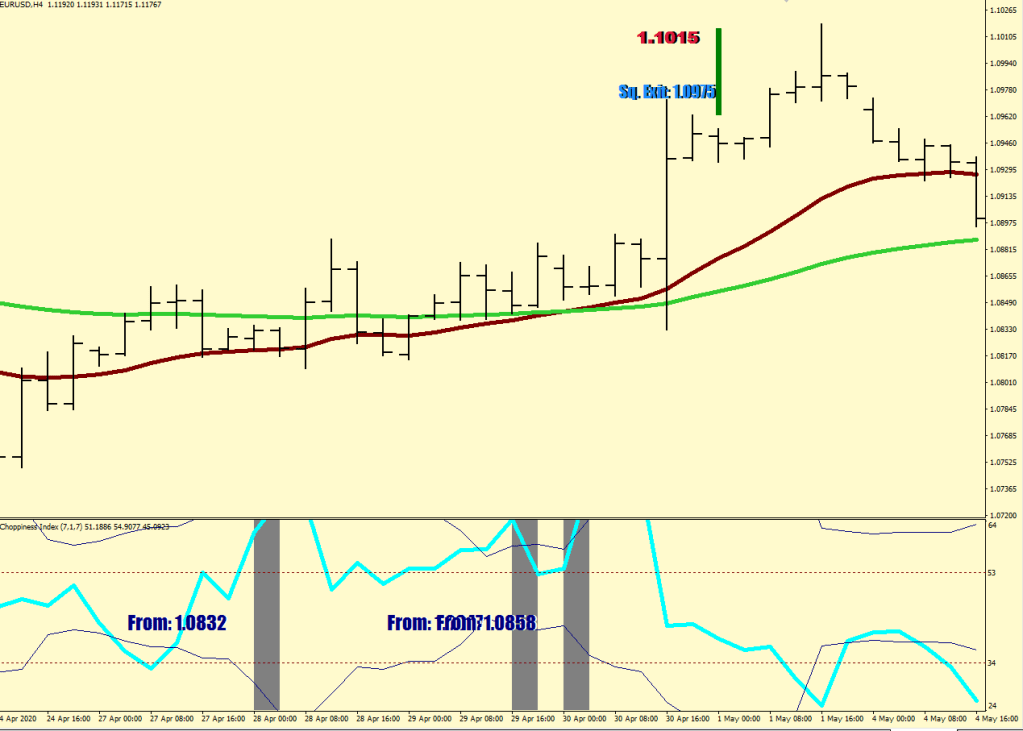
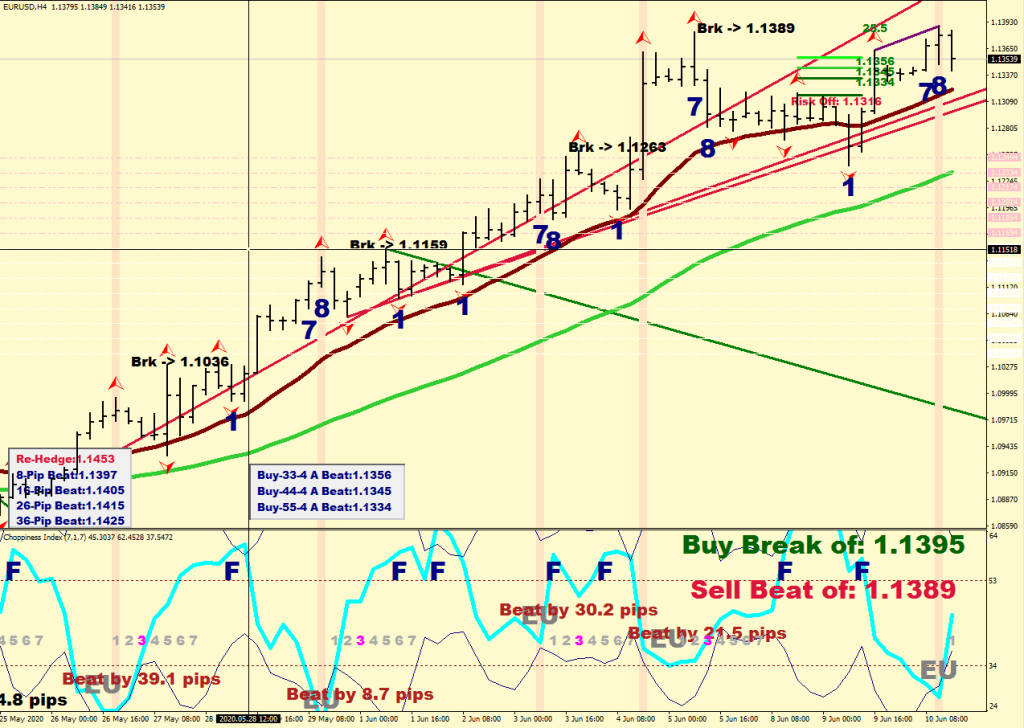
The name of the game in the following example is buying a swing low and holding for 7, maximum 8x 4 hours before selling.
Without going into the difference between exhaustion and beat (the beat requires a 4H low taken out) and other things such as what is a dip, what is a deep pullback, I present you with the meat of the upside action.
You see a swing high, you get excited.
You want to see the 7-sample choppiness above 50 to ready your entry.
You scale in
You abide your time, and start scaling out in during the 7th 4-hour print.
Your code:
for (i = 100 ; i >= 0; i--) {
   swinglowcounter++;
   swinghighcounter++;

   if (Low[i]>iMA(symbol,0,52,0,MODE_EMA,PRICE_MEDIAN,i) && iFractals(symbol,0,MODE_LOWER,i) && !eu[i+1] && !eu[i+2] && ChoppinessIndex(7,i)>50 && ChoppinessIndex(7,i+1)>48 ){
      j=i+1;
        while (!iFractals(symbol,0,MODE_LOWER,j) && !iFractals(symbol,0,MODE_UPPER,j) )  j++;

        if (iFractals(symbol,0,MODE_UPPER,j) || (iFractals(symbol,0,MODE_LOWER,j) && Low[j]<Low[i]) ){

         swinglowcounter=1;
                ObjectCreate("SWING"+i,OBJ_TEXT, 0, Time[i], Low[i]-30*Point);
                 ObjectSetText("SWING"+i, swinglowcounter, 23, "Arial Black", clrNavy);}

      }
   if (swinglowcounter==7 || swinglowcounter==8 ){
      ObjectCreate("SWING"+i,OBJ_TEXT, 0, Time[i], Low[i]-30*Point);
                 ObjectSetText("SWING"+i, swinglowcounter, 23, "Arial Black", clrNavy);
   }

}