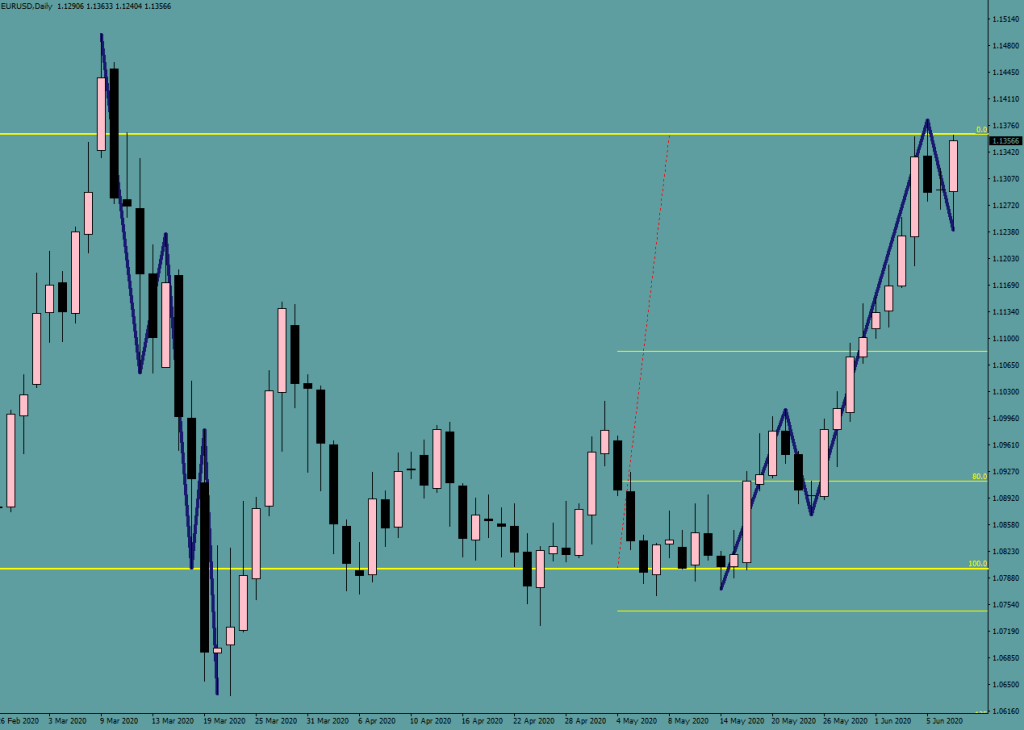
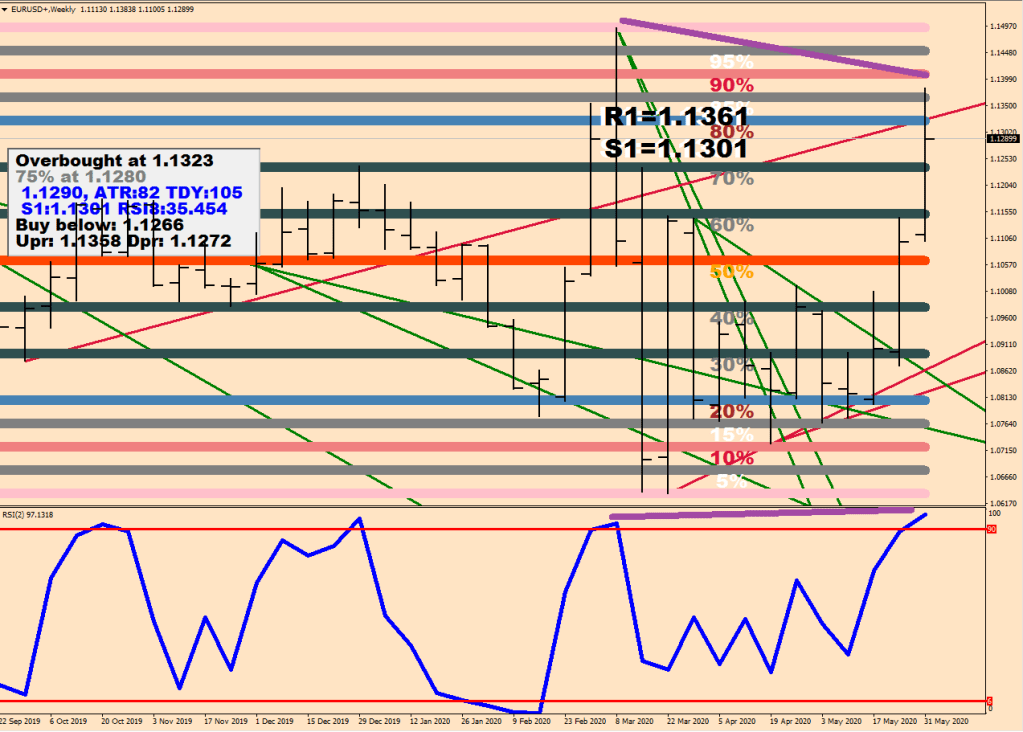
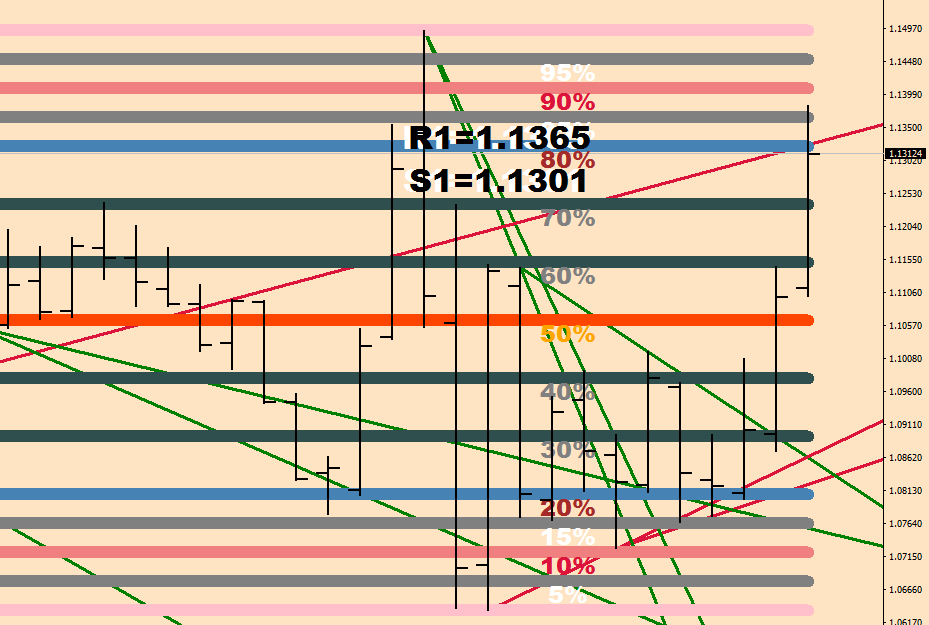
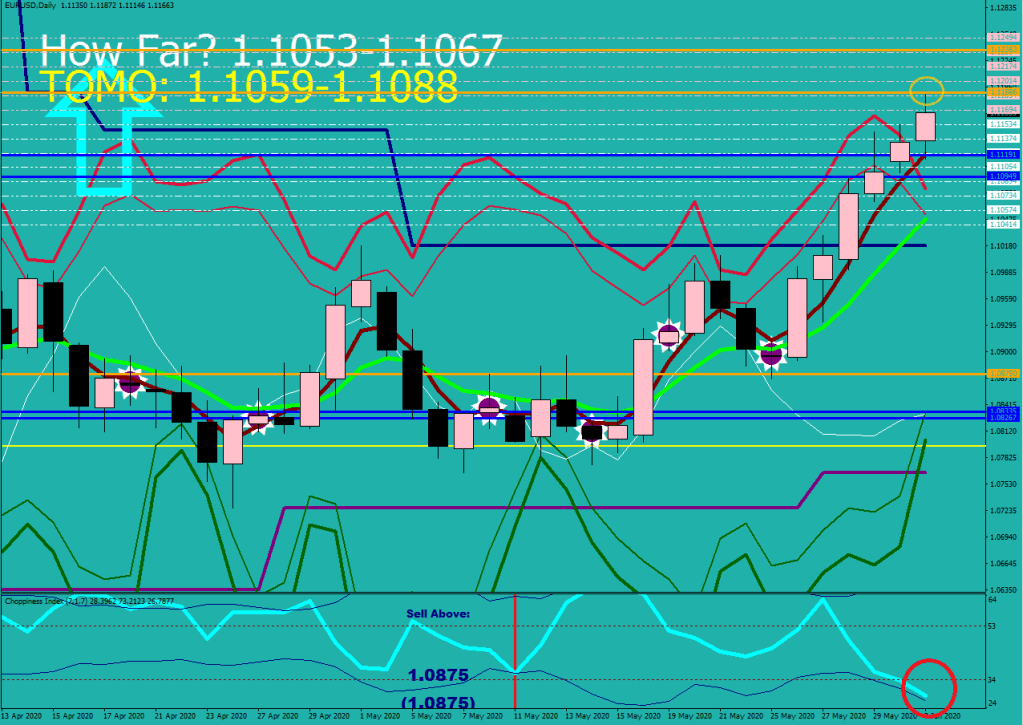
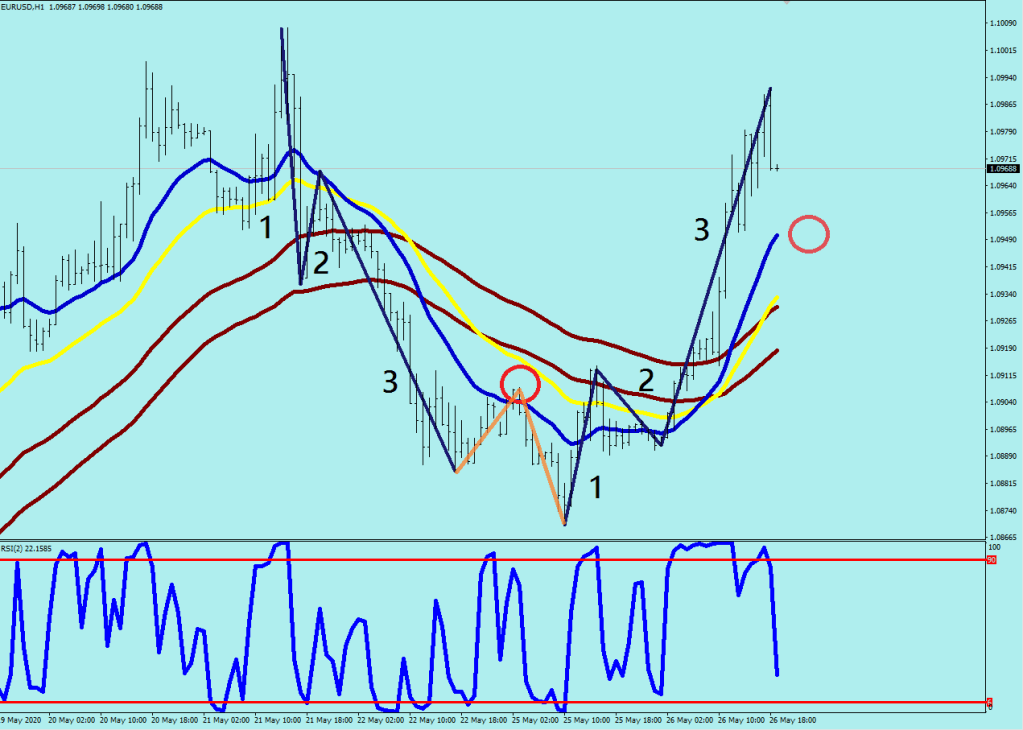
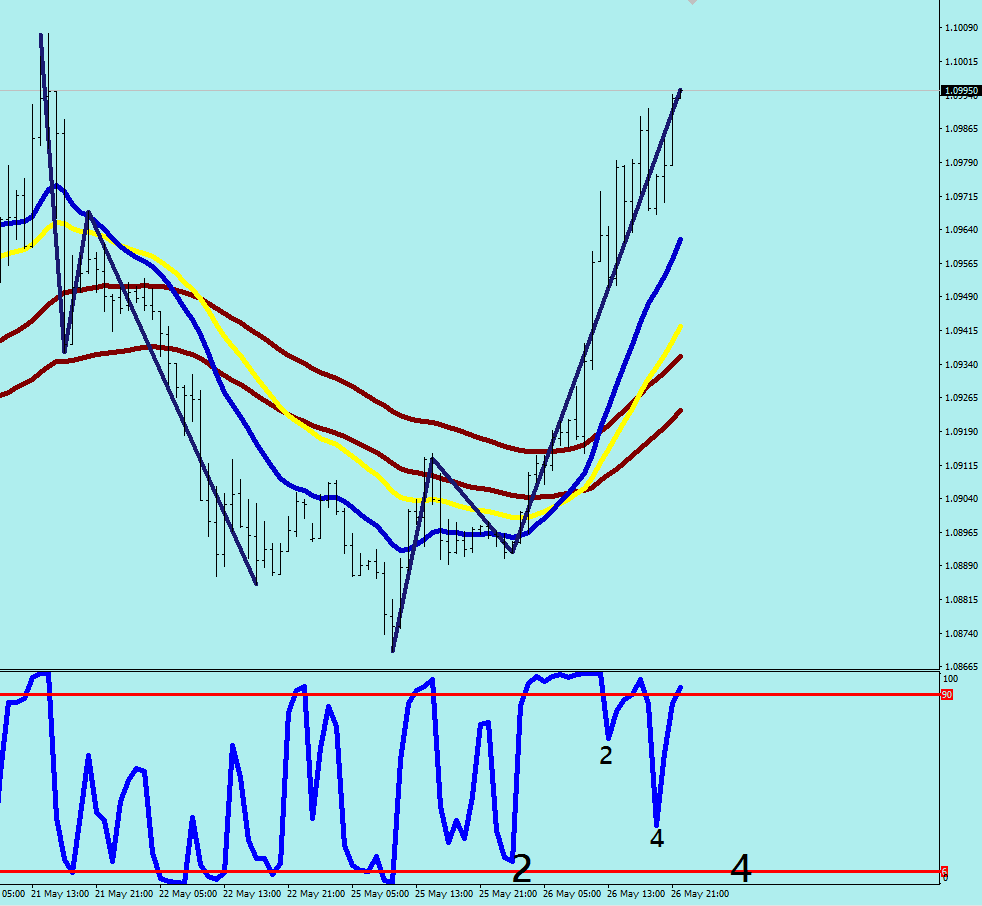
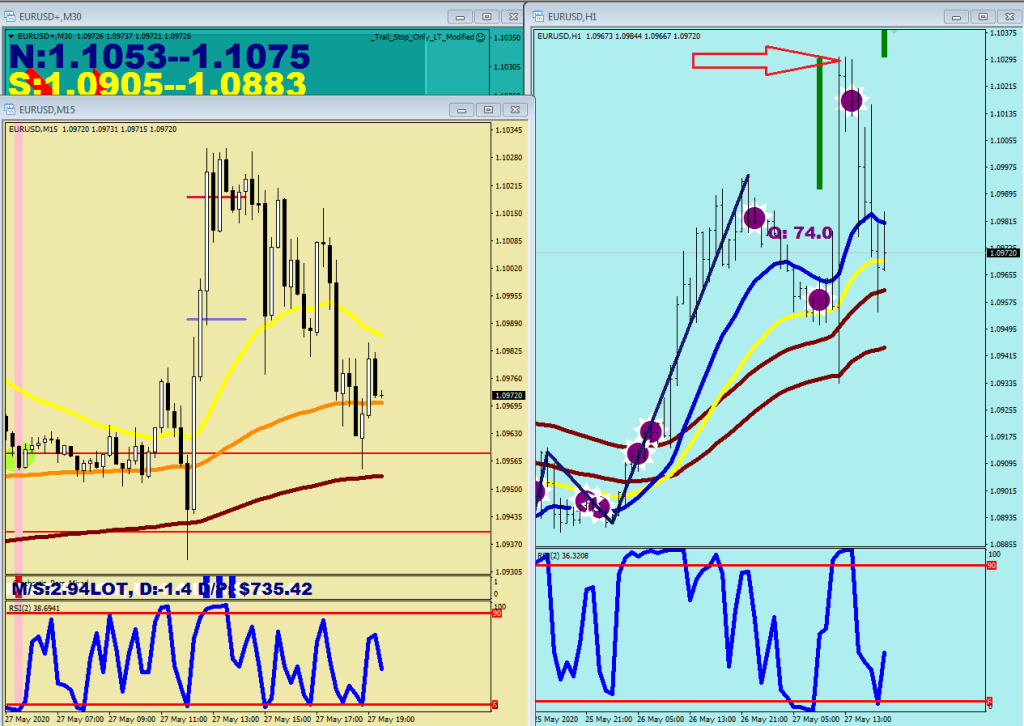
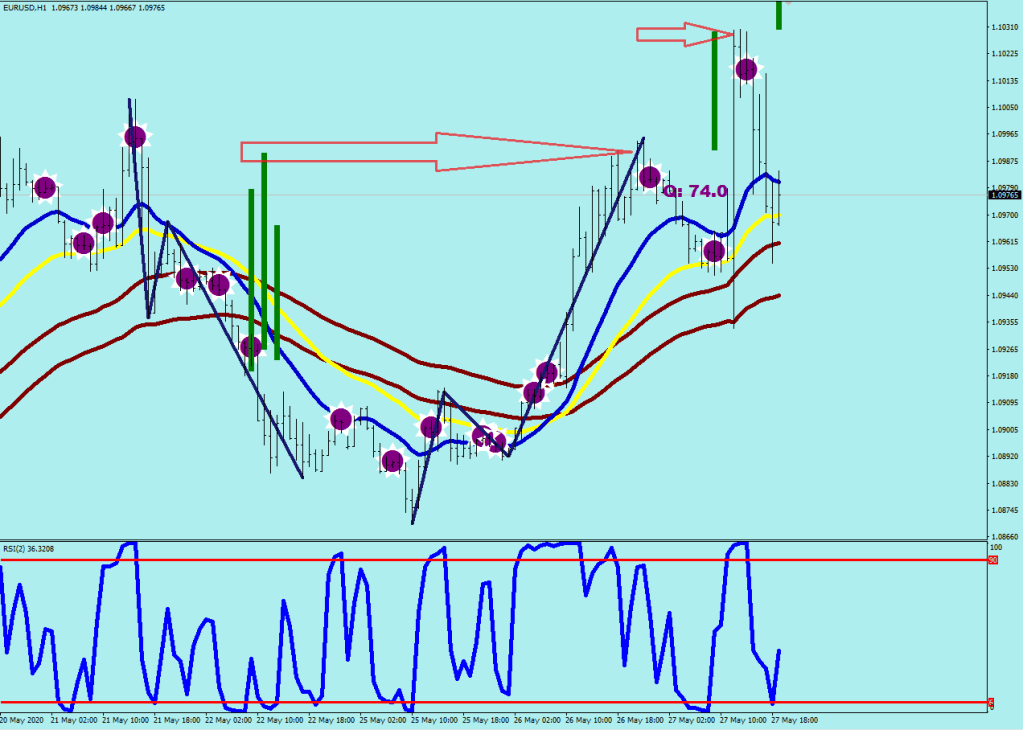
The last two weekly peaks show a continuation divergence down -> likely lower high. Does not mean that a slight beat of the recent high isn’t possible still. You can also see the reversal divergence between the last two lows made in the oversold area.
Support & resistance levels would be re-calibrated based on the last 15-min consolidation come Sunday night (with the new ATR), so ignore them for now.
Based on recent history, there would be another week making a try with the overbought zone, likely the one coming up just now.
The story is currently trying to sustain in the overbought zone, but that’s not a given at all.
Gauge 2:
4H
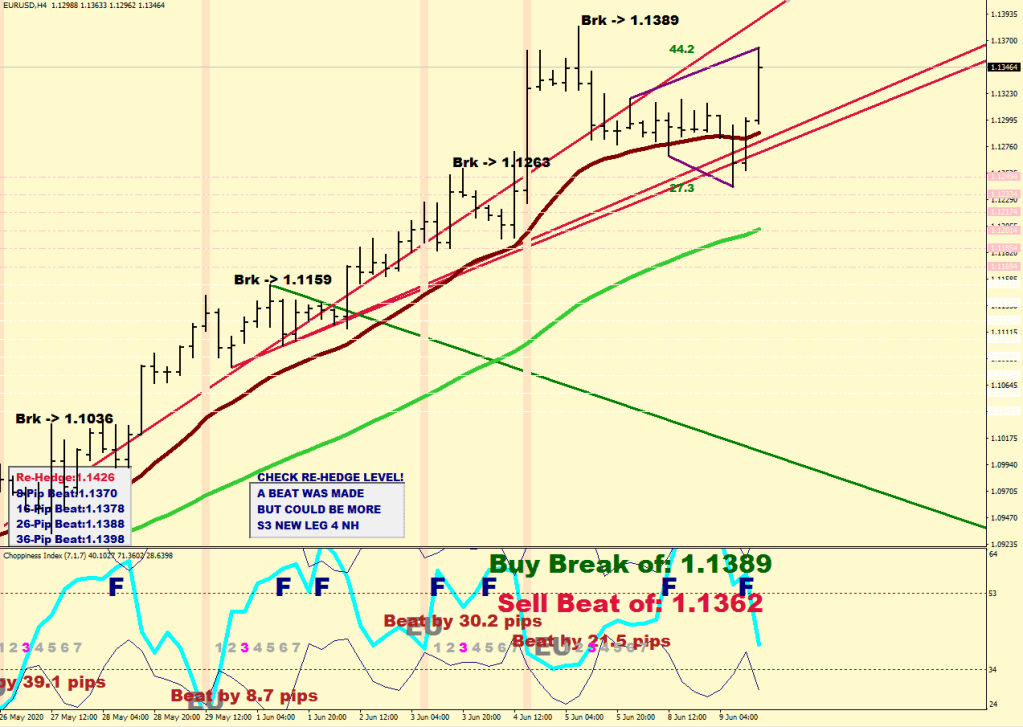
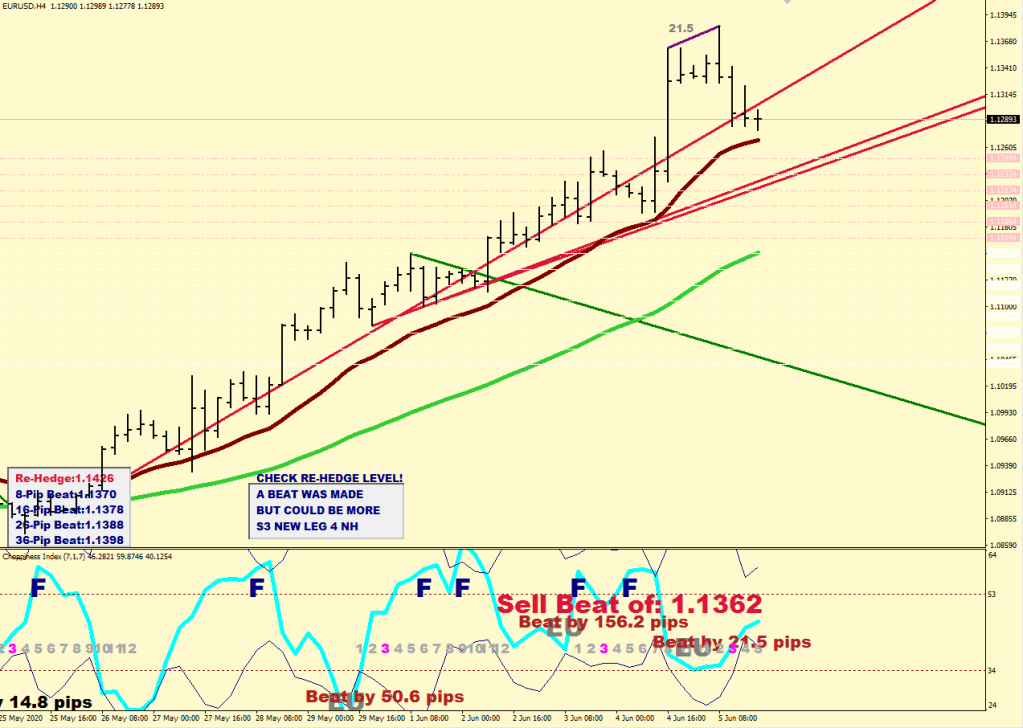
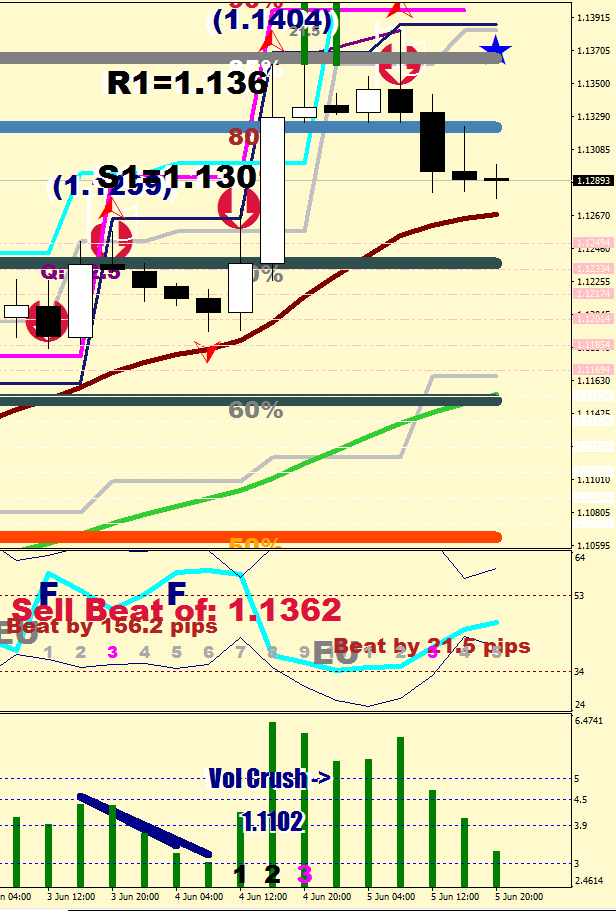
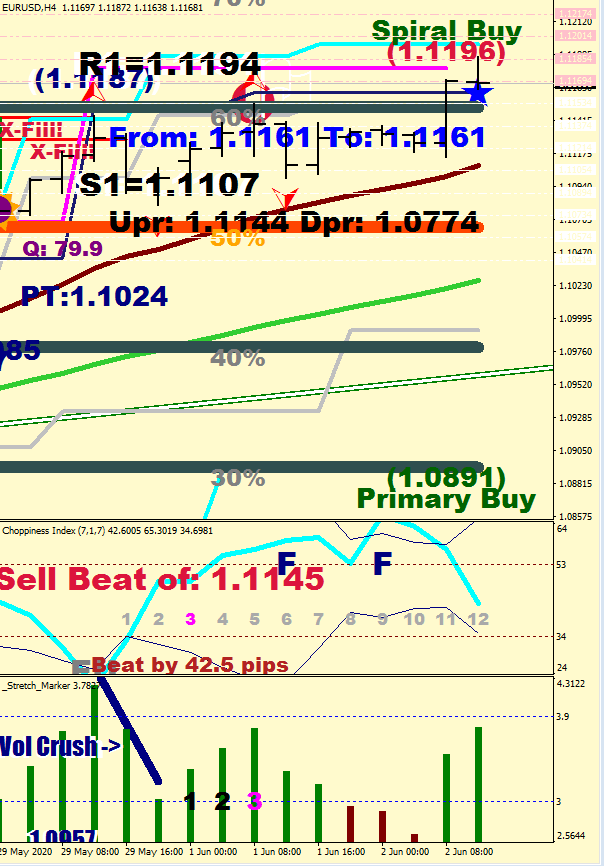
Price is above Mr. Maroon, so we are interested in the increment of the highs.
The last increment was less than 25 pips or more than 64, so it is printed in Gray – dip buys are not promoted here. A break out would be a buy even a couple of pips above, and the projected distance of this last move up is at 1.1445 – just keep it in mind, have a good trail stop and be ready to bail if price comes back by 9-10 pips below the high.
As long as price stays above Mr. Maroon, we do not have a Wave 1 down yet.
The Green one is the mean, where we would expect price to return to once Maroon gives its consent.
Gauge 3:
15 min
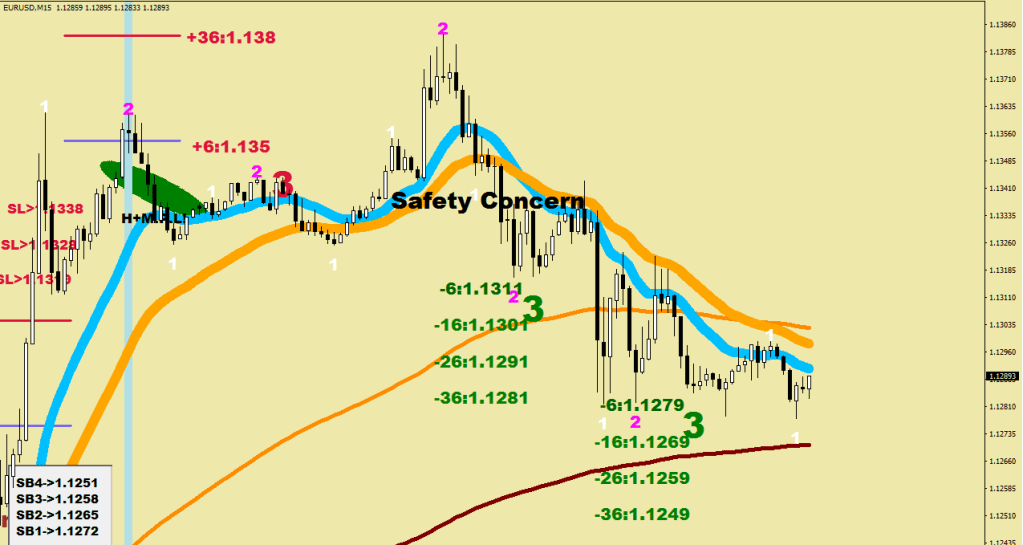
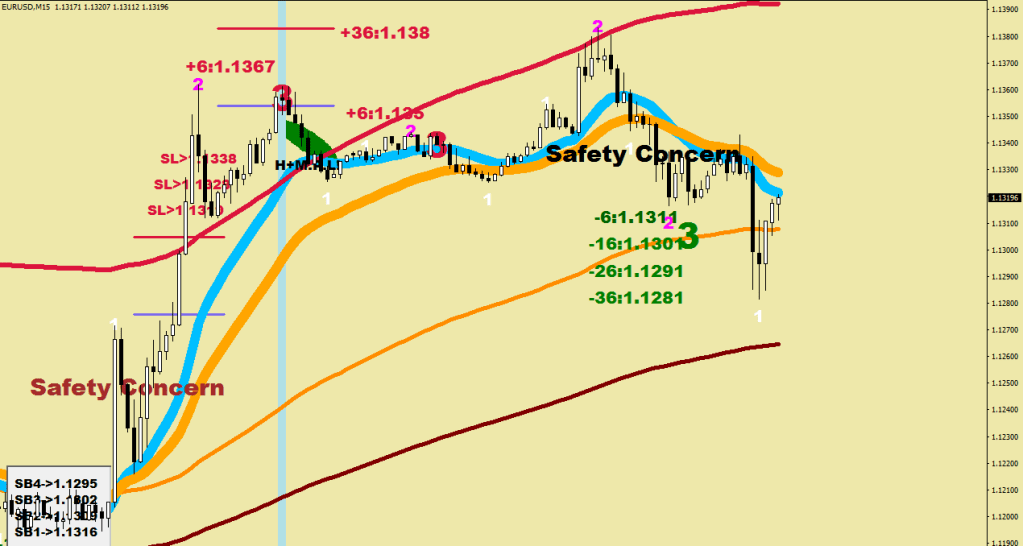
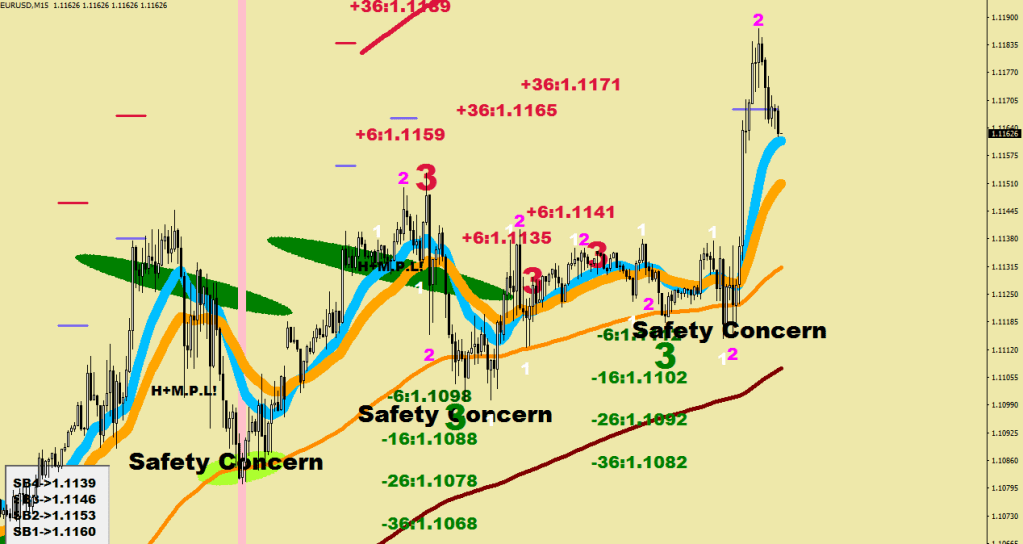
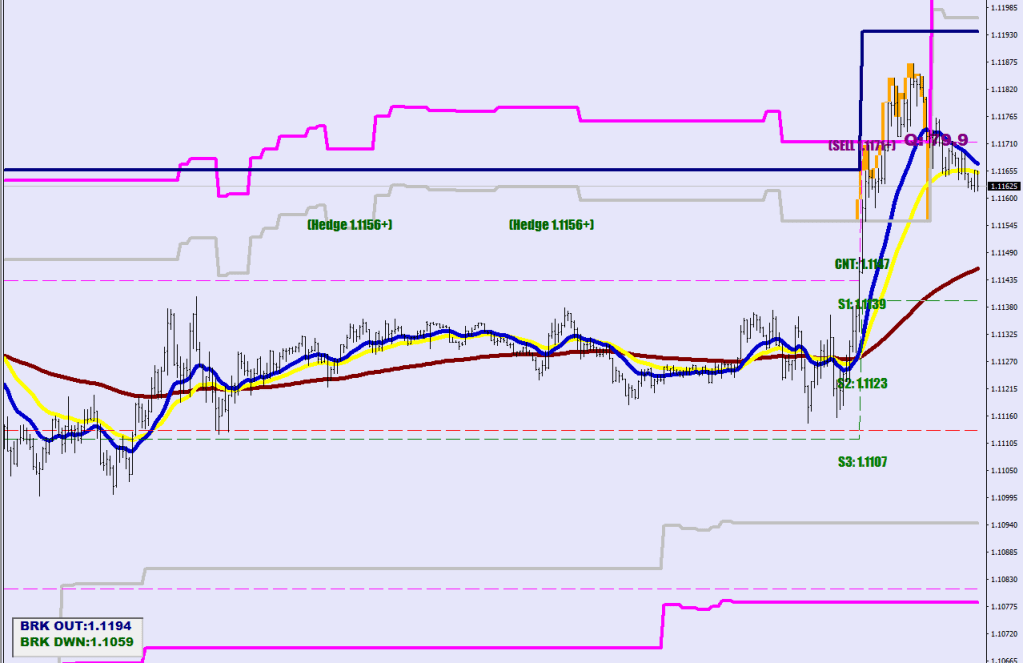
The 15 min shows the range that was expected to be failed. 1.1380 was a peak.
When the Safety concern was overrun, that made this move a qualified Shot Over the Bow – which is typical of a Wave 4 down. If price stops here, Wave 5 would have the opportunity to make a run for the projected high.
We are still in Strength Buy mode, as the bottom left ticker shows, but if price was to meander lower, this move would be a qualified Wave 1 down, and would expect the rally (Wave 2 up) to fizzle out.
Gauge 4:
1H
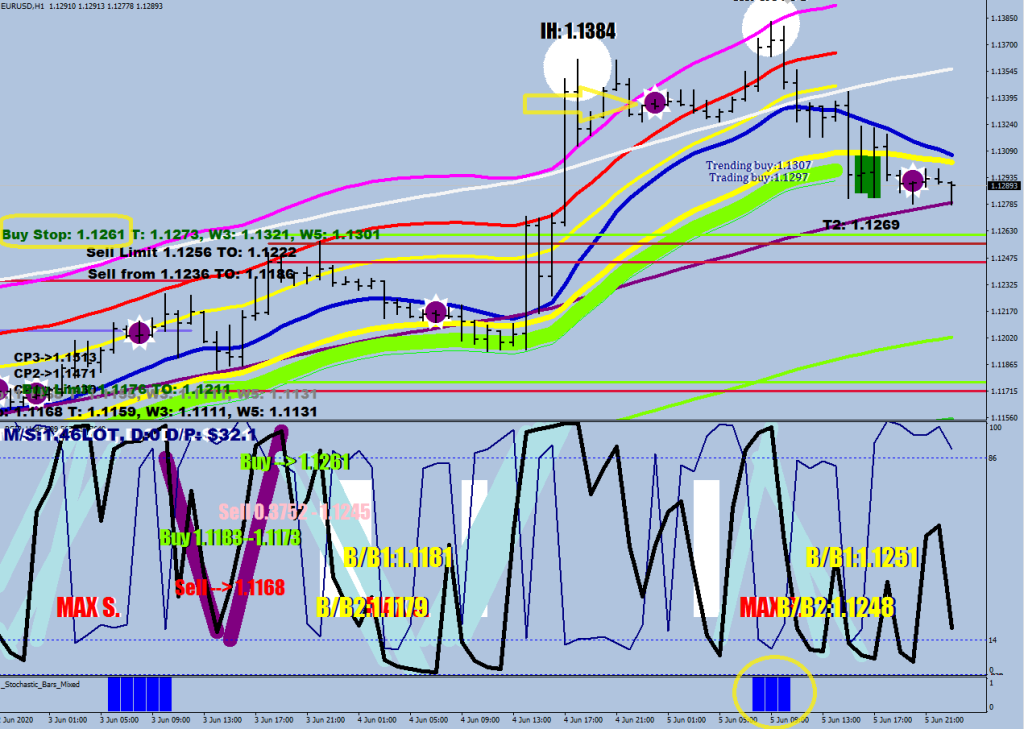
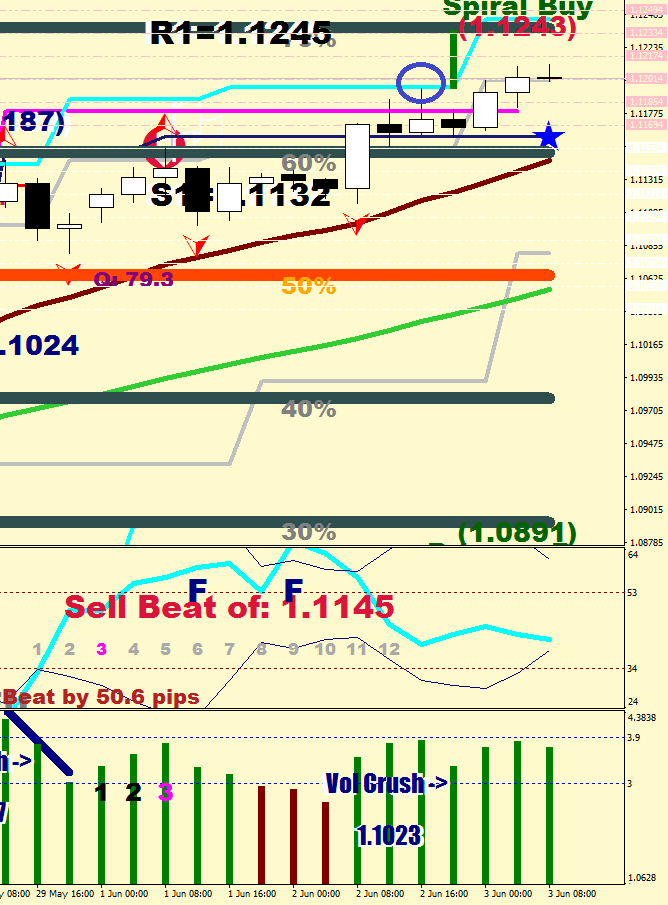
The 1H shows a break out that occurred at 1.1261 – then a back test of that along with the 2nd doji up. The close of that doji + maximum 4 pips is where I would strongly consider getting out of the Wave 2 up – if that is what’s coming next.
I am a bit bothered by the stochastic bars making a print on the high, for the market rarely finishes on a high note.
Gauge 5:
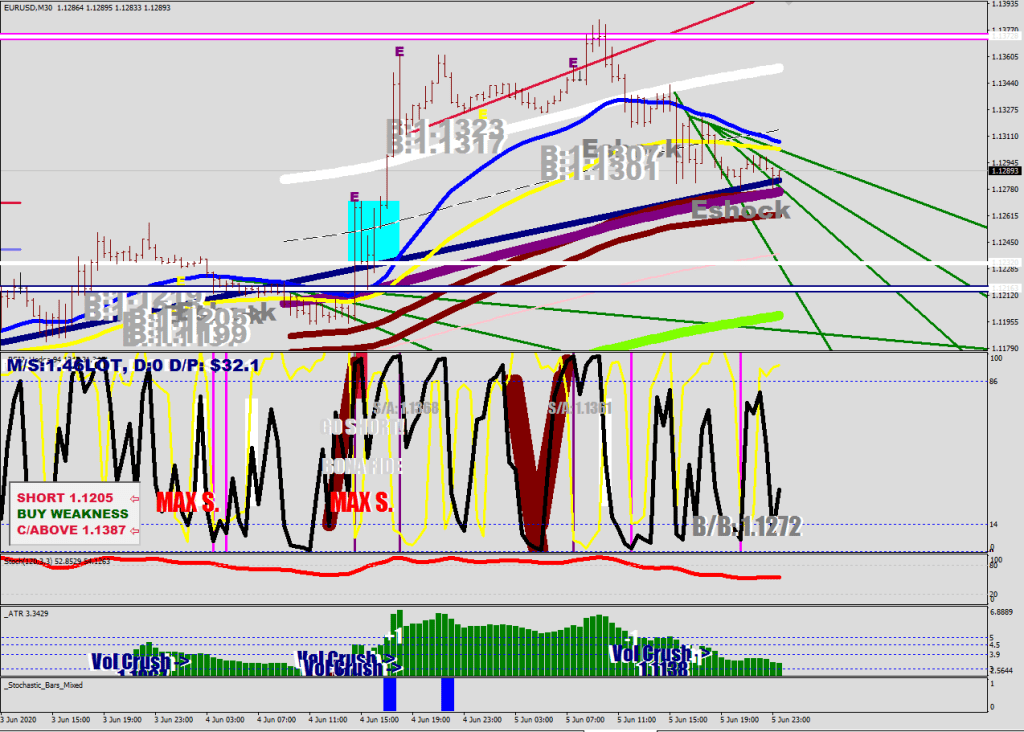
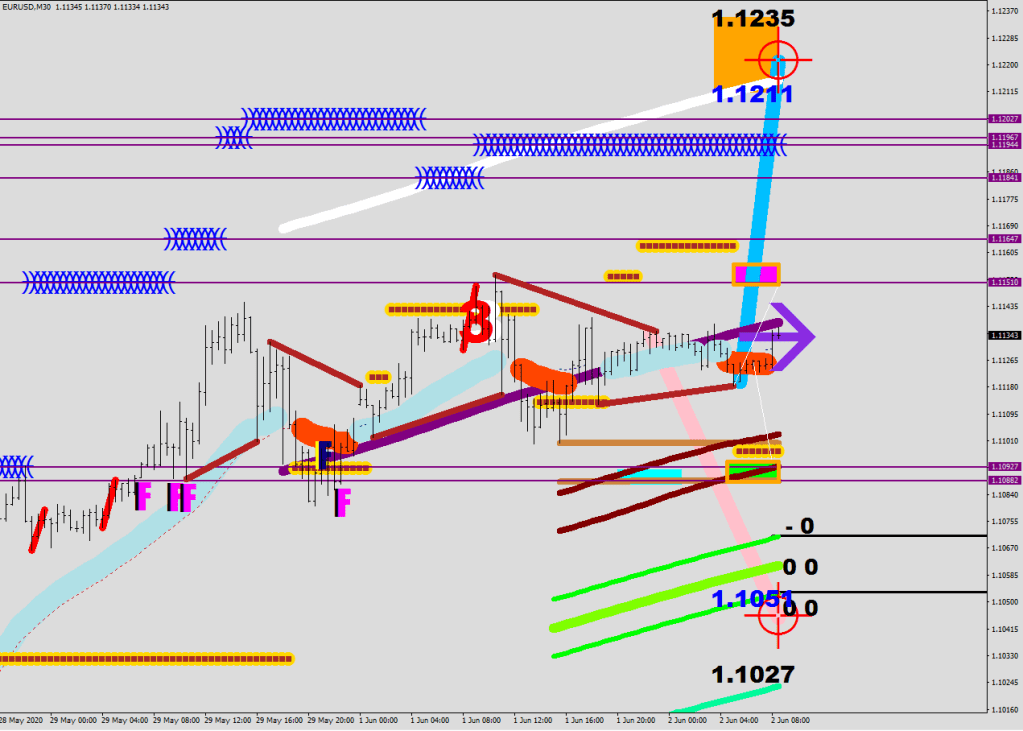
The 30-min doubles down on the importance of the break at 1.1261 with the highlight, and gives accurate distance readings from the mean putting the divergent highs to 6.7x and 6.4x stretch from the mean.
Most recently price made a move back down from 5x stretch to 3x (quite a bit of volatility crush).
The 4×4 hours of deflation increases the possibility of a rally ensuing next just as what happened the last time (2×4 hours up) – see blue line below.
Buy Weakness is still in effect and disregard the Short reading that is based on the location of the Energy bands that were unable to keep pace with this move up. The cover level just reinforces the notion that if there would be a break out, it would be a failed one. Refer to its maximum projection earlier.
Gauge 6:
5 min
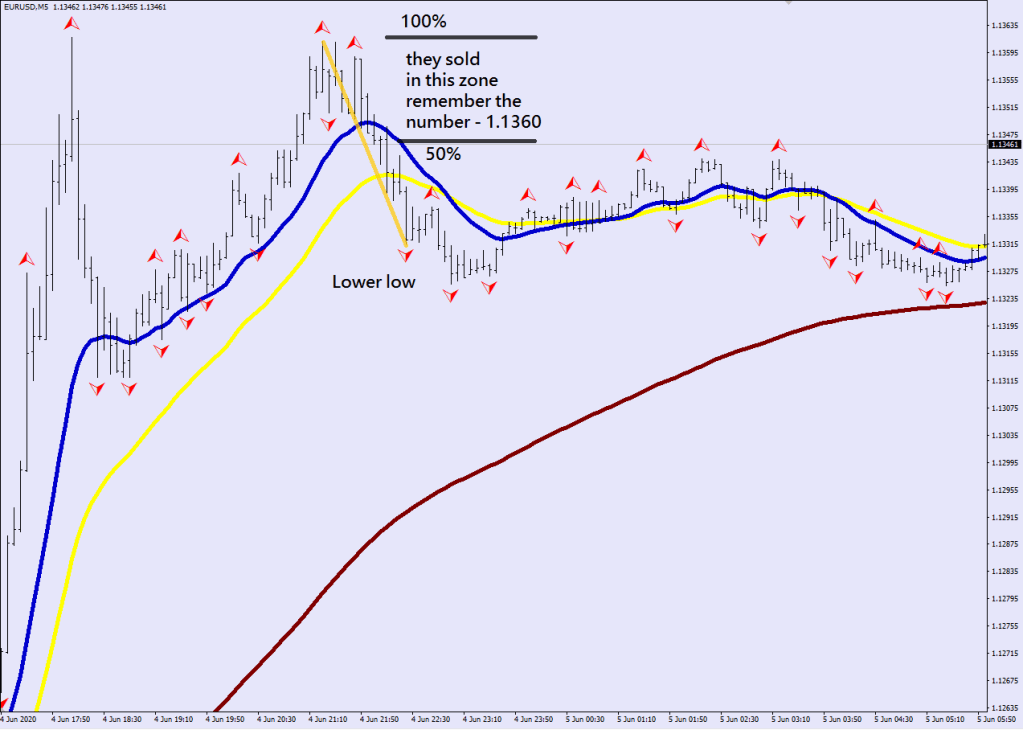
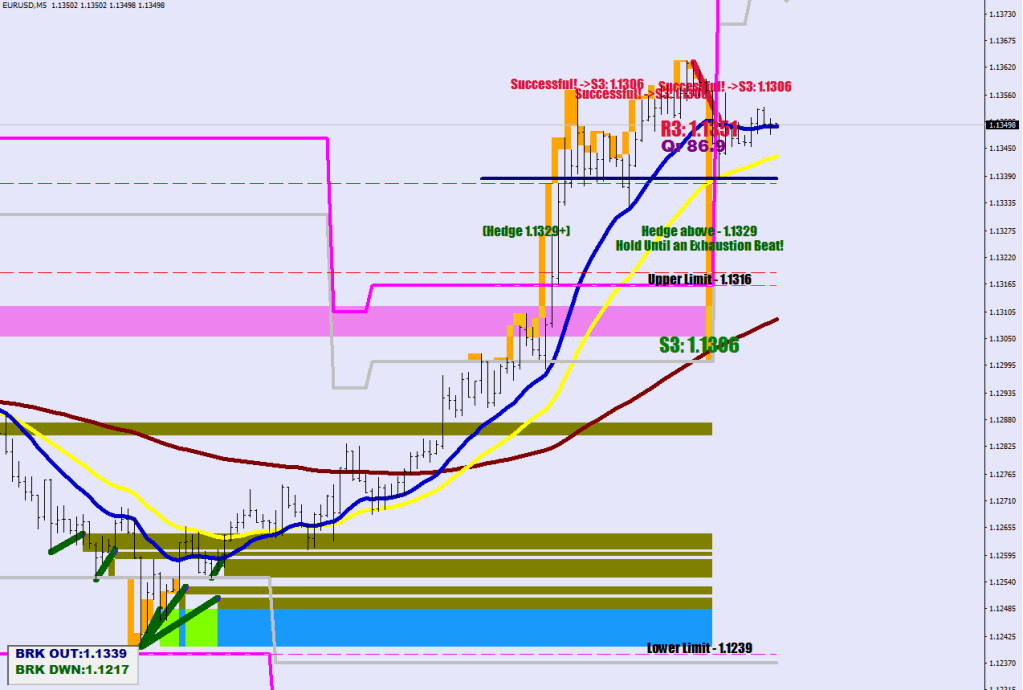
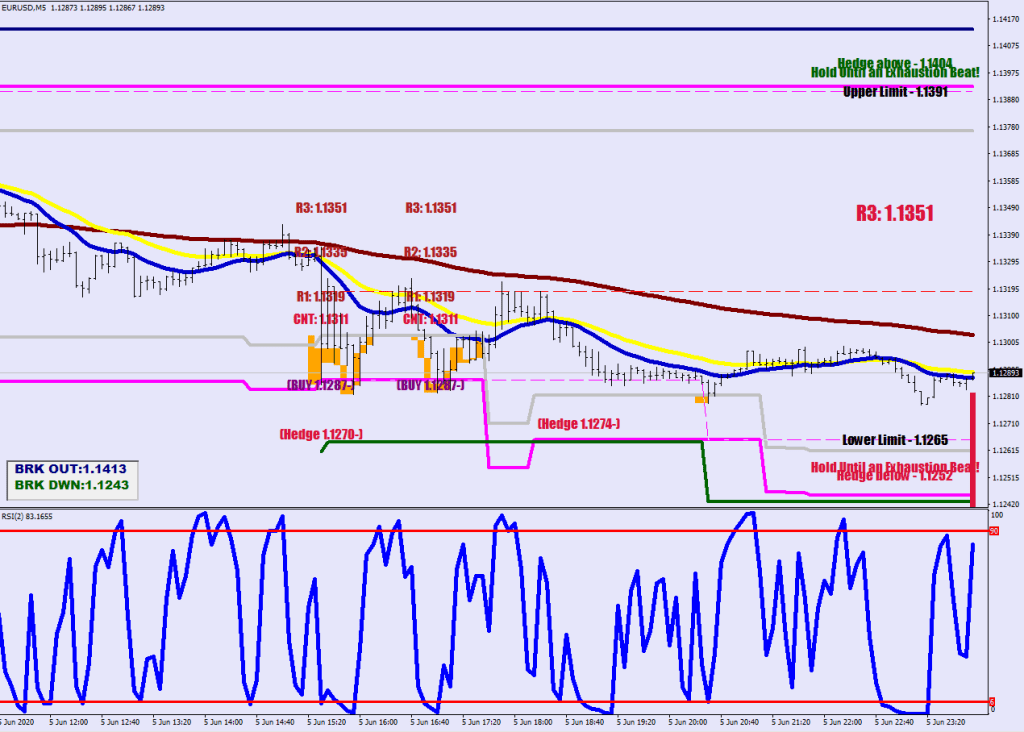
This chart shows the Buy level of below 1.1287-, and price has made 5-6 attempts trying to get lower – unsuccessfully.
The hedge level was not violated. The upper hedge level of 1.1404 brings attention to the possibility for a squirt above, and 1.1351 should serve as a resistance if this is going to remain the same wave structure to the downside i.e. we would get a wave 2 of Wave 1 down.
Current downside hedge / risk off level is at 1.1252
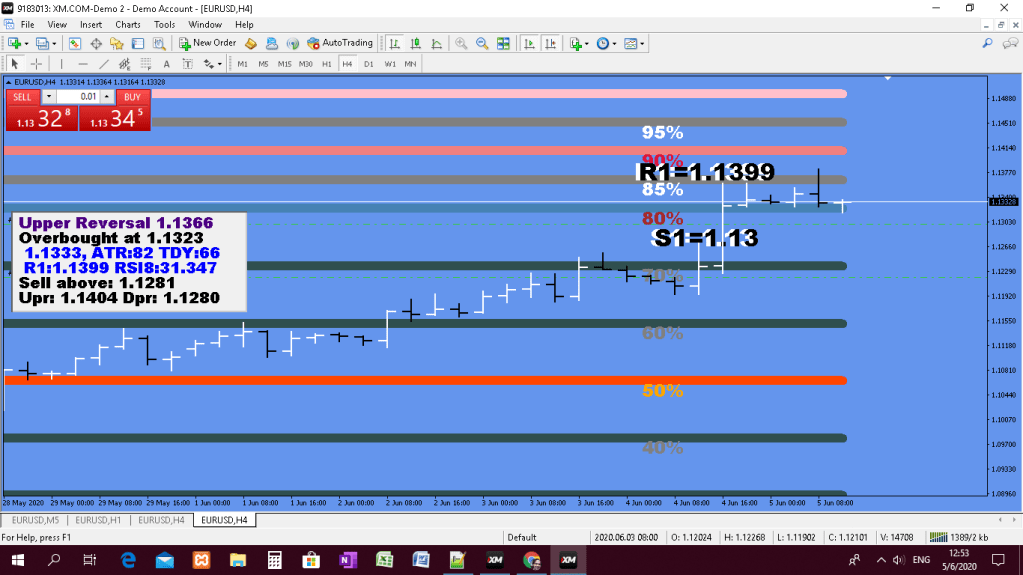
Upper reversal stands for the bottom of the reversal zone (85%-95%) – price is making a turn in the overbought zone in this field. Above 95% odds are a new high, coming back below 85% – odds are losing the overbought status. The largest moves happen out of losing overbought / oversold. Target 1: median at 50%
Target 2: the opposite end (overbought -> oversold) You are definitely looking at the right chart Fresh overbought/ oversold is toxic, would get rejected out of the zone
After 3 daily closes inside the overbought/oversold field price is “embedded” and higher highs / lower lows are guaranteed => overbought / oversold safety
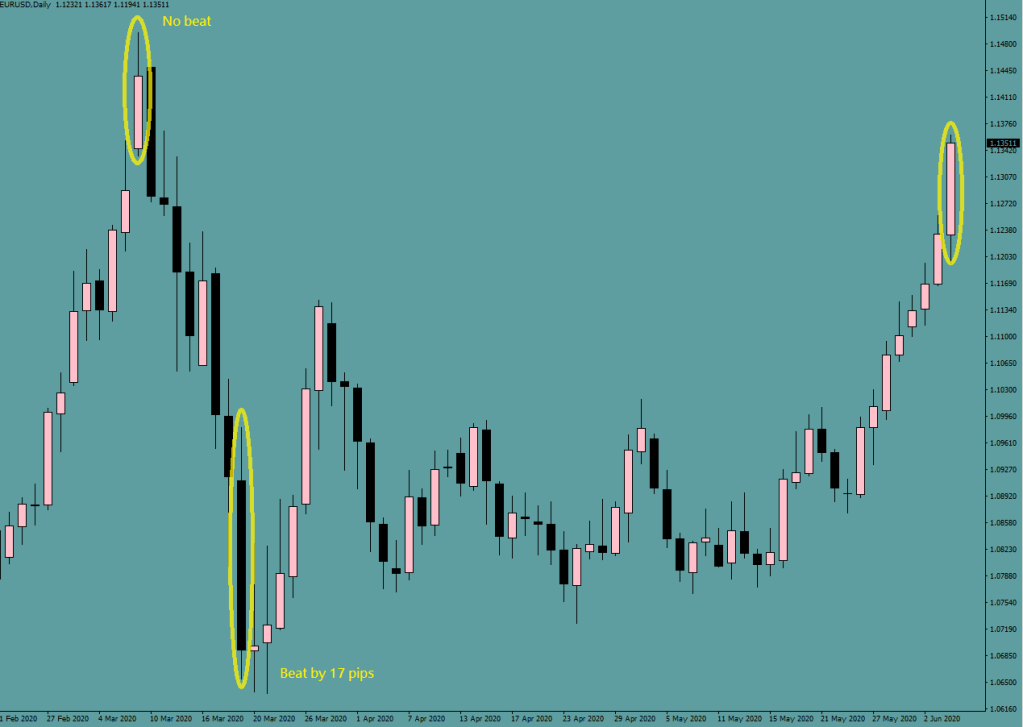
by no beat I mean not one visible on the Daily chartBeat by 21.5 pips
…
This is a break down, better get out of those longs.
Something I can’t explain: same account, same broker, same MT4, same instrument, same data, yet my Tosiba Laptop puts a vertical powder blue on the previous block too, how do the same calculations end up with opposite results?
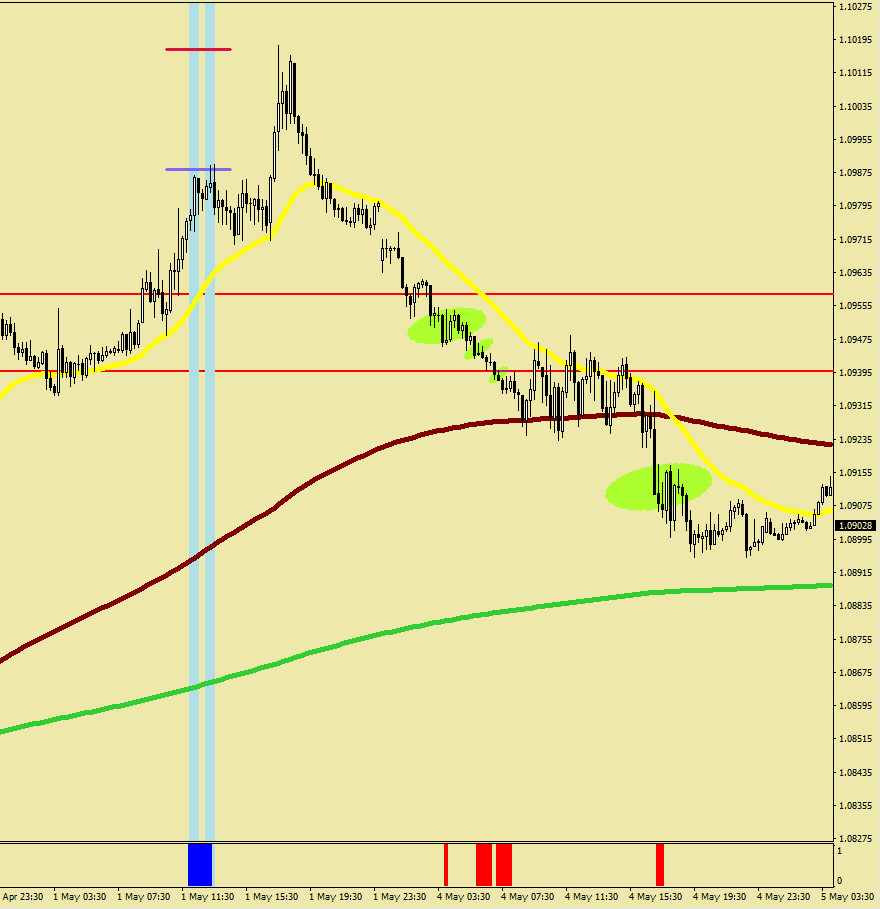
Hi, Be very careful here, this mean reversion has not been gaining traction, you got an extensive consolidation instead, which may be eyeing a number close to 1.12 or even beyond.At the moment price appears to be in a bear flag just under the 3x stretch marker, purple haze, if the bear flag plays out, price should dip into the green box, and that would mean a valid Wave 1 down crossing over Maroon. After 4x stretch from the mean there are no Primary Sells any more, hitting the same cyan line would become a Spiral Buy and you would have to buy instead of sell. Only secondary sells exist, so you would need the market to first make a peak, then pull back significantly, then re-visit that peak before re-entering.You would be looking for the beat in general, but in extremes, the retest may fall shy of the absolute peak. Mac
The unfold
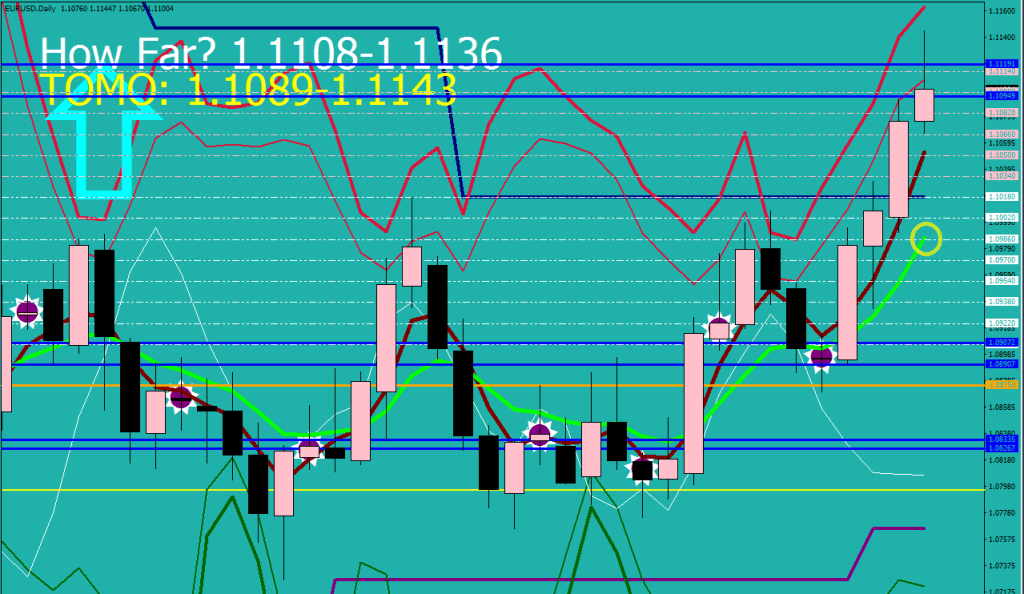
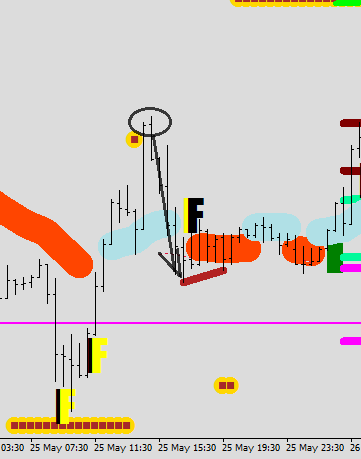
Today the price went outside the energy bands and tagged from below a previous support level (orange line)
Why am I not expecting any follow through here?
Because the daily energy is still in dire straits.
The 4-hour energy may have had a full charge, but the burst out could never have amounted to more than a beat.
What is the maximum size of a beat?
64 pips would had meant progress. 42.5 pips would just remain a beat.
The spiral buy was not reached, and the 8 hours of allowed rally time would run out in another 2.
…
These were – the safety concerns
The safety concern is when the hourly stochastic spends most of its time on one side and suddenly flips.
…
Hedge level values and held out last qualifying magenta levels for better visuals & info
…
Near Misses
The spiral buy level was missed by less than a pip
The invocation top was missed by a hair, thus the break out level of 1.1194 did not get re-adjusted
Wave 5, just as Wave 3 prior ended up with a successful break. Going with the example of Wave 3, price should come back down to the latest S3 number.
…
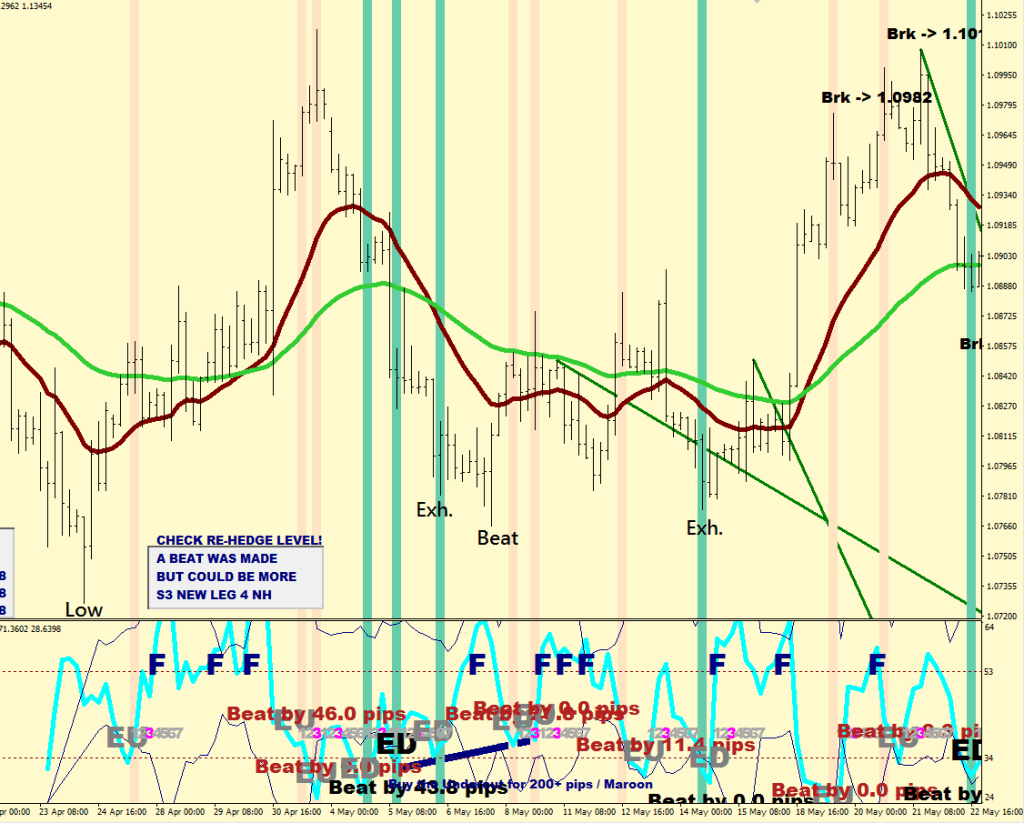
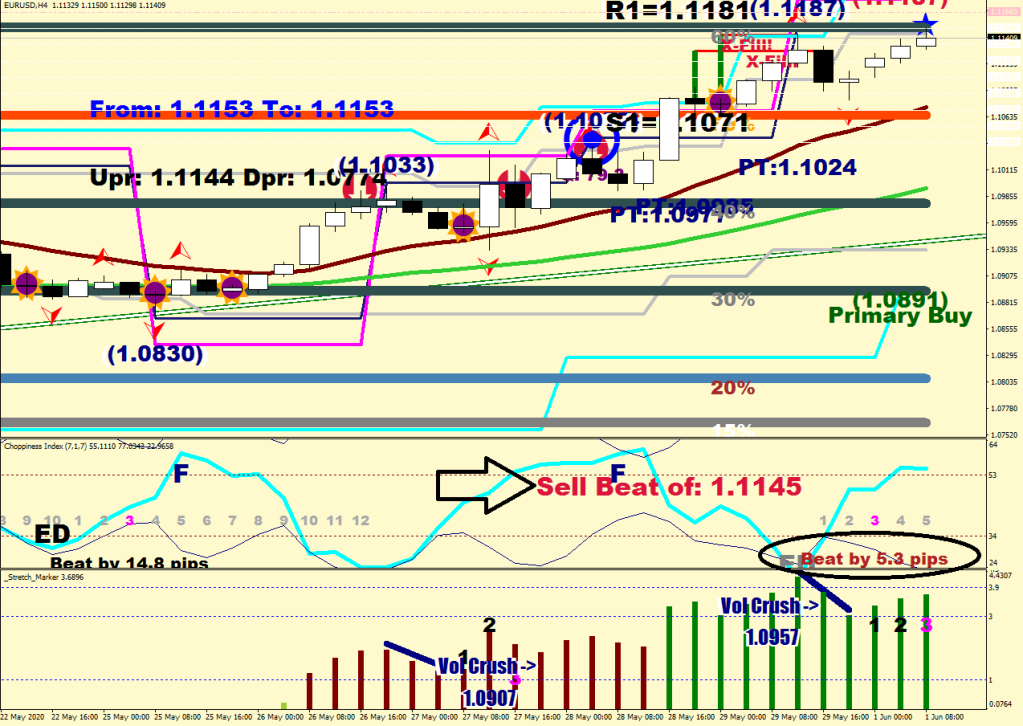
The 4H got exhausted one more time. The beat came on the “3” as was expected. Nothing to say not to mean revert any more.
Later the beat got extended to 30.2 pips on #3.
EU = Exhaustion up
ED = Exhaustion Down
F = Full charge The counter goes from the last exhaustion for 12×4 hours = 2 days => the beat should occur within this period, 3 is a likely time for it – see the last one
Understand what happened here when the market got a small lift over the weekend from below the continuation level.
An automated re-visit of the top was put in place where the market makers would get extra help from those buying the gap fill / continuation level of 1.1005.
Price never got engaged with the upside: it stayed away from the upper gray limit line.
What is a beat? A failed break out over a recent price extreme.
Why is this happening? Because there are physical limitations to what a market can do without consolidation.
For instance, when the 4-H energy gets exhausted, I plot the “sell the beat of / buy the beat of” text as well as EU which stands for Exhaustion Up (Not European Union). The exhaustion level gets surpassed by the little extra distance the commuting mean would provide (inertia). The beat fails the exhaustion level by surpassing then coming back through it.
Primary Target is still 1.1024
These extremes always get a re-test that usually results in a small beat (see the prior one was 14.8 pips, this was 5.2). Can they expand on the size of the beat? Sometimes they do. Leave enough slack not to get stopped out.
I refer to fading the beat as Secondary entry while the exhaustion itself is the Primary entry. Since the Secondary is further out for the most part, it is the better location.
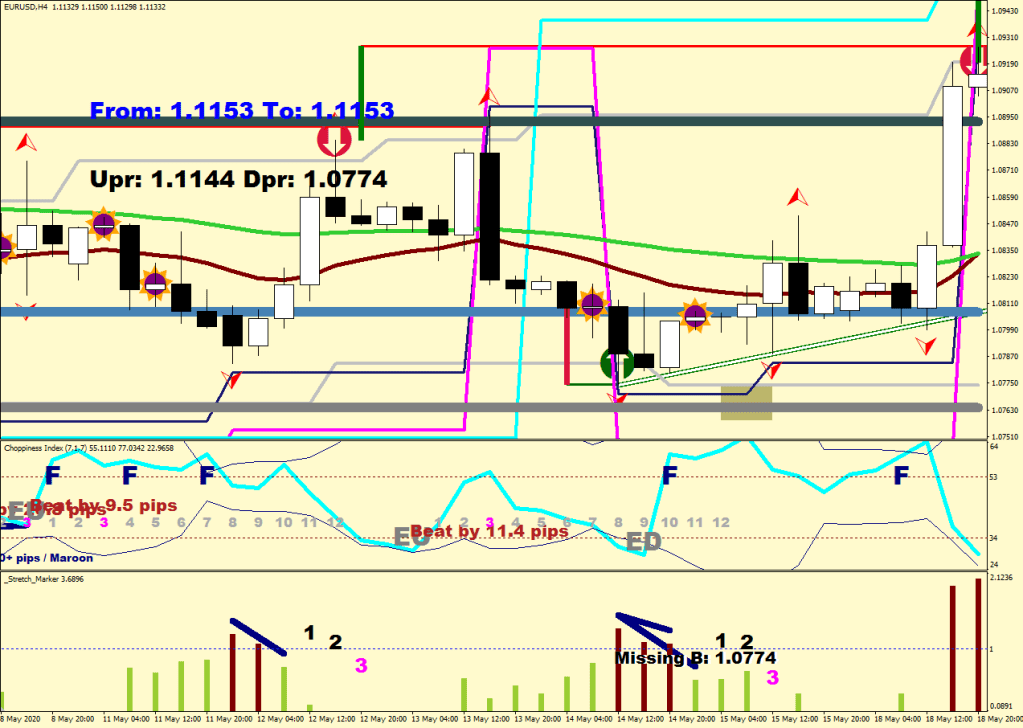
The exception to this beat was recently the higher low that defined that green-white trendline (I plot “missing beat” to highlight such event).
There it is – That’s where there isn’t! (The Missing B.)
Now, concentrate on Volatility Crush. You can see that after a 3-bar drop, you would get a counter move there is always a 2x-3x 4-hour slot when the beat should materialize.
I was trying to explain this volatility AC/DC motion to someone and told him, “if you understand this, you understand something about trading”.
Where are we at now? At the 60% comfort level. There is no unfinished business on the upside. A mean reversion may commence from here.
…
The title reference
…
Now the beat is 8.7 pips
…
Looking for the perfect beat?
…
The buy signal of the Stochastic Bars Stripy was spot on.
This is all the current history on the 5 min available.
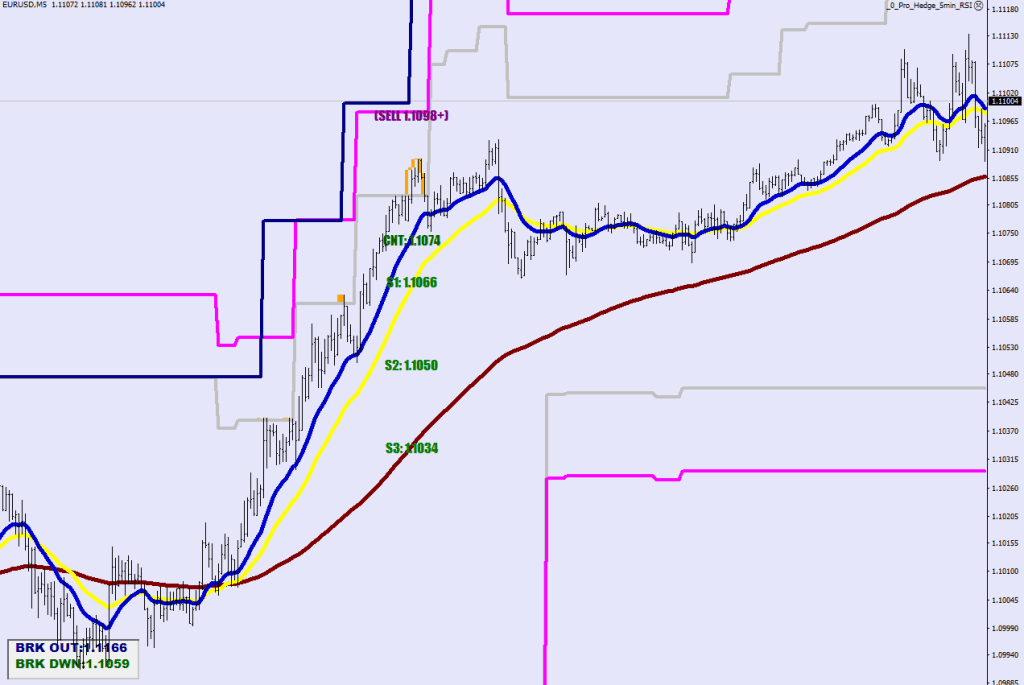
On the 1st image the Support plots don’t reach as far. What do you see here?
Market is engaged with the upside
Market is in pursuit of a break on the upside (Navy line, later)
Price went parabolic (beyond magenta) – in need of a correction
Correction ends just shy of S2
Market does not engage with the downside
E-135 does not serve as a resistance on the way up
The next leg up.
The Market re-visits the previous parabolic tail and makes a beat over it (less than 10 pips this time)
The Market is still engaged with the upside, but there are caution flags: the second run up should had reached the break out level (in Navy, later)
On the way down S3 gets overshot – it is a beat still, but upside potential is limited
Price finds resistance at E-135 => the Market has turned direction
The market starts stair stepping down until things get over-heated to the downside
The First parabolic move (circle #1) gets a quick reaction – like going into water that is too cold
The Second parabolic move gets a bigger reaction
There is a quick beat of this para move that brings about a relief rally
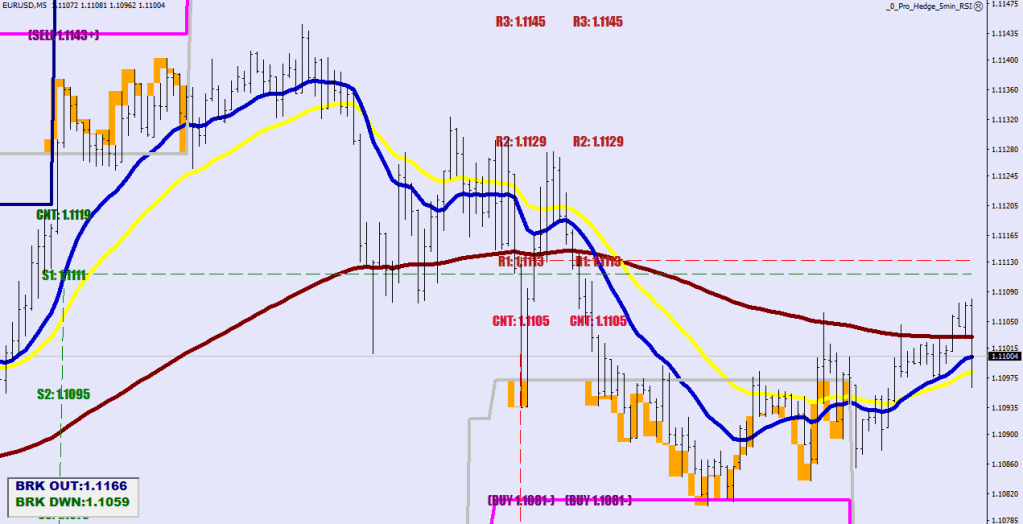
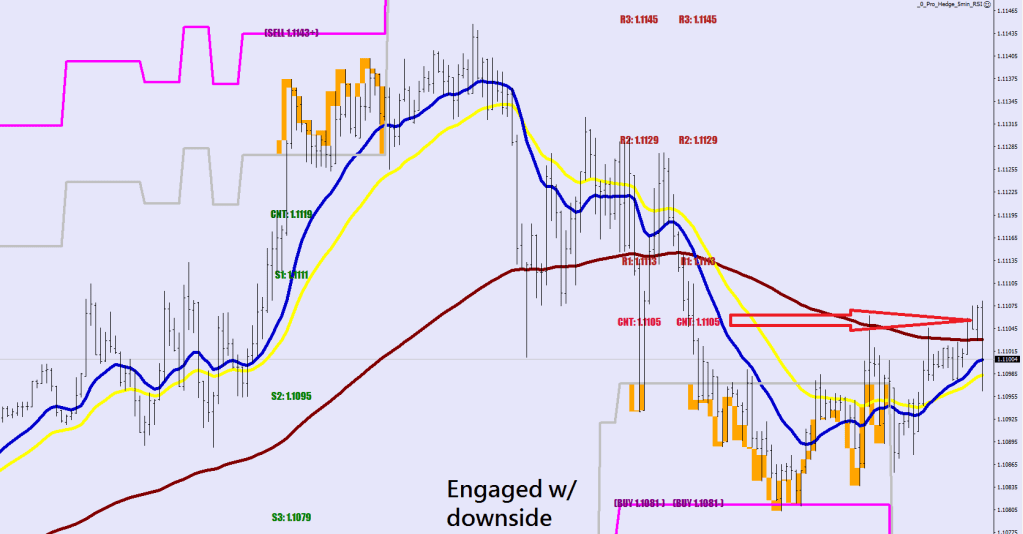
The Market currently is in engaged with the downside, and it is in a pursuit of a break out
R1 resists on the upside (very limited upside motion / volatility)
The Pursuit of the break out fizzles out without reaching the Green break out level and R1 gets violated on the upside instead
The Market has turned back up
The Market goes ballistic on the upside
The Parabolic tail goes beyond the magenta – in Pursuit of a break out
The gray neckline, where price went parabolic (arrow), does not get violated – this is still the same wave up – likely a Wave 3
The Break out is finally happening – the Navy line
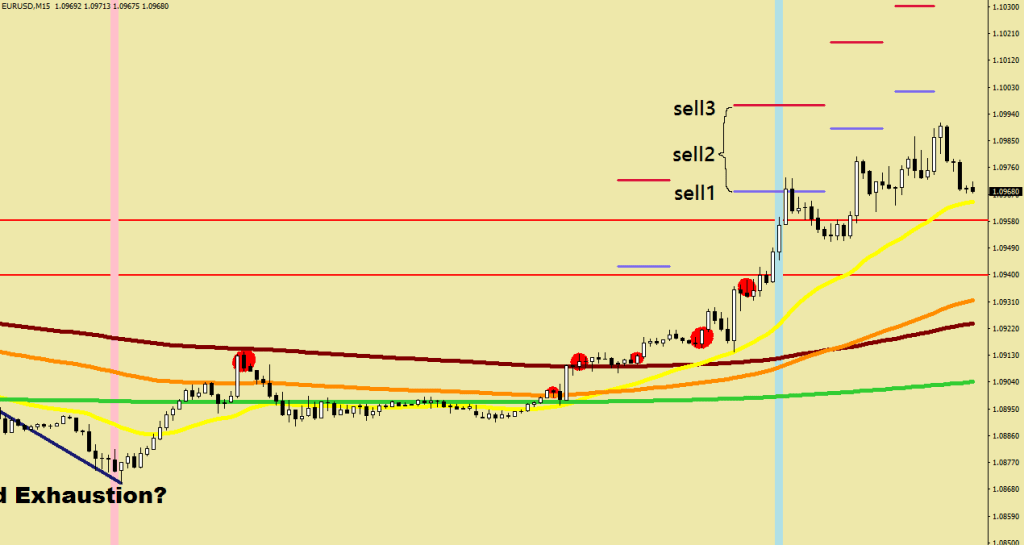
There are 3 attempts, but the break out only registers about 11 pips, so it is unsuccessful (<16 pips) => back to the last continuation level of 1.0938 (CNT on the screen)
Here you see the next parabolic move that is in instant pursuit of ta break out.
3 Attempts in quick succession, but the break out isn’t happening.
With one more parabolic (echo) wave up the support levels (and the break out level) gets re-adjusted
S3 is the next buy after the capital failure
E-135 on the way up yields to the move
The next leg up starts after a quick spooling around the E-135
It overheats a couple of times, and keels back to the continuation level – just shy of S1 – this is likely still the same wave – most likely a Wave 5
They buy the 3 pullbacks just beyond the E-16 – this is definitely a Wave 5
Price is in Pursuit of a break out
Which brings us to last Friday
The break-out finally happened (>16 pips)
A large correction to S3 is logical & was almost reached
The market engaged with the downside
It is in Pursuit of break on the downside
Price only made it back to the E-135 where it failed (shy of R1)
It is still the same wave down, most likely a Wave 1 which in theory should come in contact with Mr. Maroon before it ends
Mr. Maroon currently is from 1.1056, but it is coming closer of course
A Mean Reversion would take price back to 1.0960
…
Extension fill – added for a more complete picture
Fractals, that barely made it back beyond the E-16 invoke the new Fluctuation Sized range limit. If you still had any doubts, that the Euro’s fluctuation size is 32 pips – well, check it!
There’s a prelude & then there is an opportunity to get in on the exponential move – until not enough rest is made and you catch up with the limit.
The moving averages are: E16 Blue, E32 Yellow & E135 Brown
Change Lookback value for more history.
If a Wave 4 runs in high octane in 3rd gear (dip below E32 is a buy) then a parabolic tail is kerosene and 5th gear (E16).
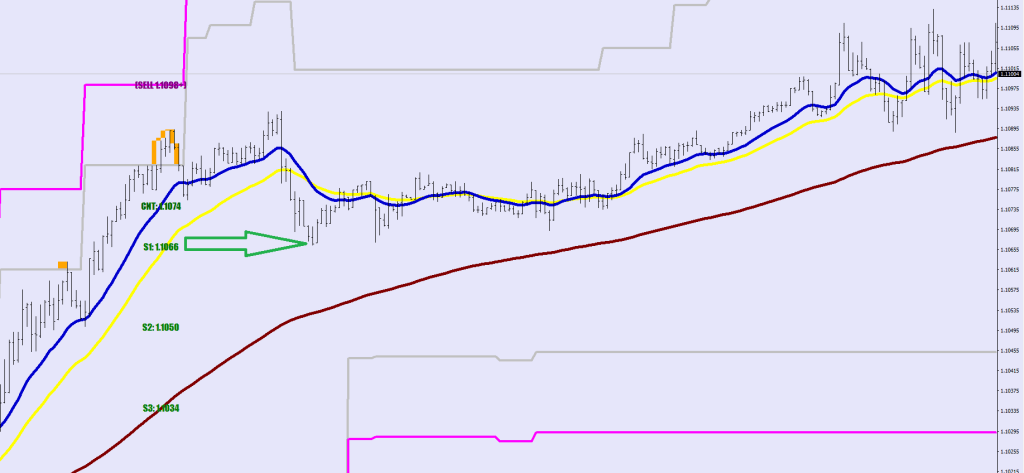
Pay attention to how price came back only to the last Continuation level after making that quick dip. Support 3 was bought right after.Support 1 was bought.Currently the market is engaged with the downside. The continuation level was not exceeded successfully.
The 5 waves down wasn’t too hard to figure I hope.
On the 4 Hour you can see the trend line that they purchased again.
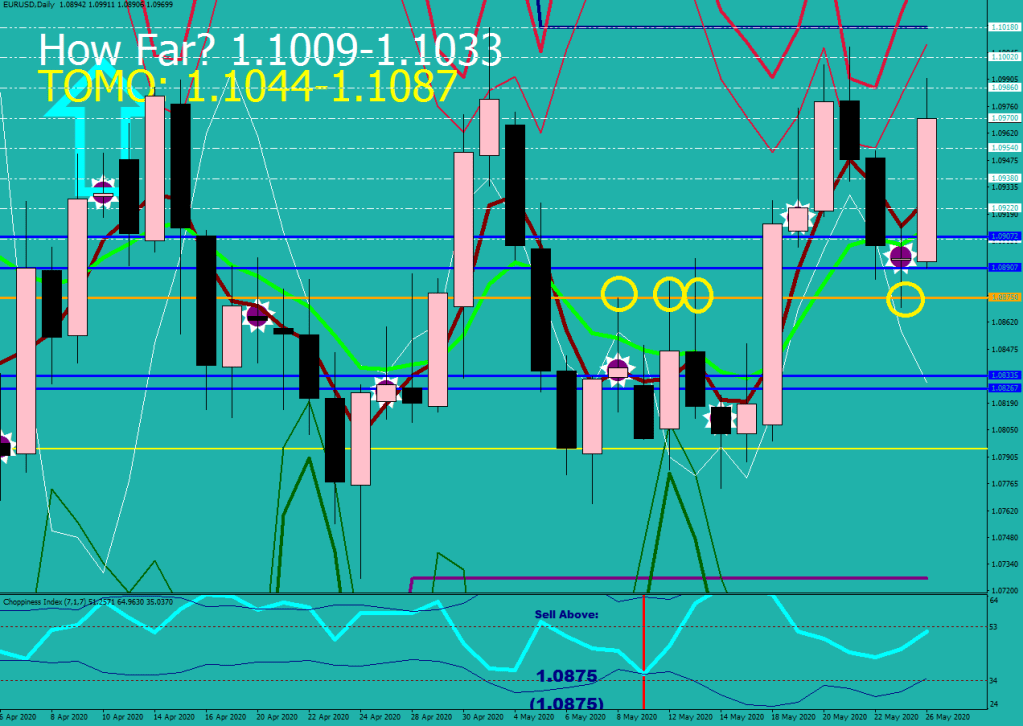
I know, this volatility crush did not make it to 1.0865, it was bought right below 1.0870.
Look, how crucial that 1.0875 has been!
Back to the Waves.
Nobody’s teaching this, it is my finding – thanks to using my own moving averages and plotting the highs and the lows out of habit.
Wave 1, 2 and 3 all cross through Mr. Maroon, Wave 4 and 5 usually does not make it beyond E32, they usually start from between E16 (Blue) and E32 (Yellow).
What makes a Wave 3 a Wave 3? It is the only wave capable to sustain a move beyond the sound barrier / brownies and usually would make a run to the daily potential, which is 1.0-1.3x the ATR of the last 3 days.
This is why the LEMA 30 RFC plots a giant #3 when the fluctuation maximum gets exceeded by a wave. As you can see, the starting point of Wave 5 down was also apt.
The 15-min ATR plots the orange field of where the end of Wave 3 is expected to land – in this case it was from 1.0973-1.0995
Rules of a Wave 3: do not defy a Wave 3.
Hints of riding the Wave 3:
You buy every 5-minute pullback to / beyond the local E-32 until (when it is above the E-135) the last absolute high exceeds the previous absolute high by more than 5 pips.
The criteria that I used for the auto hedger is that the highest high of the last 10 bars has to be larger than the highest high of the bars from 11 to 37.
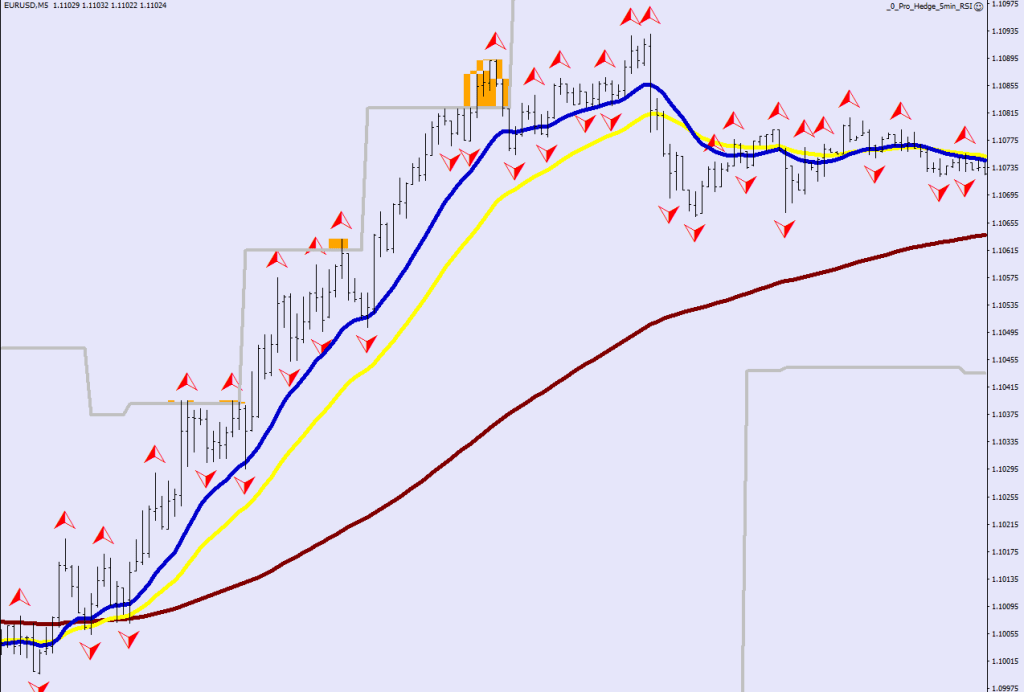
As for the Stochastic Bars Stripy, I’m not sure if I’m going to make any changes, as for the strike out may seem on the early side, but the range (station) it called accurately.
They say a top is a process, a bottom is an event. There is some truth to that.
…
Here you can see Wave #1 failing at the Sound Barrier.
…
For Wave 5 now you are looking at 1.1050 with a slight chance of roll over in the low 1.103x-s
The Energy Bands would likely be from 1.1046 to 1.1091
The 50% comfort level is at 1.1065
…
Wave 4 down is due. They made it rally into the close as they always do to leave the cash market with maximum pain.
They improved on the last high by 3.9 pips (<5).
…
Wave 5 up was an extension fill (Projected Distance 240)
Projected distance and the “Forest” are some of my oldest ideas, they were in my book, the Computer Aided Trading, and they are still relevant today.
The Forest works when nothing else does: the market is merely making steps in a direction without any conviction.
The Green lines are a version of the Forest.
What does the Forest say? Ding-ding-ding-ding ding diring – buy here & here.
In this case only the first number gets its fill – & projected distance above clips the top.
See, there are no stochastic bars below, and I can still give you the buy level.
The Pink is a warning that things may be flipping up soon – and sometimes it would turn the price without further enforcement.
Here’s the worst example I could find, where I missed the top by 30 pips (from the horizontal needle). Hmm… What does that number remind you of? Well, a fluctuation size is 32 pips for the Euro. The train never left the station, just pulled forward all the way to the end.
Let’s implement the close-to-the-other-end-of-the-station-marker then…
Better.
It would further explain this move, although the strike out was in the right place already.
So is this the smartest thing I’ve ever done? Aside from creating a hedger making use of the strike outs and considering to make a cropper with the same conditions but a bit delayed as a step two, yes.