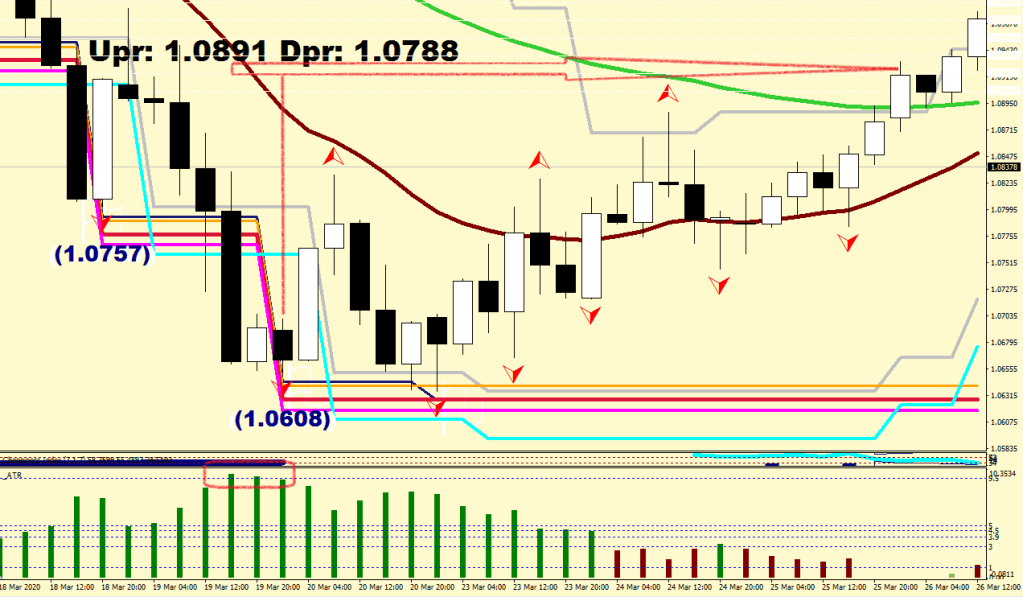
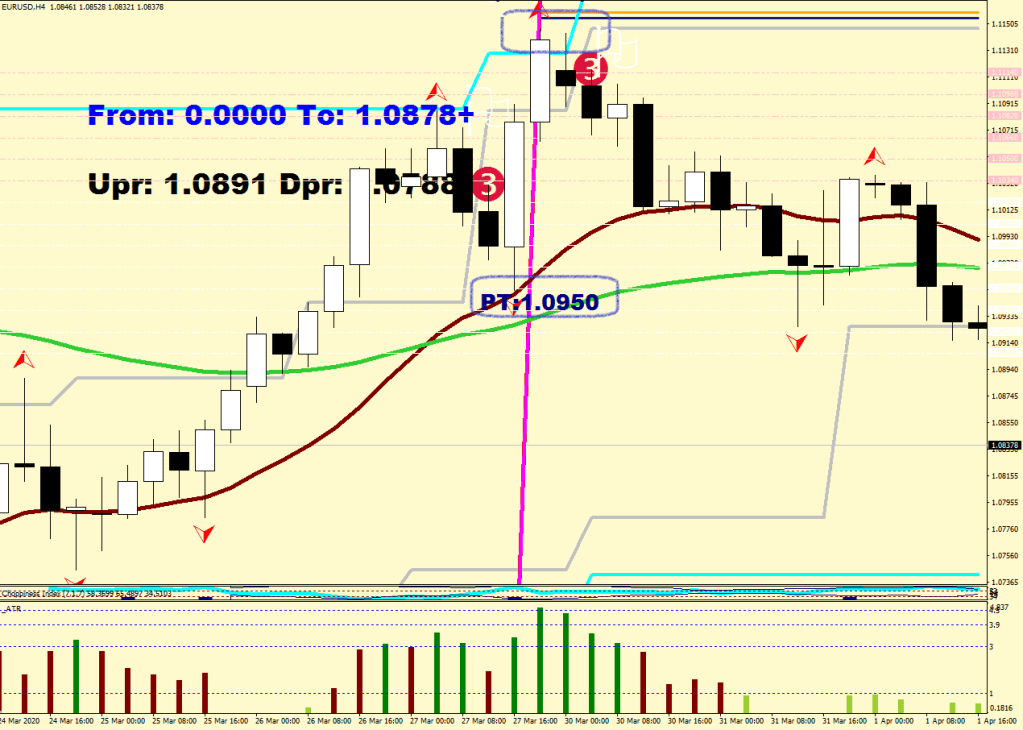
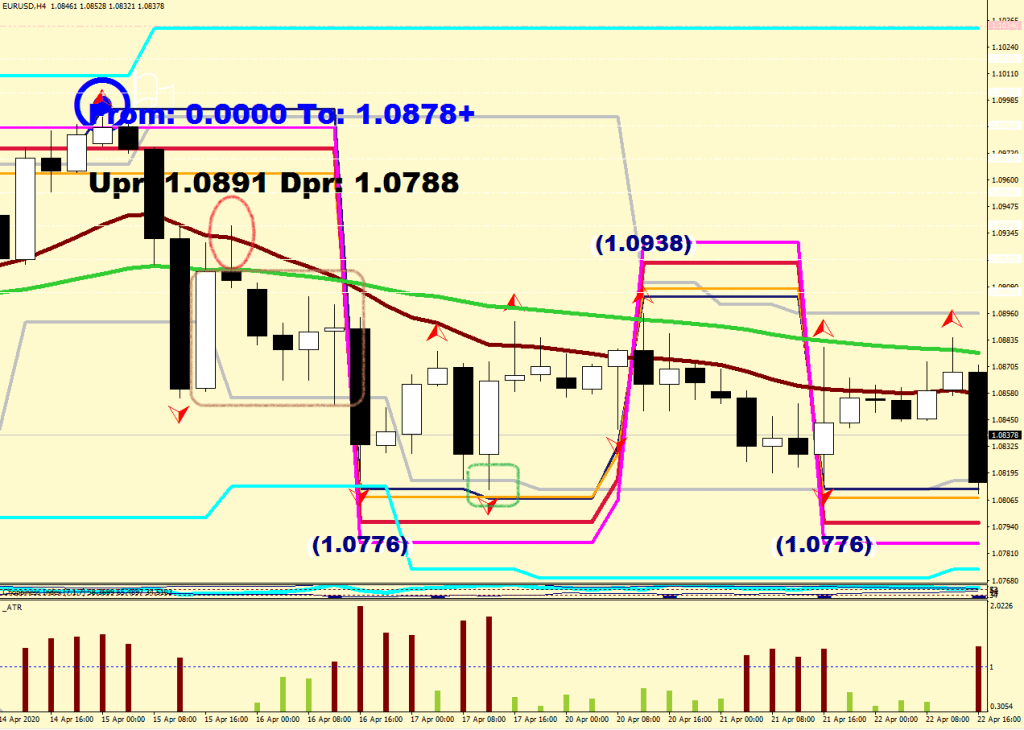
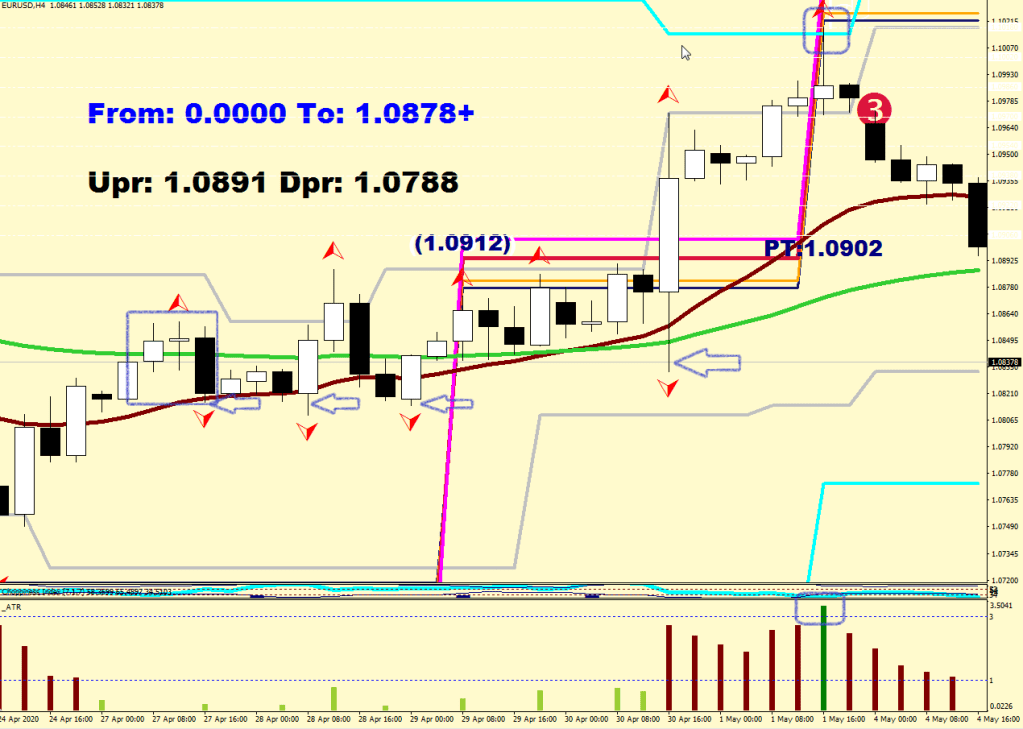
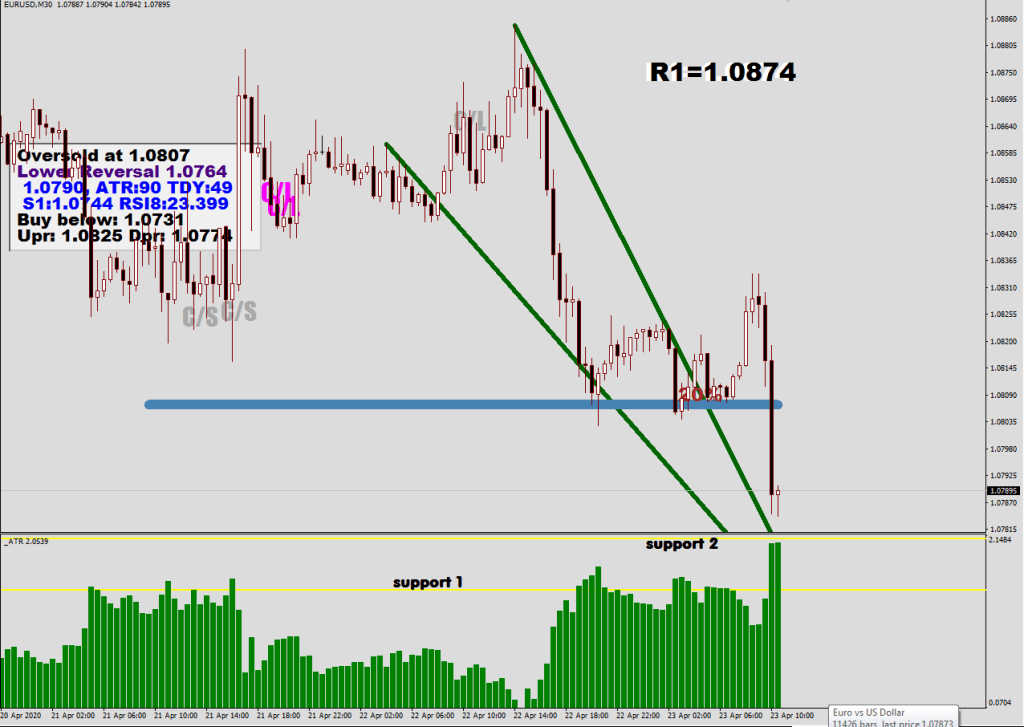
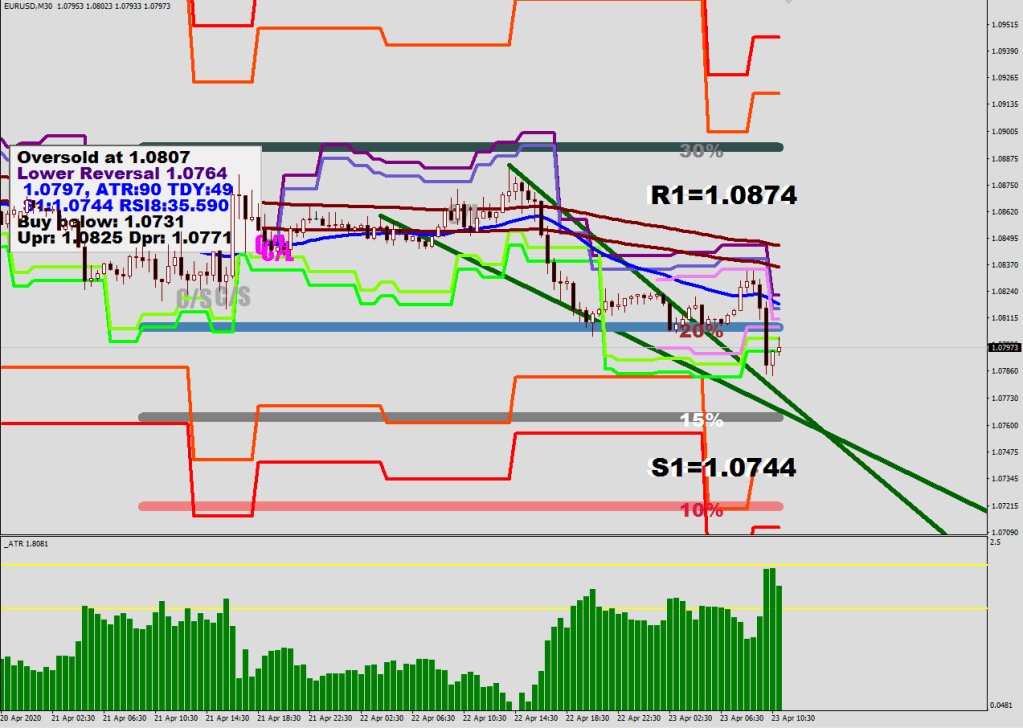
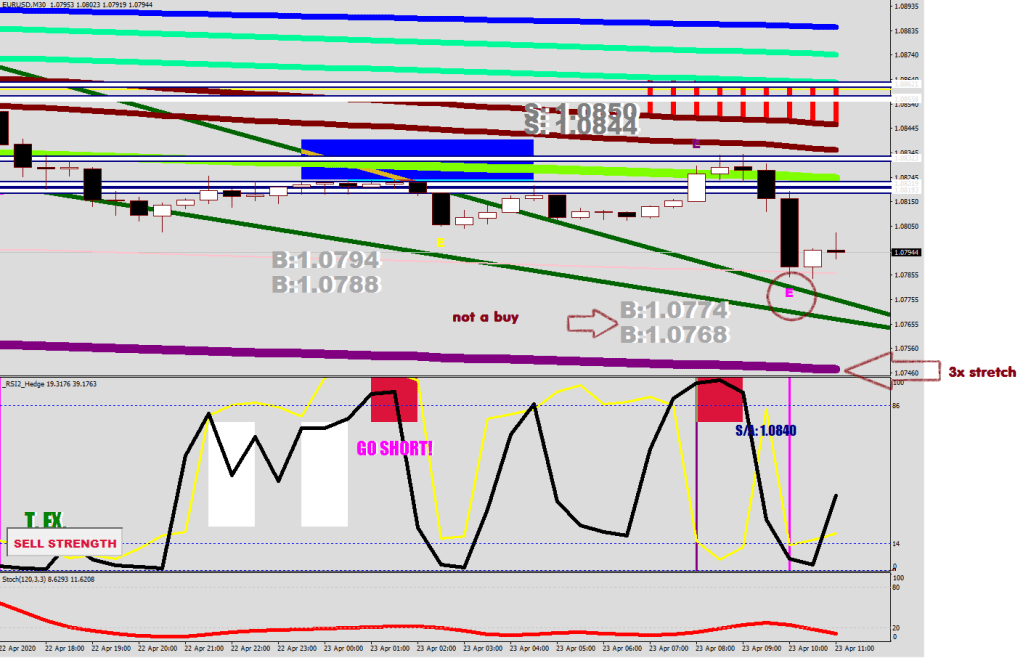
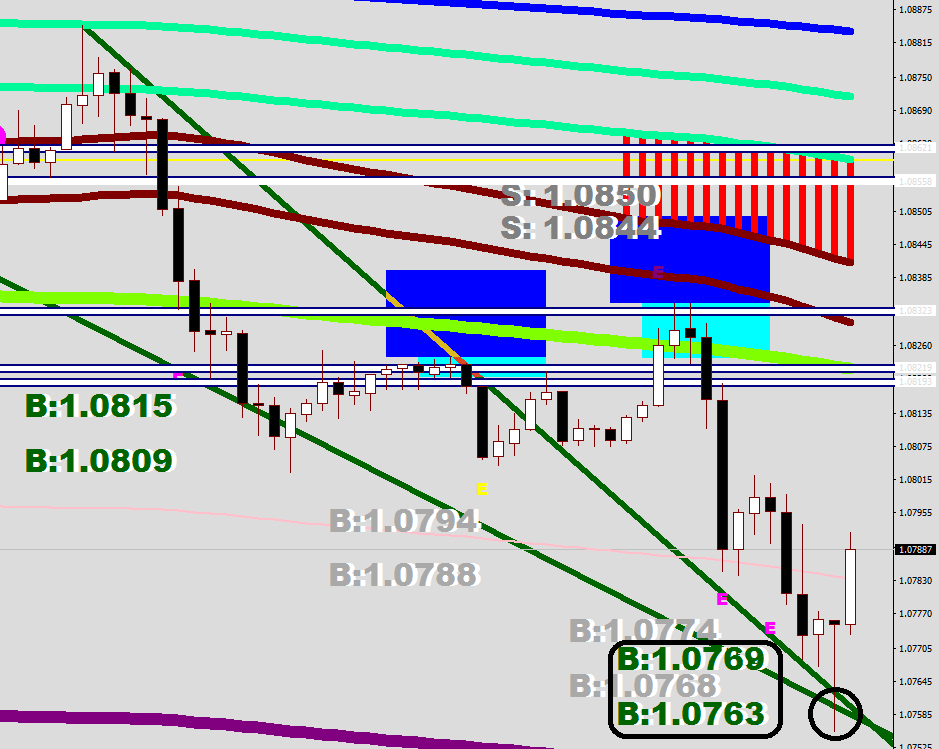
This was the email I sent out to my 2 students at midnight.
In text format:
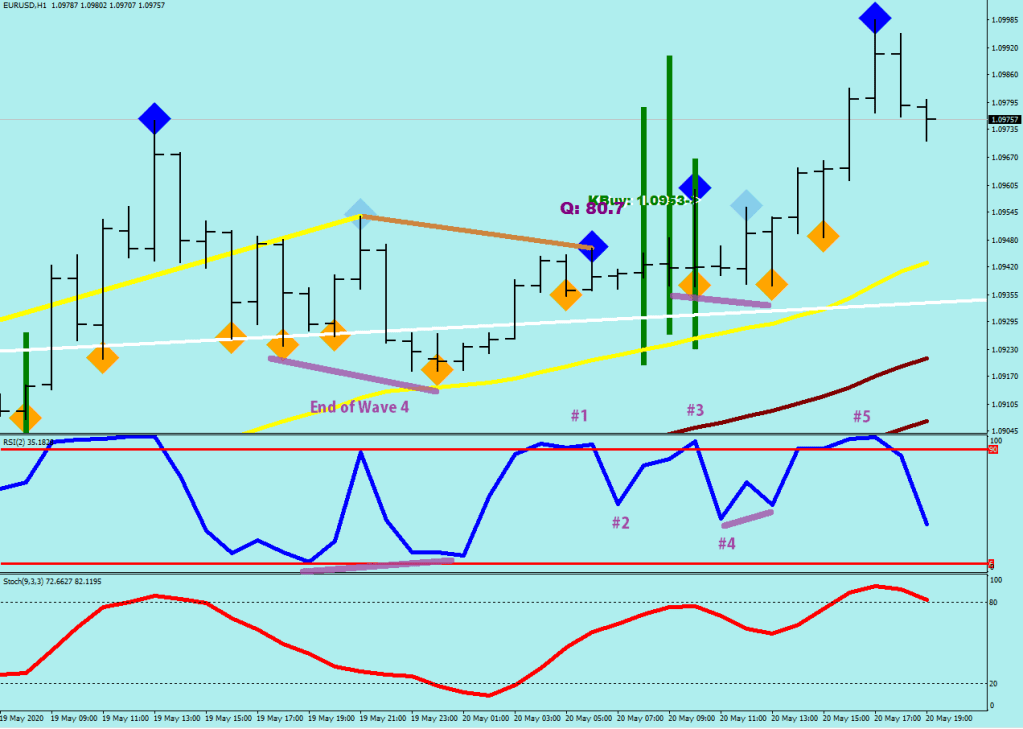
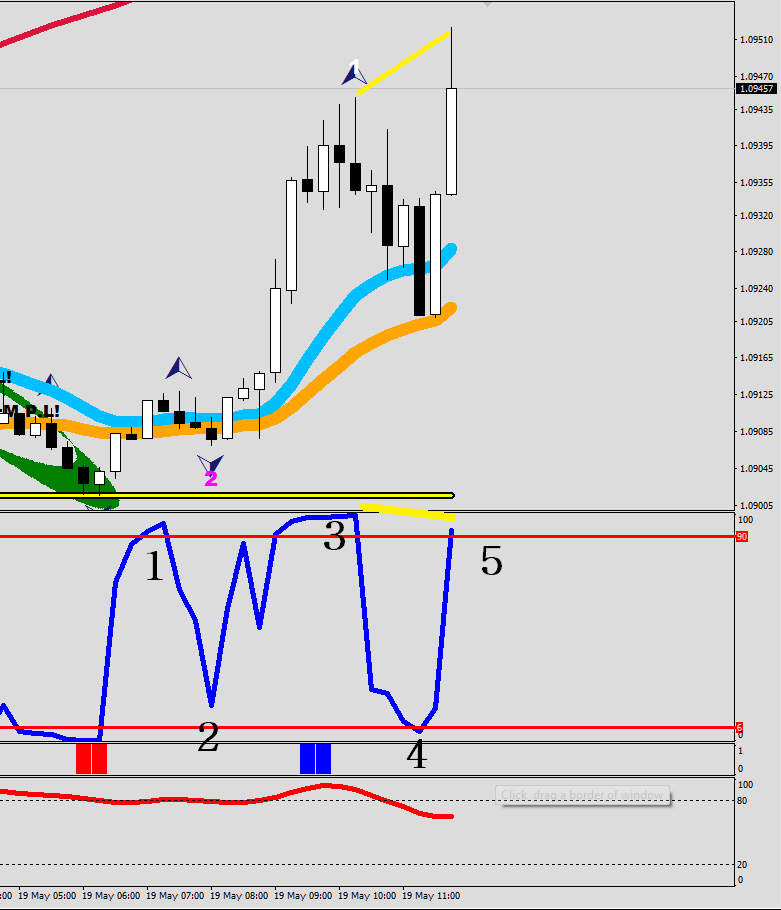
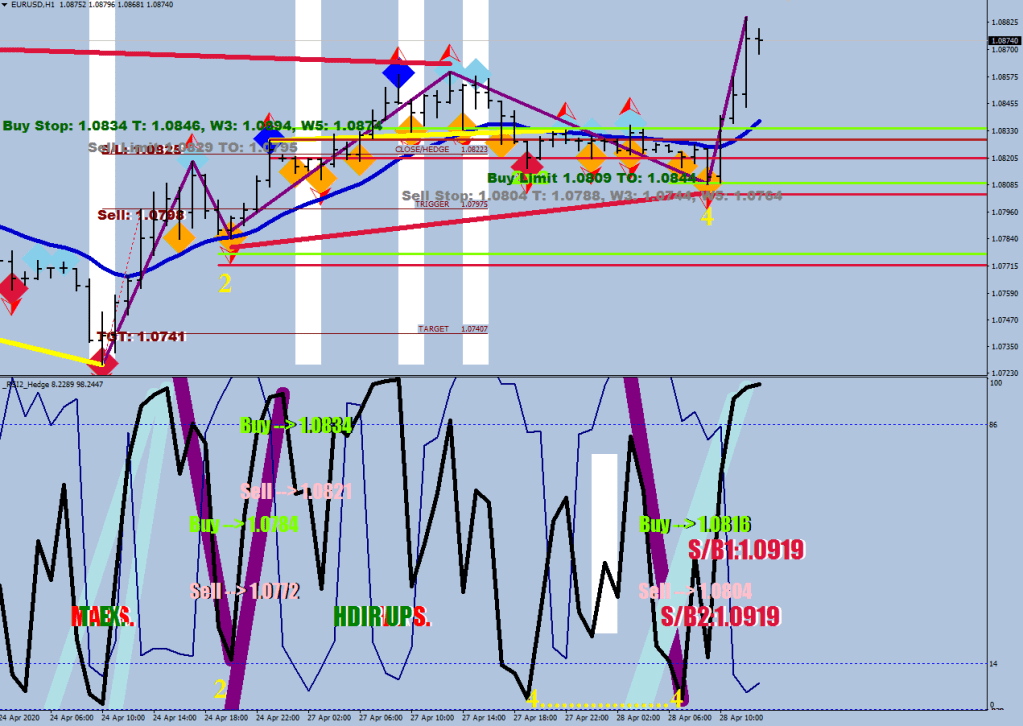
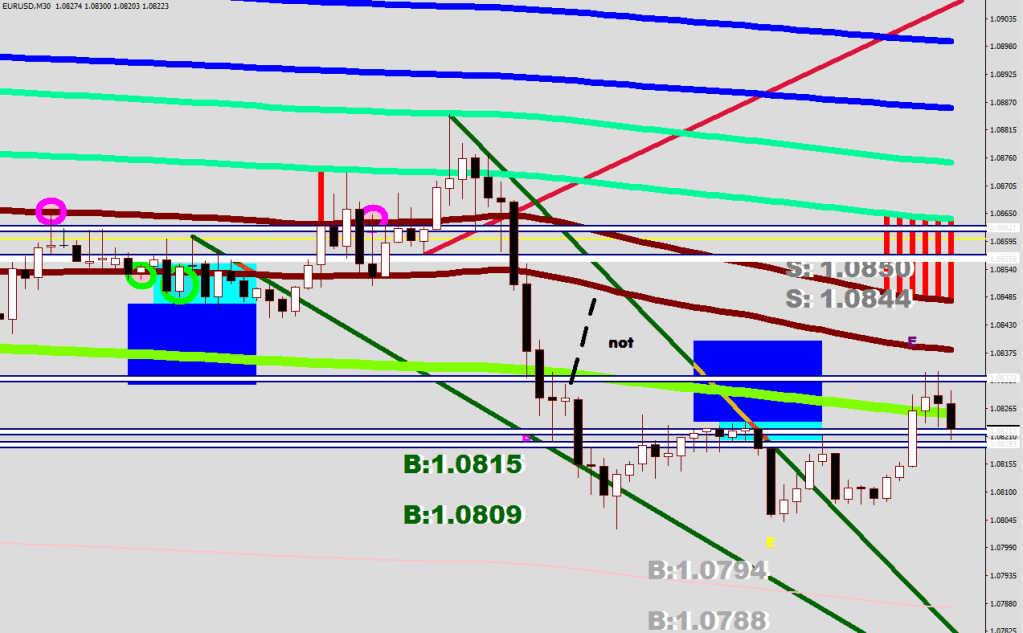
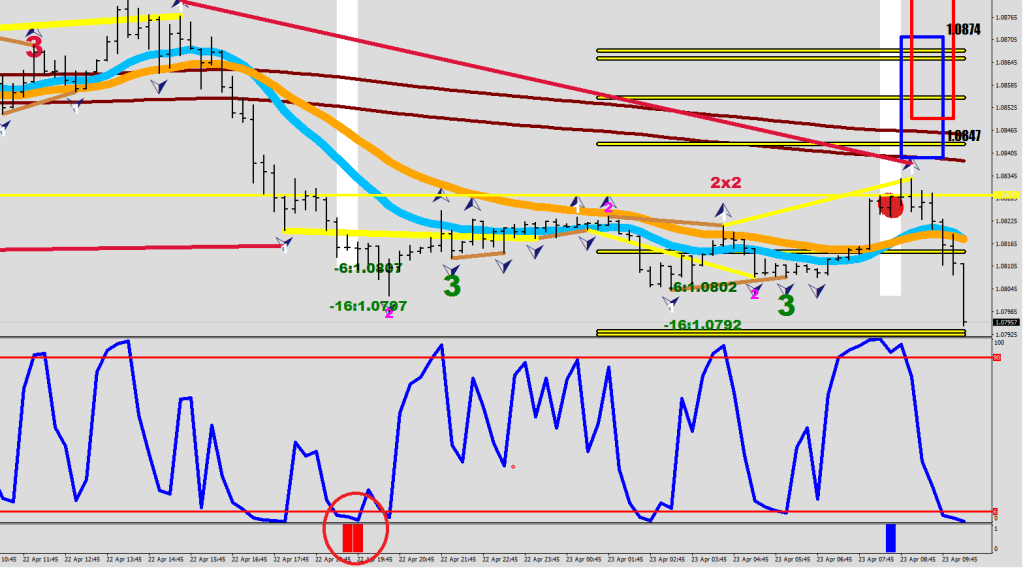
For a Wave 4 terminal point, you are looking for oversold having hit below 20 plus a continuation divergence relative to wave 2 down: a lower hourly RSI2 reading with a higher low (sometimes the end point of Wave 4 is a pair of low reads showing a reversal divergence back up, so the lower read does not always exceed that of the Wave 2)
It is still possible that Wave 4 would dip down to the Upper Guard rail, but it is sort of running out of time at this point.
These are the GMT 4-hour candle opening times 02:00 06:00 10:00 14:00 18:00 22:00
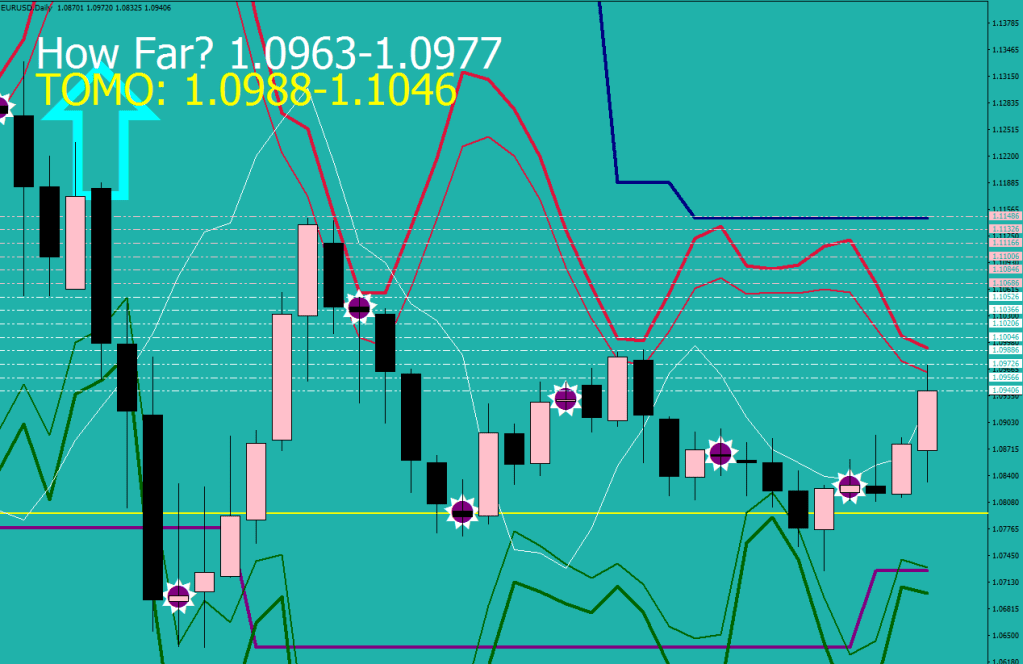
So., the 1st Candle would start at 2 AM, the 3rd at 10 AM. I expect the beat of Wave 5 up occur between 9 AM and 2 PM 1.10 is definitely on the radar The North value is 1.10250-1.1049 – which is what a Wave 3 would be able to do. A Wave 5 would probably fall shy of that by 20 pips. I think 1.1018 isn’t gonna be reached, but price could get close – the prior swing high (see daily chart).
The next Daily resistance levels up are 1.0989 and 1.1049 The 40% comfort level is at 1.0979 The break out would start at 1.0966 (see hourly chart), which suggests W5 at about 1.1006
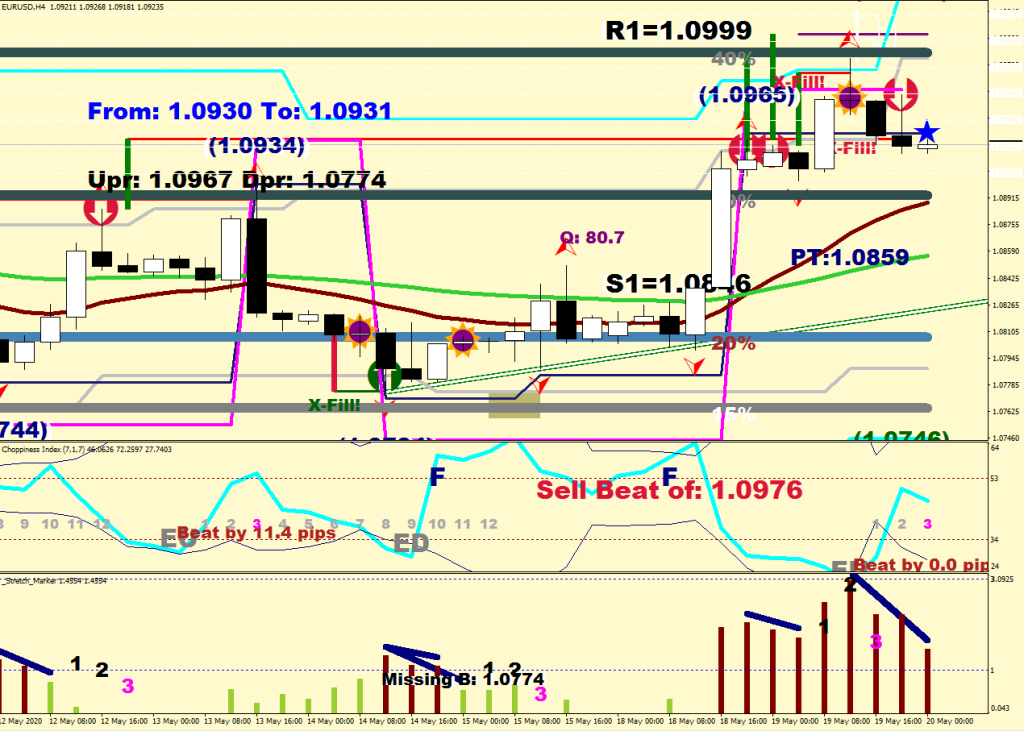
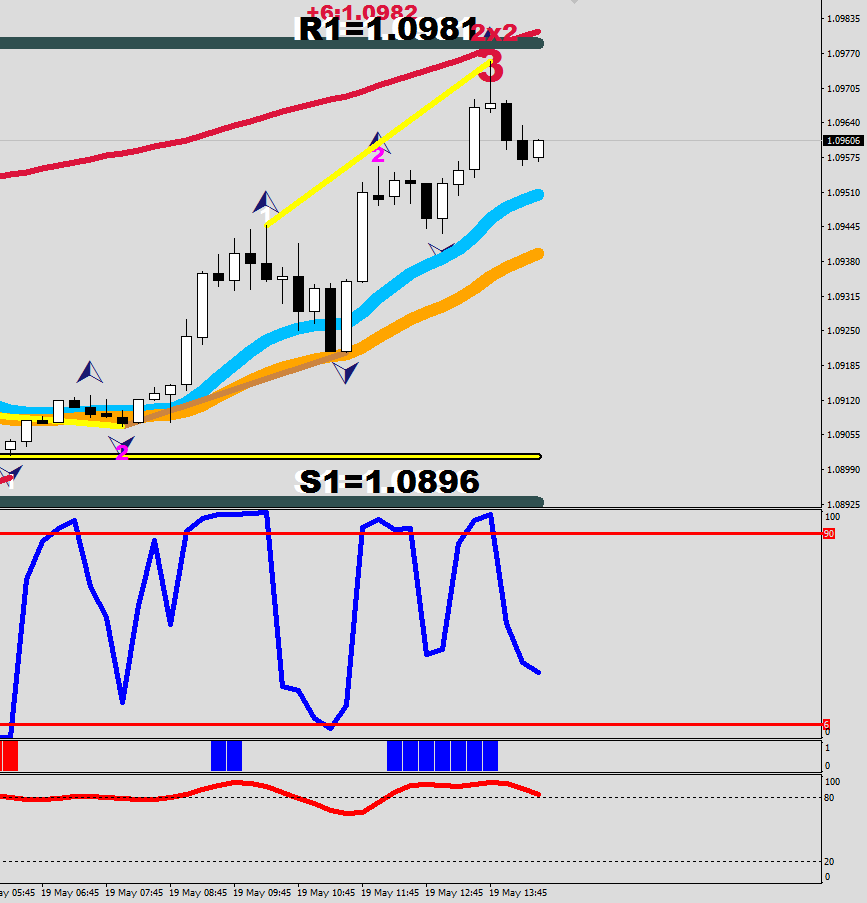
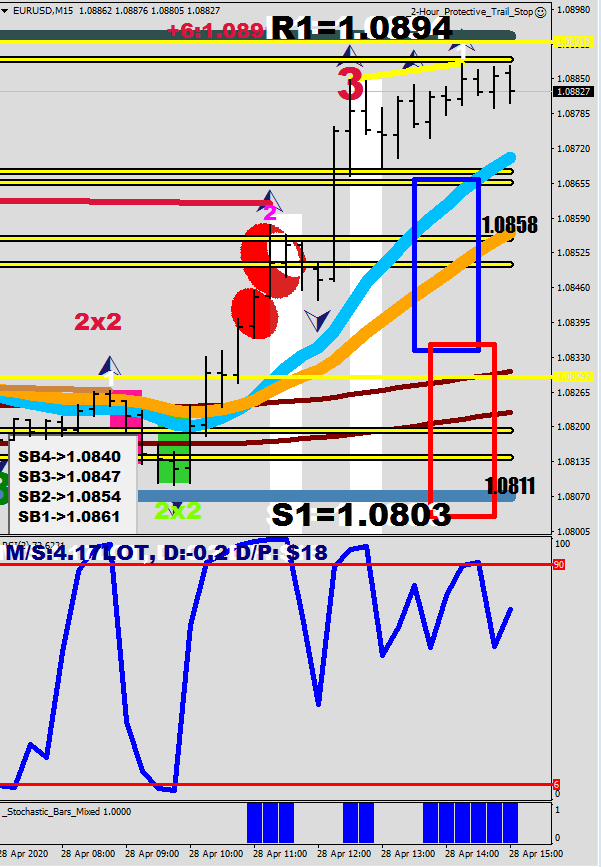
Yes, that is R1=1.0999 up there. Automatic as everything is with me.
The actual beat high was 1.0999 and came 1 hour 15 minutes after my suggested window.
When you have a missing beat, you need to consider the possibility that it would stay without beat for a while: it may be a higher low or a lower high, thus it is a root of a new trend -> trend line. I made the plot automatic.
…
Price broke through every resistance level in one day, so now it could make a reach for the energy bands.
Daily Resistance levels:
1.0951
1.0989
1.1049
The Sell / Beat at 1.0947 in red sounds about right. The purple dash represents a liquidity break. A liquidity beak falls short of a full lambda move, for they step in and buy it up aggressively.
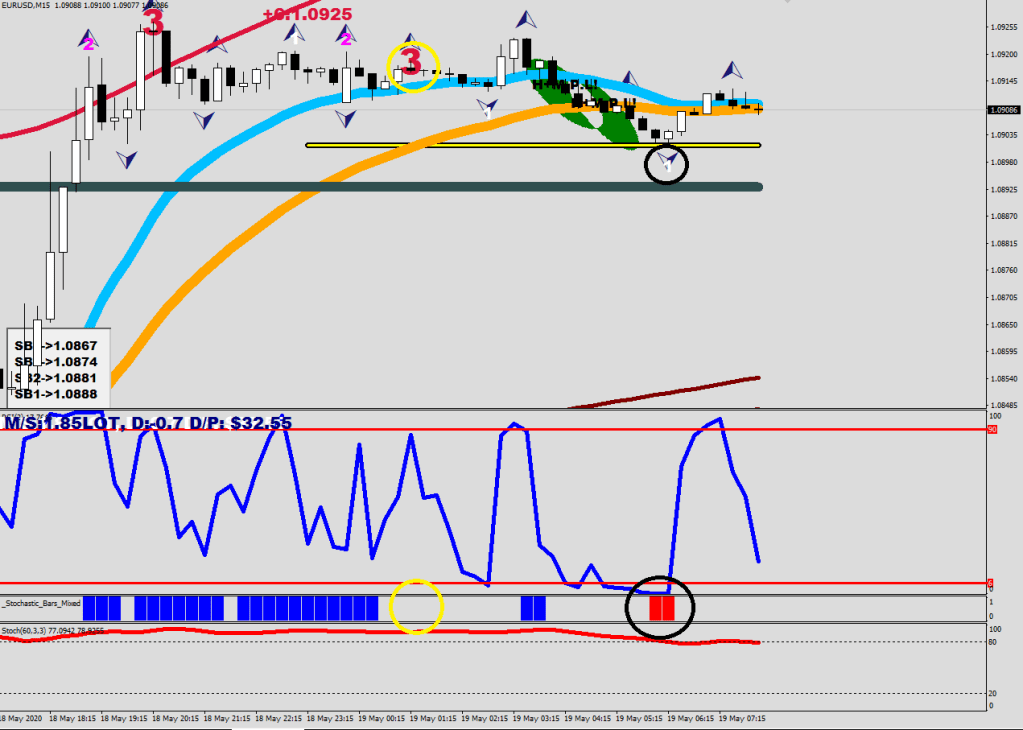
On the 15-minute you need to see a fractal without stochastic bar print (yellow example).
This was the entry.
I would consider Wave 3 finished now with this wave 5 of Wave 3 print.
Next there should be a Wave 4 down which would make the hourly 9-sample stochastic go oversold at least once (<20) and the hourly RSI2 twice (<6). Keep an eye on E32 in yellow for the start of the last Wave (5) up, which may attempt to fill the latest extension beam(s). An extremely deep Wave 4 would walk into Wave 1. I’m mentioning this because the Wave 3 up printed a “shape” which is likely going to reject price down real good due to the parabolic end. Look for a hourly ABC correction to go long again.
wave 5 of Wave 3
…
They managed to play this up to the Primary Sell Level filling an extension as well along the way. The target is Mr. Maroon.
The market is now more than 3x stretch away from the mean.
Primary Sell was hit, the extension was filled, the energy bands were hit and a prior trendline got back tested.
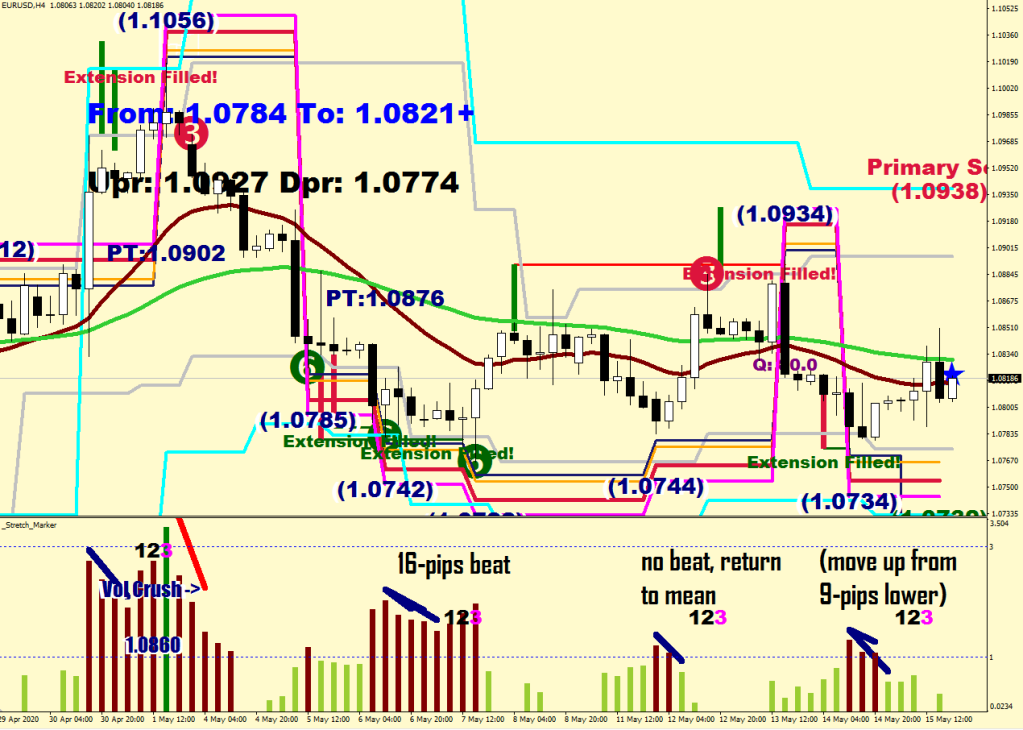
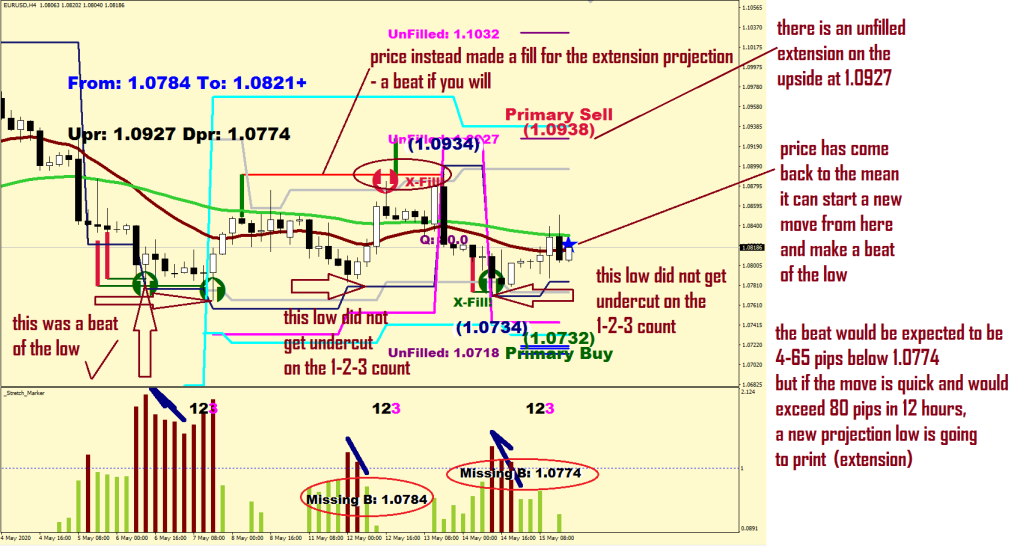
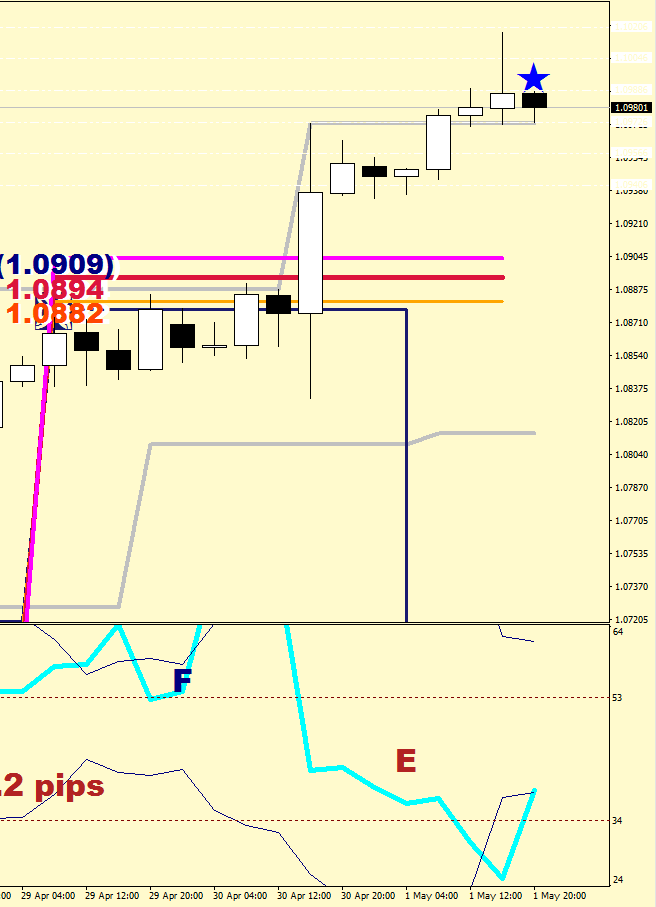
Hi, For timing the mean reversion this is what I was talking about with the 12 hours. The following trades I refer to as “Secondary entries”.
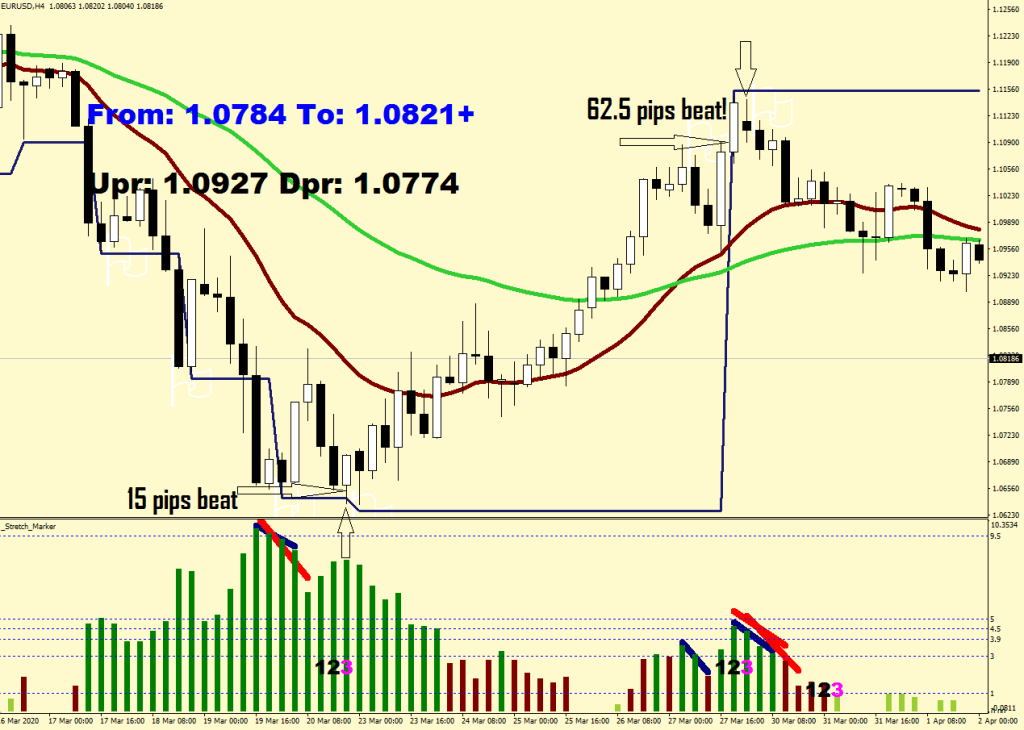
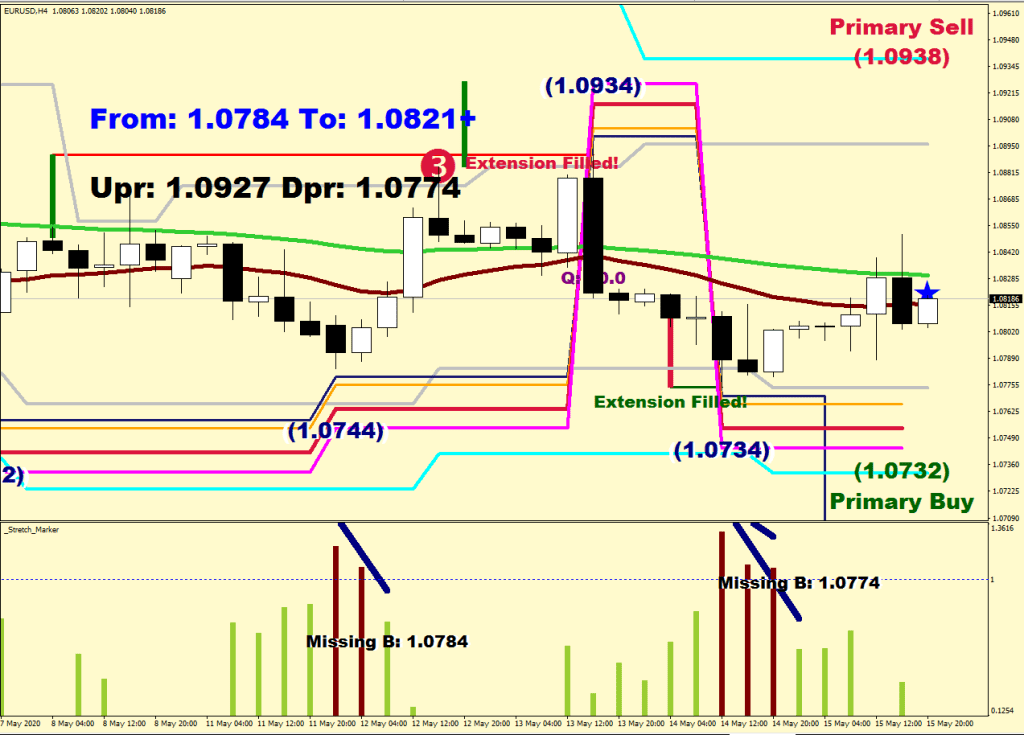
The blue trend lines are to draw attention to the prolonged decline in the distance from the mean, they set off the counter. (The Red in general is a confirmation line). I marked up the reversals that are defined by a beat of the current outlier and time: 8-12 hours or 2-3 4-hour candles. So, work out when the 3rd candle would start by comparing the broker’s time with your time zone.I am for instance 2 hours behind, so if the 3rd 4-hour candle was to start printing at 16:00, i should start looking for the beat of the outlier from 13:00 (the last hour of the 2nd candle). You can place pending orders too, but you would not know the entire size of the beat, which in an extreme case can be as much as 65 pips. So spread out your orders, pace them. A typical beat would be 4-20 pips, so you do want the placing orders maybe at 4, 8, 12 pips out – and add later. What you are aiming for is a mean reversion, so check where the green line was on the previous candle and use that as a reference.
The image that shows a 5-pips beat (on cue) is a shallow one. So a 4-pips pending order would get a fill, but no other. You could add to the position upon crossing back above the low of the candle (buy stop) a few pips out or above the high of the candle it prints.
Take some of the risk off the table when physically touching the green line (1/4 – 1/2) and adjust the remainder’s stop loss to somewhere in gains.
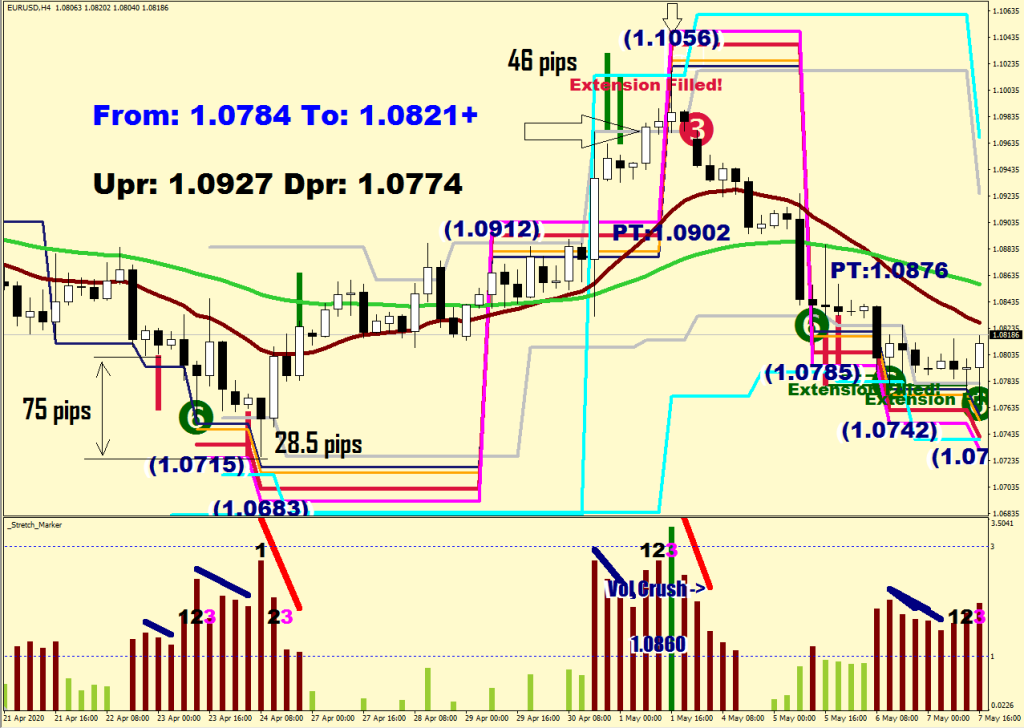
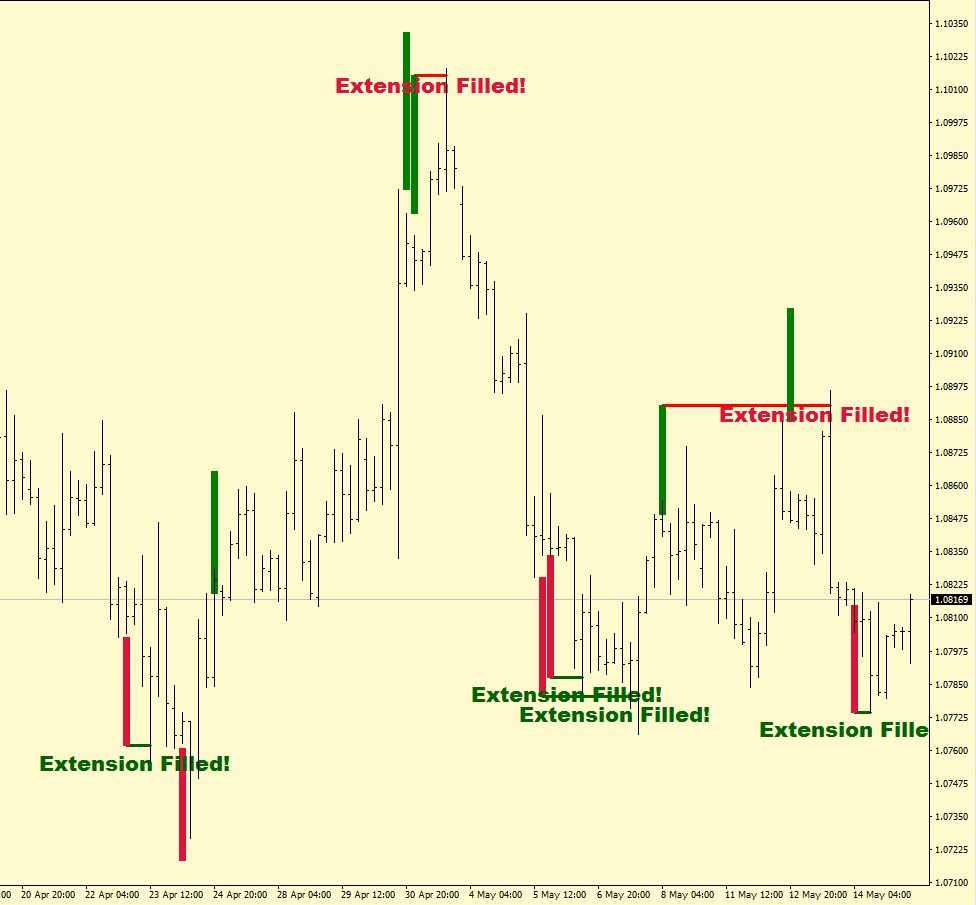
What about the chaotic looking bottom with the overall 75 pips beat?There is a projected distance beam, and you should not be buying before it gets its match. Start buying at that level. When the extension was filled, the bottom was less than 30 pips away. What happens when there is no beat in the next 12 hours? Price went after the projected distance value on the upside (a move was in progress still – an alternative approach would be to get in on the extension fill and target the missing beat). The beat may arrive later. In the last example the 9-pip beat was reverted back to the mean – and it was an extension fill as well.
Set the lookback value higher to browse more history on the indicator. A 4H time frame comes with about 162x candles of buffer.
If you want to say closer than 2/3 of the way, why isn’t “less than” 66% good enough for you, what do you need that 61.8% for?
Fibonacci does not own a patent for “Extension” just as 50% and 150% are not Fibonacci Numbers. The market progresses in 50% increments, not 62.8 and not 25.7
A low volatility market can turn on a dime, and any low volatility market does not exceed a stretch of 3x maximum fluctuation size from the mean.
Shouldn’t you be trying to figure out the maximum fluctuation size of your instrument, the identity of the mean and obtain a Projected Distance 240 from me in exchange for some donation? I certainly think so.
     if (iHigh(NULL,240,i+1)-iLow(NULL,240,i+3)>ATRAVG[1] && iHigh(NULL,240,i+1)>iHigh(NULL,240,i+3)) {
             LowBuffer[i]=iHigh(NULL,240,i+1);
             HighBuffer[i]=iHigh(NULL,240,i+1)+(iHigh(NULL,240,i+1)-iLow(NULL,240,i+3))*.5;

             if (Period()==240 && i>2){
               j=i-1;
               while (j>0){
                  if (High[j]>HighBuffer[i] && Close[j]<HighBuffer[i]) break;
                 j--;
               }
               if (High[j]>HighBuffer[i] && Close[j]<HighBuffer[i] ) {


                 ObjectCreate(0,"Projected"+i,OBJ_TREND,0,Time[i],HighBuffer[i],Time[j],HighBuffer[i]);
                 ObjectSetInteger(0,"Projected"+i,OBJPROP_RAY_RIGHT,false);
                 ObjectSet("Projected"+i,OBJPROP_COLOR,clrRed);
                 ObjectSet("Projected"+i,OBJPROP_WIDTH,3);
                 ObjectSet("Projected"+i,OBJPROP_BACK,1);

                  ObjectCreate("Projected"+IntegerToString(j), OBJ_TEXT, 0, Time[j+2], HighBuffer[i]+20*Point);
                ObjectSetText("Projected"+IntegerToString(j), "Extension Filled!", 16, "Arial Black",  clrCrimson);


                 }
             }

         }
Welcome to my world of qualifying moves and target projections.
I’m starting to get fed up with the countless cowboys popping up on YouTube channeling their misunderstanding of how the market works, their pseudo knowledge.
We’ll start nice and slow, so that everyone would be able to follow.
– and the latest version of 36 Only VRLD – that is attainable from me in exchange for a donation.
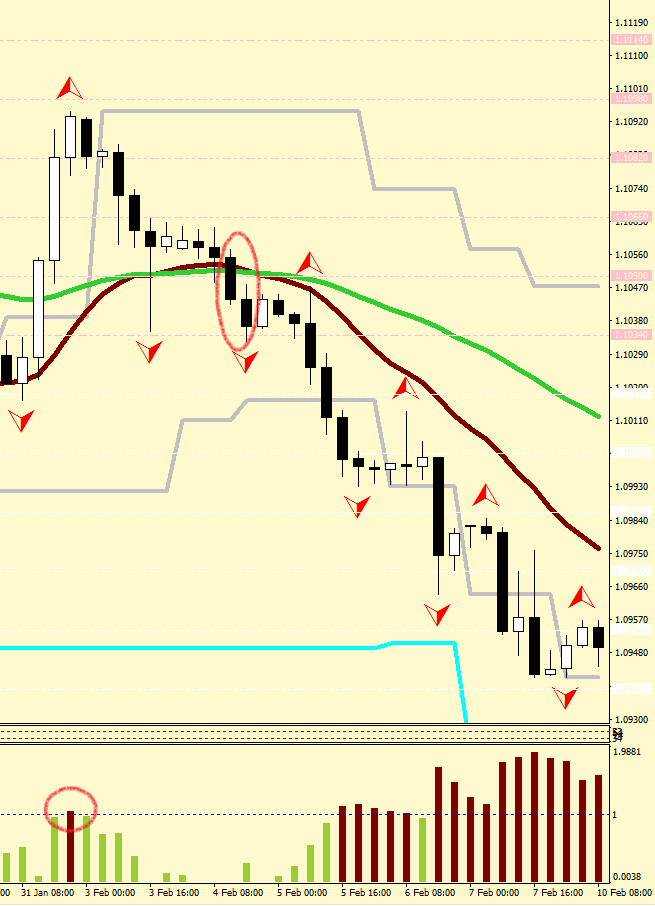
We pick up at the end of January.
On the Stretch Marker Below, you can see a move failing to sustain above 1x stretch from the mean. This is our current starting point.
Then price made a 2-candle crack & close below the Green River.
All systems go to the downside.
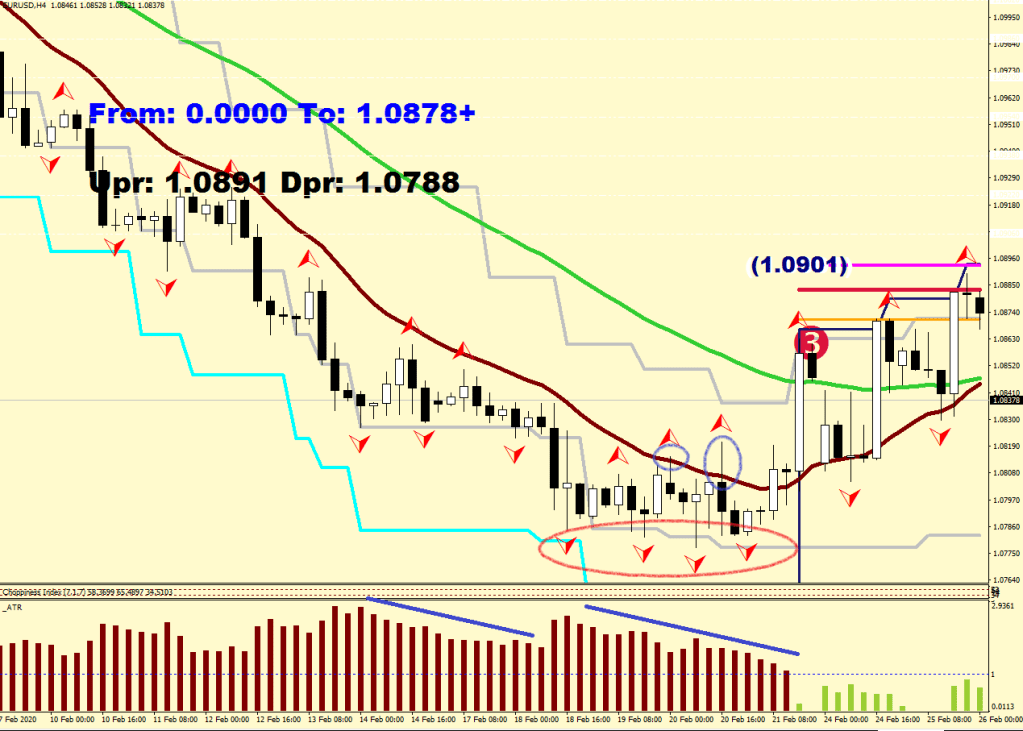
The market was trending lower ever missing the middle of Mr. Maroon and staying off of the cyan line, which is a displacement of the swing lows by a fluctuation maximum of the EUR/USD –
until the following thing(s) happened.
The volatility started declining. See slanted blue lines. Mr. Maroon was popped and violated again (Primary target fill). There were 4 fractals lining up at approximately the same height.
I will let you circle where the Green River was crossed over with two closes and there was no weekend gap potential.
All systems no go to the upside.
The first cyan encounter was a bust for the candle just ripped through and never looked back.
The second encounter made its reaction, but the Primary Target was not reached, the move failed next to Mr. Maroon – makes sense to lighten nearby.
Something ridiculously important happened on the bottom. Price went beyond 4x stretch from the mean. From here on the cyan line switches from Primary Sell to Spiral Buy.
Everything is a buy: break-outs at the Cyan line as well as all the beats at the other side or Mr. Maroon. The whole thing goes exponential until the stretch from the mean reaches a 9.5 multiplier, and price becomes unable to sustain above the Cyan fluctuation maximum displacement. This is the primary failure which had its target set at the last read of Mr. Maroon at 1.1236 and the secondary failure followed soon after with a reach & fail for the top (with volatility having started to decline). The secondary fail’s target is the location of the mean, which was at 1.1138 at the previous 4-H candle.
After that you see a cross over of the Green River, then a failed attempt to break above it.
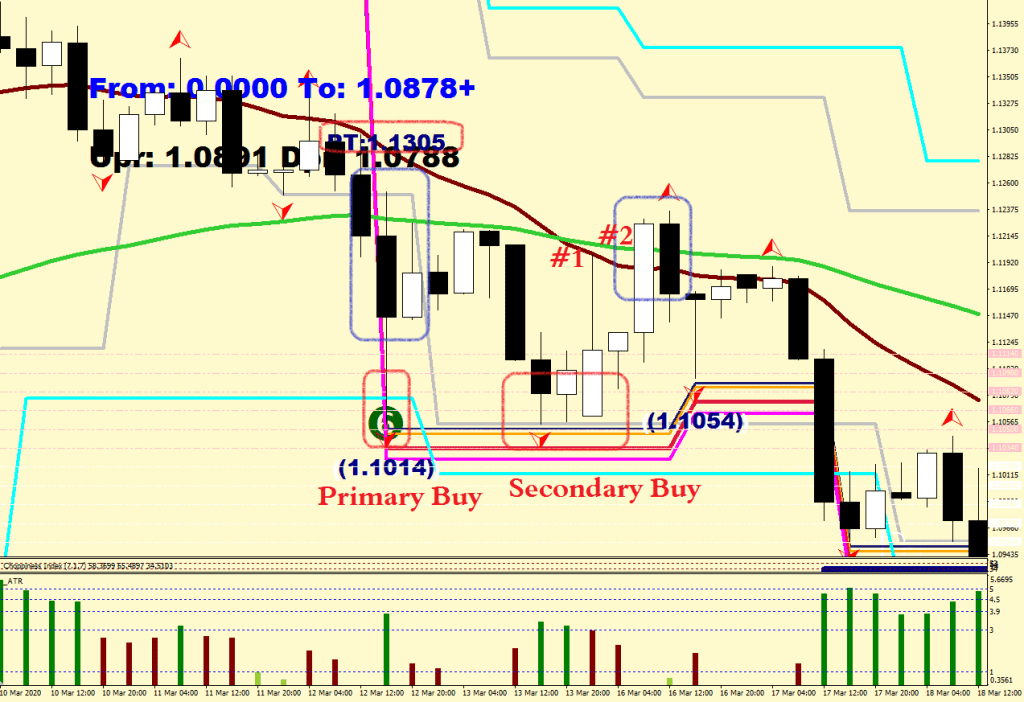
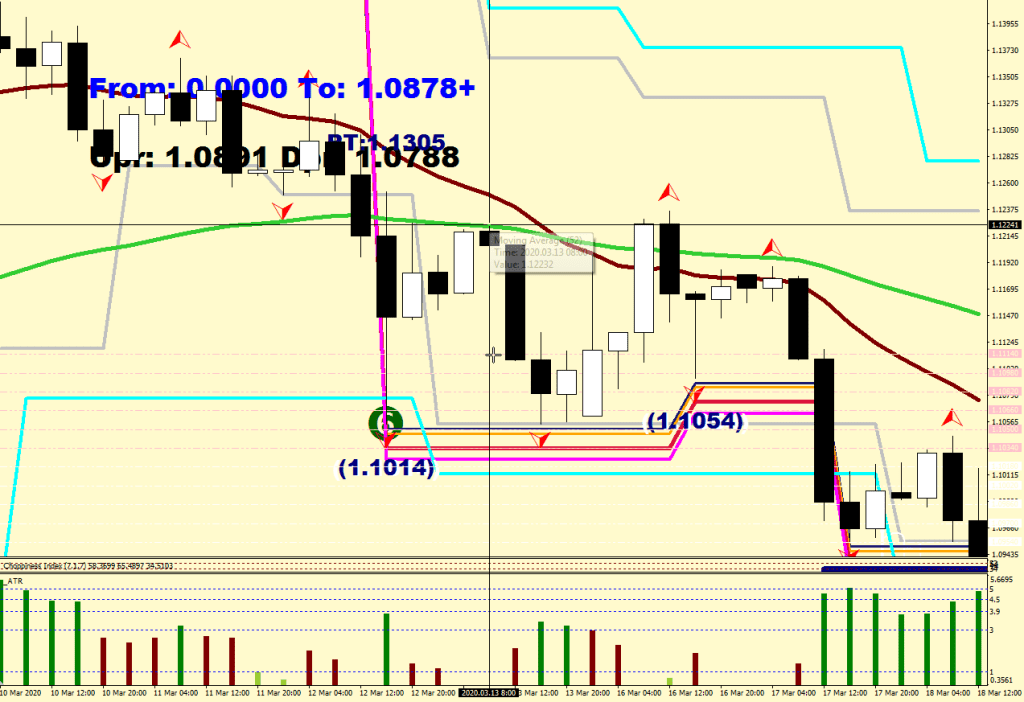
The consolidation that takes places below the Green River comes with playable upside. The Primary Buy can’t fulfill its full length target, only manages a touch of Mr. Maroon further down, right after the Secondary Buy gets called in with a re-visit of the low, which does ultimately manage full length at 1.1220 and change.
All systems go to the downside again.
On the way down the Cyan (Maximum Beat) line fails to hold, and the Cyans transition from Primary Buy to Spiral Sell with the stretch from the mean rising above 4x again.
We end up with a mirror image more or less of the reversal at the top: 9.5x stretch from the mean, a 3-candle volatility drop, which sets the primary target as shown by the arrow, and the secondary buy gets called in at the re-visit and slight beat of the low.
The Green River gets crossed over again, the pullback to Mr. Maroon is a buy again until a Primary Sell appears at the cyan line failure.
There is no secondary entry this time: this is a continuation lower low down. P.T. on the screen.
You get to circle the first failure for crossing over the Green River on the image above.
But the Green River does get crossed. You get 20+ hours of consolidation to get in on a short as close as possible to the Green River.
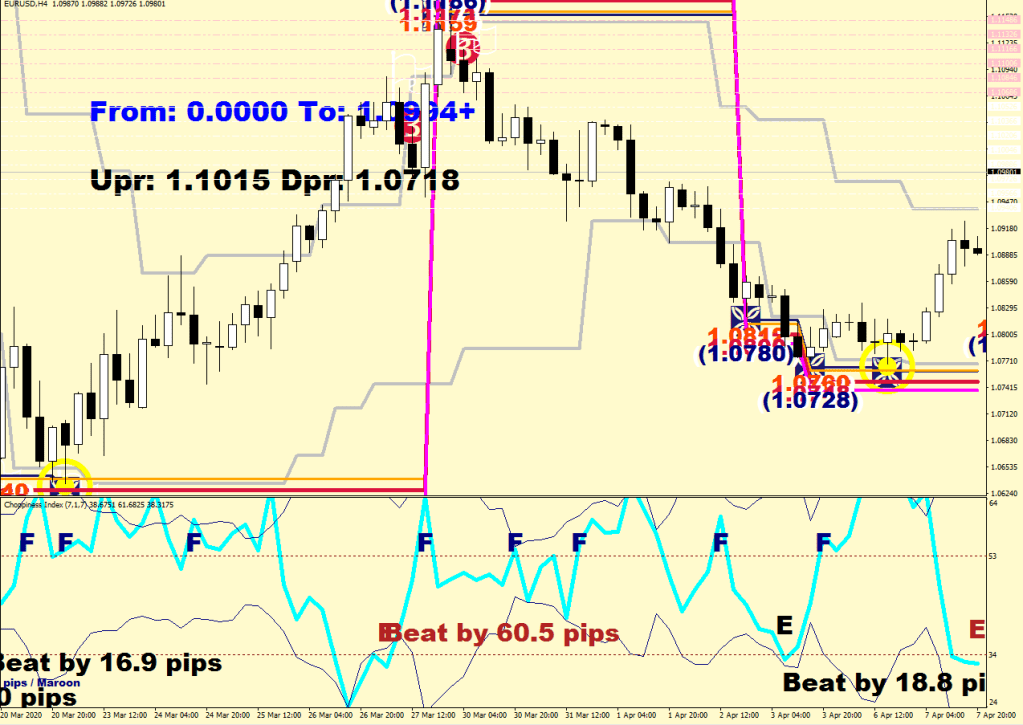
The bottom is very familiar again. A failure at the Cyan line is the Primary Entry with its target listed – and there is a the 3-bar volatility decline. The Secondary entry shows up as an RSI2 divergence (Yellow bulls eye) with its slight beat. The Secondary Target is 1.0909 or so.
After the Green River gets crossed over, the pullback to the other side of Mr. Maroon (& the River) is a buy.
There is a problem this time: price failing to sustain above 1x stretch from the mean, although it tries 3 times. The bulls eye dot is the RSI2 divergence that the beat sets up, and this makes for the next continuation swing Lower High.
The Green River gets crossed over, there is no way back, a consolidation occurs at the other Bank.
The Primary Buy signal gets missed by a few pips. A Secondary Buy emerges with the close range potential of touching the Green River. Counter direction has its limitations.
The other side of the Green River can be utilized for a continuation entry down for it is a lower high again.
The familiar bottom again. Cyan violation = Primary Buy, re-visit / undercut (this time by 25 pips) is the Secondary Buy.
On the way up the Green River gets crossed over and the buying at the other Side of Mr. Maroon / Green River persists.
A Primary Sell sets up with the Cyan violation at a healthy 3x stretch from the mean. Target prints. The is no Secondary sell opportunity granted with the gap down over the weekend.
The Green River was crossed down. A consolidation took place below with an additional rejection. The Primary and Secondary buys both got their exits filled.
Price from here can go both ways, there is no Edge here, the last move was up, but price did not cross over the Green River yet. It would be easier to consolidate below the river, maybe even fail it again, but this could be all waived by a gap up and stay or a quick move up and a consolidation on the other side.
Although I can’t give you a call here, at least now you have something appropriate in your head about how the market really operates.
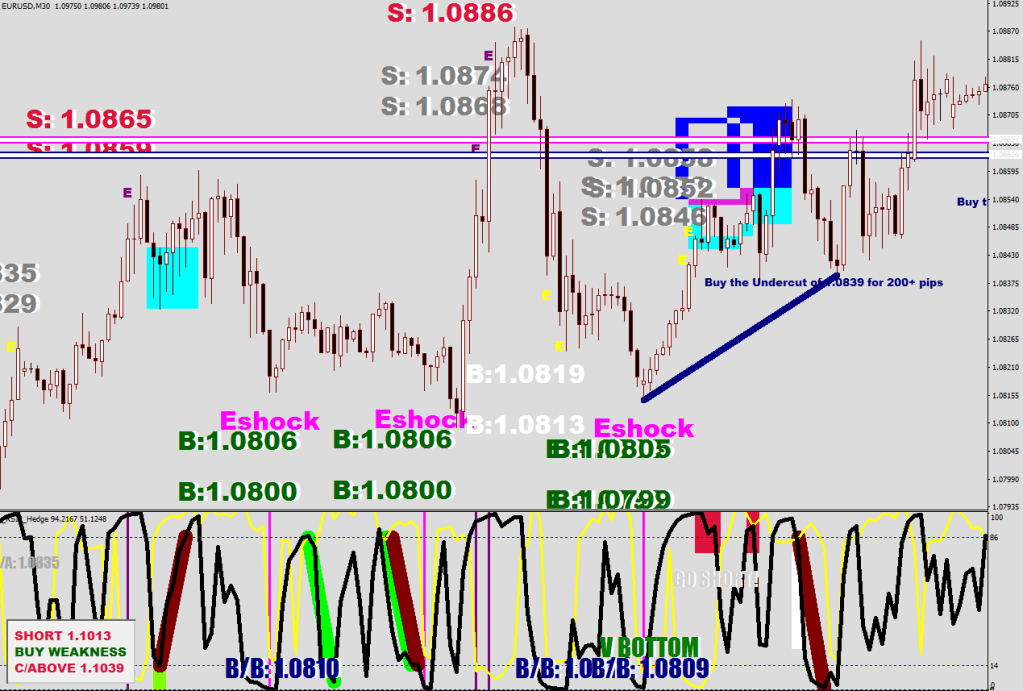
CI Divergence: 7-sample CI peaks connected where the left side of the divergence is an exhaustion sharpie connected to to next, out-of-oversold sharpie low. This is done in order to point out an area of a likely strong opposition – i.e. “Buy the Beat”
If you go back to the first image you would see, that the current, 200-pip rally came out of the undercut of the first deep pullback after the V bottom.
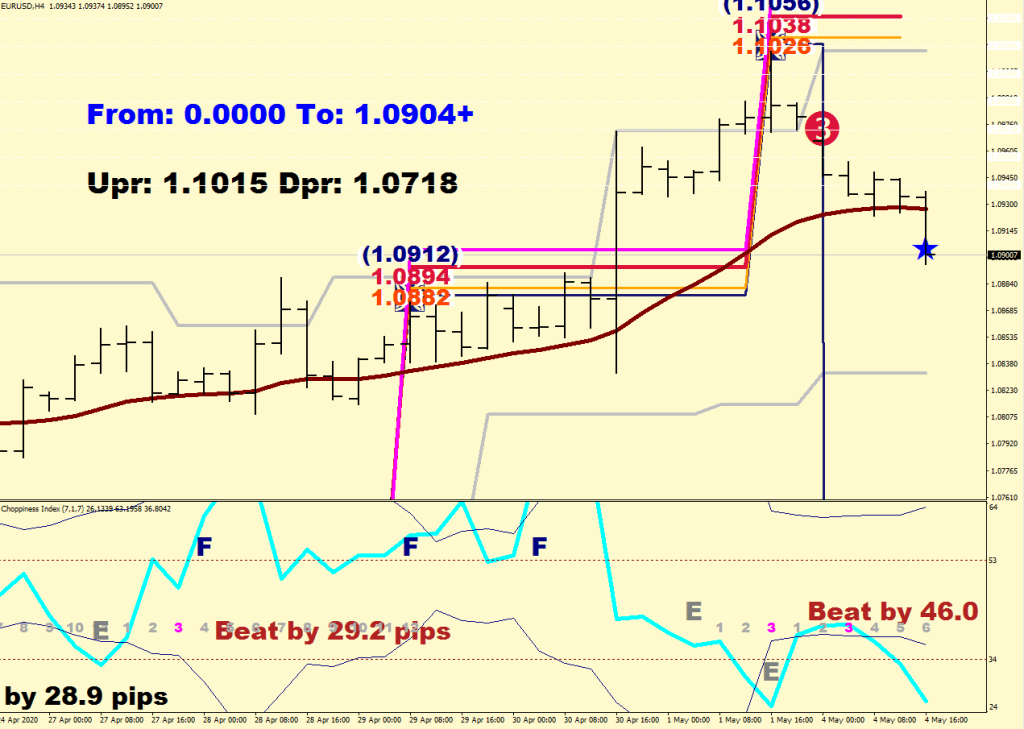
Definition of a range. A range is defined by heads. They are the butterflies on the image. How did I end up using the Money Flow index to find them, not clue, but that is what I went with. They get a 4-pip displacement. 4-hour for time frame.
The blue, bracketed value has an additional 5-pips displacement beyond the last beat line of 26 pips (for a total of 35pips – does this remind you of something? How about the Fluctuation size of EUR/USD?)
If you ever need the value for where to participate in a break out, I have just given them to you in Navy Blue. Of course, there would be fake-outs, so you would need to use my smart trail stop with CODE “2” – meaning 0.2 for stop loss on a buy stop and “2” for stop loss on a sell stop, which would in return lock in 1-pip beyond the open once in 4+ pips in gains for protection.
An example where a break out was suggested at 1.0990, and the high was at 1.09902 – could had triggered you in with a nastier broker, so to be on the safe side, hold out for 3 pips more.
So, when would the upside end?
A daily exhaustion was set. A beat on the upside would be a sell. A beat usually occurs in the next 1-5 days. The most likely size of the beat is around 1/2 Fucltuation size = 16 pips, but it could be anything: 4 pips, 8 pips, 12 pips, 26 pips and even 36 pips sometimes (anything up to a Fluctuation Maximum). Trade accordingly.
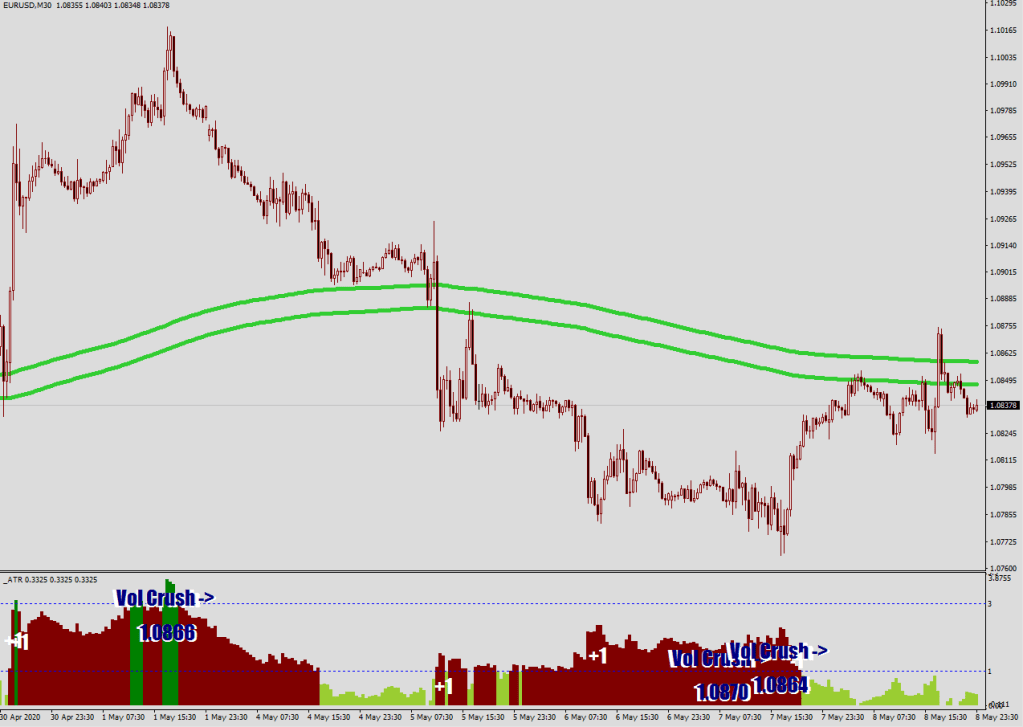
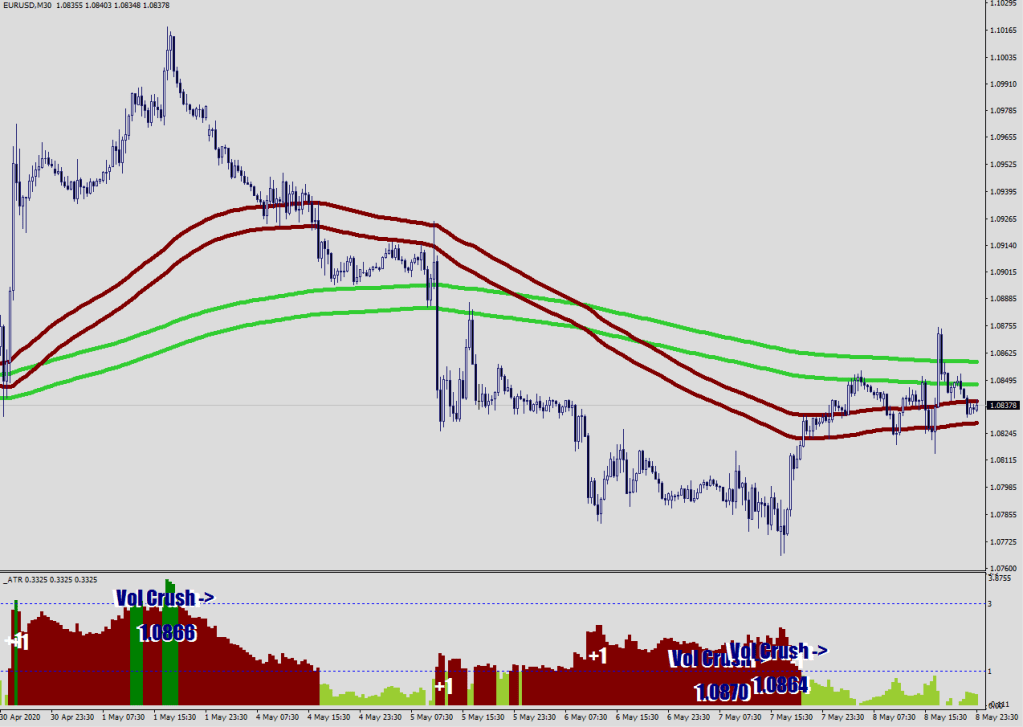
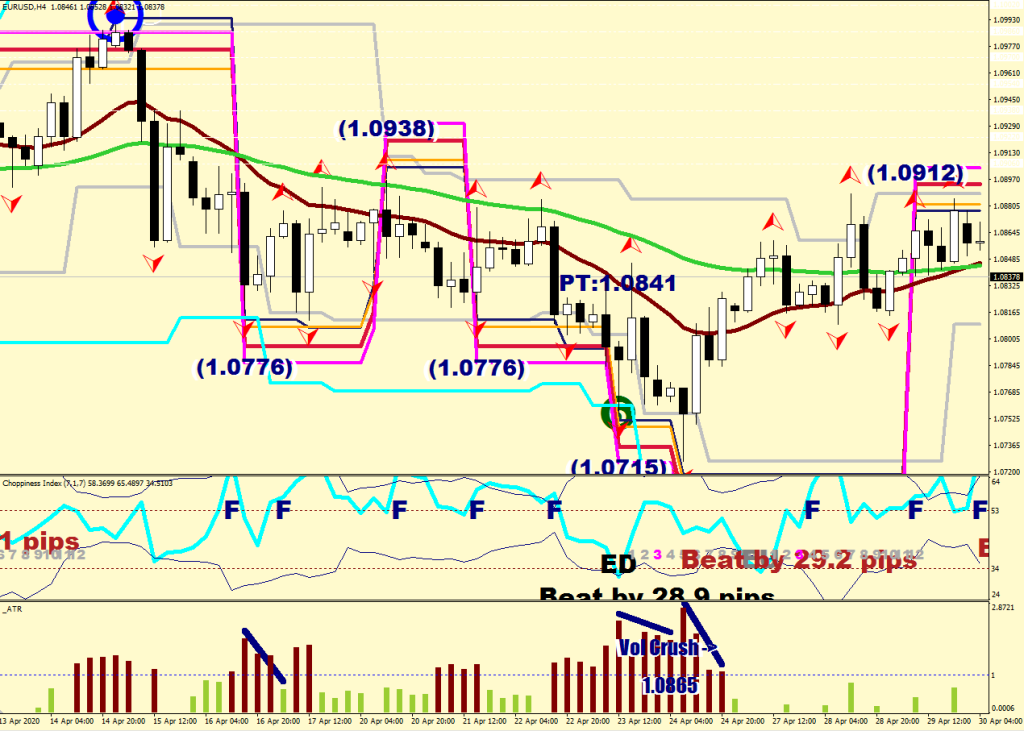
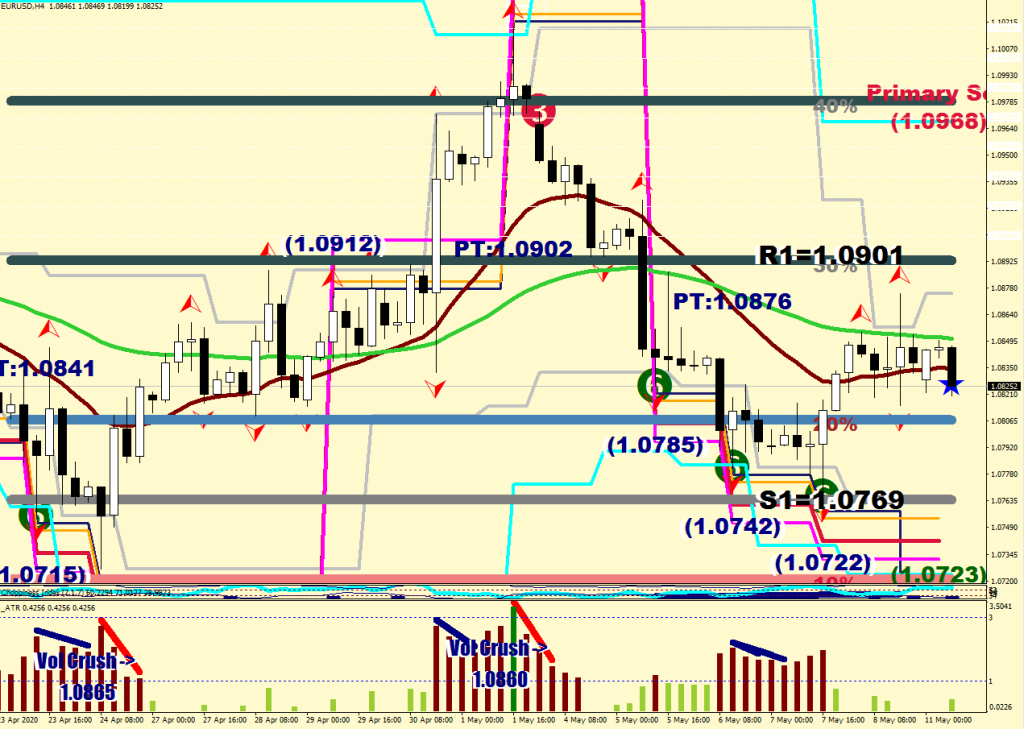
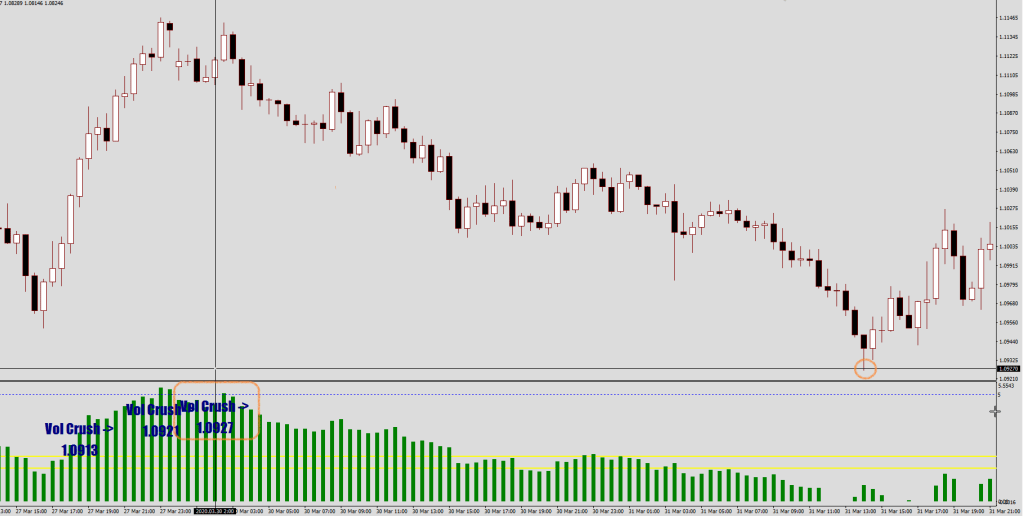
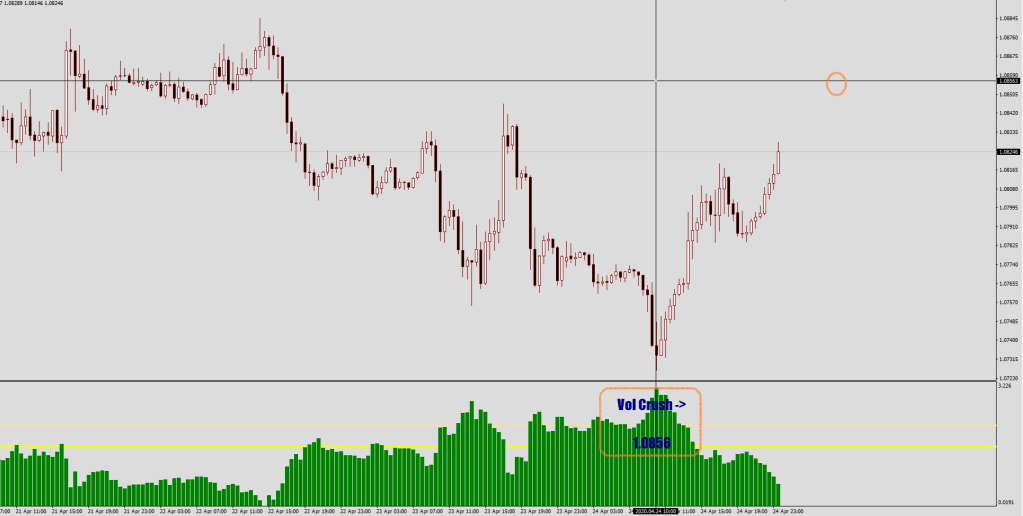
3x volatility was breached (3.69 to be exact). The beat may go higher in price, but would not go further in terms of stretch from the mean. Barring an embedding, a volatility crush would take this back down to 1.0866 after the beat.
Watch out for the new fireflies!
…
Just noticed that the 50% comfort level is at 1.1065
Daily Resistance (left) and Support levels (right)
Here’s a piece of code from God Awesome 1.71 with a filter added today.
The basis is the Stochastic Bars Hybrid, that was my tweak and I am certain, that I posted the source of it on these columns, so look it up, this part you should be able to plug in
Remeber the volatility high tide that hit 10x stretch from the mean on the upside then on the downside?
Count with me.
after that the wave length got shorter, from size 4 to size 3 – these waves were not able to achieve anything further from the mean than 4-5x stretch, they were sort of echo waves
here we are now in the present, when the waves are unable to exceed 3x stretch from the mean
where was the bear market? nowhere
there was one big Volatility tide that has completely flattened out by now.
I do believe this is necessary for the market to be able to start trending in a direction, for until now all it did was make whips up and down.
The volatility is gone. For good.
In fact, I had to bring back the volatility multiplier on the energy bands to pre-high-tide values (from 1.5to 1.0) (“m”, not external also equals one at this point).
These are the values that the German folk was missing for making his version of my Energy Bands, that he keeps on returning to.
It is o.k. to talk to me, I don’t bite.
The fact that today’s CI Moat values point to the downside and tomorrow’s point to the up side just shows how smack dead in the middle price is right now at.
Now that you have all of my indicators and receiving all updates, it is time to rank the signals
#1 Volatility Crush – see previous article – Scale in up to max size, target comes with it.
#2 Wave count – use hourly chart to figure continuation divergences
God Awesome V1.71 can find many of these divergences.
The end of Wave 2 sets up a continuation divergence (see the small blip prior to it) Wave 4, the ambitious wave doubled down and set up a reversal divergence on top of the continuation divergence before disengaging. Look how Wave 4 penetrated into Wave 1 a bit – something that Elliott Wave does as not acknowledge the existence of. Wave 5 tends to have a reversal divergence at its end, so the wave structure above does not look finished until a beat (the market seldom finishes a wave structure on a peak RSI).
Go down to 15 minute to see how the 3-wave structure of Wave 5 unfolds along with the RSI2 reversal divergence
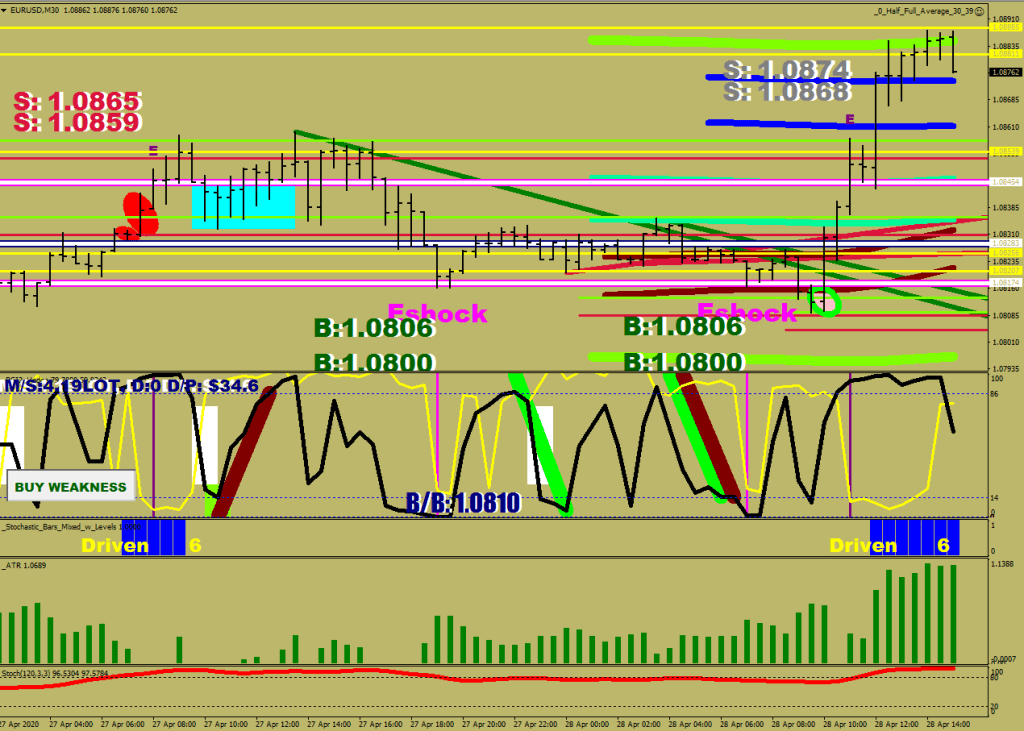
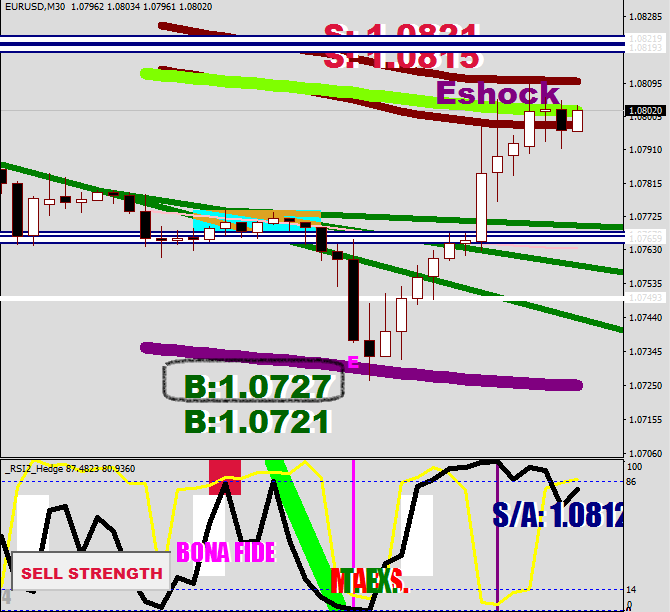
#3 BB Gun (shallow beat) (S/A, B/B)
use maximum 2 orders 5 pips apart
size determined by 60 sample hourly stochastic D just out of overbought /
oversold up to regular size; in limbo – decreased size (1/2 of regular)
#4 Eshock (counter directional beat) any beat is a fade, use regular size, scale in in 2 steps
#4A Magenta/Purple E without Eshock – you are interested in the 2nd E in a sequence (B:, S:)
use regular size, maximum 3 orders 6 pips apart adding up to a regular size
or 1 order in regular size depending on terminal wave count
#5 Liquidity break signals (the purple strike outs on the hourly RSI2)
#5A break outs – limited continuation potential for price already had traveled 12 pips before triggering the stop order – use half of regular size, one order, do not go in again, there are W3, W5 targets listed, use the one most fits your Wave count
#5B failed break outs – when the market is not ready to make the break, and falls short 5-1 pip from the break out level, it can be faded – i.e. during a consolidation use half of regular size
#5C pull backs – they are to be played within the range, scale in with up to regular size before the break out level and use the target suggested
pay attention to the Buy Weakness / Sell Strength flags
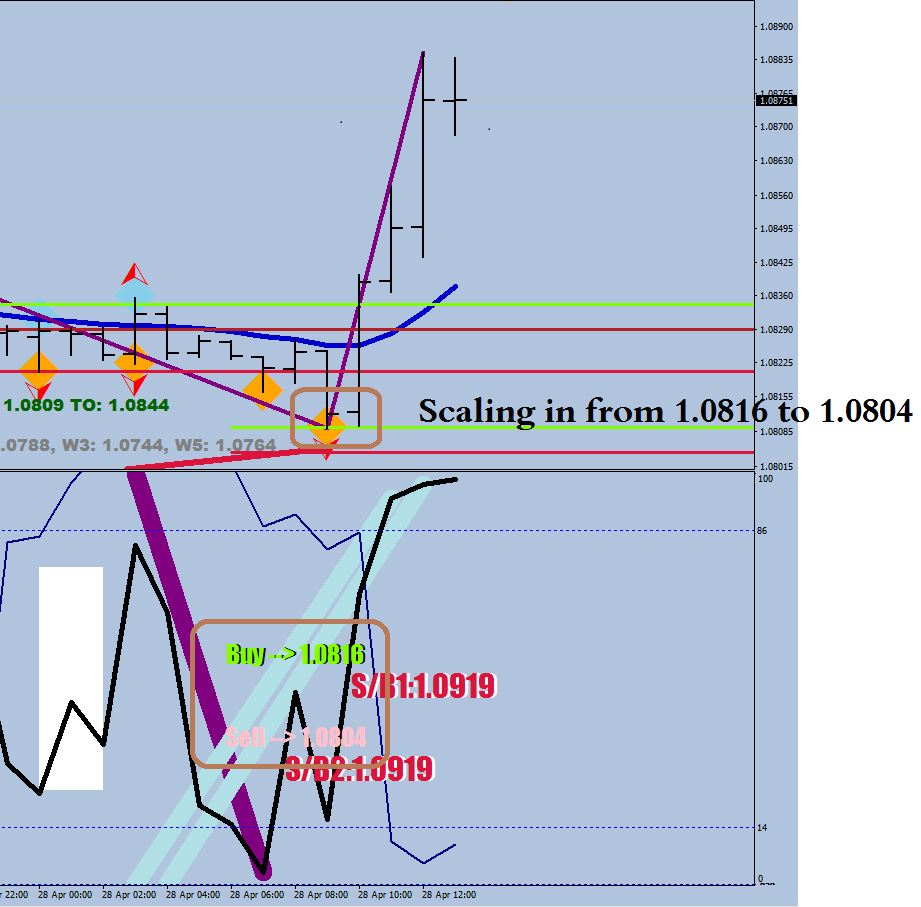
Forget buying below the last value. You can also think backwards: 1.0805 – 1st order, 1.0809 second order, 1.0812 3rd order, 1.0815 4th order -> Regular size in total
#6 Fractal Switch signals – these are Maroon re-visit signals, the Trigger Level can be exceeded, so get it with half of regular size as close as you can and you may add to it while price stays within
the use of a smart trail stop or a protective 1-pip stop loss when in gains is advisable
#6B use the Wrong about Reversal value to get in on a continuation
Regular size would do
#6C use the Close/Hedge level with discretion for a counter trade upon factoring in the potential (Wave Structure, Stretch from the Mean)
1/2 of regular size
My Maximum size is 4 Lots
My Regular Size is 1 Lot
My half of Regular size is 0.5 Lots
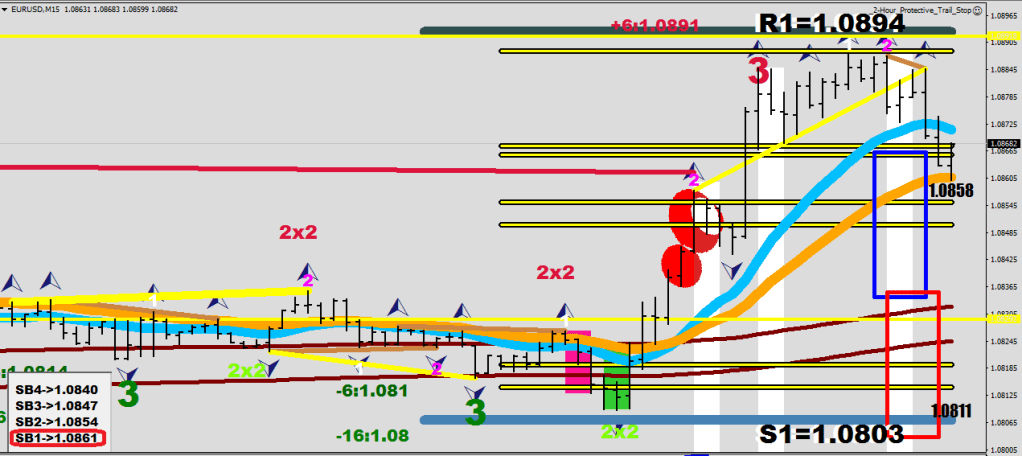
…why did I choose 1.0861 for targets for my shorts?
Because that was the closest Strength Buy level. But even that I could not wait out.
It took me 10 years to figure out the perfect entries. You already have that available.
In the next decade I need to start using the right size & stay in for an optimal length (this is the hardest thing for me).
…
RSI2 Hedge now can pick up on certain double exhaustion sequences
Trading volatility has nothing to do with drawing trend lines on the VIX.
The next time somebody approaches you with “trading volatility”, ask them the question:
“Where is the Mean at?”
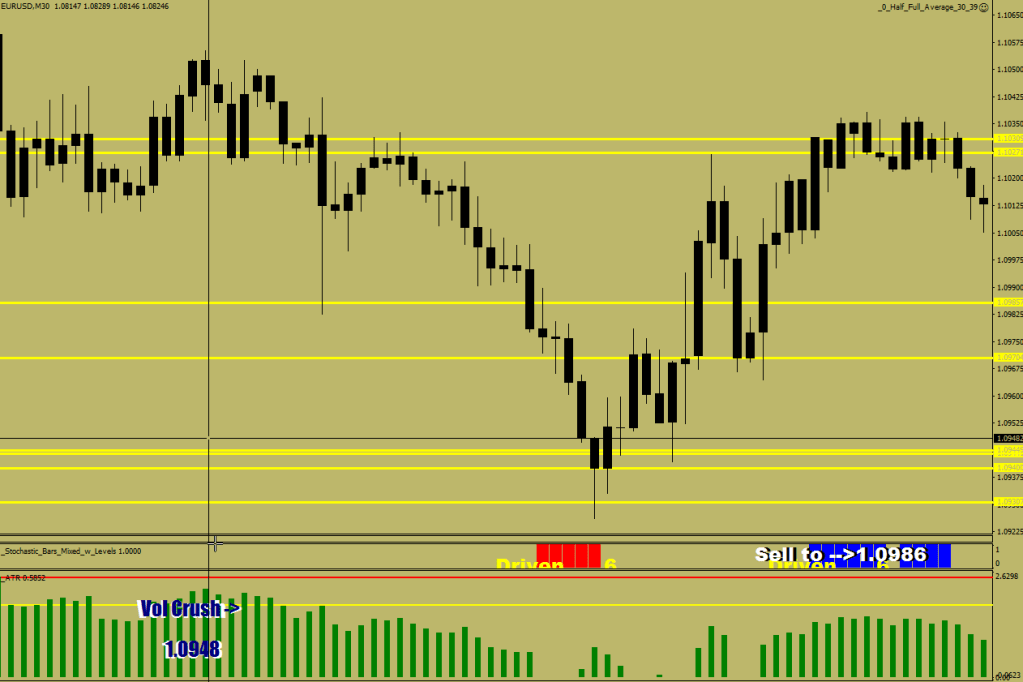
The following 3 examples are volatility crushes otherwise known as Mean Reversions. Let’s see if the mean itself can provide you with a clue for the target.
I missed the top. Wave 5 and Wave 3 were compacted into one single push with no visible continuation divergence in between to point out where Wave 4 ended. It all became an ABC.
To catch a top, you need to put out limit orders at the usual suspects.
Wave 1 ended up making a larger than usual break. I was waiting for the Wave 2 kick back to Mr. Maroon, but it was not happening yesterday.
I wasn’t chasing it. The market went into sell strength by the 60-sample stochastic D slipping back below 50, and later went into sell weakness as well by registering stochastic bars on the 15 min.
Sell weakness – see the article
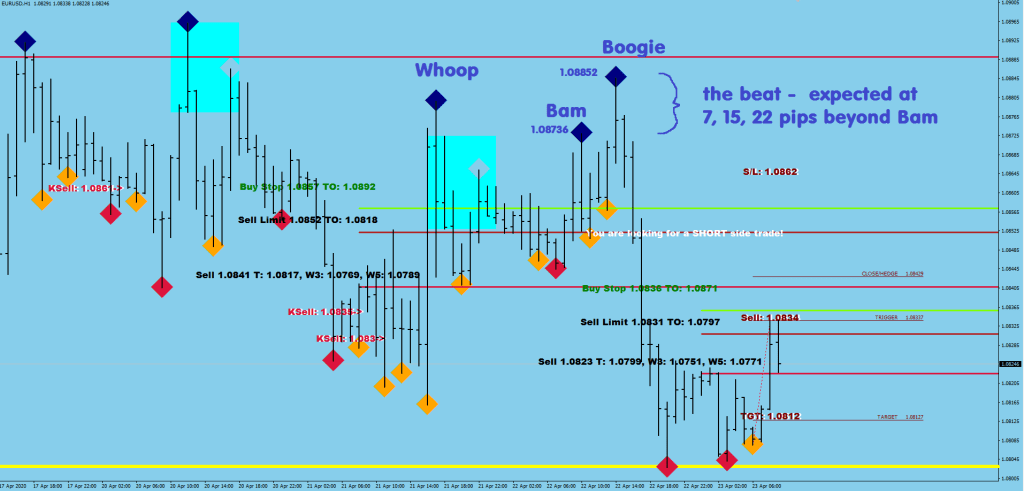
The subsequent low provided me with 4 levels to sell weakness at: 27 pips above (1.0831) and then at 1-3x 7 pips higher. Selling weakness aims to exploit shallow pullbacks regardless of how overbought / oversold price is and does this by starting to sell within less than a fluctuation size away from the swing low/high.
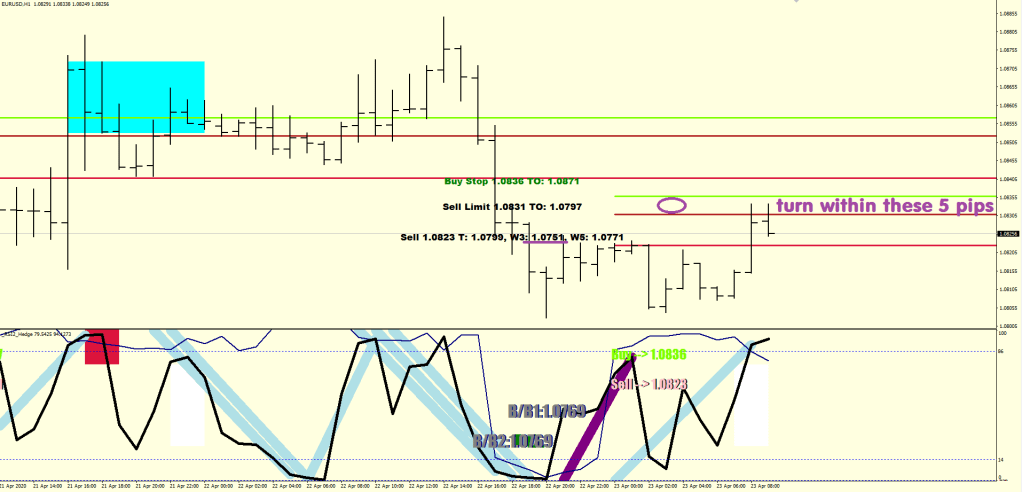
Fortunately, I have other top notch indicators up my sleeve (if I stuff them there) and the 1H liquidity break can give me the turning point within 5 pips.
The RSI2 Hedge did just that within 1.5 pips to be exact.
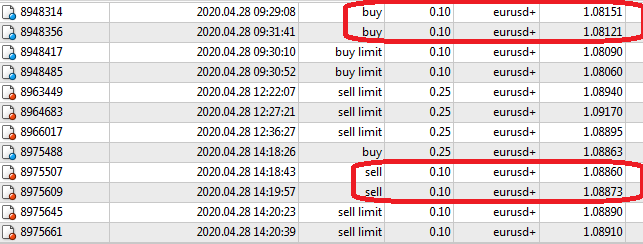
I got fills at 1.08302 and 1.08339
At this point I am aware that Wave 1 has transpired, and I am looking at Wave 2 back to Mr. Maroon.
To get an idea of where Wave 3 down could go to, the W3 value is underlined on the picture.
The 1-1.3x ATR calculation gives you a band where price would most likely land on after a Wave 3 (could exceed it, but would return in that case):
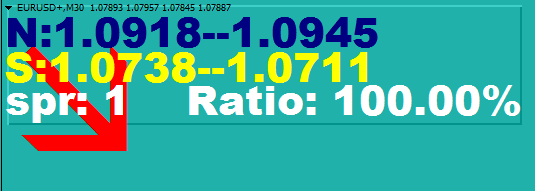
Refer to the South side values.
For the exact location I would have to monitor for a beat beyond the second 30-minute exhaustion (or one very deep exhaustion).
As for money management, I could had put on 20x the size that I did (but trading is a sport, ain’t it?). My hedge routine is currently set to 39 pips away for a full hedge (from average entry), but as you can see, the go long green line was never hit (see the turn within these 5 pips image), so I could had used it as a stop loss all along.
My smart trail stop could take over the management from here, but to stay in the positions you need to ride out the initial turbulence, so it should be only clicked on after being in 20+ pips gains and if the trade has been on for a while, i.e. for more than an hour.
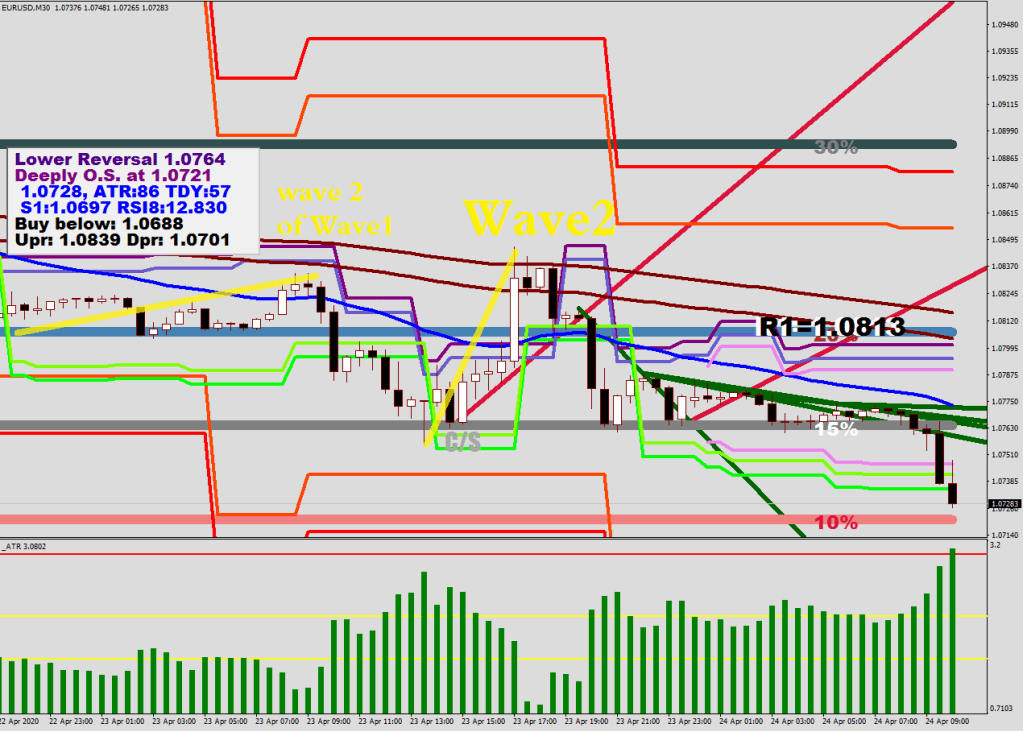
Picture: the market approaching S2 distance relative to the mean
wave 3 of wave 3 shall commence after a bounce up.
All in all I’m looking for some terminal action below 1.0744, near the 10% mark, just beyond 3x stretch (currently at 1.0748 and declining).
Wave 3’s 1st exhaustion was printed. I have increased my size. Don’t buy the beat!
Wrong about reversal.
Daily Support is at 1.0708-1.0703 there is a 4-hour support at 1.077-.10765. No more hourly supports.
We have missed the energy bands, stalling at the halfway level of the capitulation / doji, and daily energy is being called upon. The damage could be severe.
…
& the 4H support held, what can I do, my indicators are smarter than I
Even though I said I would be buying yesterday, I did not get on board. Gotta start taking double exhaustions more seriously.
…
The only thing I was wrong on was the wave count, everything else still stands
…
I need to stop overriding my own indcators. They are smarter than I, period. I’m sitting on the sidelines instead of going in at 1.0727 like I was told to do so.
Trading plan sketch
Fade Magenta Exhaustions
Denomination: 0.25
Counter side: limit orders, aim for 30 pip (or close to Maoon or other side of Maroon after 3 diamonds), use trail stop “2”. Entries: up to 3, adjusted to last magenta exhaustion
Directional side: at market then every 10 pips, aim for 60 pipa, use trail stop “2”. Entries: up to 4