Zero Volatility

The title is in reference to my previous entry, the Disappearing Volatility

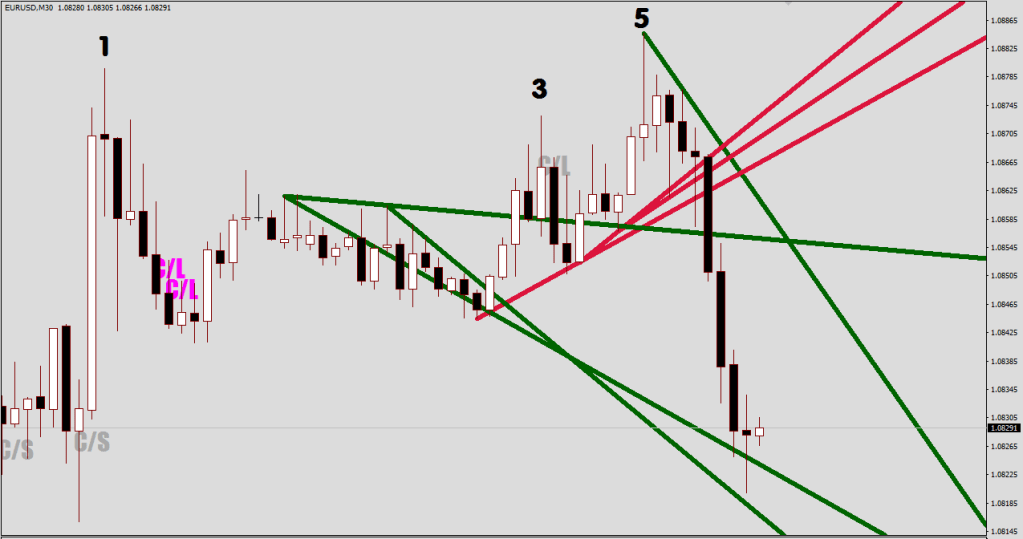
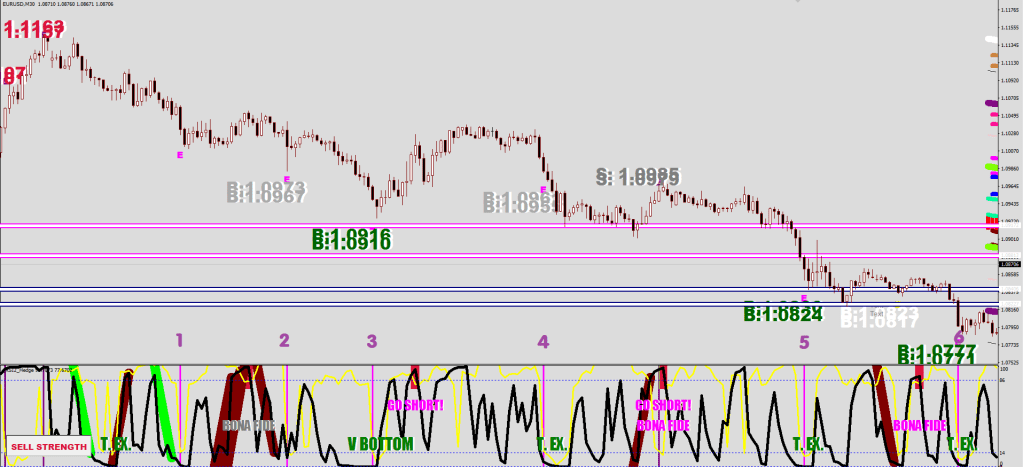
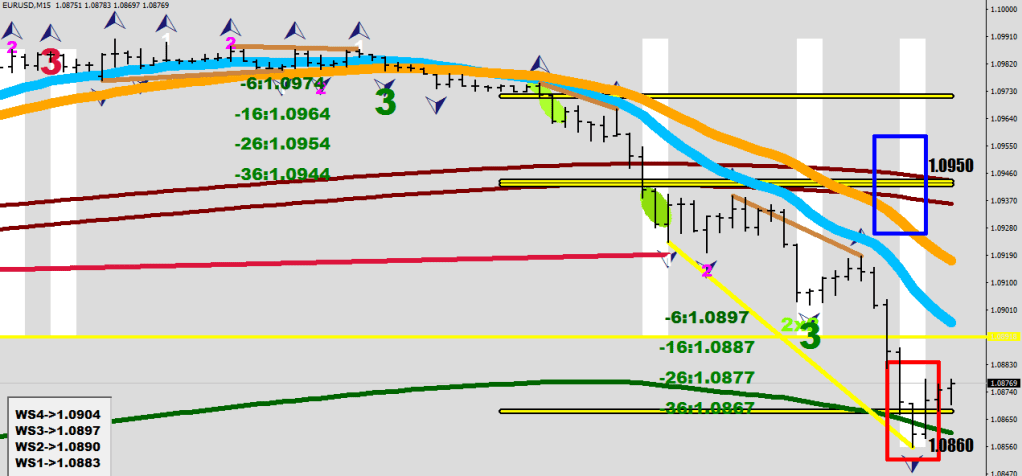
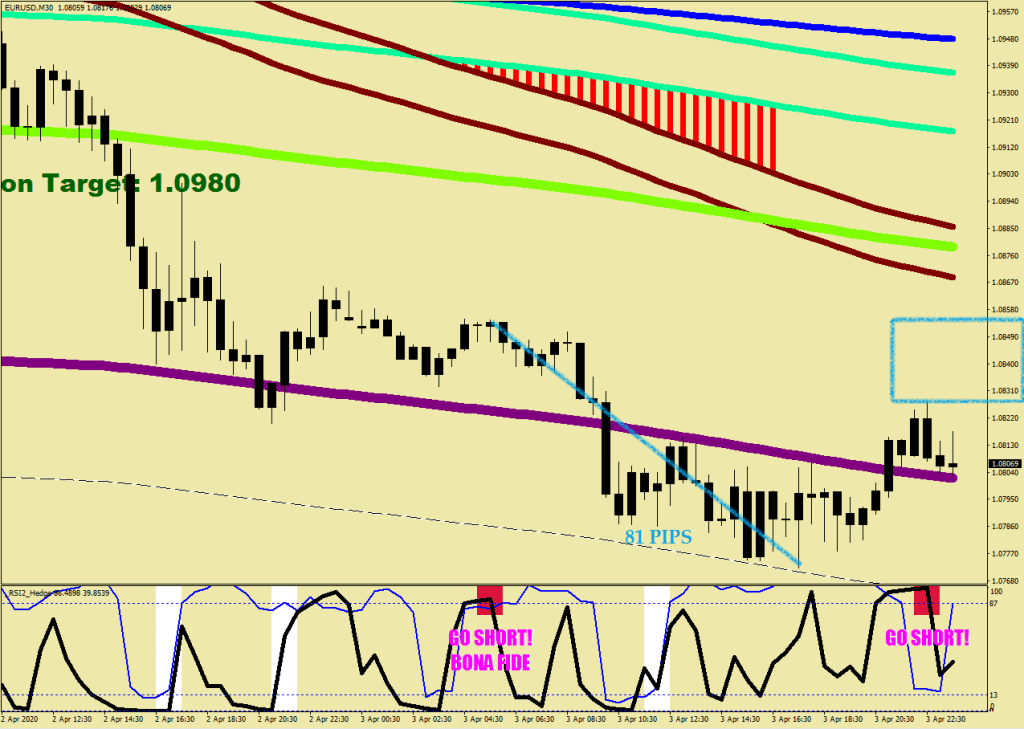
The picture below shows how my RSI2 Hedge routine can help figuring wave structure.

The purple thick shaded line is a liquidity break that was the cobra head lift before the last bite of wave 5 of Wave 5 down.

The slim purple 5 legs down were Wave 5 down followed by the Volatility Whip in yellow, and as you can see price is in Wave 3 to the upside (see the full lambda highlights in cyan), yet the price isn’t going anywhere. What is happening?

Is this a calm before a storm? Sure, but the magnitude of the next storm is a big question.

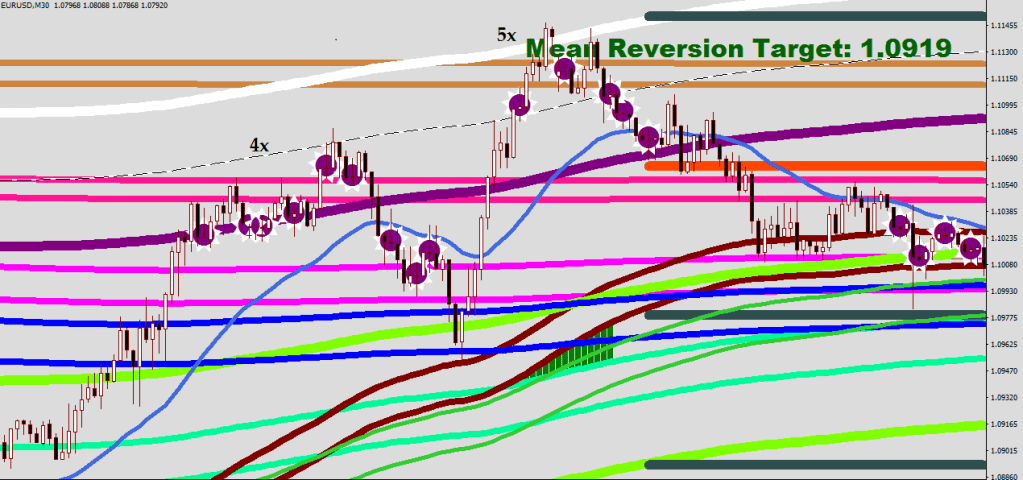
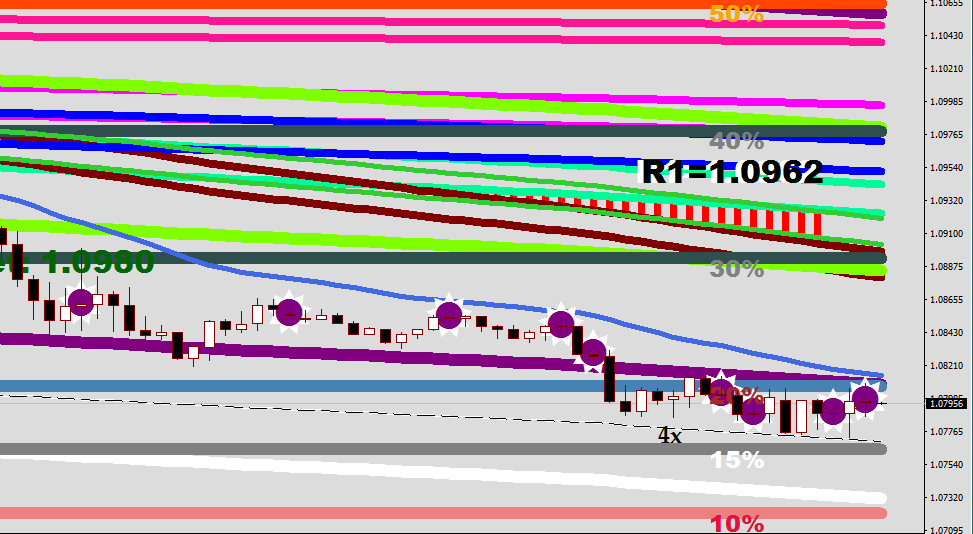
Please look at the following pictures to understand the severity of the volatility collapse.
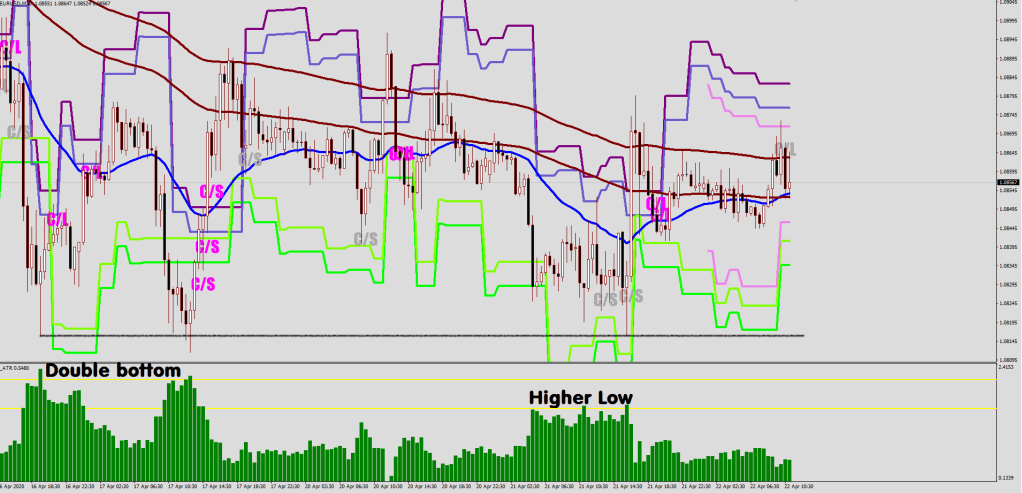
The straight line and the 3 touches on it is actually a double bottom and a closer low relative to the mean.

There hasn’t been a single day adding to the Average Daily True Range in weeks, and the last one that even came close to the rapidly dropping ATR was a week ago today, so it is no wonder that the ATR made its way back from 195 to 95, which is quite close to the all time average of about 85 pips, and would had been a normal read before Corona Time and even BrExit.
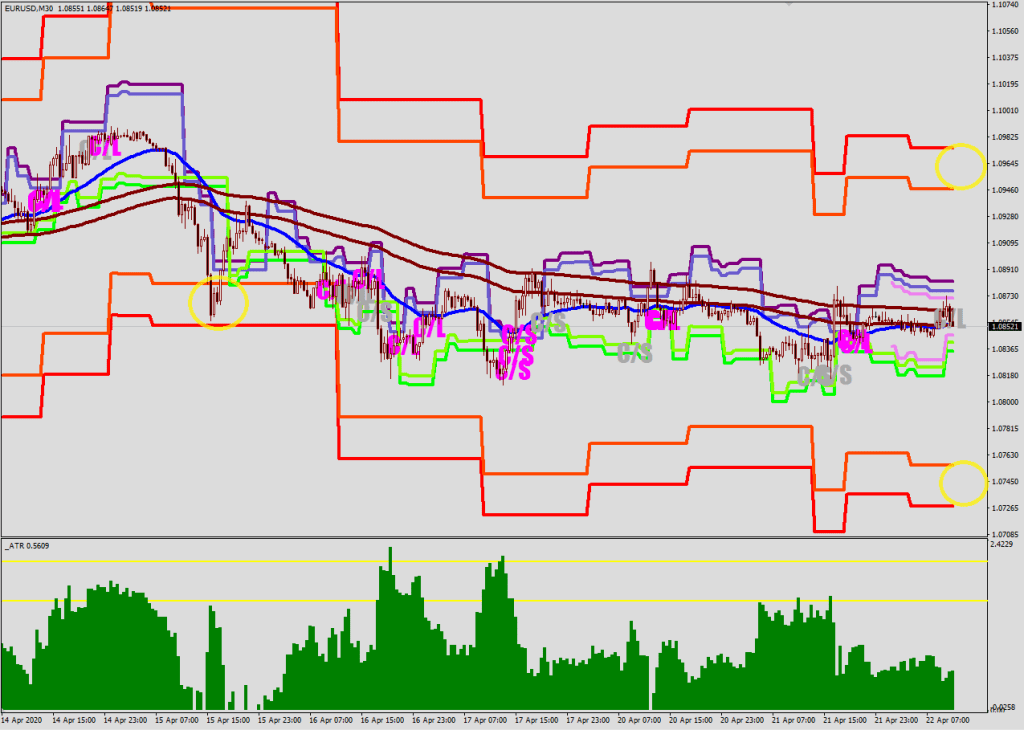
Indicators: Fluctuator X & Stretch Marker

The bias based on these images is certainly up.

I am not a fundamental trader, but it is worth mentioning that the current break in volatility is due to the absence of unknown factors.

Yes, the ECB is printing money like crazy, but so does the FED, and if I had to guess, the FED would be outperforming in terms of weakening their currency.

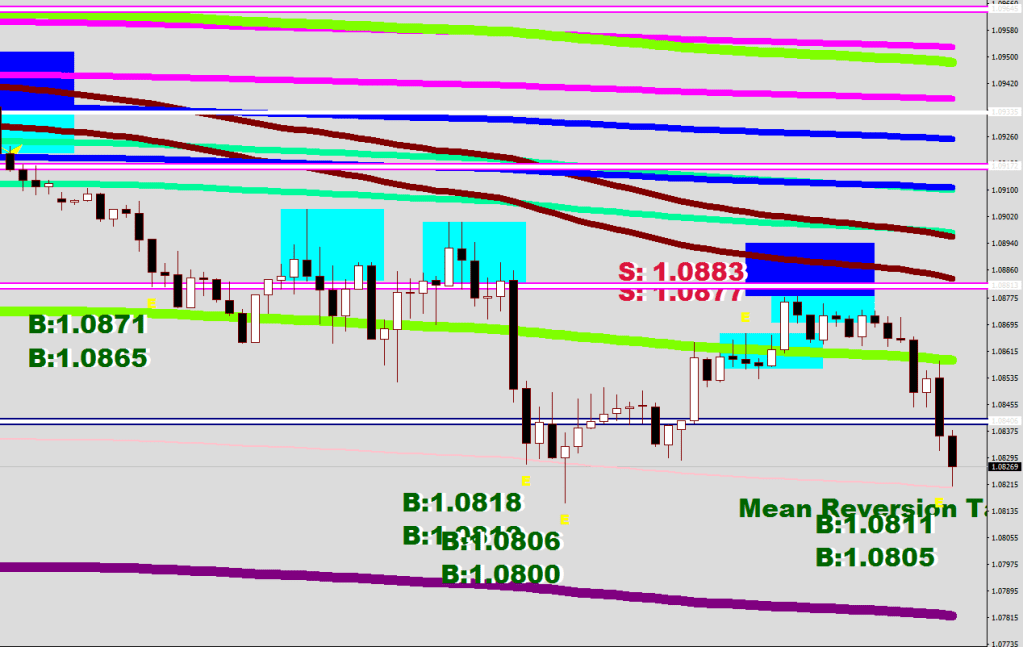
Back to the charts. Recently every second downside exhaustion resulted in a reversion to the Mean.

Indicators: RSI2 hedge, LEMA 30N2, Fau Wee (auto trendlines)

This is again the opposite of what happens in a Bear Market when price seldom returns to the mean, and by then it would had made it to a 5-10x stretch from the mean. Currently price can’t seem to get away by more than 2x and bear zone 1 (from 1-3x stretch) is a buy for a mean reversion.

What would be the next event that would initiate the next volatility burst out? Who knows. It would have to be something that is unexpected, unknown, something that is not factored in. One more dip below the doji on the left, out of the blue, scoring in the energy band to kick start some volatility? Well, not before a Wave 5 is printed on the upside.

Indicator: CI Moat Dynamic

I know I’ll be buying. (To be able to milk volatility they would have to first get people on the wrong side, i.e. the first (big) move would be a fake out.)

Going out to be tested for Corona soon.

Slipping into oversold now & breaching support on a relative basis

Indicator: Comfort Levels 4H

Exhaustion / Beat

You know it from me: Exhaustion + Beat = Reversal

You do want to ignore exhaustions in the kill zone i.e. 80% of the Upper Guard Rail to Lower Guard Rail (both in Chartreuse) zone – this is where price may get a kick from the Market Makers, and the commute may be quick for there is zero stretch from the Mean.

The grayed out numbers kind of mean the opposite of what they say (at least until back to the Mean that is (in Lime)) – sorry for the double bracket, it’s a programmer’s handicap

A lot of these exhaustions are happening in the direction of the progression, thus although the locations are great, the potential may be limited. 25 pips – 34 any time, 60 pips to back to the Green River – sometimes.

The exhaustions counter the direction of the progression can give you a lot more, you can aim for 60, 80, 120 and sometimes even more.

I have switched to 8-sample CI silently. These plots are now incorporated in the RSI2 Hedge routine.

The ink would be dried on this current exhaustion prompt in another 15 minutes, for I am looking for 1 hour’s worth of it.

It has 15 more minutes to push out the values for capturing the beat.

Chronometer is what you need for trading, plus this RSI2 Hedge routine (besides the LEMA 30N).

The Hourly Buy/Beat and Sell/Beat values? They are still there

No fill is better than a bad fill

The new consolidation printed the new navy+white line

If you left the order on the left out, that one could had been the ticket to participation (1.0812)

played around with the filters a bit, for this is what I thrive on: logical expressions

found something interesting

the previous correction had 6 downside exhaustions with 20-sample lower lows


& so did the recent one.

Frankly, I’m not expecting any more downside here until a full consolidation.

3-Wave Structure

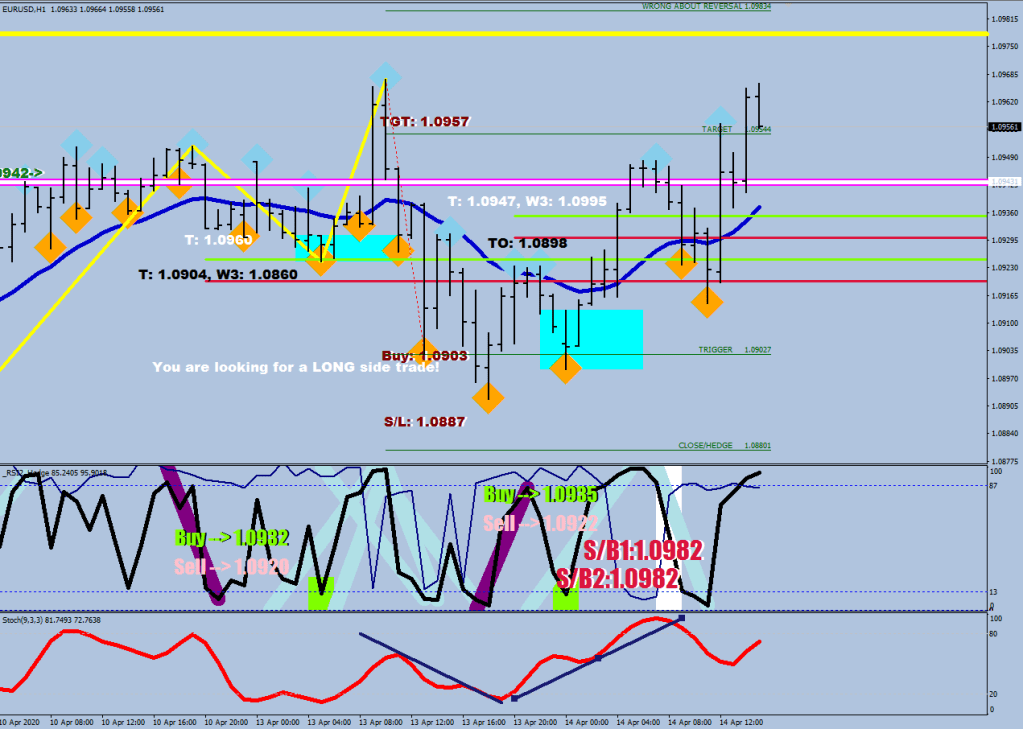
If you wanted to make 50 pips today with whatever size you would wager, all you had to have was a plot from my Fractal Switch indicator (the Fibonacci looking thing in green).

This would had meant depending on the time of the purchase with 1 lot size $100 maximum draw down or $39 and $500 net booked upon going to target.

Why does not worth this to you a donation of your choice is beyond me. (There are 2 more trades with the same plot: a long stop at the Wrong About Reversal level and a Sell Stop at the Close/Hedge level).

But this is not what I want to talk about here.

Plotting a bar chart may prevent you form seeing the 3 waves that happened downwards.

The DJ Culture 3 Wave Structure would only become visible with 2-colored candles at times, for they played out faster than you could follow on the given time frame with the help of an RSI2 (see the down leg, that we now can call Wave 4).

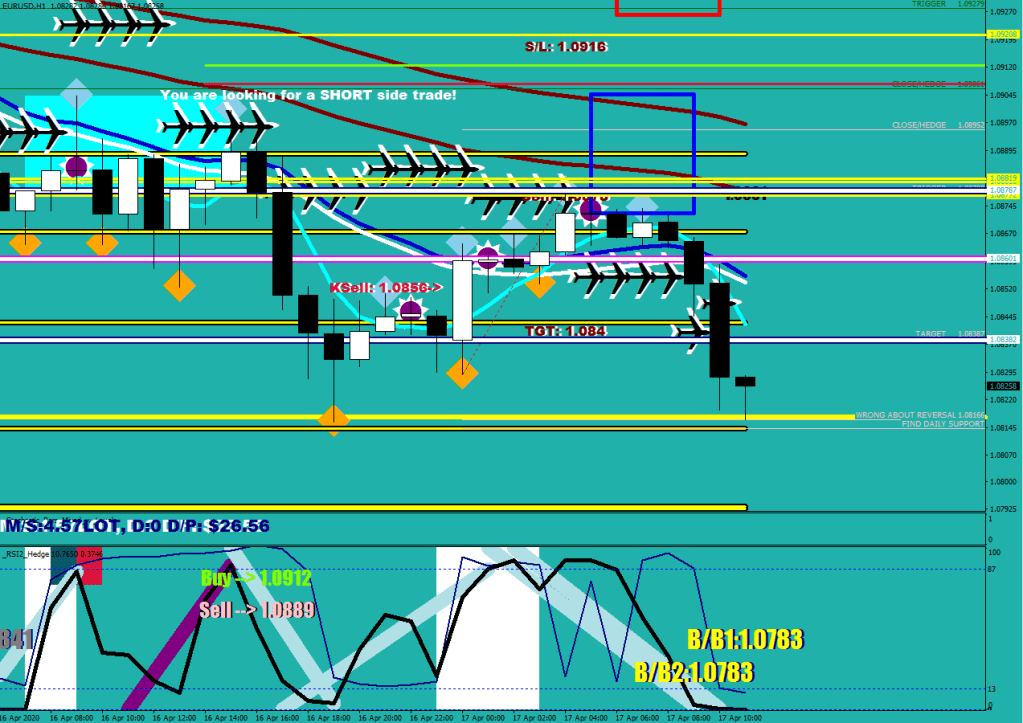
S/B stands for Sell Beat with an approximate value (indicator: RSI2 Hedge)

The only way to spot the structure was finding the two white candles up in the black candle sequence that separated the impulse legs.

On the histogram above (code was published for free in my Disappearing Volatility entry) you can see that the Wave 5 made a beat over the Wave 3 even on the relative to mean basis (red line).

wave 3 of Wave 5 managed to achieve trending before turning on itself.

The Market Makers bought again (at Mr. Maroon) supposedly to sell out their longs on the way up into this leg.

Price is now awfully close to the energy bands that would be even lower tomorrow. The Risk/Reward favors the downside as well as the wave count.

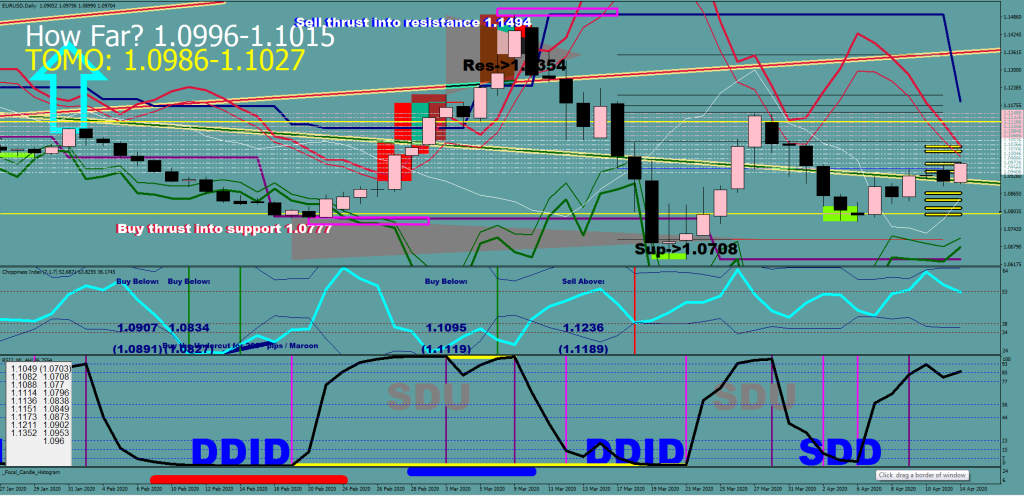
indicator: CI Moat; daily support and resistance levels listed bottom left

…and just remember when I said that when you do not know what is happening, chances are that you are in a Wave B or a Wave 5.

B/B is of course Buy the Beat

Good old 15 min ATR, has the volatility right once again.
Overdrive-cover in green. Indicators: 2 Fractals, 4 H Doji Lines & God Awesome V1.71

CI Moat Dynamic

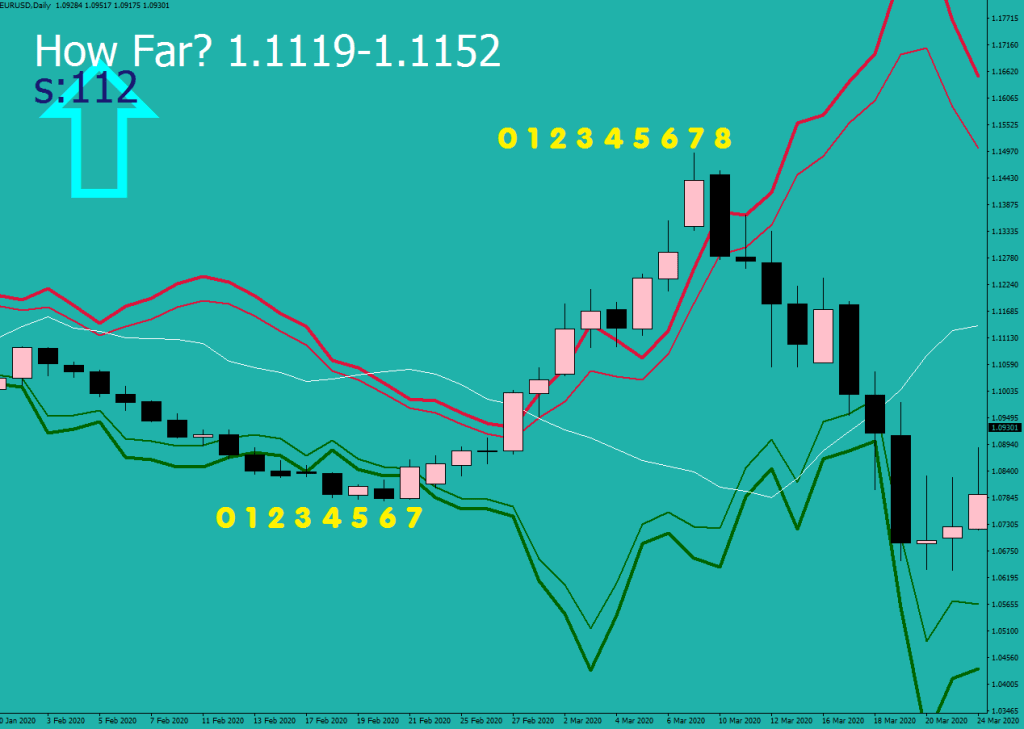
I made an effort to make the energy bands more dynamic to accommodate the volatility waves.

The following day counts show the wave being whipped up by first 7 days outside the bands on the downside followed by 8 days outside on the upside.

Then there was a move lower that did not manage to stay outside the bands.

The recent doji at just below 1.08 is about halfway the largest daily candle in recent times. Until the closes remain above this level, this market is bullish.

This is all I can add to what I said in my email on the 6th of April when I suggested someone to buy Euros until 1.0950 and then be in 1/2 Dollars & 1/2 Euros subsequently for the call from there was unclear.

I can’t plot the bands beyond the 0 value, but I can make an estimate about where the location of the far half of the Moat would fall tomorrow.

if (Close[0]>(c1[0]+c2[0])/2){
 ObjectSetText("signal21"," TOMO: "+DoubleToStr((iHigh(NULL,0,7)+iHigh(NULL,0,6)+iHigh(NULL,0,4)+iHigh(NULL,0,5))/4+cval[0]*.55*m*(iHigh(symbol,0,iHighest(symbol,0,MODE_HIGH,3,0))-iLow(symbol,0,iLowest(symbol,0,MODE_LOW,2,0)))*65*volatility
+(VOLA-50)/10000*m,4)+"-"+DoubleToStr((iHigh(NULL,0,7)+iHigh(NULL,0,6)+iHigh(NULL,0,4)+iHigh(NULL,0,5))/4+cval[0]*.93*m*(iHigh(symbol,0,iHighest(symbol,0,MODE_HIGH,3,0))-iLow(symbol,0,iLowest(symbol,0,MODE_LOW,2,0)))*65*volatility
+(VOLA-50)/10000*m,4),40,"Tahoma",Red);
 }
 else {
 ObjectSetText("signal21"," TOMO: "+DoubleToStr((iLow(NULL,0,7)+iLow(NULL,0,6)+iLow(NULL,0,4))/3-cval[0]*1.28*m*(iHigh(symbol,0,iHighest(symbol,0,MODE_HIGH,3,0))-iLow(symbol,0,iLowest(symbol,0,MODE_LOW,2,0)))*65*volatility
+(VOLA-50)/10000*m,4)+"-"+DoubleToStr((iLow(NULL,0,7)+iLow(NULL,0,6)+iLow(NULL,0,4))/3-cval[0]*1.62*m*(iHigh(symbol,0,iHighest(symbol,0,MODE_HIGH,3,0))-iLow(symbol,0,iLowest(symbol,0,MODE_LOW,2,0)))*65*volatility
+(VOLA-50)/10000*m,4),40,"Tahoma",DarkGreen);
 }

Using the RSI2 Hedge System

The RSI2 Hedge.ex4 has gone through quite a bit of evolution.

The previous RSI2 Hedge article discusses some of its plots appearing on 30 minutes for directional guidance. There has been changes since, but this article would be concentrating on the new hourly signals.

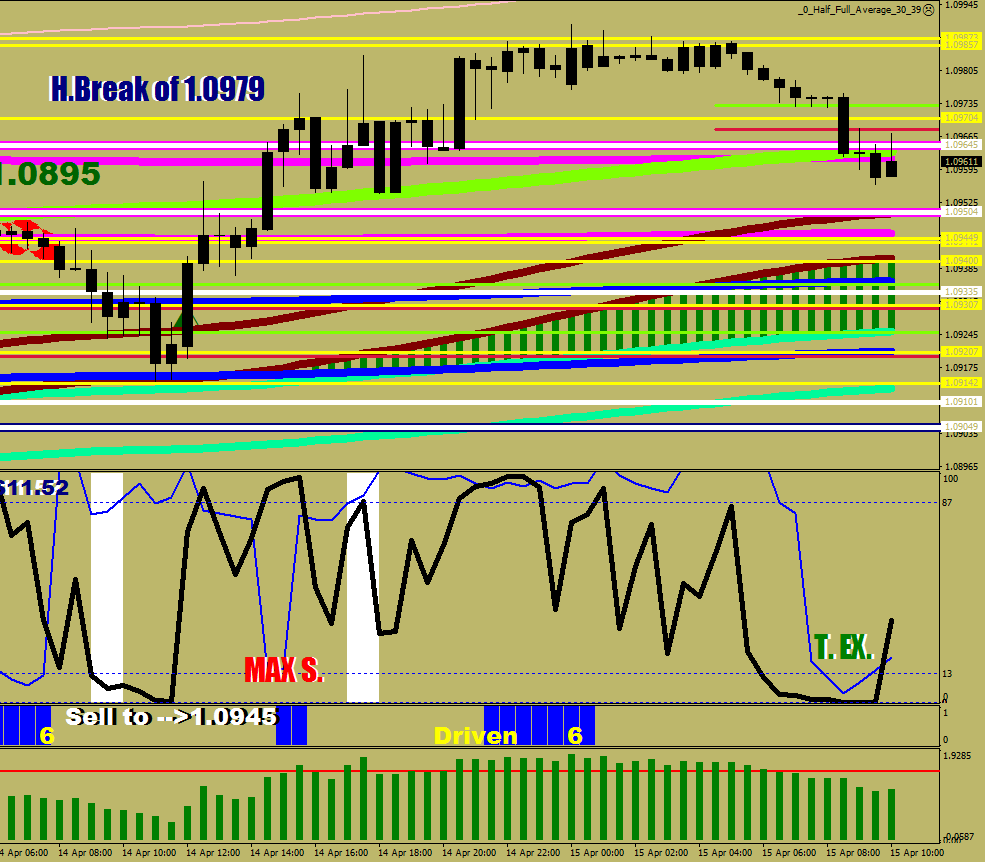
This is more or less what you would see for plots. Going into the day you can see that the suggested side has shadow contour. Buys go hand in hand with oversold RSI2s. The white stripe means full charge as per usual.

All the other trades were valid as well if they got a fill, just keep in mind that they are counter-directional ones and would need monitoring / protective stop once in gains.

The new signals revolve around the liquidity break purple diagonals.

You can see clearly that on the way down the suggested trades were on the downside.

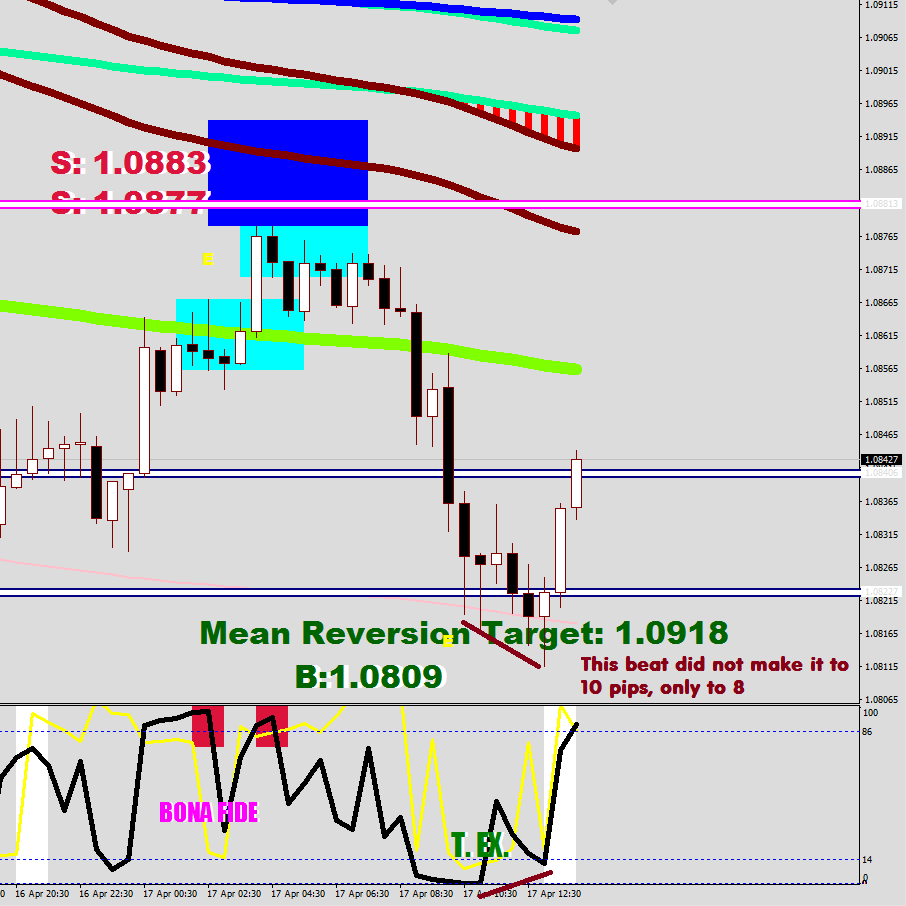
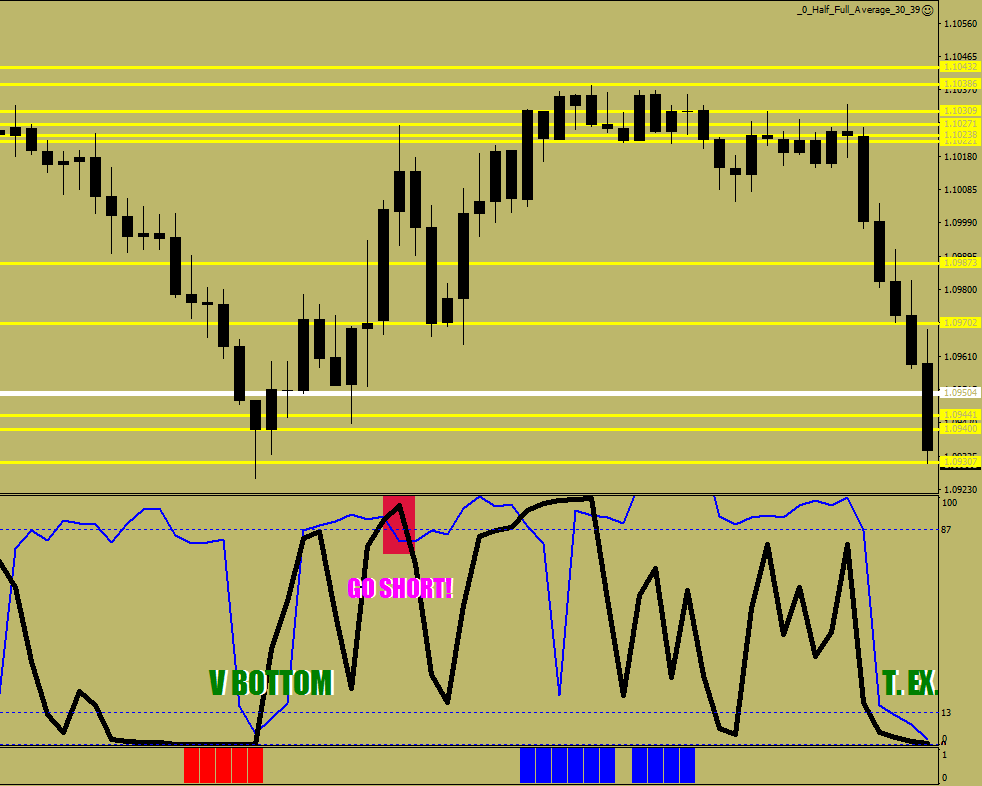
T. EX. means total exhaustion.

The highlights correspond to the red/green shadings below.

When you have the right side figured for you by the program, my Stochastic Bars Mixed w Levels can give you all the levels on 30-minute.

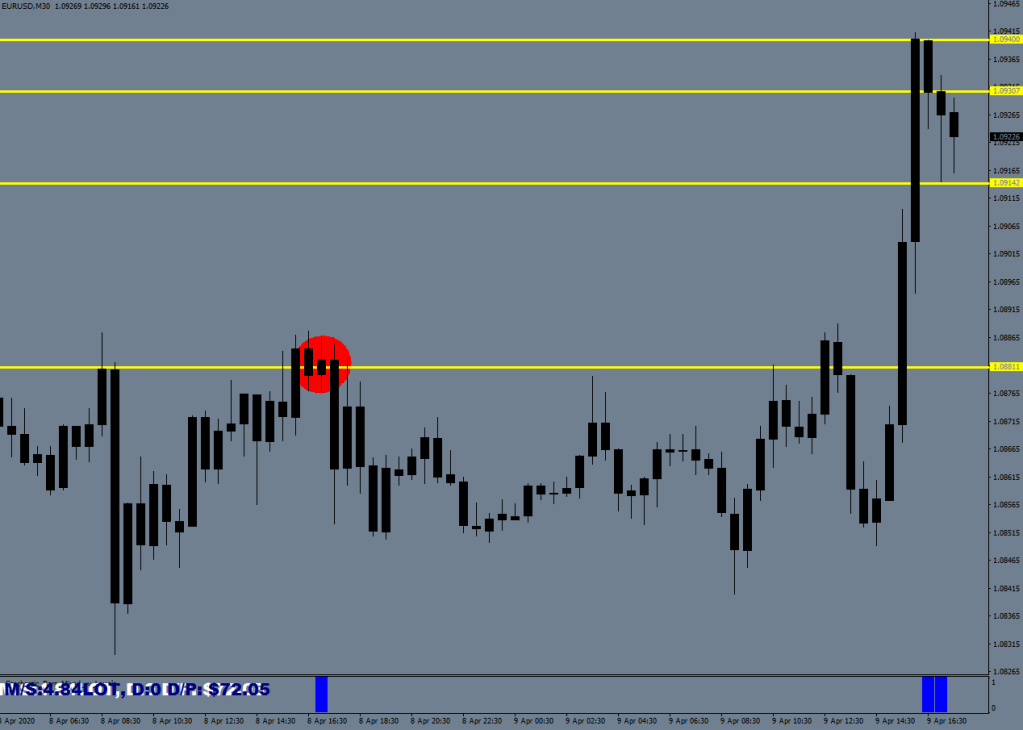
Its basic function was to show overdrive readings with blue/red bars, it has a Maximum Size figured for 1:500 leverage, the D is a directional risk (positive/negative) exposure lot size, the D/P is the P/L for the day.

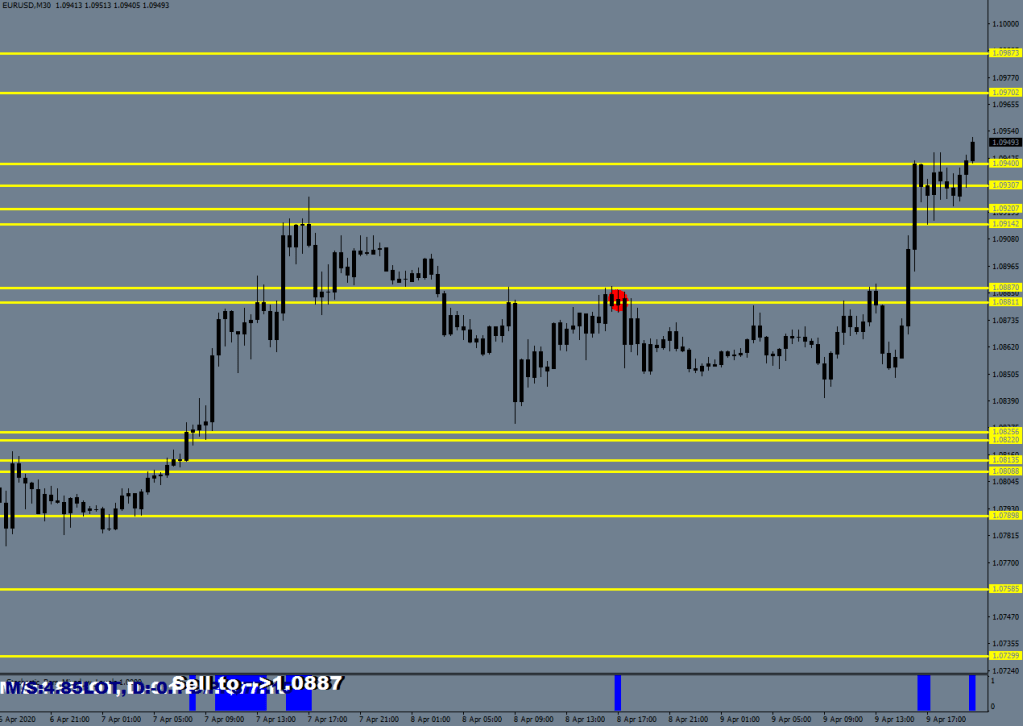
The lines are figured from the overdrive values.

If you go back to the first screen, you can now understand that your pullback buys would have a target 1 at the nearest resistance line, which was 1.0881 and the suggested break-out trades would be good for the second resistance area out. The default look back of 500 can be changed – in fact I normally have it on 1000.

The 2nd resistance out was at 1.0940 – perfect hit. New levels were made since, but these two were in place from before.

(count 2 lines within 10 pips as 1)

Stochastic bars mixed also provides with some counter directional trades that I dubbed “2nd Blood”. It arranges the levels into a sorted array and gives you the value for the 1st line that is more than 25 pips away. Usually can make around 40 pips from your entry.

I can’t make trading any easier for you.

These two programs can be yours in exchange for a donation.

macdulio@yahoo.com

The next 2 levels:

There should be a second blood call coming up soon.

additional signals

B/B = Buy Beat

S/B = Sell Beat

HDIR = Holding Direction

V Bottom = V Bottom

Can you see the undercut here?


Extended time remarks from here

I now have S/B1 and S/B2 listed. Not getting a fill on the one further out is relative weakness. Surpassing the further value talks of relative strength in the direction.

With the following call I gave the turn around within 12 pips of tolerance:

1.0838 was supposed to be the break-down short level. The low was made at 1.0840.

Yesterday someone approached me who was trying to make business out of selling calls for $70 a month. I saw one of those. It was suggesting to buy Cable with 160 pips of stop loss! Compare that with my calls.

Now look at the second call. The 1.0892 call for the break-out was just missed by about 3 pips. If the order displacement was less by these 3 pips, you would have had to endure a 40-pip pullback before the breakout taking place, and with large size this could had gotten particularly painful.

So, I called the turn with the break-out values within 2 and 3 pips, one after the other. The displacement was chosen carefully.

The Volatility Whip #2

Who blinked this time?

They both did, but then the bulls blinked again.

What made this 5-wave structure down a primary Wave 2 down?

The fact that it crossed back down through the top of Mr. Maroon.

What is a promotion?

if (Close[i]>iMA(symbol,0,136,0,MODE_EMA, PRICE_LOW,i) && High[i]>iMA(symbol,0,268,0,MODE_EMA, PRICE_LOW,i) && High[i]>E16[i] && E32[i]>E16[i] && RSI2[i]>93  && RSI2[i+1]<93 && Close[i+1]<iMA(NULL,0,32,0,MODE_EMA, PRICE_MEDIAN,i+1)+50*Point){

A promotion is taking place above the E16 and E32 local to 15 minute, above Mr. Maroon, above the E136, has a spiking, peak RSI2 reading, yet it is lower than E32 plus 5 pips. It is a high serve for a slam dunk that would ultimately reverse the price. It shows up as a liquidity break on the 1H.

Liquidity break (purple dash) to slam price to the other side of the channel. I called this move Driven Thrust in my book, the Computer Aided Trading.

What provided support for Wave 2 down?

The bye-bye level of the swing up to Mr. Maroon, which is 35% beyond the length of the initial move (Close/Hedge on the screenshot).

Why was not the magenta drawing a channel at all?

A channel requires a trend line which is defined by 3 touches within reasonable time. The Magenta line was never a tend line.

The Volatility Whip #1

This series is merely a tally for future reference to help figuring wave count, to help identifying what is part of a wave structure and what is not.

The volatility whip that transpired last night is shown by the white lines.

See, when the terminal wave is printed (wave 5 of Wave 5) the market does not immediately start a new wave structure. There is a period that I have called anything from incubation to duking it out to calibration to who blinks first (my kisses to E.W.).

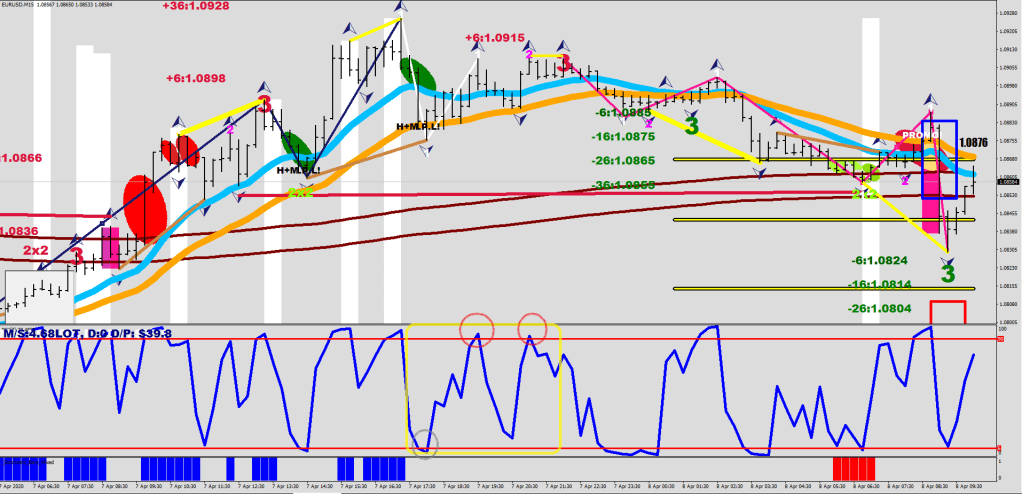
As per the image above, on the 15 min chart the bears blinked. On a 1 hour neither the overbought nor the oversold lines were hit (87,13) , but the 30 minute did get oversold, and can be used in exchange.

One way of playing the volatility whip is once it has the ink dried on it, you put out pending orders 10 pips out from the V and the W terminal points. (In a prior article I used the LOCO mosaic word for LOck out CLose out).

Make note of how subtle wave 1 of Wave 1 up was that started printing around midnight, and it remained entirely inside the Volatility Whip. It started with a reversal RSI2 divergence (yellow line)

What made this wave up a Bona Fide Wave 1 up is the fact that it managed to breach the lower end of Mr. Maroon out of its available 3 pushing attempts (3 waves).

It is probably worth pointing out that the fractal count reached a second #3 (in green) before Wave 1 started.

This current 5-wave structure up (that defined a new channel) just made its second #3, although the other one was buried under the elllipses in matching color.

Oh wait, what is it printing currently if 5 Waves to the upside were made already? Should I start tying the second part already? Actually, not.

This looks like Wave 4 down, for the RSI2 reading has not yet taken out that of Wave 2’s down for a continuation divergence up.

This looks better now:

()

RSI2 Hedge

Snapshots of the indicator in combination with LEMA 30N2.

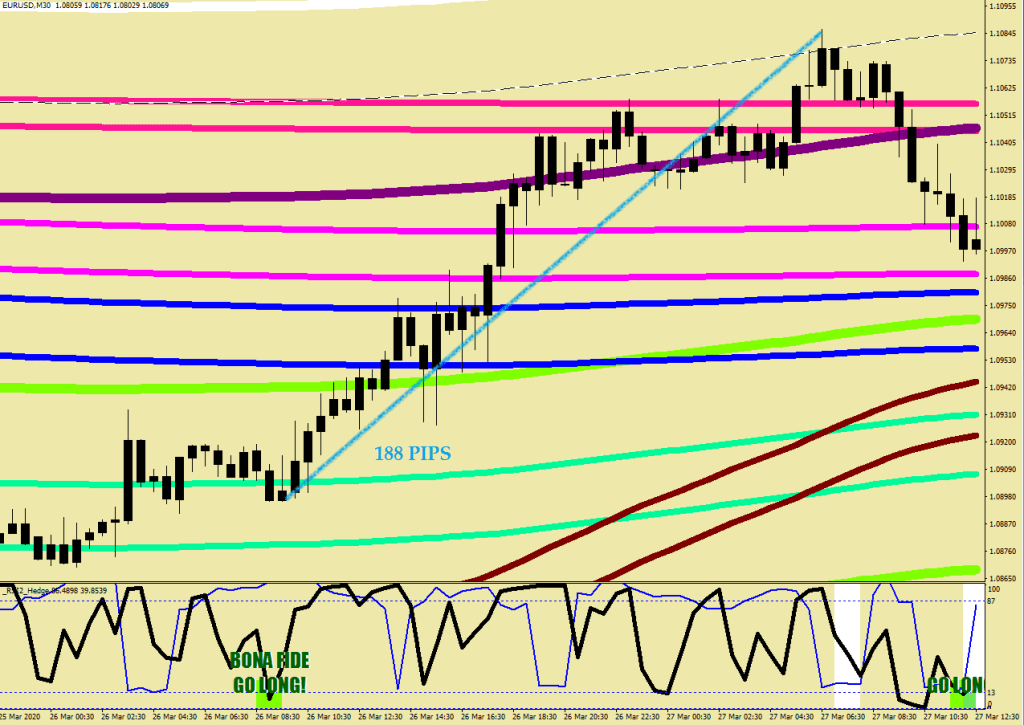
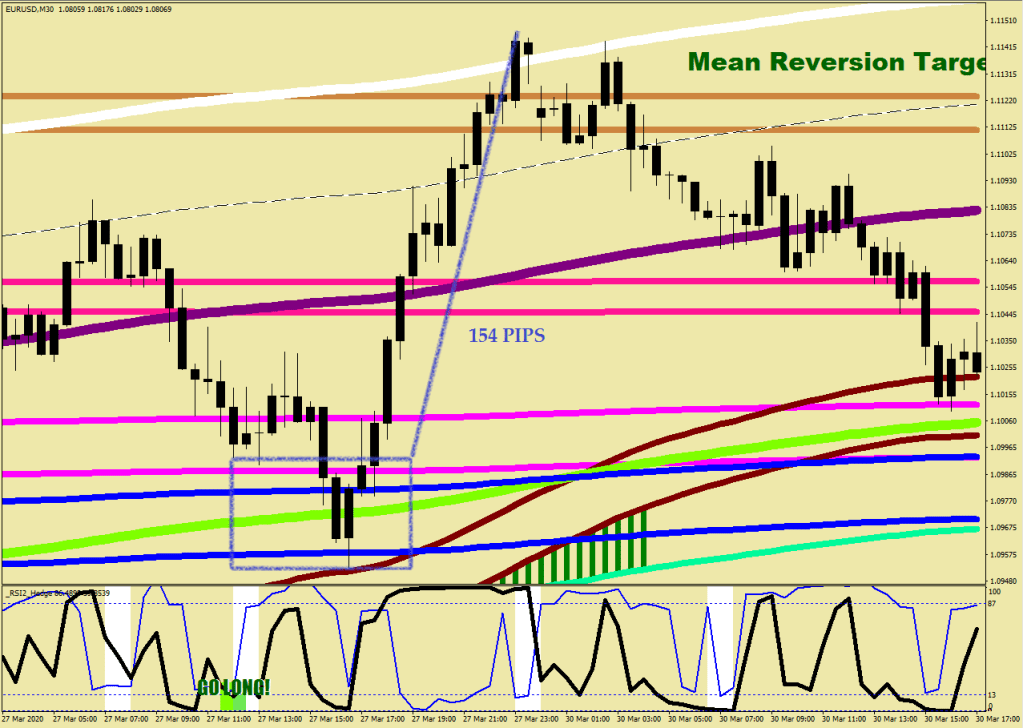
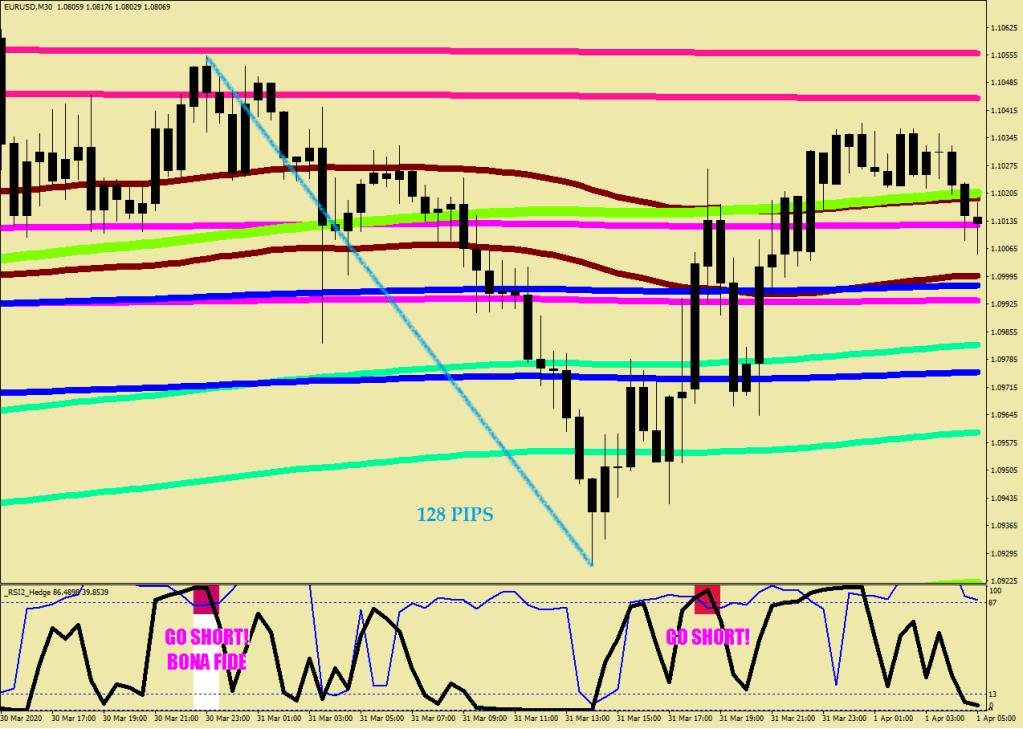
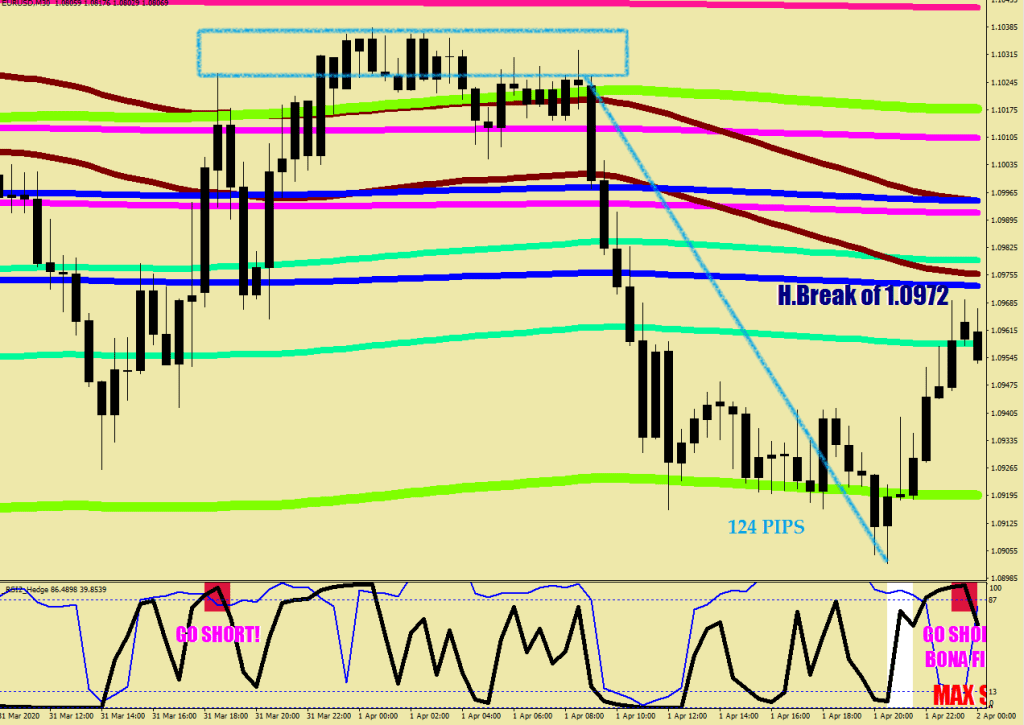
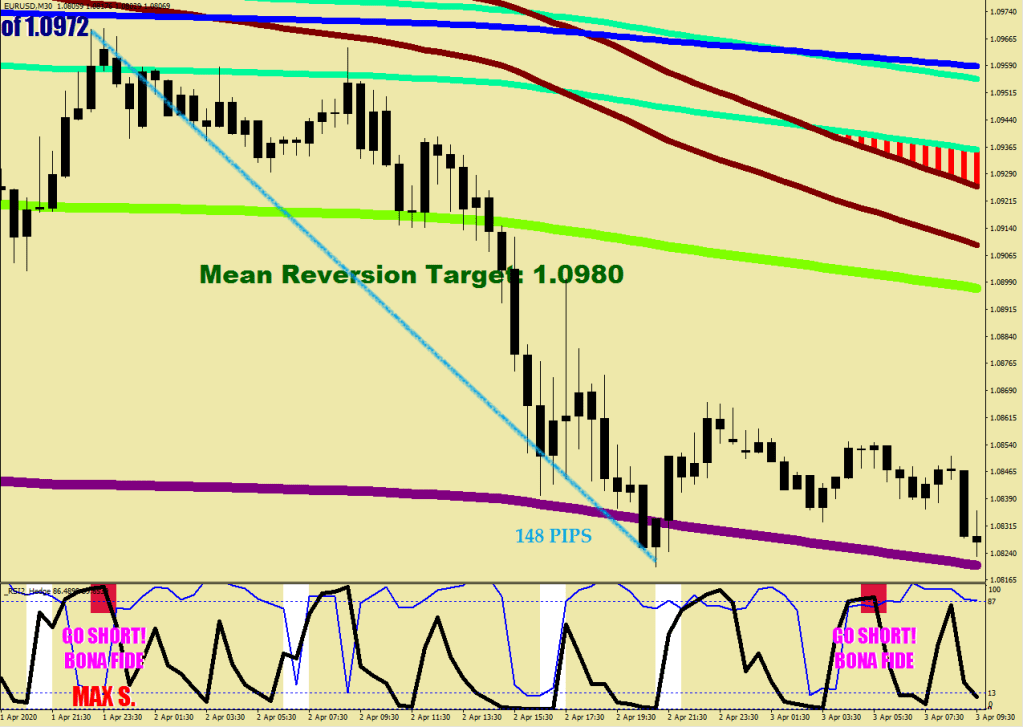
Do you want very good signals for 80-120 pip holdings? Look not further.

Bona Fide is effective immediately, so figure your maximum size that you can fit with a 30-pips stop without suffering much pain.

Without it is a scale in / accumulate beyond. The field above was 37 pips wide. Go in 10 pips lower, 20 pips lower, 30 pips lower. Add when price spikes back into the box after leaving.

The field above was 11 pips wide. Go in 10 pips higher. Add when price comes back in the box.


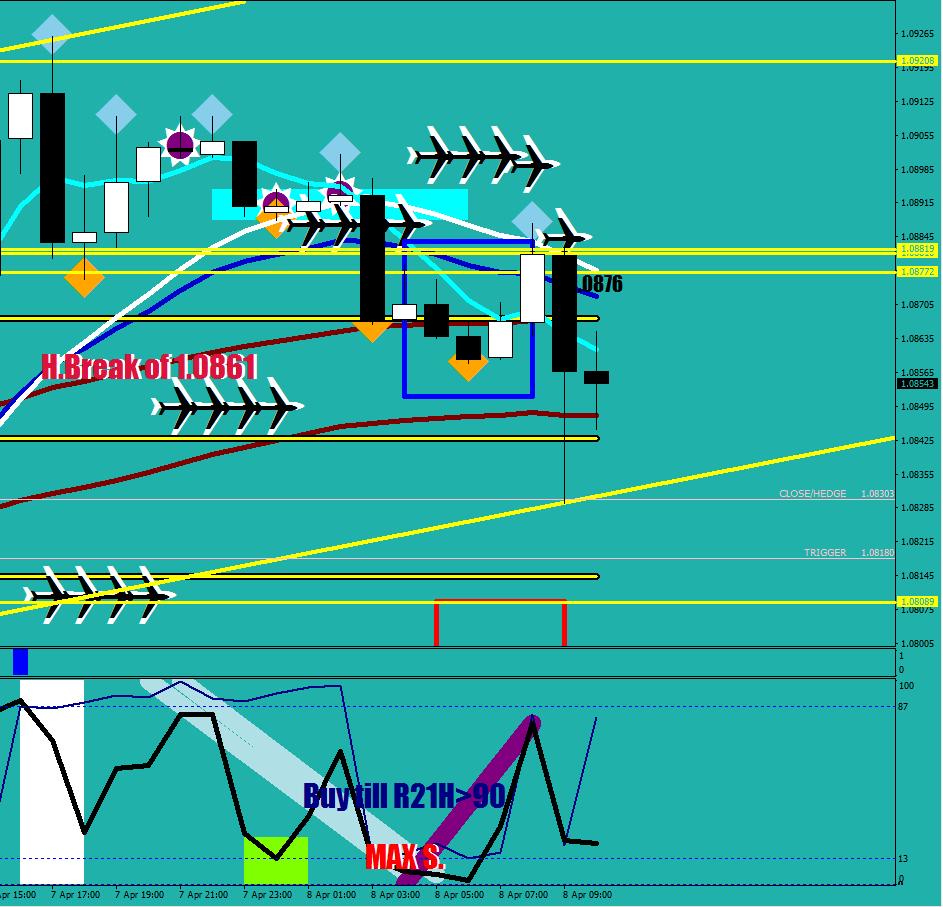
Maximum strength may be the beginning push of a major move.

Yours in exchange of a donation to Macdulio@yahoo.com

Disappearing Volatility

I used to say that volatility had no predicting power – from one day to another at least. Here’s something to point out that nobody seems to monitor for.

The high tide of the bear seems to be over with in the EUR/USD currency pair.

After the 9.5x stretch away from the mean on the upside and a 9.8x stretch to the downside,

the last maximum stretch did not exceed the 5x mark,

and to achieve that it had to get a new whip from the Market Makers, as Wave 3 fizzled out at the 4x mark.

Since volatility has been coming in, I see the odds favor a similar return for a whip, that should probably materialize at 1.0850 or so, where price would come into both Mr. Maroon and the Lower Guard Rail.

The next 2 levels down are 1.0727 & 1.0644.

#property copyright "Copyright © 2020, Macdulio" 
#property link      "https://forexfore.blog" 
#property description "V1.0"
#property description "Stretch Marker"
#property description "The dedgree of Stretch from the MEAN."
#property strict

//--- indicator settings
#property indicator_separate_window
#property indicator_buffers 1
#property indicator_color1  clrGreen
#property indicator_level1 5
#property indicator_level2 9.5
#property indicator_levelcolor clrBlue
#property indicator_levelstyle STYLE_DOT

extern double FSize=32;
double FMax = FSize*6/5;
double iHi4[];
double iLo4[];    

double ExtATRBuffer[];

int init(){
  
   SetIndexBuffer(0,ExtATRBuffer);   
   SetIndexStyle(0,DRAW_HISTOGRAM,STYLE_SOLID,4,clrGreen);
   return(0);
}

//+------------------------------------------------------------------+
//| Average True Range                                               |
//+------------------------------------------------------------------+
int start(){
  
  ArrayResize(ExtATRBuffer, Bars); 
  ArrayInitialize(ExtATRBuffer, EMPTY_VALUE);   
  ArrayResize(iHi4, Bars); 
  ArrayInitialize(iHi4, EMPTY_VALUE);   
  ArrayResize(iLo4, Bars); 
  ArrayInitialize(iLo4, EMPTY_VALUE);   
  
   int i;

  for(i=Bars-100; i>=0; i--){ 
   
     if (Period()==240)   iHi4[i]=iMA(NULL,0,52,0,MODE_EMA, PRICE_HIGH,i);
     else if (Period()==30) iHi4[i]=iMA(NULL,0,414,0,MODE_EMA, PRICE_HIGH,i);
     else if (Period()==60) iHi4[i]=iMA(NULL,0,207,0,MODE_EMA, PRICE_HIGH,i);
     if (Period()==240)  iLo4[i]=iMA(NULL,0,52,0,MODE_EMA, PRICE_LOW,i);
     else if (Period()==30) iLo4[i]=iMA(NULL,0,414,0,MODE_EMA, PRICE_LOW,i);
     else if (Period()==60) iLo4[i]=iMA(NULL,0,207,0,MODE_EMA, PRICE_LOW,i);
}

for(i=1000; i>=0; i--){ 

  if (Close[i]>iHi4[i]) ExtATRBuffer[i]= MathAbs((High[i]-iHi4[i])/FMax*10000);
  else if (Close[i]<iLo4[i]) ExtATRBuffer[i]= MathAbs((iLo4[i]-Low[i])/FMax*10000);
}

  return(0);
}
//+------------------------------------------------------------------+

Stretches from the mean beyond 5 times are the signature of the bear market.