Selling Weakness

I think I have a Stochastic Bars Mixed / Hybrid (my rendition of the good old Stochastic Bars) laying around somewhere.

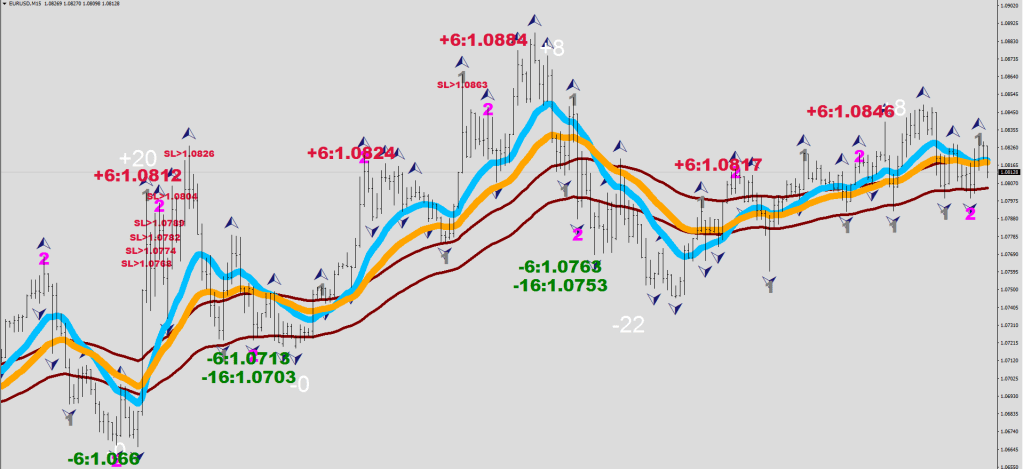
For 15 mins, change the values to 40, 100, 160.

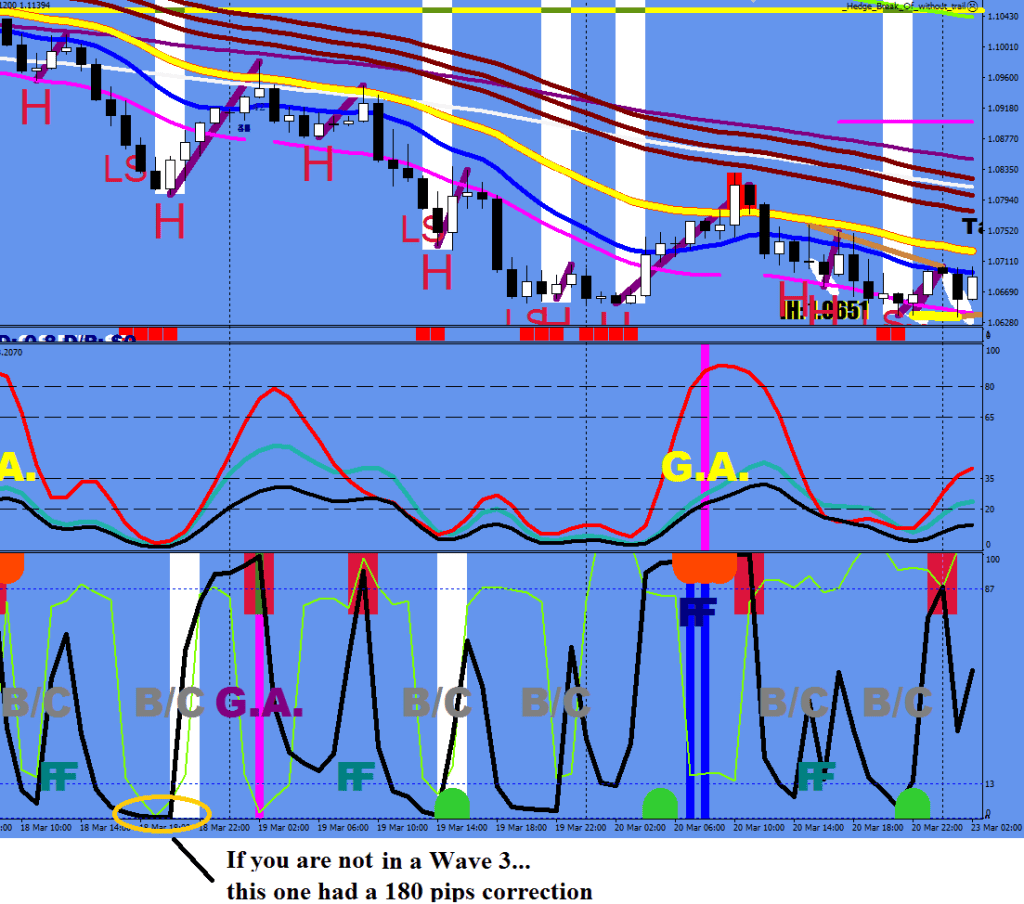
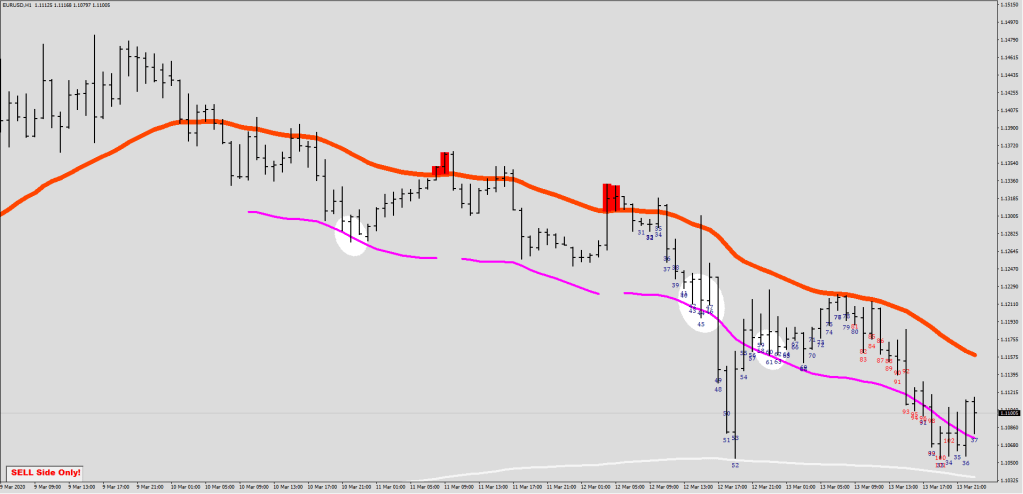
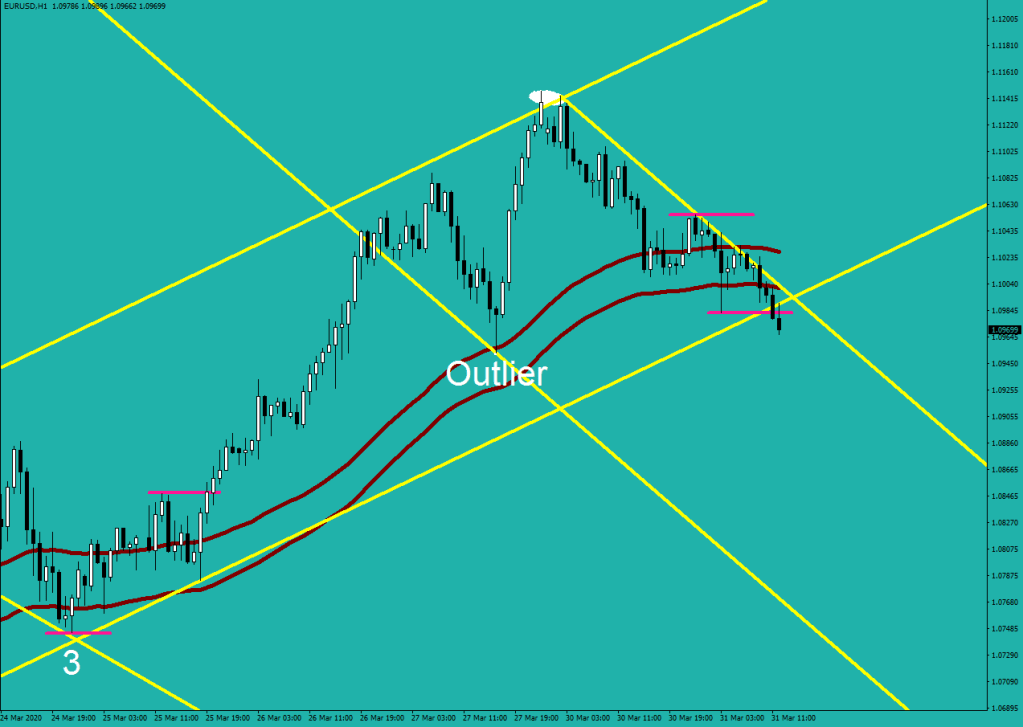
Selling Weakness is a comparison of red print present at the last Swing Low (i.e. Factal).

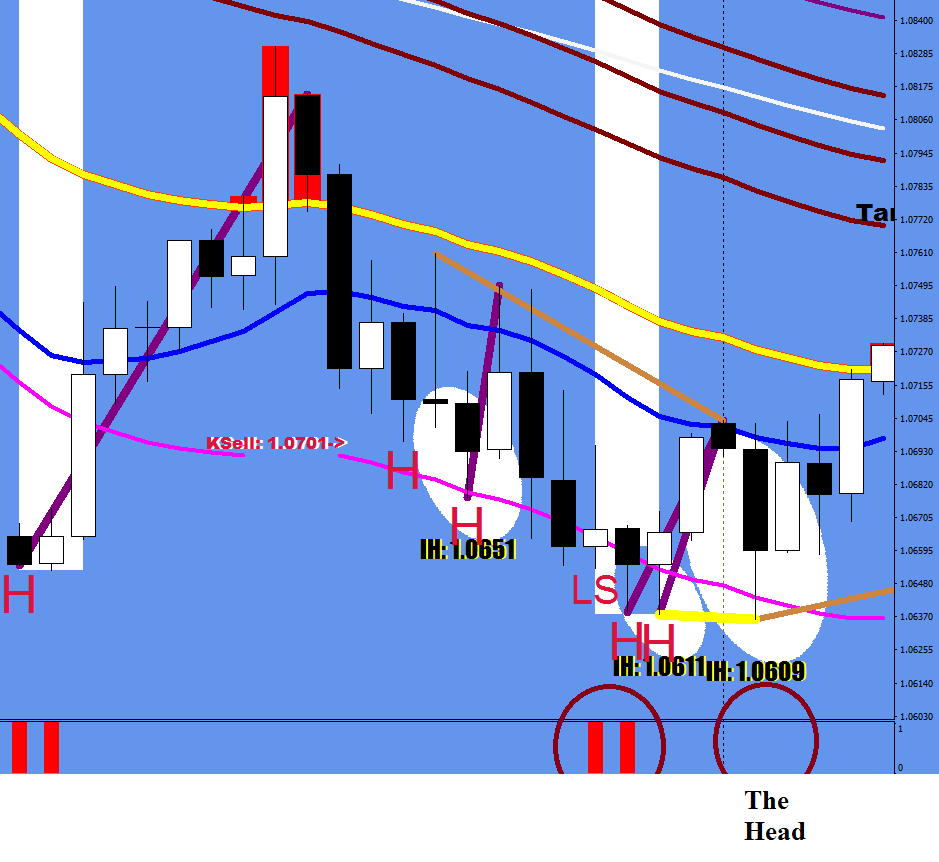
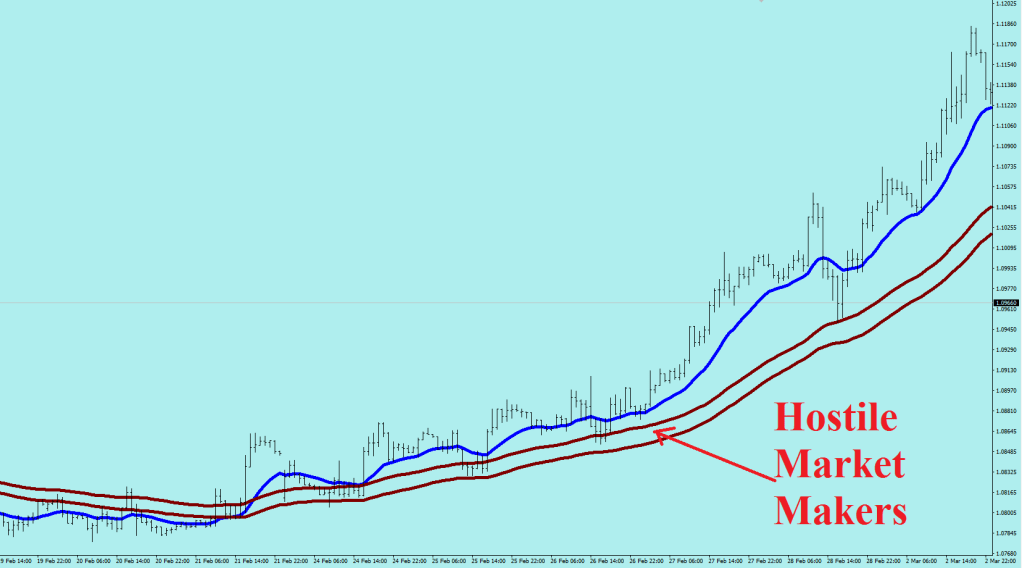
Sign of weakness circled. From the swing low, go in on 27, 34 & 40 pips pullbacks to build a holding. Do this all the way until your breakeven stops would start taking out your last positions. Oh yes, you want to be on the right side of the Market Makers, so your trading direction would have to be away from Mr. Maroon.

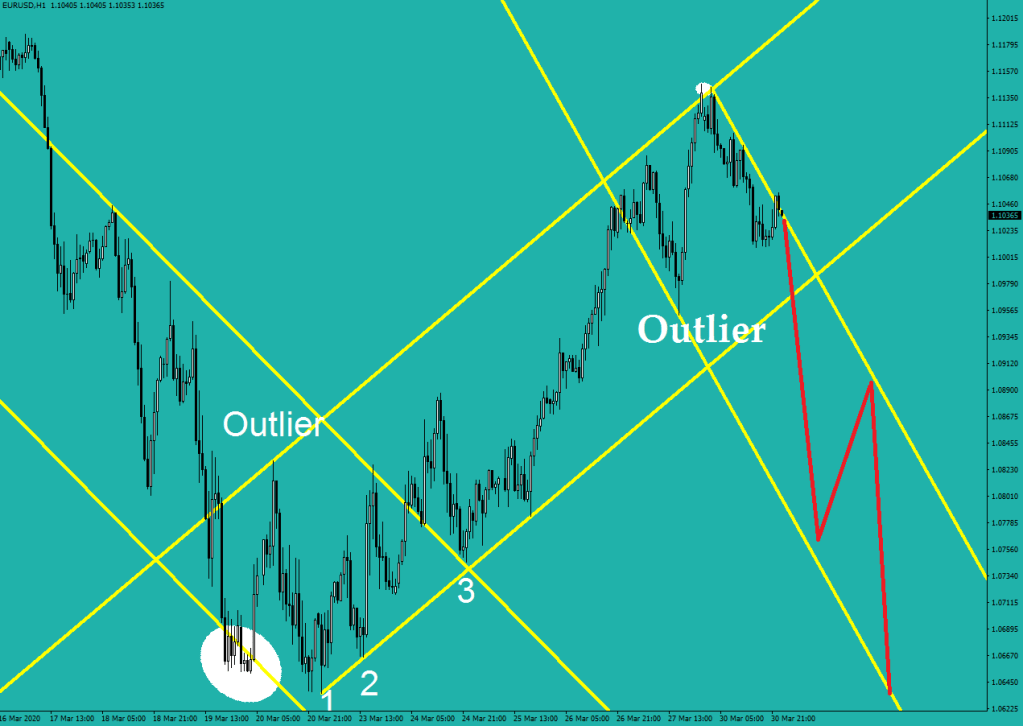
You already know that the Christening ceremony by the Market Makers is over with, and there is no reason to think that this move down would end before hitting the outlier leg. Wave 3 of Wave 3 just commenced.
Now you just need a good auto trail stop system from me plus the info above.

I’m guessing you could fill in the blanks about how buying strength would look like.

a drawing from yesterday

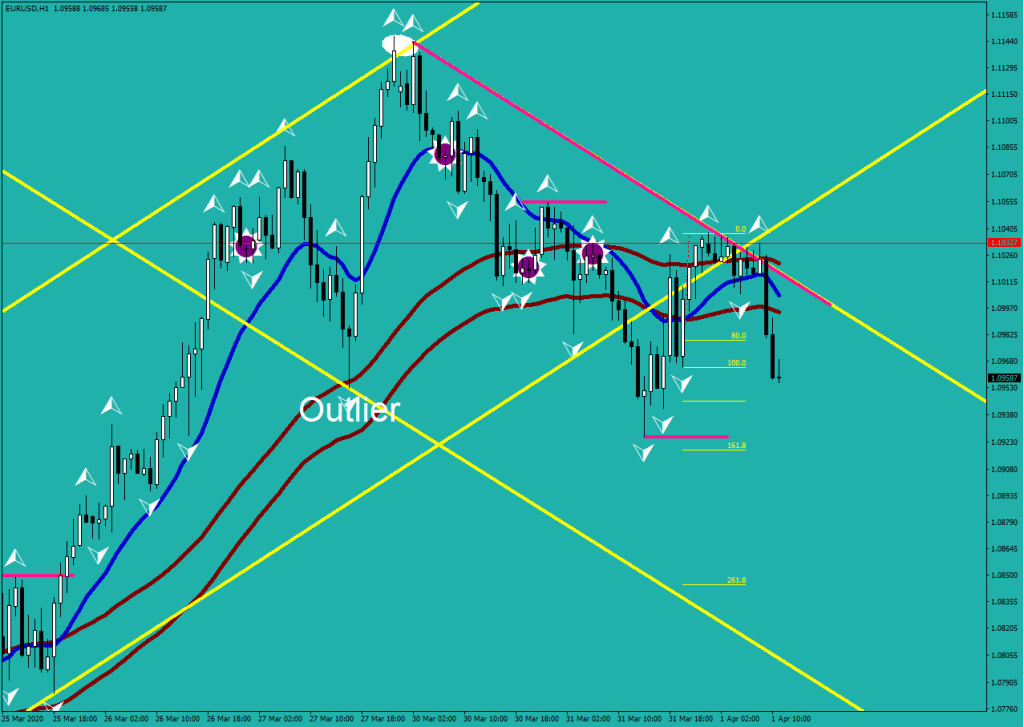
What do you know, an E-16 pullback for a wave 4 of Wave 3! So early on… A double dodge ball at the Market Maker Arena! Is this a real fight here or the MMs want to hand out more longs before the continuation?
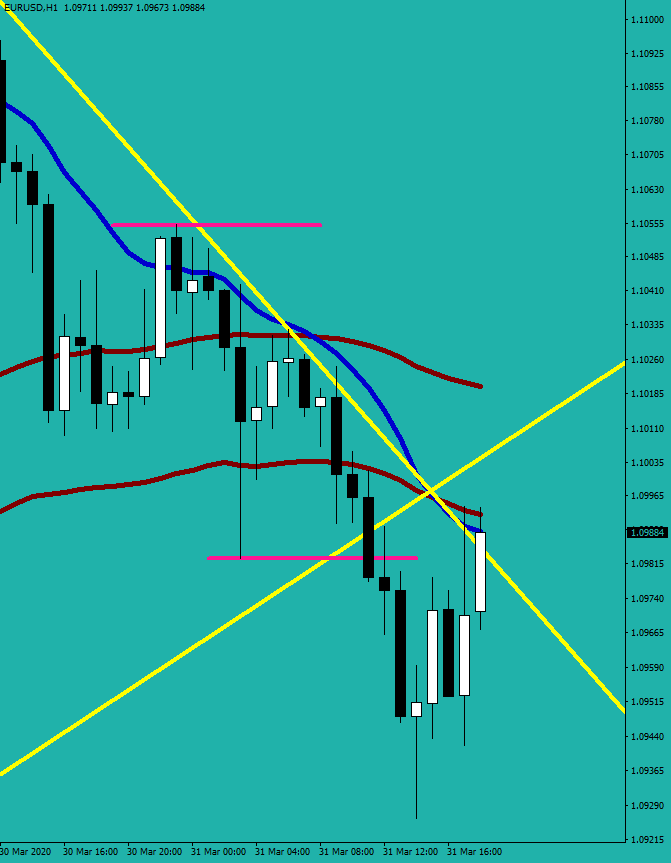
Who knows, all is well as long as you manage to extract moneys without adding to your unhedged, naked directional risk. I for one love markets going nowhere and providing cash every couple of minutes. The math is still 100x$5=$500.

The bias? That has not changed until you see 5 hourly closes printed above Mr. Maroon. A wave 4 has ambitions. Gotta wait it out.

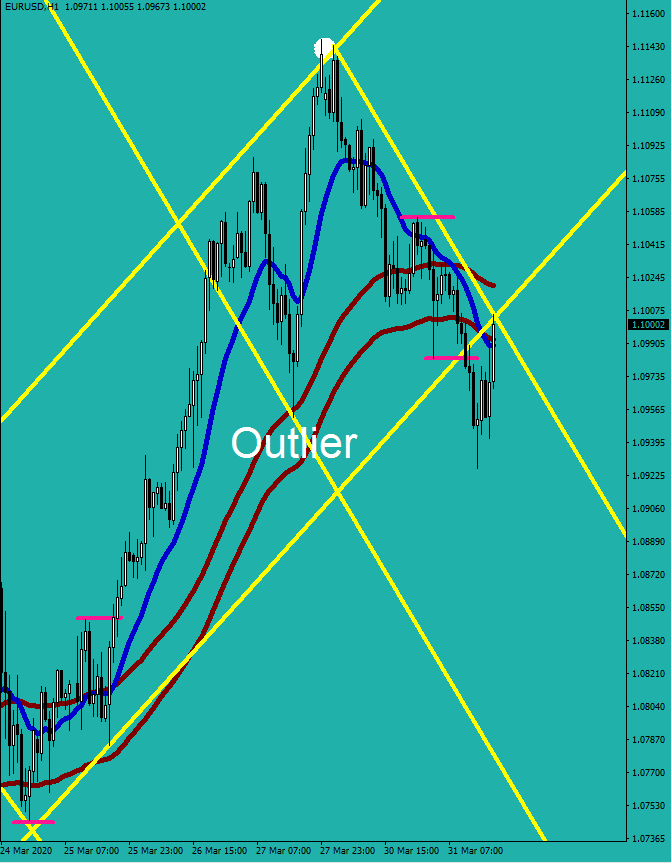
A trifecta then, throwing in a back test of the previous channel?
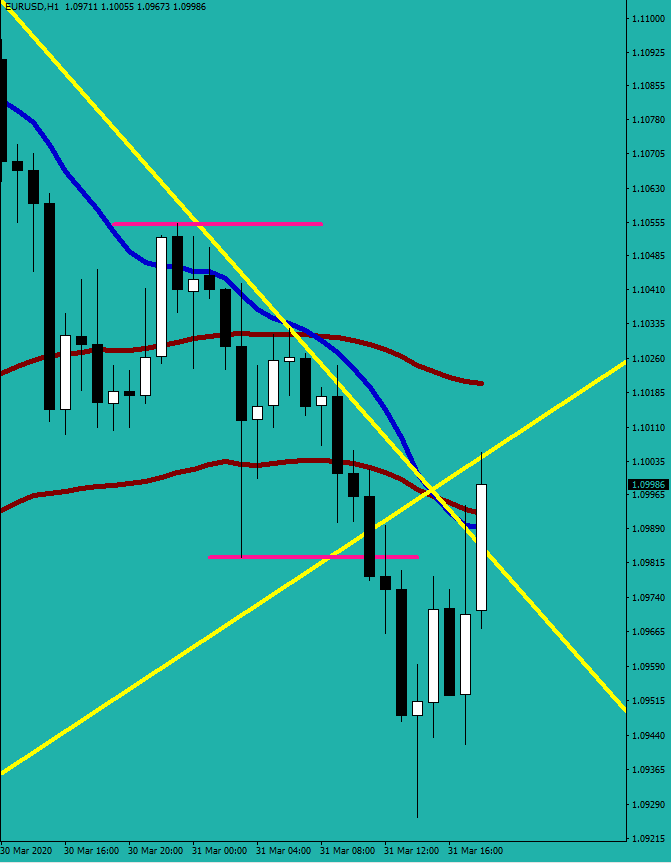
Certainly a head-scratcher, but it could be that the trend channel drawn is just too steep without this adjustment & redraw. If it is about that, then a 3rd touch would be needed to upgrade this resistance line to a trend line.

The answer to how high the wave 4 of Wave 3 down could go was in the continuation divergence. As wave 4 would be setting up a continuation divergence of its own, the price had to become more overbought and stay lower than the last reference point.

All of this however calls into question my wave counting. The fact that this move up went back through Mr. Maroon says that this was a Wave 2. Wave 3 down has not started yet, and based on this, it could be a long one down.
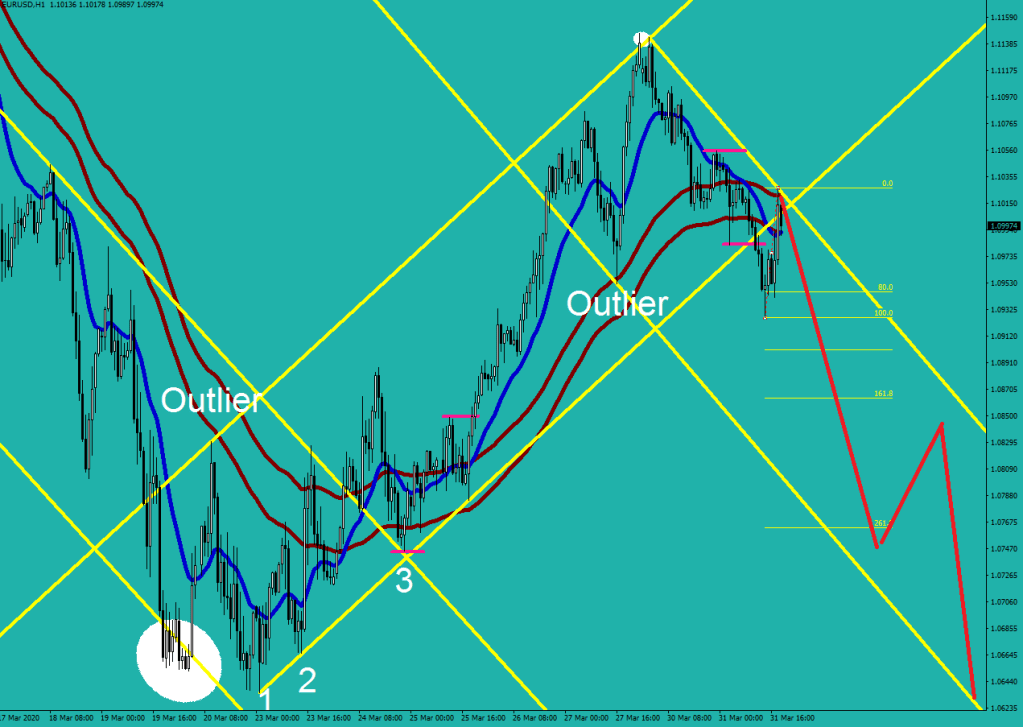
Now the channel looks about 45 degrees, the sustainable kind.

Close enough

Nick’s Lessons #6

How to interpret the Stochastic Combo and the RSI2 Hedge?

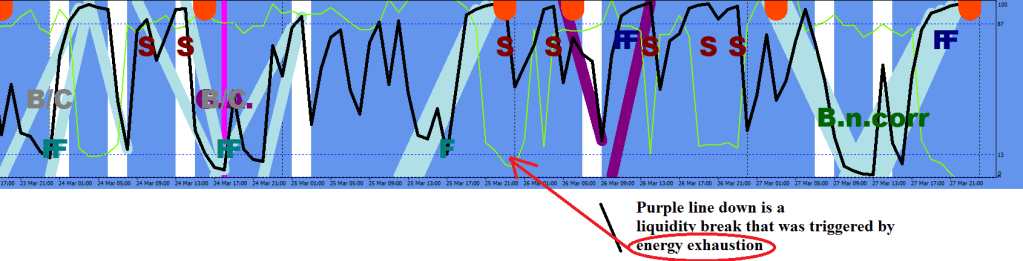
(The Buy Next correction refers to the sharp down spike into the oversold)

When energy gets exhausted, a sideways to counter direction move is necessary to recharge it.

The upwards purple has no other meaning than showing that price recovered quickly.

What do you think needs to happen now, that the energy completely tanked?
It retraced all that move before continuing down.

Price pulled back to 1/2 way between Mr. Maroon and E32

Also, look at the subtle change on the Stochastic Bars pointing out the location of the ultimate head

So, would there be a higher high? Very likely. The question is how much the beat would be. On the downside it was 2 pips.

Bear Market!

Bear Market – Defy Reversal – Mr. Maroon – Fractal Switch

Wave 4 Down

(Indicator: 2 Fractals)

Long / Binary Overhedge from Maroon to Target

(Indicators: Comfort Levels 4h, God Awesome Indicator V1.71, Fractal Switch, RSI2 Hedge)

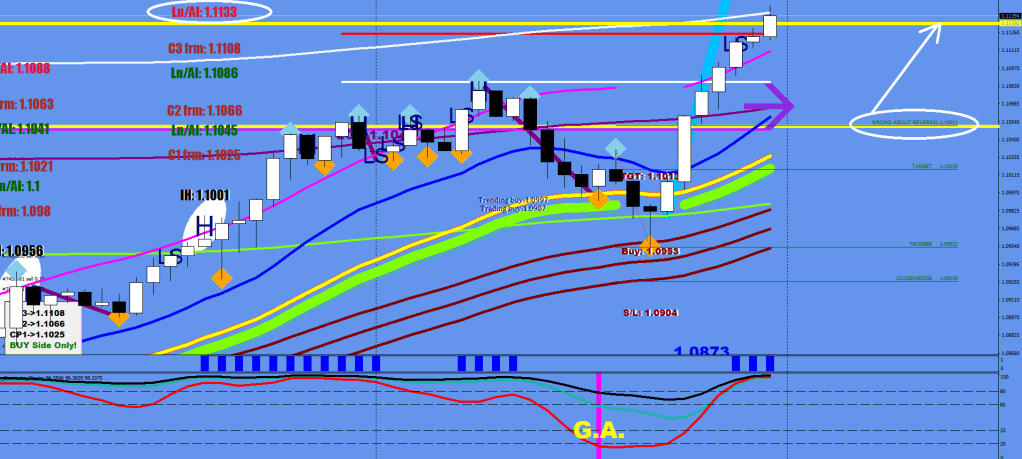
Long / Binary Overhedge from Wrong About Reversal to far end of Check Point 3

(Indicators: Where to Sell, Where to Buy, 15 Min ATR Targets, Maroon Attack, Fractal Switch, Stochastic Combo)

If you want to do this without the right calculations / indicators, be my guest.

They are not for free, for they are my life’s work, but I am willing to give you copies for a reasonable donation.

Macdulio@yahoo.com

What Is a Pullback?

Tempering with the 15m time frame, I concluded the following.

During a channeling move, when price crosses over the local E-16 and makes the first two fractal prints, it gives you a hint of the form of the continuation.

You’ll get a flat/shallow pullback that I refer to as a bridge if there is virtually no progress between the 1st and 2nd print.

The following images are with bridges (concentrate on the bottom side):

A bridge can yield you 1-2 pushes up, but only 1 is guaranteed. The entry is virtually at the height of the 2nd fractal or just a tad over.

A deeper pullback / real pullback shows progress being made between the first and the second fractal.

Such pullback may take several layers to get in, and it would always yield 2 pushes (2 x 3 fractal sequences). In this example there was another 20+ pips on the downside from the 3rd fractal, so -26: would had been the perfect entry.

This pullback committing a shot over the bow is the telltale of a divider wave, in this case, a Wave 2, meaning yet again, is that we are still in a Wave 3 to the upside until a Wave 4 pullback appears with its shot over the bow as well.

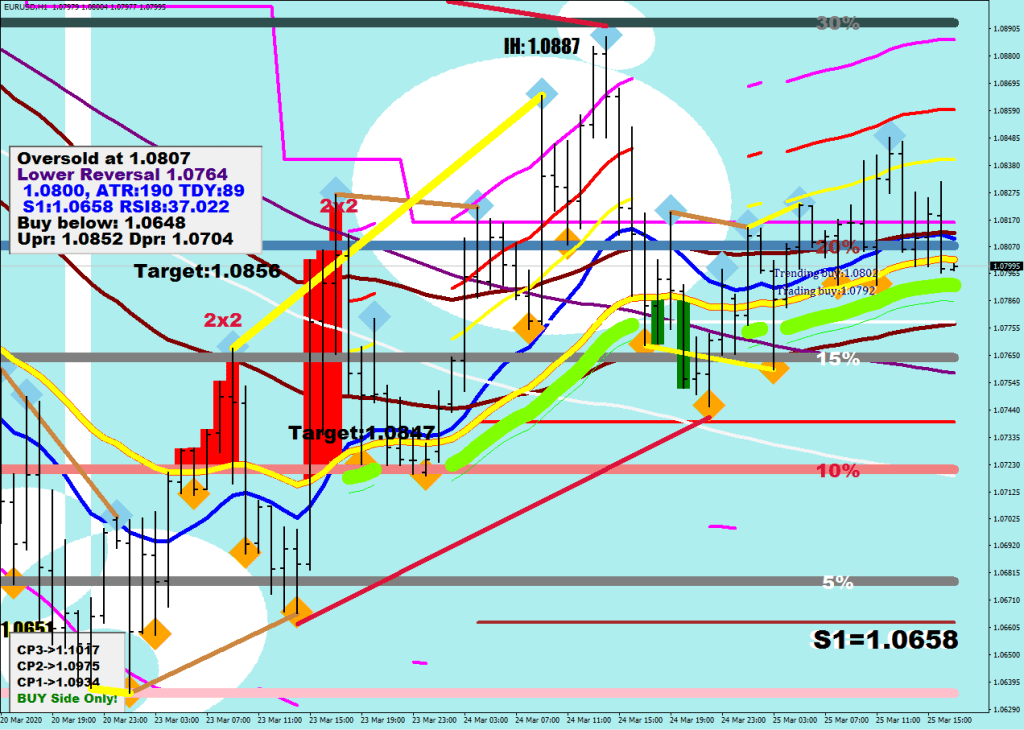
God Awesome V1.71

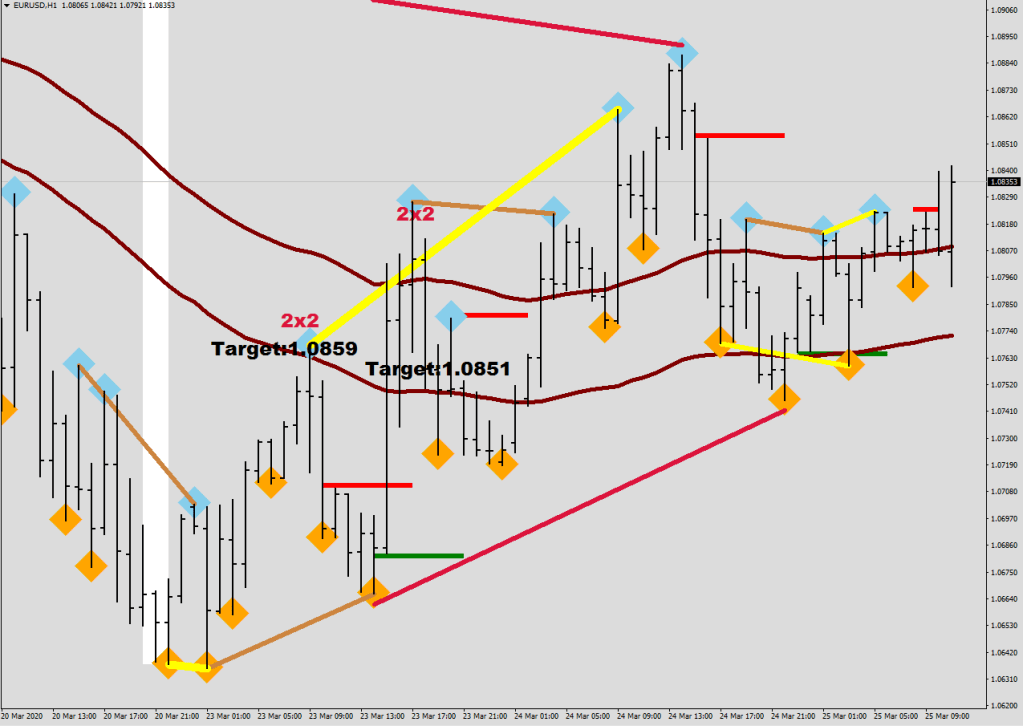
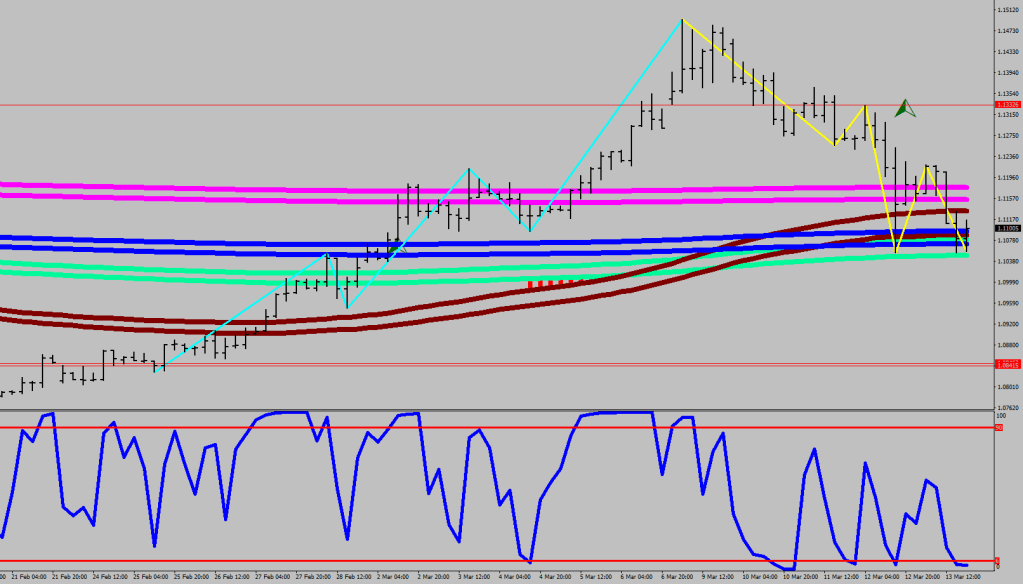
Much of a market’s story can be read from RSI2 divergences.

I’ve got Mr. Maroon on the screen, my Modified Fractals and the God Awesome V1.71 on the screen.

Vocabulary first.

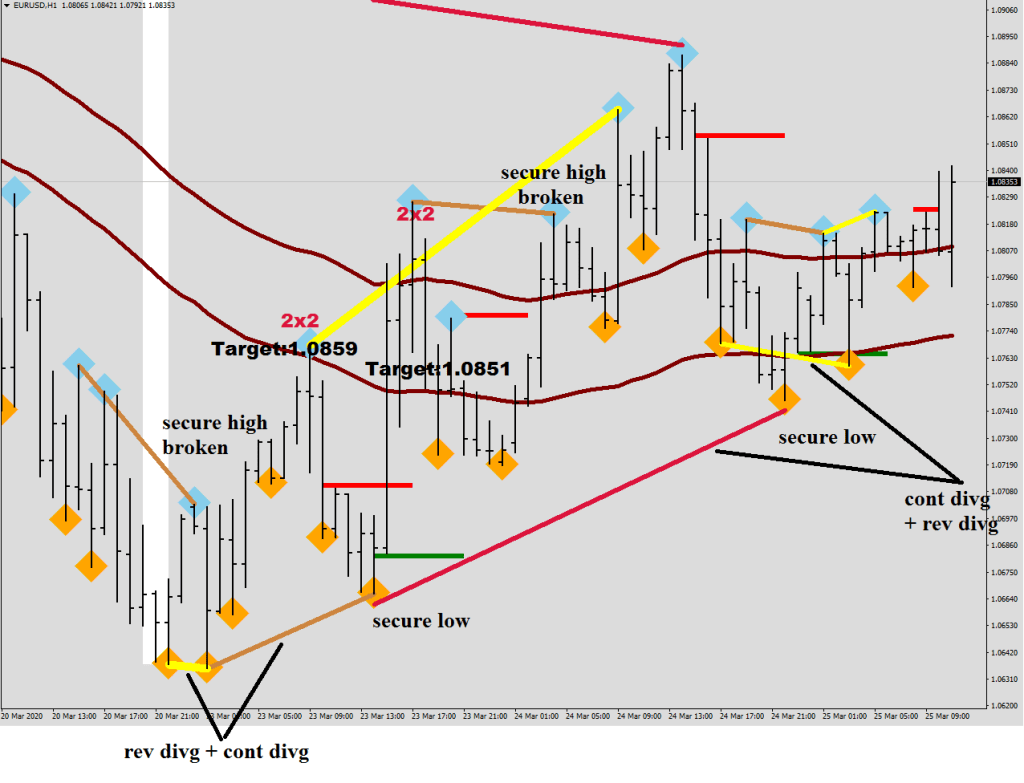
Reversal Divergence is when the Oscillator shows a higher reading on a lower low or a lower reading on a higher high. (Yellow lines)

Continuation divergence is when the Oscillator shows a more oversold condition at a higher low or a more overbought condition on a lower high. (Red and Brown lines)

Let’s try to read it together!

Pay extra attention to what is happening with the continuation divergences.

After the market reaching a full charge (white stripe at the low), it made a reversal divergence with the back test down (see the two fractals connected at the low with the yellow).

On the way up the market broke the secure high (set by the previous continuation divergence).

Price had a smack down at Mr. Maroon which resulted in a higher, secure low as the continuation divergence underlined it. (Starting point of Wave 1 up).

There was a continuation divergence on the way up that got broken (brown) and eventually a new, secure lower low was printed with the red line down showing up.

Wave 2 down was coming back through Mr. Maroon until a secure, higher low got printed which was accented by a reversal divergence as well.

Another continuation divergence was broken on the upside as well as a reversal divergence.

By all standards this is a Wave 3 up, yet the market is not running yet.

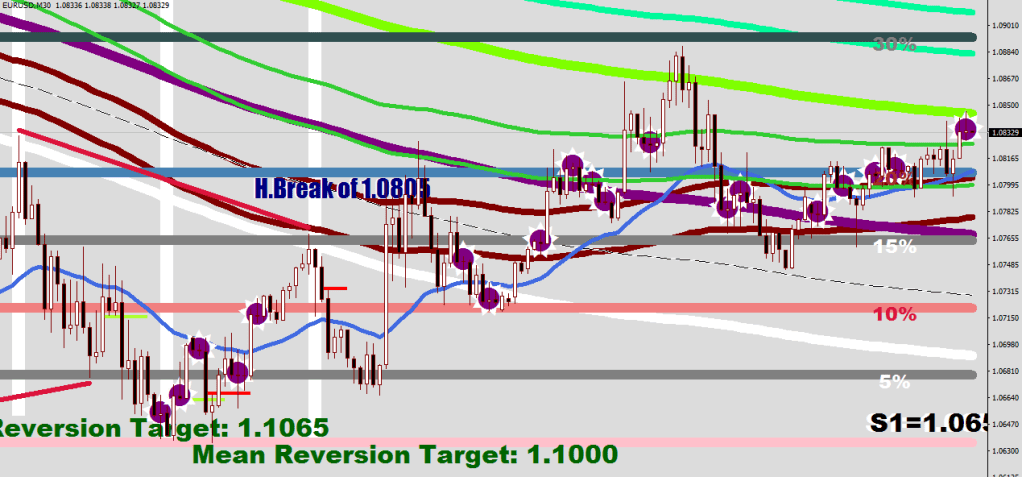
Why? Because there is a lot of head scratching here, at the oversold neckline (20%).

The Comfort Levels were added for better gauging.

All systems go for a buy, but the belief in further Euro strength is lacking, or we are just waiting on the start pistol. (CP2 starts at 1.0975)

The current market theme has been a strong Wave 1, a lackluster Wave 3 and a rip your face off Wave 5.

We could be facing something similar here.

A mean reversion could take the price back to 1.10.

Price is banging its head into the lower guard rail (Neon Green).

God Awesome copy can be obtained upon making a donation of your choice to macdulio@yahoo.com

As for actualities, I made the following routine for better entries and exits.

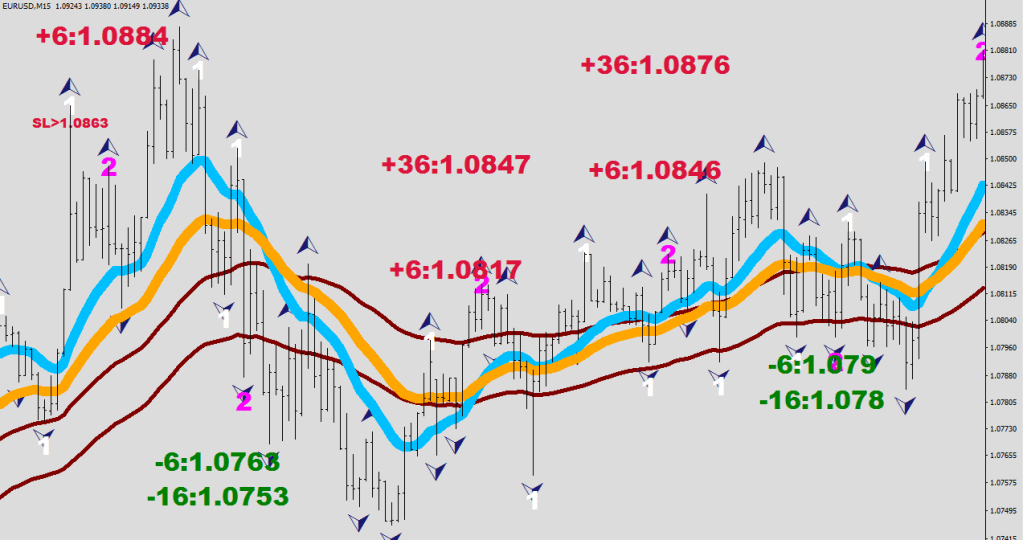
2 Fractals is its title, and was made for 15 minutes.

Fractal Switch

An indicator I made today, that utilizes the turbulence taking place around Mr. Maroon. Excellent for high volatility markets, such as right now.

For sale at the price it would be worth to you.

Write to me at macdulio@yahoo.com

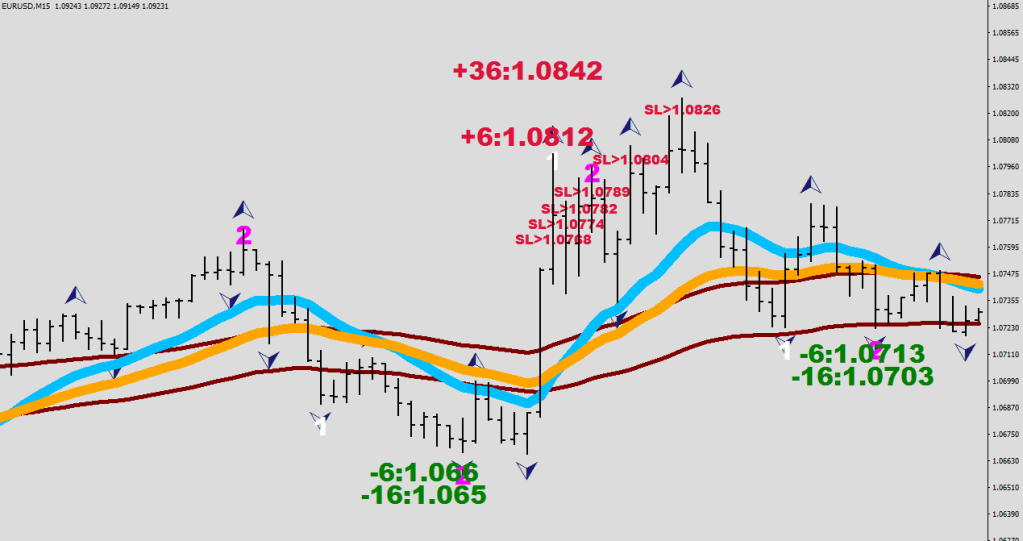
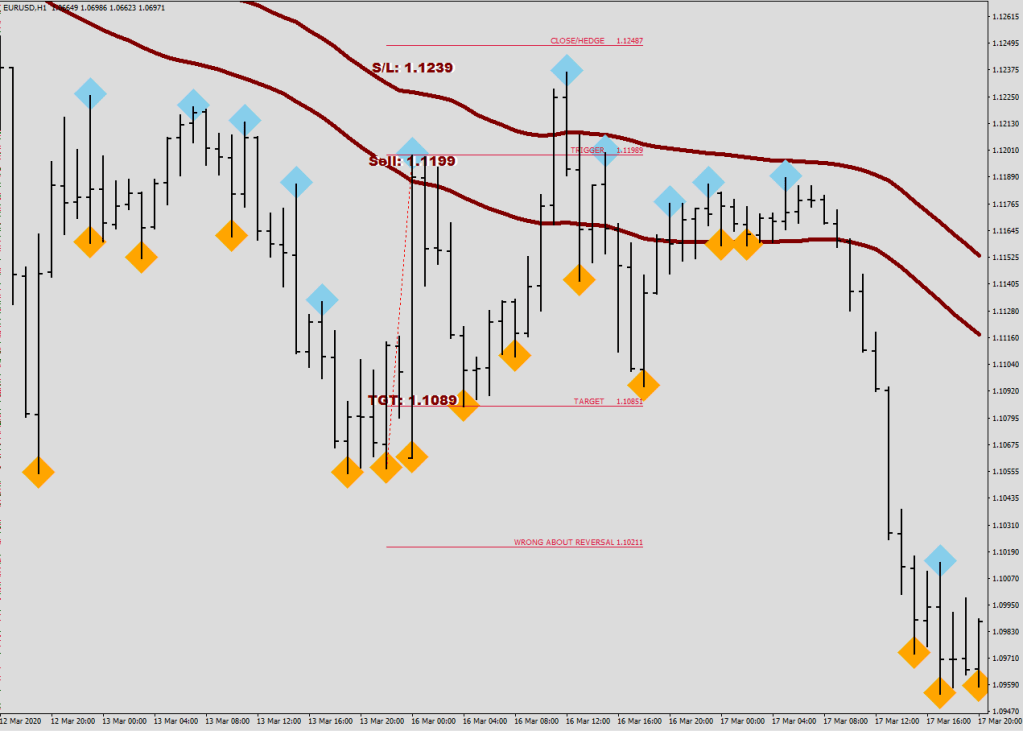
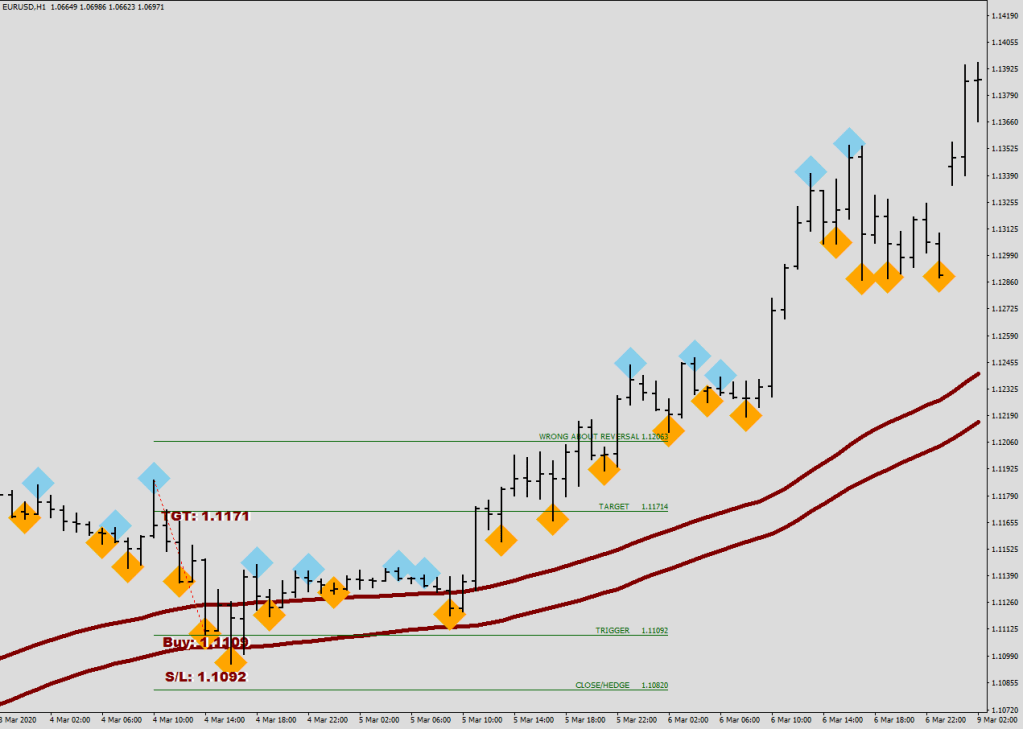
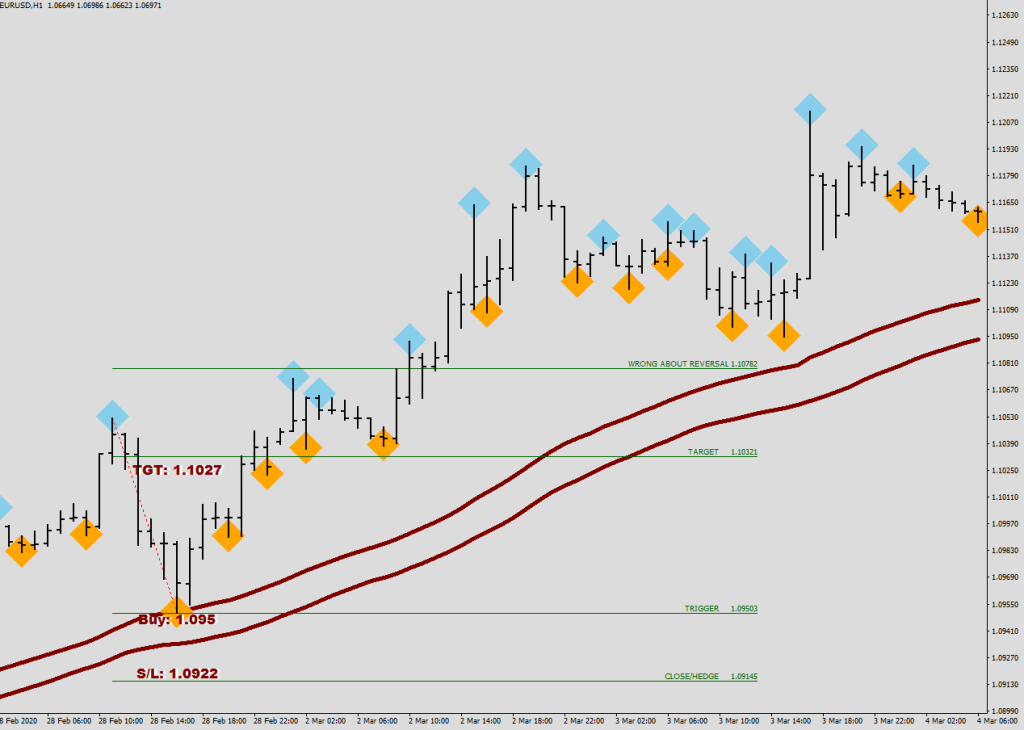
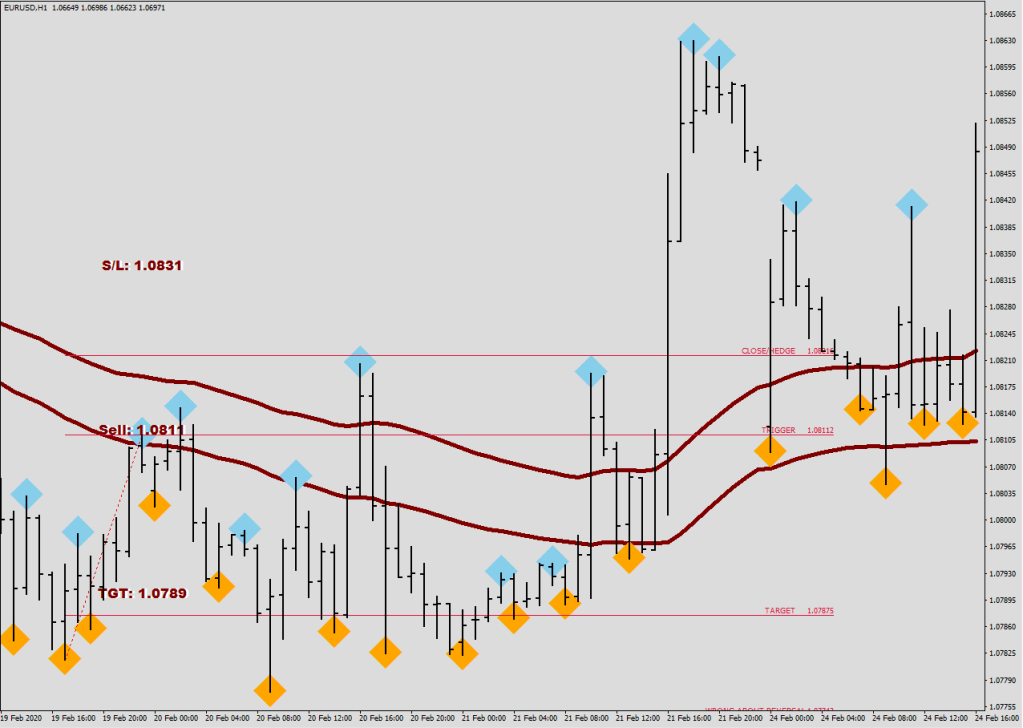
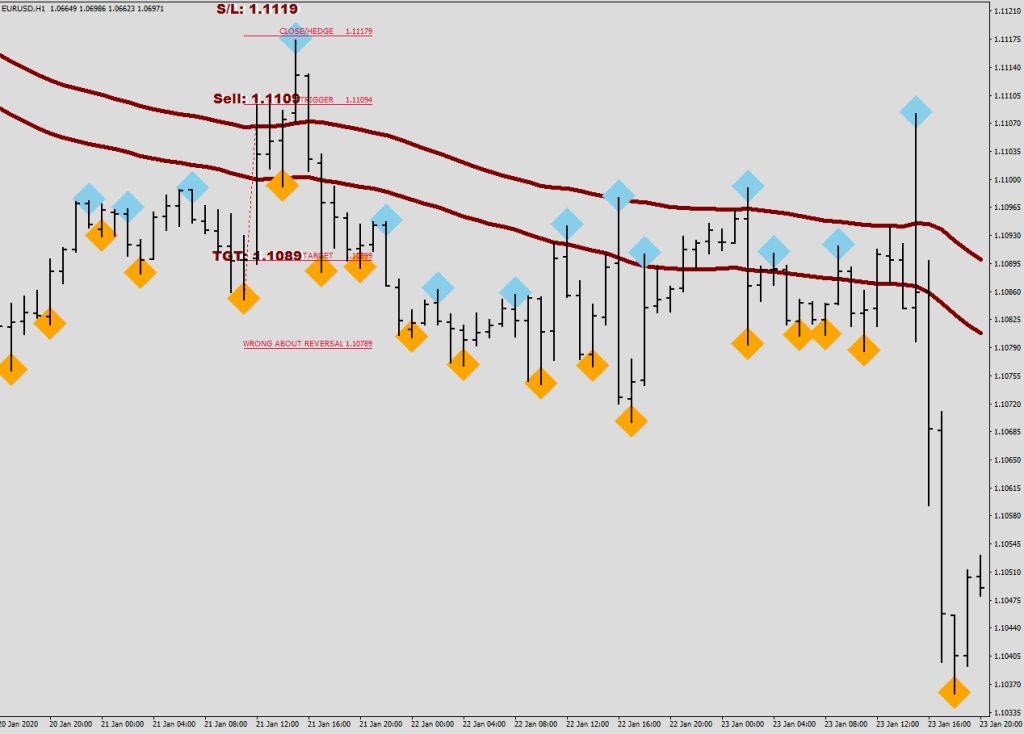
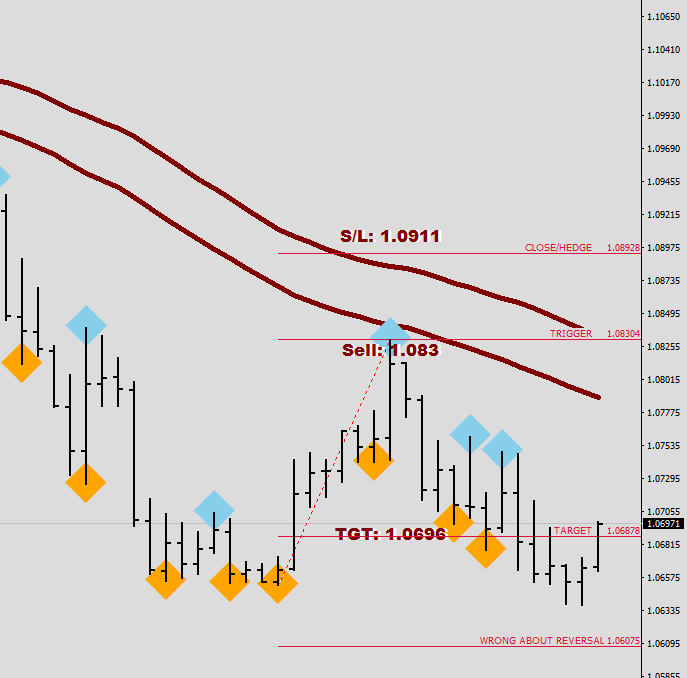
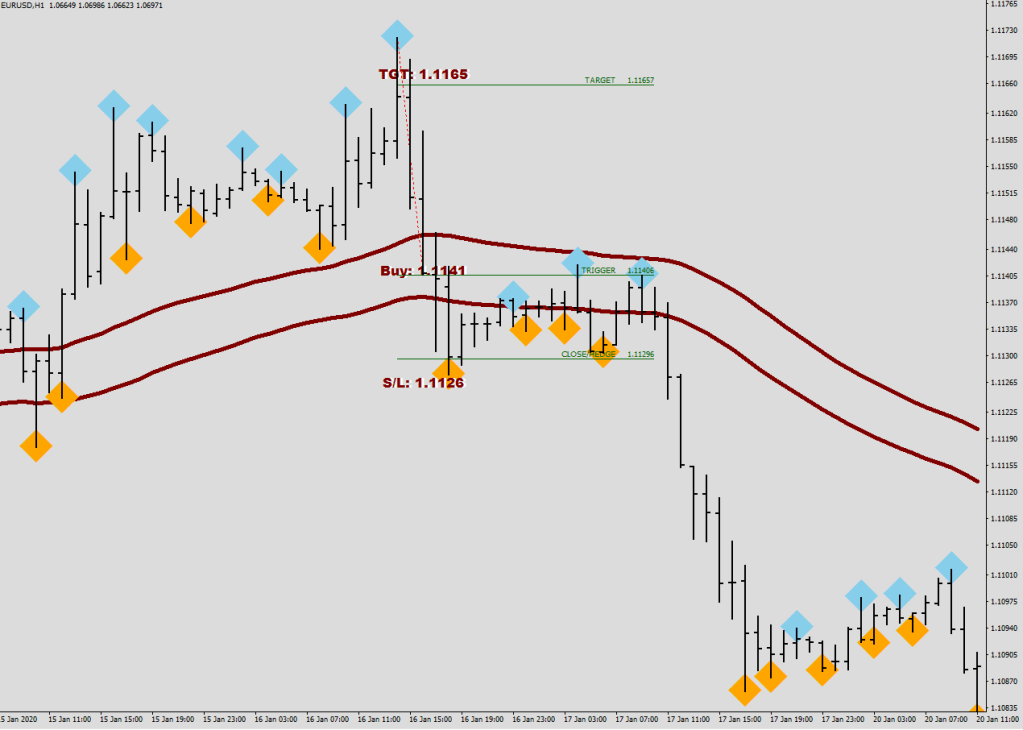
I did not just go back and cherry picked the best looking calls, these are the 10 last calls in reversed sequence.

As you can see, every plot will give you 2 trades. 1st trade is
Go Long / Short as close as possible to the trigger and use the Target for exit, apply a protective 1-pip trail once in gains, set it and forget it. Your risk and reward values are printed on the screen.
The second trade is Re-Opening in the same direction upon reaching the Wrong About the Reversal level – a buy/ sell stop pending with a trail stop associated.
If the other end gets hit, the Close / Hedge level is where you open the counter directional trade, which is another buy/sell stop.

2 more for kicks.

As you will find, if you want to define the risk for the Wrong About the Reversal entry, you can just plug in the Target level, and for the Close/Hedge/Counter Direction Trade, the Trigger level could be utilized.

As for the size of the secondary trade, it should be the normal size if you do not have any holdings, but double the size if you are traveling with a baggage in the wrong direction.

& if I increase my Maroon tolerance by a moon hold of 11 pips, this is what I end up with:

Not that it wasn’t obvious that the flat bottom would be undercut after a failed Wave 1 attempt (or a sign of strength), but it is nice to see that this is a familiar picture for the routine after giving it some slack.

Quote from my Friday morning letter:

This time, having printed 5 waves down I do not expect much reaction from E32, I think Maroon would be touched

One last smack down to a lower low is likely especially with the current flat bottom

How Not To Trade The Bear

There is no trading the bear market, forget trading entirely.

You need a completely different mindset, that could not be any further from that of a daytrader’s.

To thrive in the bear, you need to learn

  • position initiation
  • location of check points
  • hedging

If you look back the last 2 posts, you already have a good idea for where to initiate holdings: as close as possible to Mr. Maroon, but a cross beyond E32, sometimes even an approach would do nicely.

I would suggest scaling in to try to obtain the best average price and your required size.

Now comes the roller coaster.

You need to have and to hold shorts accumulated and with the wave structure in mind, you sit back and wait. Wait for check point 2 and check point 3.

Once the price is comfortable at CP2, you can bring your stop loss down to the top of CP1, or alternatively you could have a counter long – hedge initiated at that level with a smart trail stop this is the bear-roller-coaster-hedge option.

Once the price gets comfortable with the CP3 zone, you can move your stop / hedge long stop to the top of CP zone 2.

Consider lightening up on your shorts in the CO zone 3 if price made it there. Scale out, just like you scaled id.

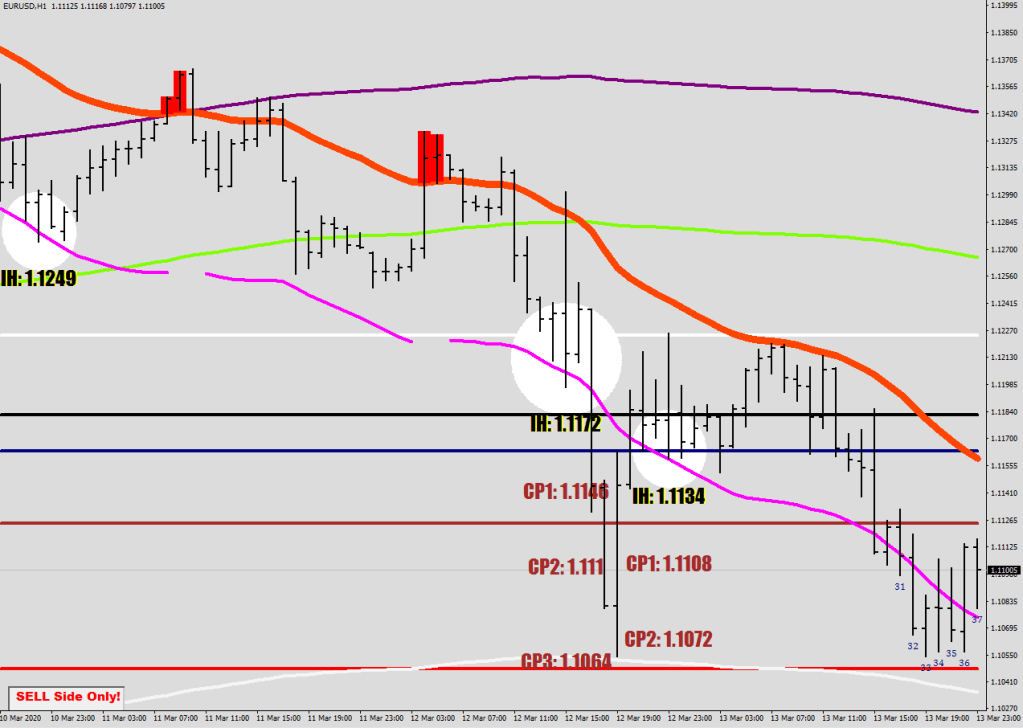
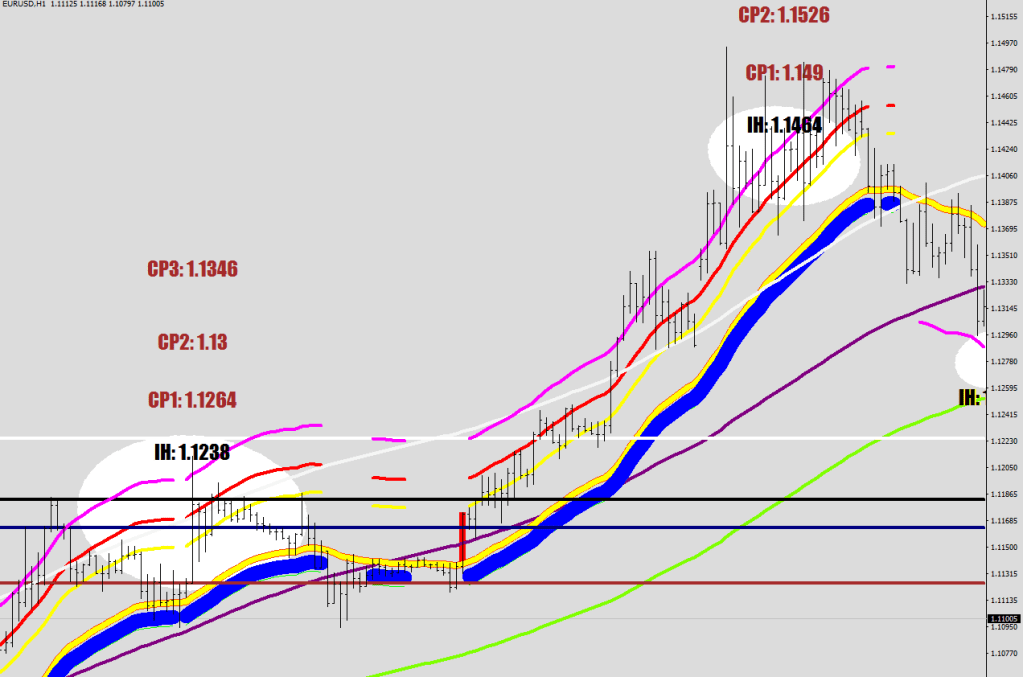
The levels are at certain displacements calculated from there is a threat of the Market Breaking away from its shadow (magenta line, white highlights)

CP1 top: Low[i]-FSize/1.5*Point-300*Point

CP2 top: Low[i]-FSize/1.5*Point-760*Point

CP3 top: Low[i]-FSize/1.5*Point-1120*Point

Each and every zone is 20 pips wide. FSize is 32 pips

Sh/As stands for Short/Add to Short (you may increase your size at these levels)

the shadow-separation line is: OverDriveCover[i]=E32[i]-FMax*Point

FMax (fluctuation maximum) is 6/5th of FSize

Where to from here? Back to the Eagle Nest of the Market Makers, Mr. Maroon himself.

Wave structure below

In conclusion, you don’t open naked longs unless price is well into CP3.

The Polar Bear

The bear appears when the Market Makers change their behaviour (polarity) from accommodating to opposing/offensive. Rather than settling for giving fills and collecting commission, vicious rabies comes over these punks.

Mr. Maroon (E67 High & Low) has never been this important

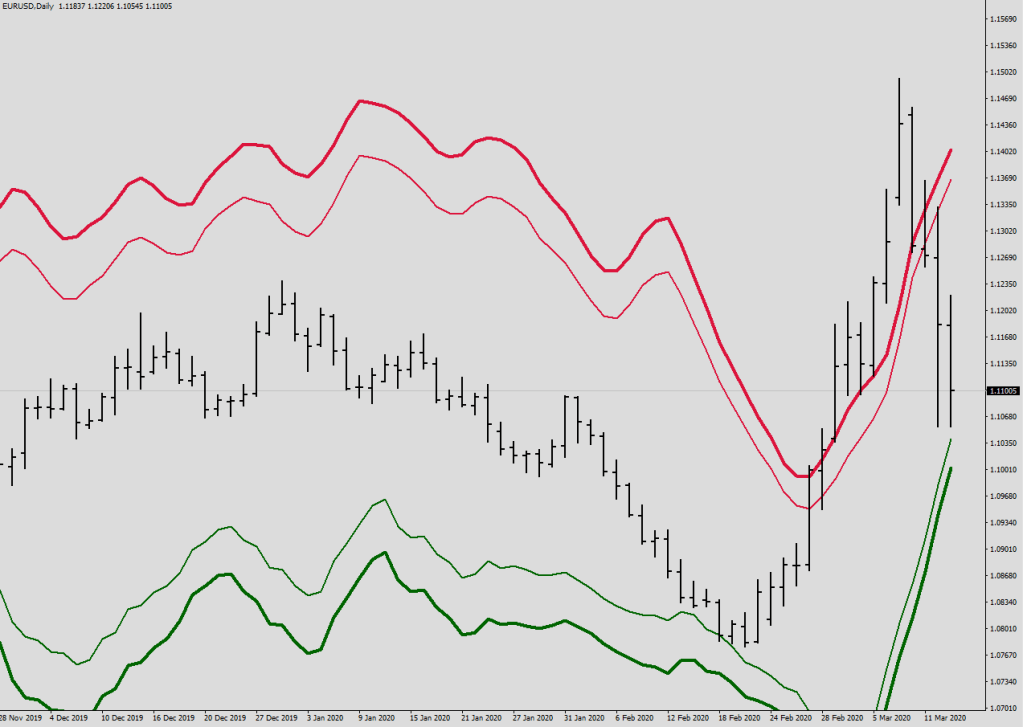
While in a regular market the breaks are operating well (see previous blog entry), mean reversions are a common place; the play accordingly is a return to market neutral, thus stretches can be defied and the hedging direction points outwards, away from the mean. This market has a fair price in mind, and shall make its way back to equilibrium.

E16, MMs can kick into the ball at half field leisurely to extend the duration of total craze.

After the paradigm / polarity shift, the Market Makers work on stretching the Market away from its means as far as possible: suddenly the trading direction becomes away from the MMs, and the hedging direction would be against a move back to the MM zone. Overall this is the fight against the normal, the neutral, the balanced, and the objective seems to be not letting the Market settle. If it seems idle, that’s the calm before the storm. Volatility becomes virtually uncapped. The only thing to stop the bear-train is running out of steam. This is when they allow the Market to fall back to reload – and occasionally change direction.

Check Point 2 is your best bet. Cover below and re-initiate 20 pips later.

A regular bear market goes on for about 6 months, so this thing is going to be here to stay for a more months, i.e. September.

I know you are curious of the wave structure…

When a Bear Loves a Market

What makes a bear market a bear market? Price dropping 25%? Utter rubbish!

What if the whole correction was 25%? You are allowed to start shorting the bottom? What about what went down while price made these numbers?

What do you need to survive in a bear market?

  1. Acknowledge the change
  2. Learn new risk management

1.

A bear market is when the market is able to separate from its own shadow: the usual safety mechanisms do not work, and the direction can be to the up side as well as the down side.

Volatility is one thing. It got a bump up by 30% since the BRExit.

Now, the daily expectation on average is 105 pips versus the 80 prior.

This does not however explain the breach of the energy bands and the occasional 300 pip days.

The telltale of the market change is when unusual stretches appearing repeatedly.

The shadow of the market is the E32 on the hourly (orange).

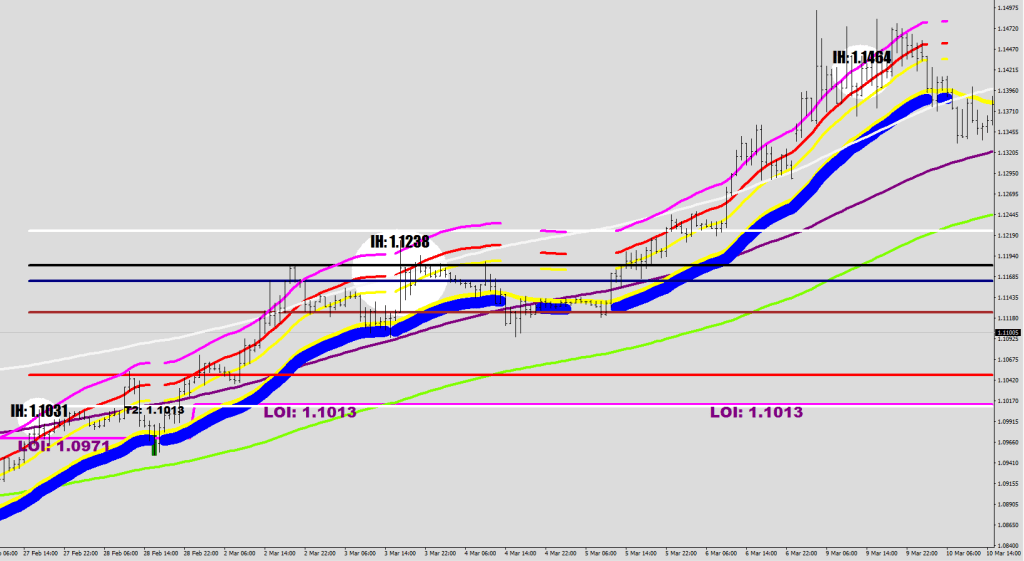
The white circles are highlights of the areas threatening with separating from the shadow.

What comes after this is a one way freight train. This is what the bear market makes possible.

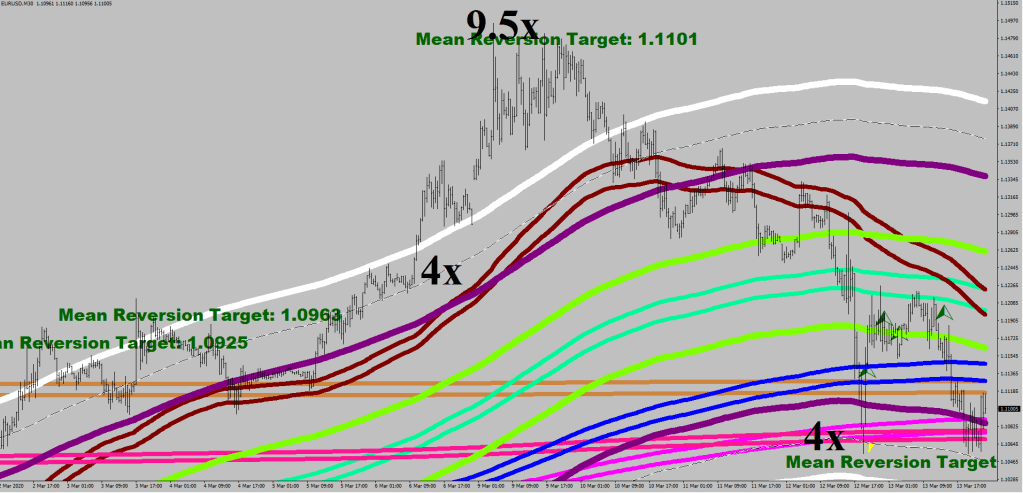
The stretch from the mean itself in a regular market does not exceed a 4x fluctuation maximum multiplier.

On the upside this stretch recently reached a whooping 9.5!

The perforation line was added to better gauge a 4x stretch.

Mean reversion was inevitable, but the market only obeyed after the wave structure was finished to the upside. The 60-pips gap up kicked off the wave 3 of Wave 5 (think wave 3 upon seeing a large gap) only to embrace for another 150 pips rip to the upside during a normally quiet Asian session, when EUR and USD are not heavily traded.

There were these two large gaps that are visible on the 4H chart still.

2.

Risk management.

You need to start learning new terms, such as personal maximum unhedged risk.

You now know, that 100, even 300-pip range days are possible currently. If you snooze, you can very easily loose everything.

You must have enough cushion to withstand 100 pips as a surprise in general,
so for instance based on the equity and the leverage, you figure that you could afford a maximum draw down of $100 per ten 10 pips, that means you must have an additional $1000 cushion available to cover margin, and you better become a proactive hedger.

You would have to monitor for drops greater than 20% below your maximum unhedged risk in your equity margin. A ratio hedger is needed, yes, but I would also recommend to learn the roll out system.

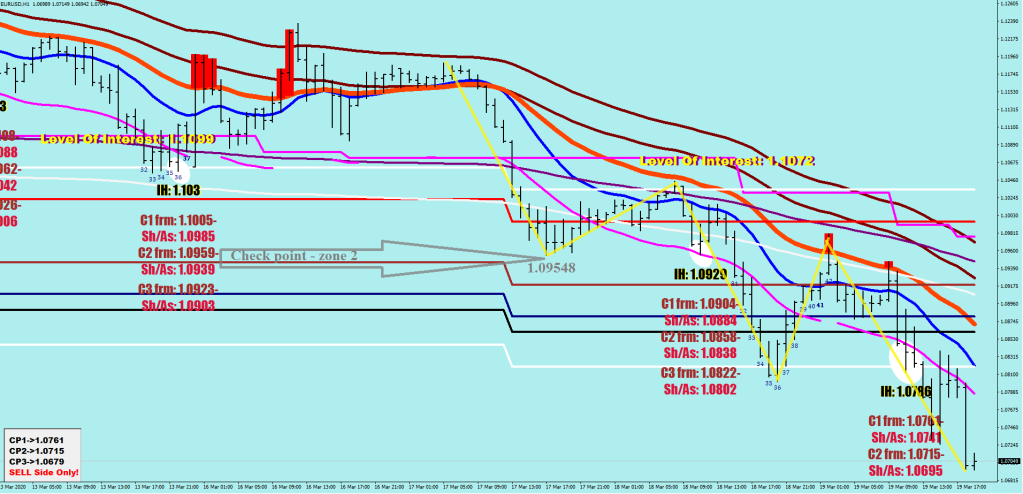
The roll-out system would come with IH (Indefinite Hedge) levels based on the separation of the market from its own shadow: to catch the freight train.

You must take on a hedge at these IH levels and then monitor for the activity around the Check Point levels. In general, you want to see the market surpass a check point and then come back through it: just trail you stop and monitor for changes every hour, and once the trail was hit, place a roll-out hedge for more atrocities 20 pips beyond your disconnection.
More cash flow and more margin can always help.

I have made these routines, yes. Did you want to ask something?

The bear works in both directions, in fact the bear does not even care which way is down.

The bear cares about 1 thing only. Causing maximum amount of damage.

Tips & Tricks – Mean Rev.

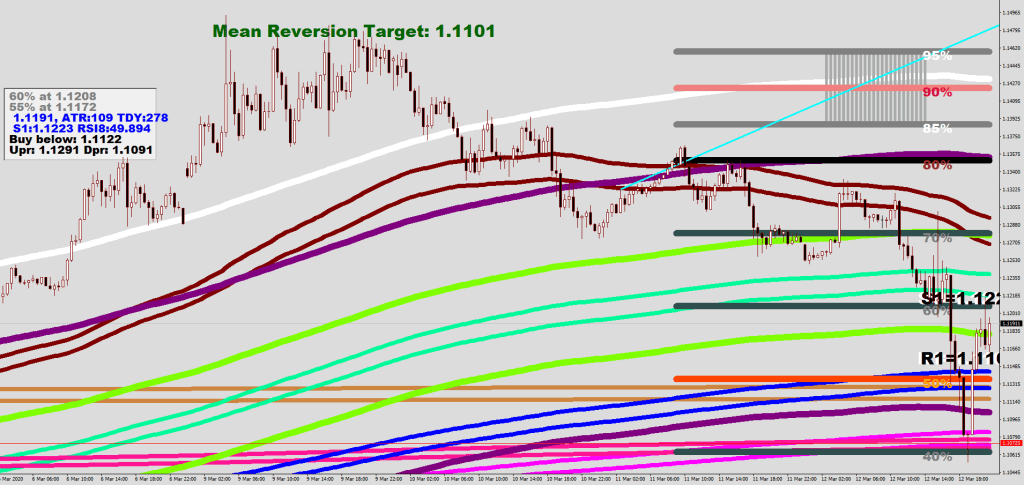
Mean Reversion Target – 30 Min (2-3 days typically)

iHi4[i]=iMA(NULL,0,414,0,MODE_EMA, PRICE_HIGH,i);
iLo4[i]=iMA(NULL,0,414,0,MODE_EMA, PRICE_LOW,i);

deletetxt1("Froese");

for (i = lookback ; i >= 0; i--) {
if (iHigh(symbol,0,i+30)==iHigh(symbol,0,iHighest(symbol,0,MODE_HIGH,230,i))) {
             ObjectCreate("Froese"+i,OBJ_TEXT, 0, Time[i], High[i+30]-40*Point);
             ObjectSetText("Froese"+i, "Mean Reversion Target: "+DoubleToString(NormalizeDouble(iLo4[i+30],4),4), 23, "Arial Black", clrDarkGreen);
             
         }

if (iLow(symbol,0,i+30)==iLow(symbol,0,iLowest(symbol,0,MODE_LOW,230,i))) {
             ObjectCreate("Froese"+i,OBJ_TEXT, 0, Time[i], Low[i+30]+40*Point);
             ObjectSetText("Froese"+i, "Mean Reversion Target: "+DoubleToString(NormalizeDouble(iHi4[i+30],4),4), 23, "Arial Black", clrDarkGreen);
             
         }  
}
   void deletetxt1(string text){
   for(int iObj=ObjectsTotal()-1; iObj >= 0; iObj--){
      string   on = ObjectName(iObj);
      if(StringFind(on, text) == 0)  ObjectDelete(on);
}  }