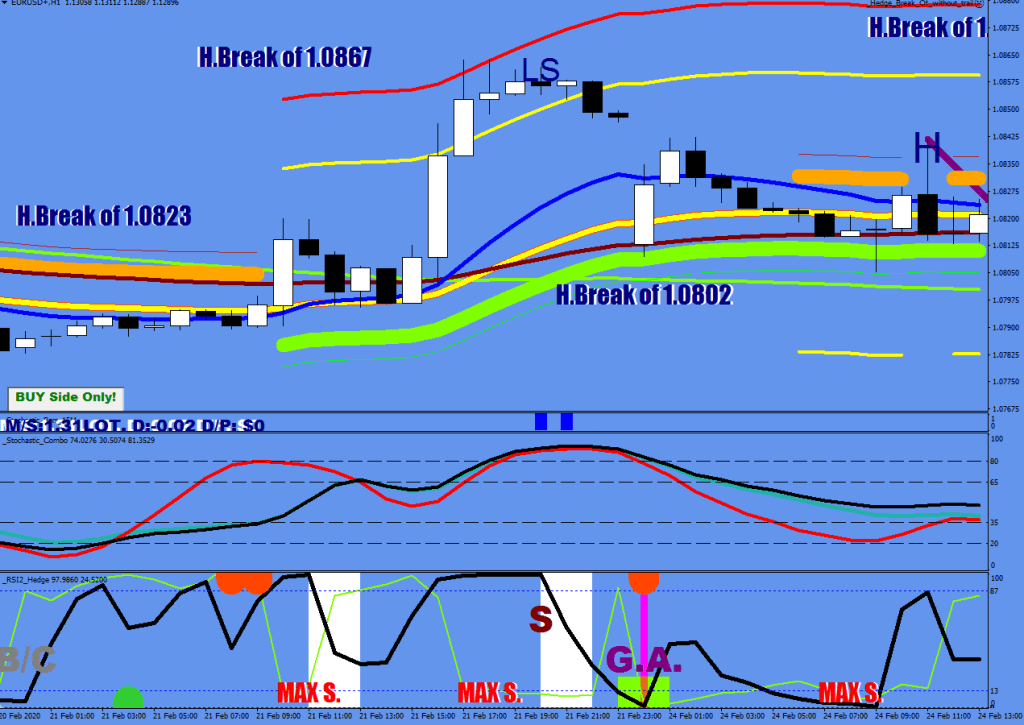
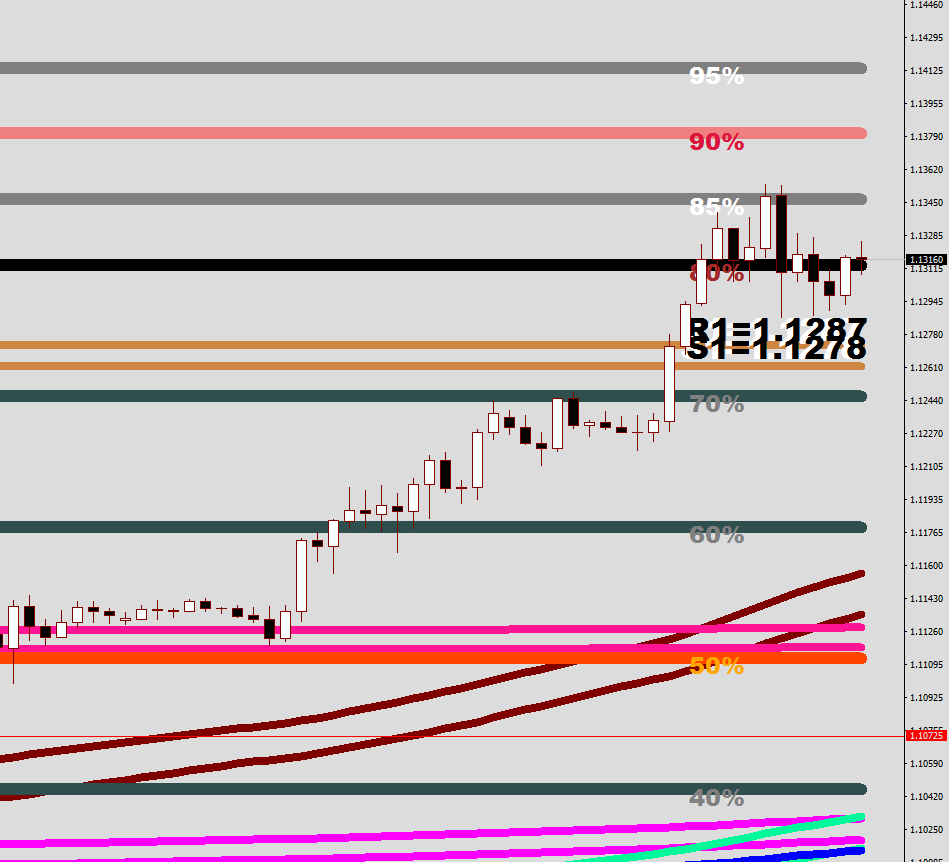
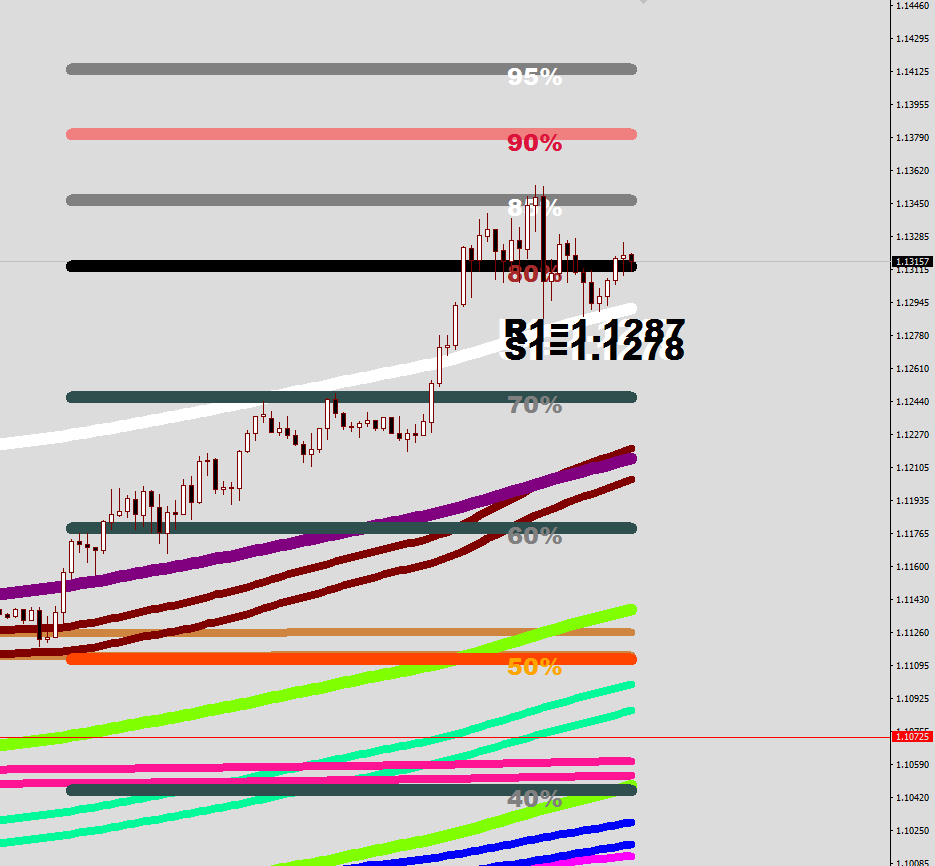
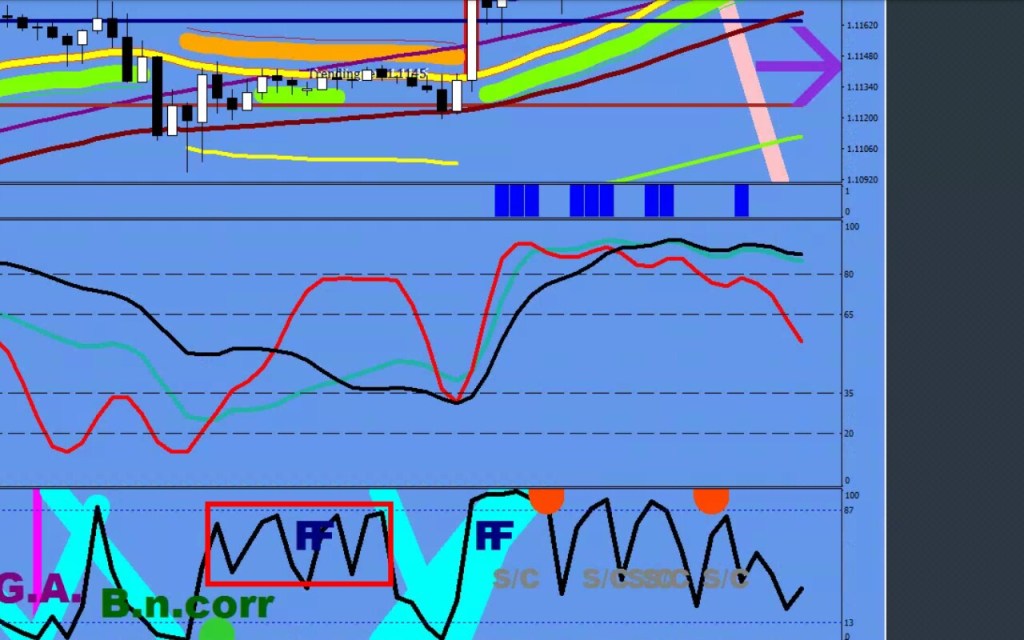
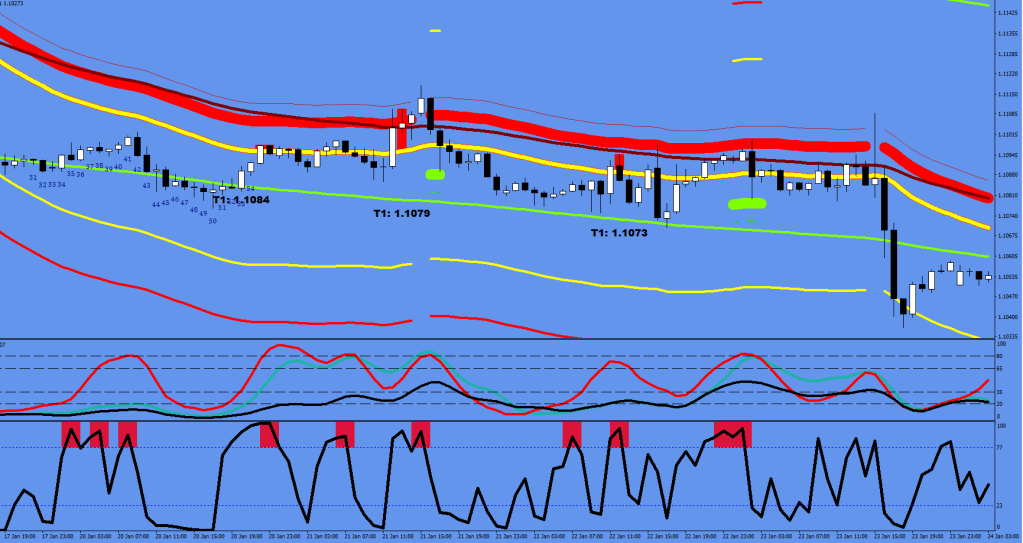
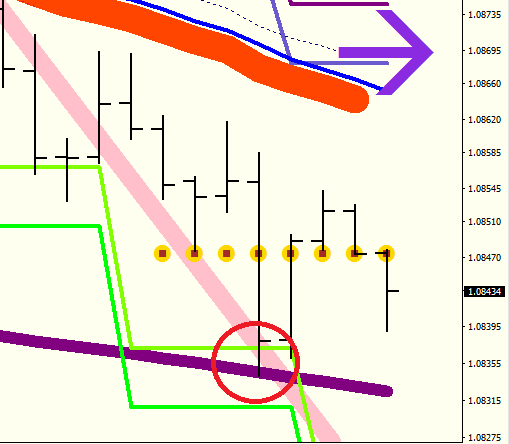
Once the market leaves the overbought / oversold field, it would target the Median (50%) first, then it may proceed to the other extreme to tackle the order-dense field.
Clearly, the market consolidated above the Median (50%+)
I call the 85-95% zone the upper, the 5%-15% the lower reversal zone.
Above 95% the odds are a new high, below 85% a reversal may have transpired.
Where would price be at close today?
most likely rather close to the overbought neckline, saying: on the fence just keep guessing, people!
In no man’s land I’m no man’s friend.
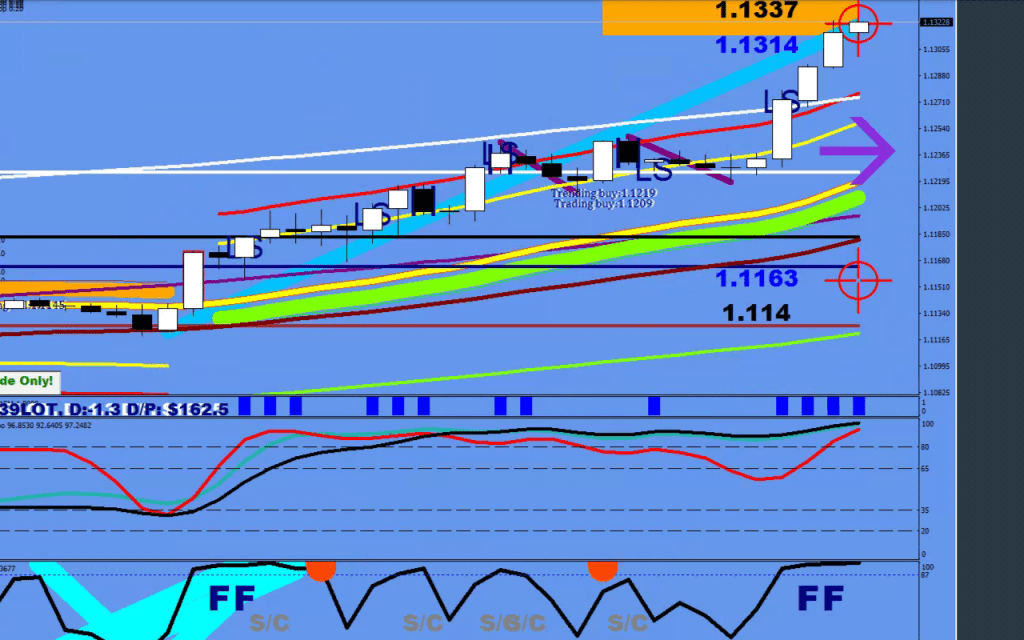
Until price is staying above the 1.1287 ex-resistance, more upside is possible. If it falls, this was a top. Where would you expect price to proceed to from here, having read the answer above?
Embedding is 3 consecutive daily closes in the overbought / oversold field.
Saving is when one day closes outside, but they put it back inside on the next.
You need a market model to gauge market events, direction and strength.
LEMA 30 comes with 2×3 displacement lines of the mean.
1x Stretch is the Guard Rail
3x Stretch is Purple Haze
5x Stretch is the Icing
The market constantly provides you with information regarding for instance the health / stage of the rally.
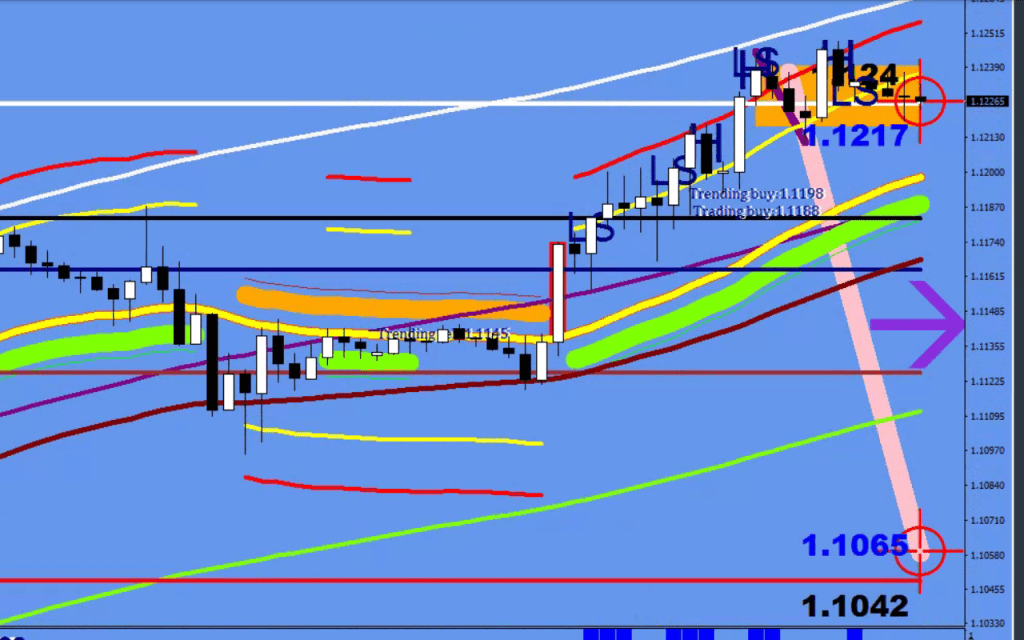
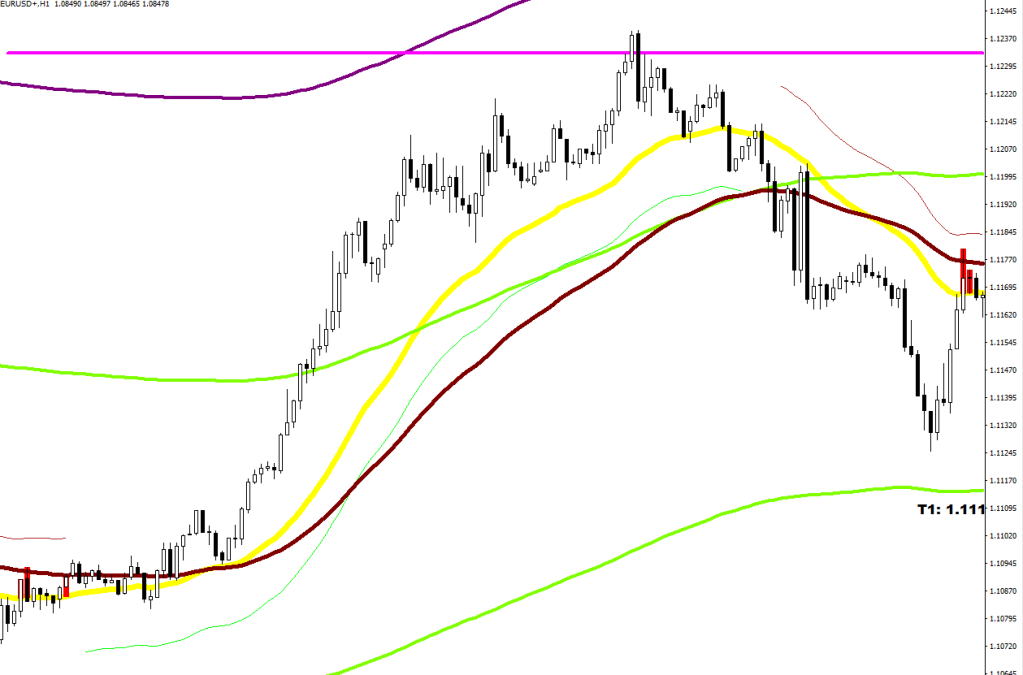
For instance, yesterday’s events were a failure at the Icing, a dip below Purple Haze, a consolidation above Mr. Maroon, a break back above Purple Haze, which resulted in a new leg up, attacking the other side of the purple-white channel.
The current failure to reach the top of the channel talks of waning momentum, and if we just saw the trigger high, the likelihood would be a mean reversion to where the Green River was at that given moment.
There is a bit more to say about the preceeding consolidation, that came out of the Wave 4’s ABC correction (3 Full lambda legs).
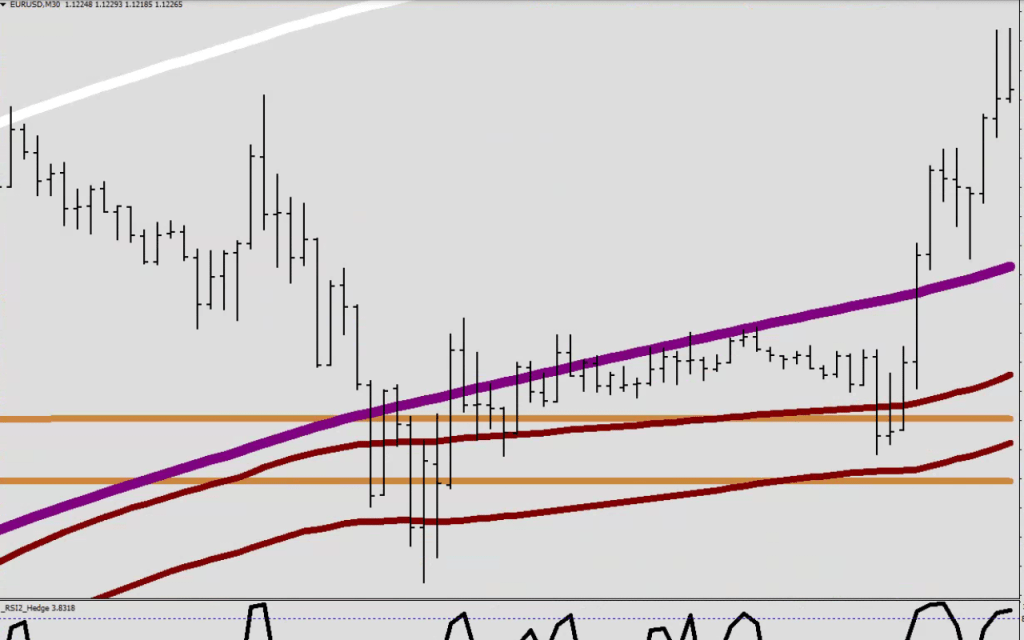
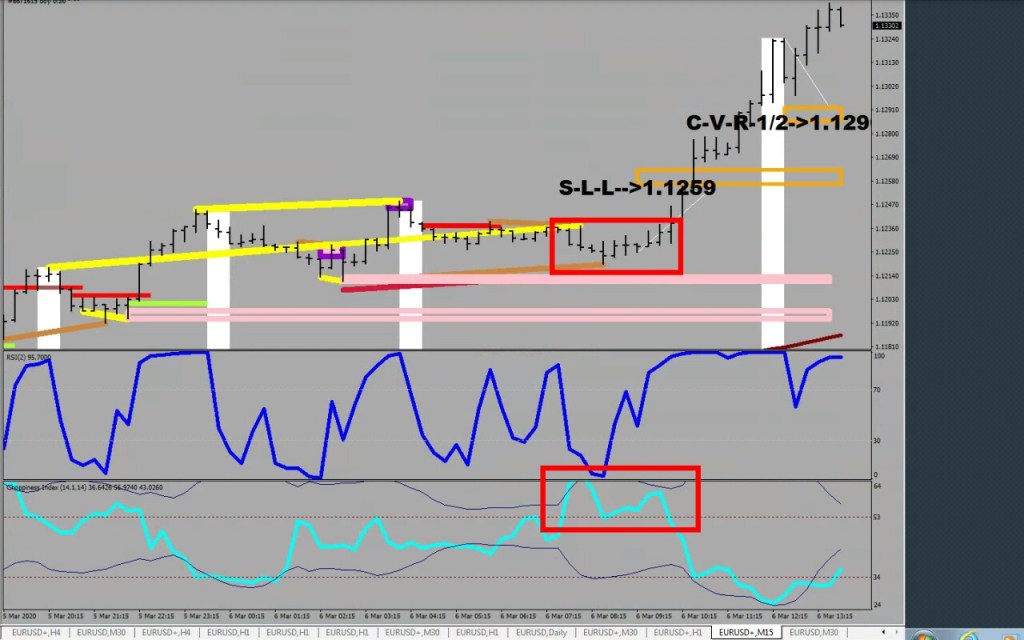
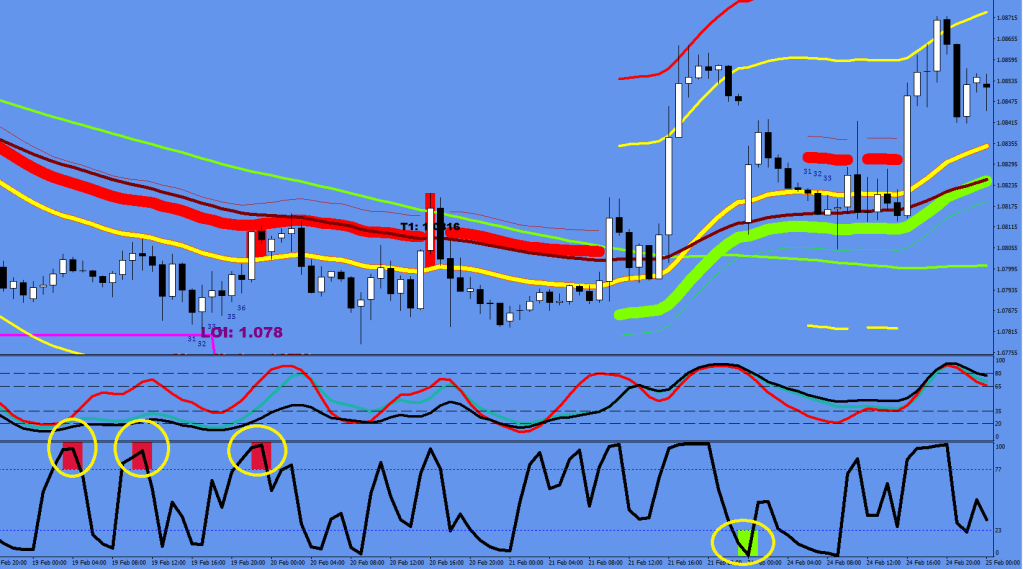
Concentrate on the squashed RSI2 zigzags below. They don’t quite get to the top, and overall are situated in the upper half. This normally preps a top, and the beat would be a sell. Not this time, refer to the wave count.
V break was bent over backwards.
What tells you about the rally being at its final stage is the lack of conventional entry points. Other than this “break away”, there were no opportunities at E32 to get in on a shallow pull back. There was an extra deep pullback, the end of the ABC that was the best spot, and it worked that time. I don’t think the next extra deep pullback would do the same.
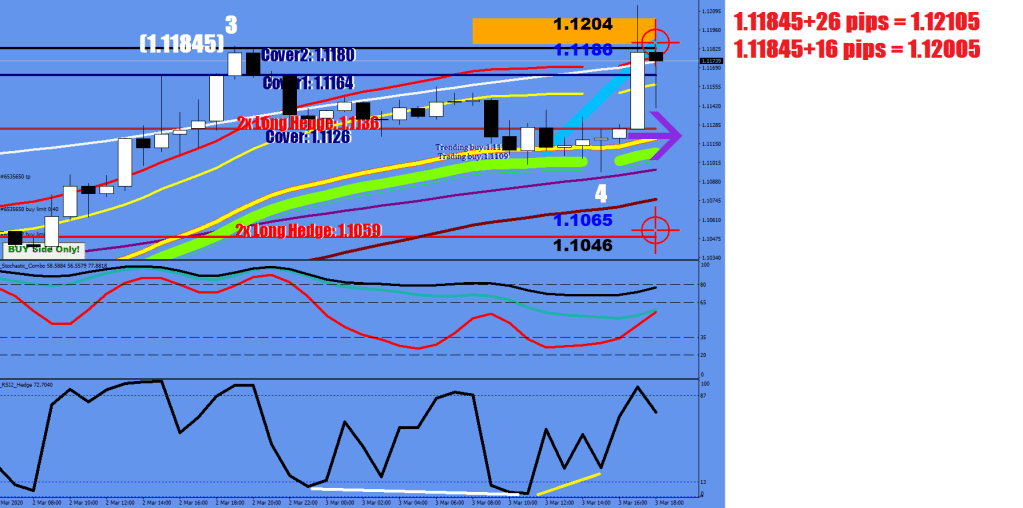
In closing consider the 16/26/36 beat calculation between the end of Wave 3 and the likely end of Wave 5.
1.12129+36 pips = 1.12489
…what do you know, price got consolidated & the game was on again…
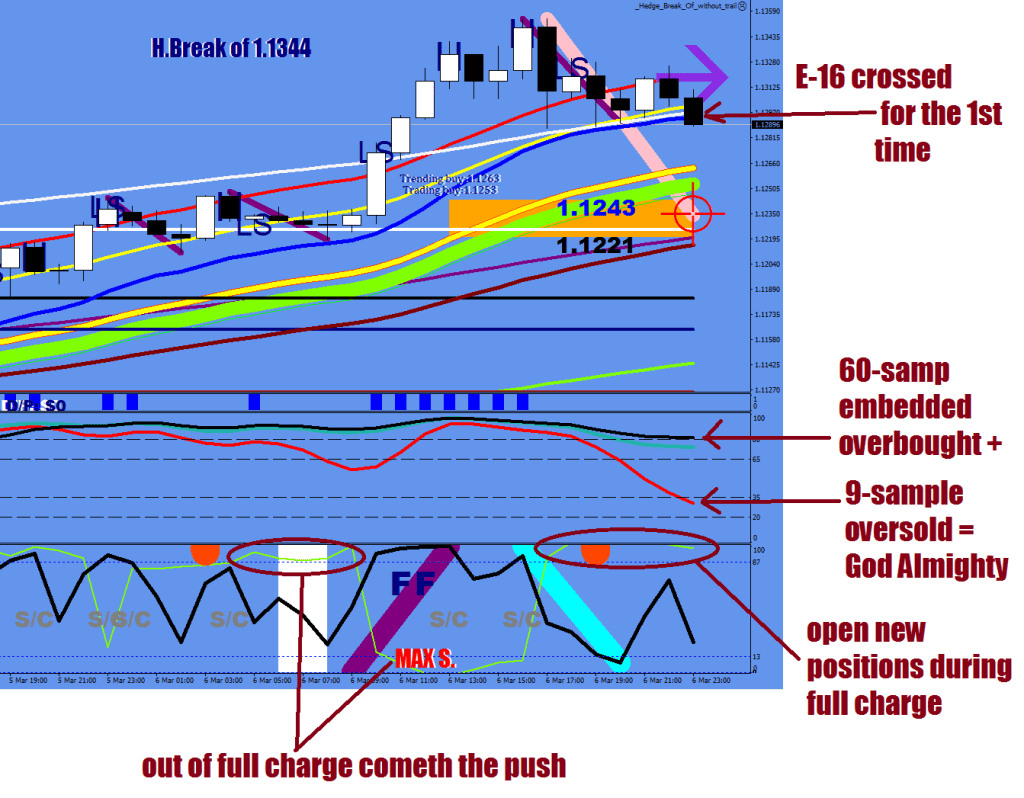
In this valley the price reached full charge
plus there was a continuation divergence visible even from the 1H
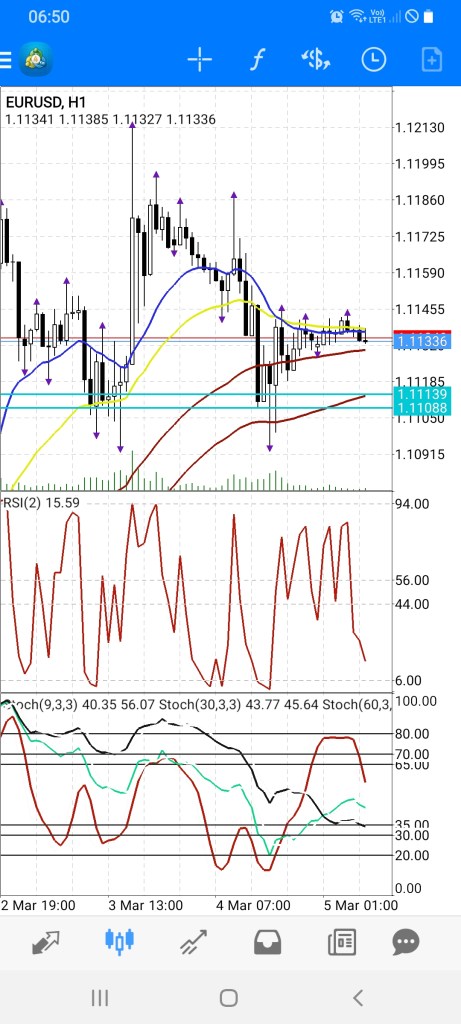
When news comes out and the broker’s server gets overwhelmed causing your MT4 desktop to hang for hours, you better know what is happening and have means to interact.
Therefore you should download an MT4 mobile version.
You would need a usable size screen as well as good coverage.
A Samusung A70 may be excellent screen wise, but has issues connecting to a wireless network versus my A20 work phone. I have 2 different providers as well. 20 gig data, but I never even use 5 – only need the 4G when commuting.
What to plot on the phone?
MOVING AVERAGES
I have E32 in a dark yellow shade on the closes.
E16 in blue on Median Price.
E67 in Maroon on the Highs
E67 in Maroon on the Lows
E414 in olive green on the Highs
E414 in olive green on the Lows
E828 in blue on the Highs
E828 in blue on the Lows
E1556 in magenta on the Highs
E1556 in magenta on the Lows
E207 in lime on the Highs
E207 in lime on the Lows
Add Fractals perhaps
INDICATOR Window 1
RSI2 on Median Price
INDICATOR Window 2
STOCHASTIC simple 9,3,3 on low/high, main in background colour, signal in red
STOCHASTIC simple 30,3,3 on low/high, main in background colour, signal in green
STOCHASTIC simple 60,3,3 on low/high, main in background colour, signal in black
since allrelativ moving avearges are relative to the time frame, you should not be switching off between the time frames
Camp out on 1H, and visit 15 on occasions to see get the push count right on the RSI2.
For the desktop, turn off automatic updates and use a more steady operating system, such as Windows 10 Pro.
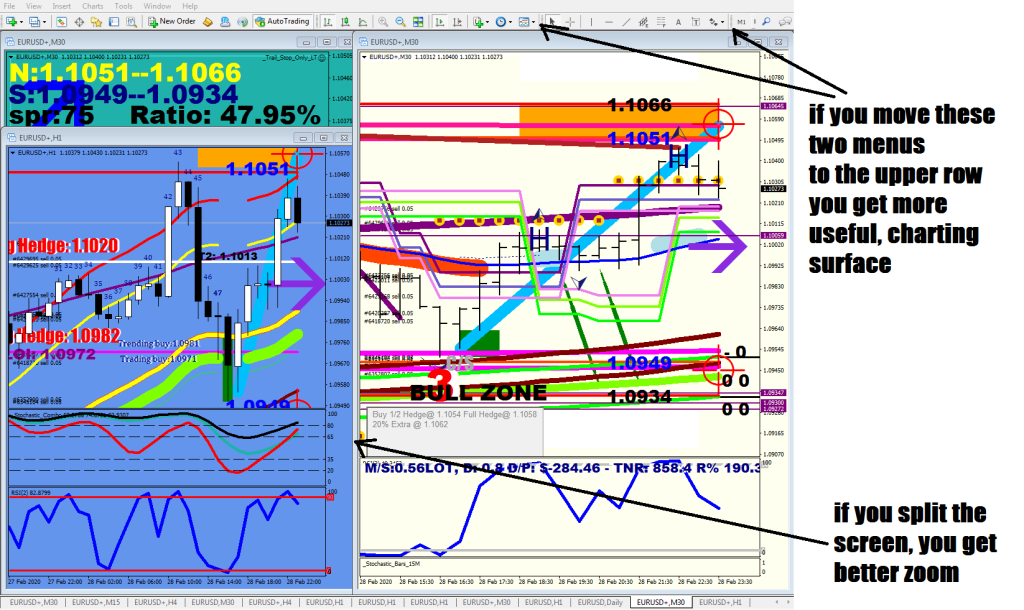
Some suggestions for you. You could open an account with $150 at VantageFx. A True ECN account has 0.2+ pips spread and 0.4 pips commission, so you would have a total of 0.6-0.8 pips on a round trip on EUR. Also, their margin call level is starting at 80%, not 100%, and you can choose your own leverage. They also open earlier and close later than most other brokers. While you are learning, use 1:100. The image shows configuration ideas.
That’s all for now,
The one size fits all is the furthest thing from my thinking. I have traded Natual Gas, Stocks, ETFs, Futures, weekly options and a number of Forex pairs, and I know that they have nothing in common. I try to capitalize on my familiarity with EUR/USD as well as its way below 1 pip cost. I specialize. I don’t care for anybody’s models that I have no understanding of. I invent mine.
Here you can see on one chart what it would eventually lead to if you are trying to hedge apples with oranges. There was a good documentary online, but cant’ find it now.
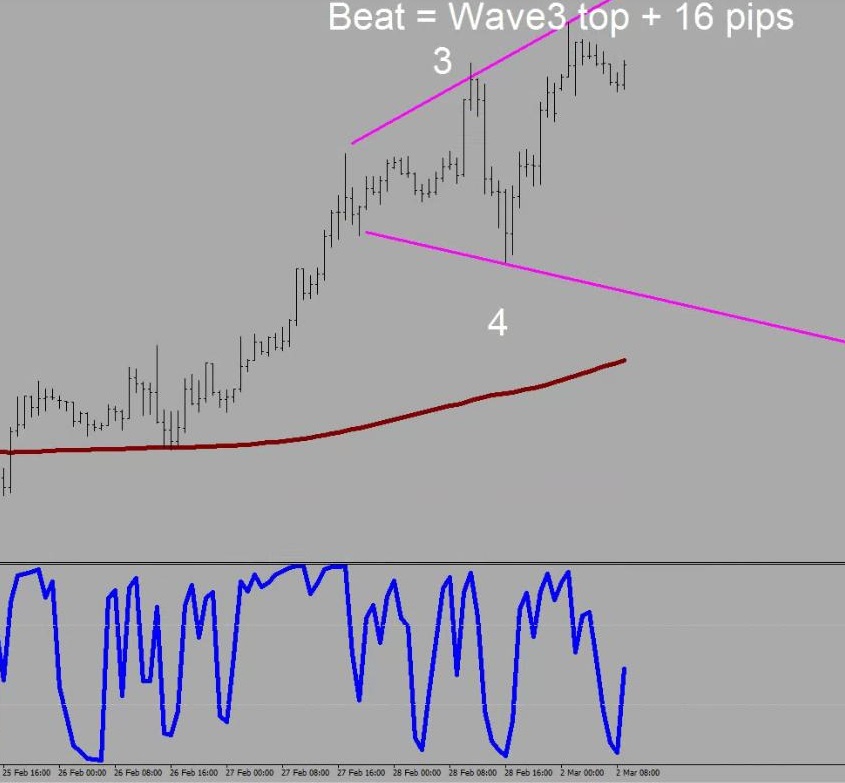
Try to get this concept of Wave 5 making a beat over Wave 3. Price stops progressing at the end of Wave 3. Inertia carries it a bit further on a back test, but the size of the beat rarely exceeds 16 pips or 1/2 fluctuation size. So, when you see a Wave 4 print with the lower low on RSI, you know what is about to happen, and have an approximate expectation of where price is likely to fail moving any further.Picture the 3 above the last swing high and add 16 pips.
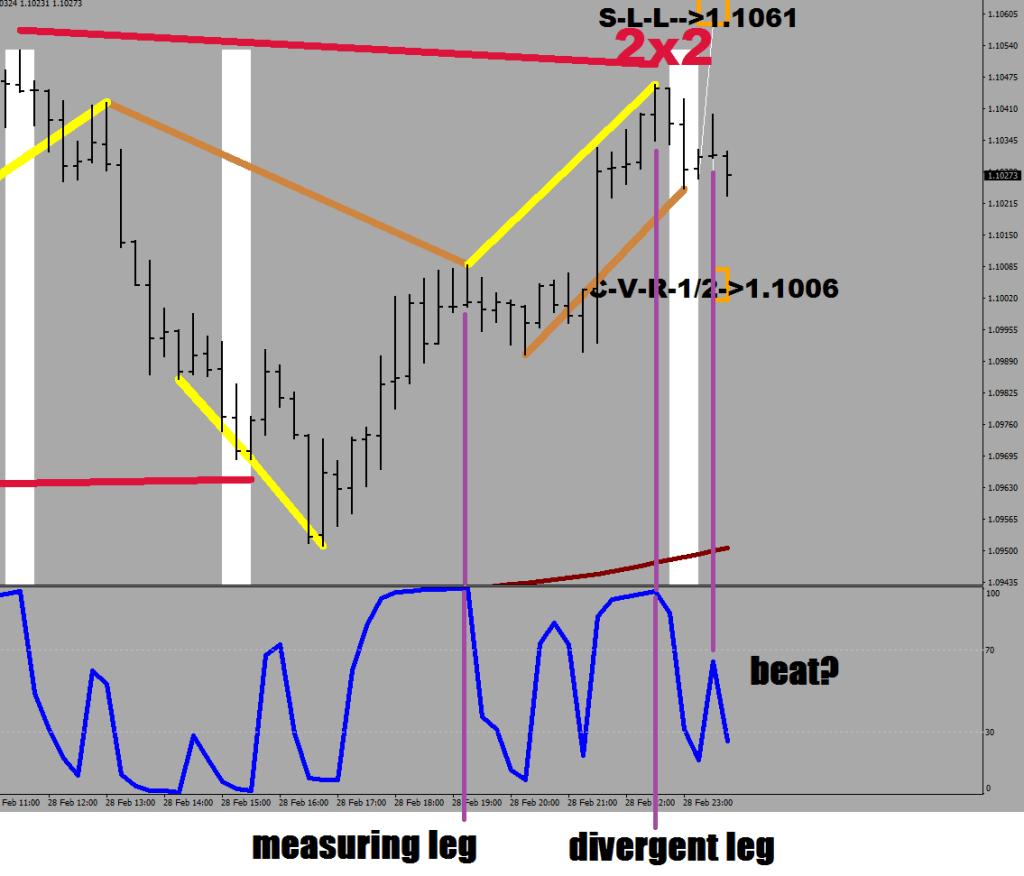
Look at your 15 minute chart and identify the measuring leg, the divergent leg and the beat that make up wave 5.
Also check the exhaustion print on the daily CI with 7,1,7 settings. Exhaustion + beat = turn
Remember what I said when you have a wave 3 and wave 4 printed, how to estimate the target? There are 16, 26, and 36-pips beats. 16, is the most common, 26 is the second.
Remember the date when I answered the question you did not know you had.
How I did it was trading the question:
(What’s the answer to) “The Life, The Universe and Everything” and simplified to “Trading”.
It took Deep Mind a decade to come up with the answer.
Would had gone faster if only I had more rest.
So, the answer to trading is that it does not start with levels or percentages.
It starts with hedging. Once you have hedging figured out, you have everything figured out (this one took me 3 years).
There are 3 kinds of hedges
Roll out hedge
Proactive hedge
Reactive hedge
#1
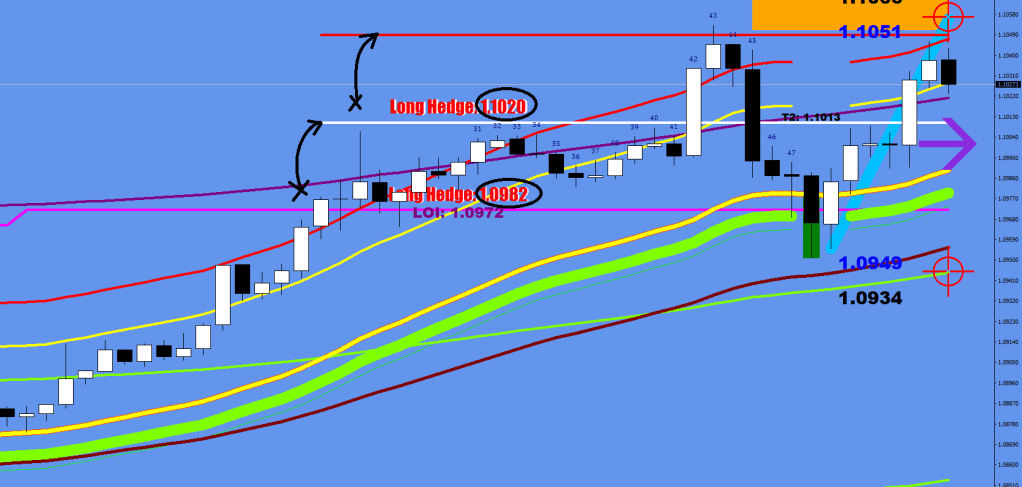
Refer back to my “A Working Market Model” article to understand the basis of the roll out hedge, which I called the Level Of Interest. The idea is to have a field of moratorium beyond the level, which is either the LOI or its shift by n times Fluctuation Maximum, where the hedge would get initiated. To make up for lost ground, the hedge’s size would be rather large – I would suggest 2x the holding size. The Exit level is a hit or getting very close to the next extension-limit level. Rinse and repeat: place the pending roll out before closing down the current hedge. This kind of hedging requires knowing the instrument’s fluctuation size.
#2
Proactive hedging happens with the consideration of the Hourly music (refer to the market model again) and a print of an RSI extreme in the wrong direction. Proactive hedging calls should be held back based upon failing the LOI. Hourly RSI2 hook-back could be utilized for the purpose. Size suggestion: 150% of the net holdings in the wrong direction and exits are the ones mentioned under #1 as well as the trending exits (thin red lines).
I would suggest using a trail stop at Mr. Maroon after a 5+ pip hourly print separation from it.
#3
Reactive hedge is a reaction to margin percent dropping to low. Refer to my Ratio-hedging related articles on the subject.
Over leveraging / miscalculation should bring on this Equal size hedge.
Once the apples are balanced out with the anti apples, after a deep breath you can start trading in the right direction with the right entries and exits like the whole burden did not even exist, just don’t forget to remove those positions’ targets and stops and make them exempt from auto cropping / trailing etc.
You must leave this entanglement on until you encounter an LOI, where you can take off one side – just don’t forget to put out the pending roll out hedge first (with its suggested size).
So, EUR/USD is trending. The price of the Euro is being adjusted down.
This is one of the rare occasions, when the Energy Bands get exceeded.
What works?
1. The understanding of where is the mean
2. The understanding, that the channels are parallel with the mean.
3. That there is a 1x and a 3x stretch condition from the mean that are of high importance.
The mean is the High and the Low of the 207 EMA on the 1H. Plotted below nowhere, but both the guard rails in green and the purple brains haze lines are measured from it.
Your directional entry is always the same: the other side of the Yellow E32 lone with an RSI 2 read fizzling out.
The music is a 60 period stochastic signal line with 3 slowing. That produces the thin lines with 1/2 fluctuation distance away from E32 (kind of a warning – stop loss nearby – things are about to change) trend following lines.
As for the exits, which may end up becoming the very level the market turns at, they are derived from the location of the channel lines at the time of the invocation. Some hold out helps at times. I already added a 8-sample delay to get a visual reference.
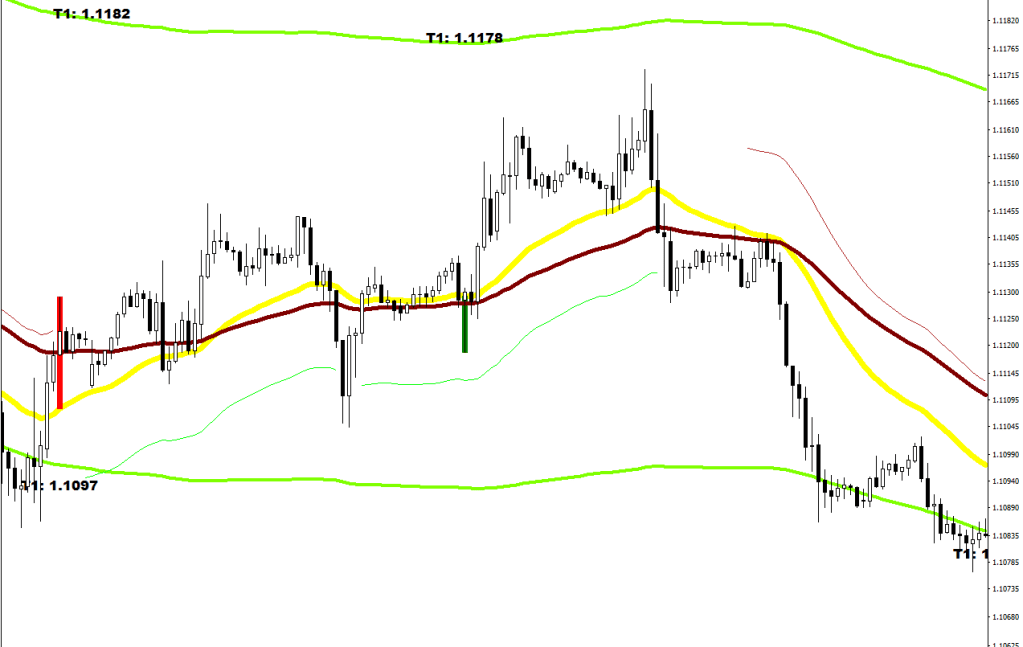
Look how the encounter with the upper guard rail printed the lower high.This high did not even make it to the guard. The music changed when a consolidation was carried out below Mr. Maroon (in Maroon – E67).
The first channeling move down ended after a period of no entry calls by price not being able to surpass E32, and the last purple projection was the level of interest. The next lower high was the touch of the upper guard rail. The area was at hand from the green invocation boxes and the corresponding T1 prints.
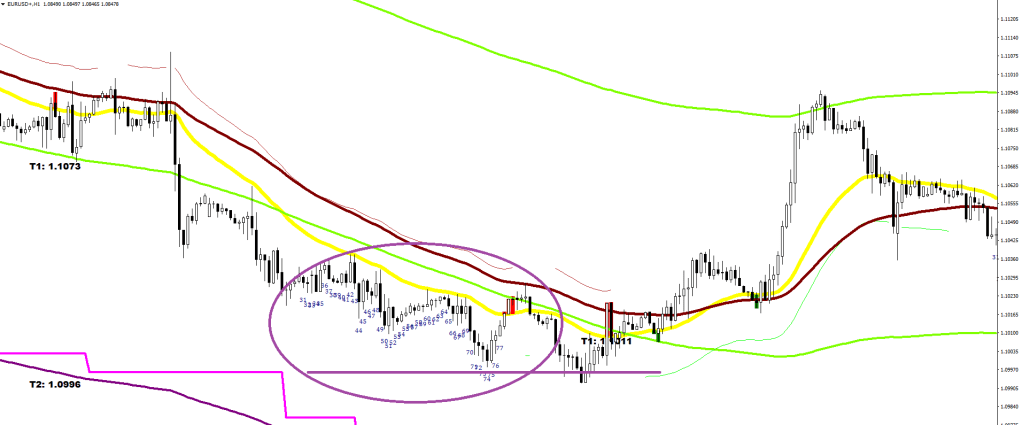
The second channeling down is the prolonged down move between the green and the purple. Load above E32, unload below the encounter with a T2. Rinse and repeat. When the magenta line got exceeded – that was the end of a Wave 3 to the downside: price went too far.
Not that Wave 4 was a major move back up, it was more of a flat, time waste for a re-consolidation before the last move down. Wave 5 also had a separation section where price could not get back above E-32, and the level of interest was again the last invocation prior to this.
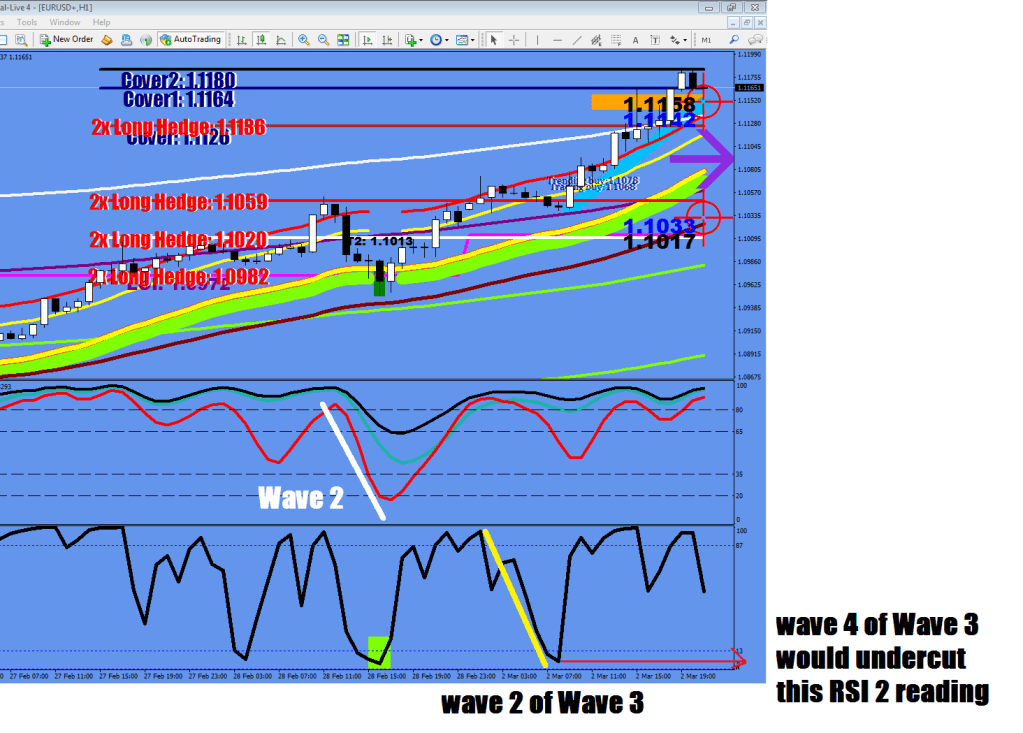
Wave 1 up was exceeding Mr. Maroon and Wave 2 pulled back did not result in a lower low – your subtle changes. Wave 1 of Wave 3 up exceeded Mr. Maroon again, and wave 2 of Wave 3 pulled back just beyond E32 for the perfect wave 3 of Wave 3 long entry.
The first touch of Mr. Maroon was a sign of strength to which the response was dumping shorts resulting in a lower low.
Now, you have seen a mean reversion and a wave 4 of Wave 3 was printing into the close.
Since I used Histograms for the shadings, I had to make an indicator pair.
Where to Buy and Where to Sell are available if you would care donate something for them. Name your price to
macdulio at yahoo.com
They are not for every instrument under the sky, but were made with the knowledge and understanding of EUR/USD fluctuation distances. I tend to throw in some perks as well.
…
New function added: The Below Counter (to understand which line to extend and the overall wave structure)
& above counter as well to keep things symmetrical
When Elon says, it would be a good idea to hire those with exceptional achievements, he must not mean musicians and creative artists, for they are not going to contribute much to self driving; we have to be specific if we want progress.
Now that we found data, what are we gonna do with it?
One problem is that human thinking never really left the kindergarten level of “this is like that”. I know, because I never went to kindergarten.AI would have to implement all human limitations, the superstitions, the urban legends, the beliefs, religious paradoxes, for this is what we are, these are things that we co-exist with and live by. We must include not only the stars, but the horoscopes. Wanting to find correlations has its dangers. An example is when a chart of those died of being tangled In bed sheets and the cheese consumption chart seems eerily similar. A coincidence can become extremely damaging when algorithms start enforcing the selling in Corona (the company) based on the attention the word gets in the online media (thanks to a virus outbreak with the same name), for human lives may depend on fiscal losses (reputation, credibility included).
How do you store and restore values? In the future, when a picture shows the Amazon from space, a boat load of descriptions would need to be enclosed, saying that this is the River System in on the South American continent on Planet Earth, in our galaxy, and not a delivery center from Seattle.Who’s an ethical programmer, who’s values are in line with the majority and could be represented in decisions, and who is in the majority at all? Not everything is comparable, yet we want a yes or a no at the end of every question. How do you define “maybe” for an AI in a satisfactory manner? Superposition sounds fancy and futuristic, but can it answer the problem?We have dilemmas like all people are equal, but some are more equal than others. Can you weed out the “eye for an eye” logic? No, I don’t want to bring up the example of the unavoidable car crash where the AI has to de decide between sacrificing your life or five other people in the oncoming vehicle, but the problem is responsibility. It always will be. Playing God, playing Big Brother. I called myself Melon Husk in my latest book, the Computer Aided Trading, so I should ask: who would be teaching humor to AI? It seems there is a need for a philosopher-comedian after all.I.e. “the erection of giant metal phalloses and their ejection / their penetration to space is the Space-seX”. Come on, don’t tell me you did not get this one!