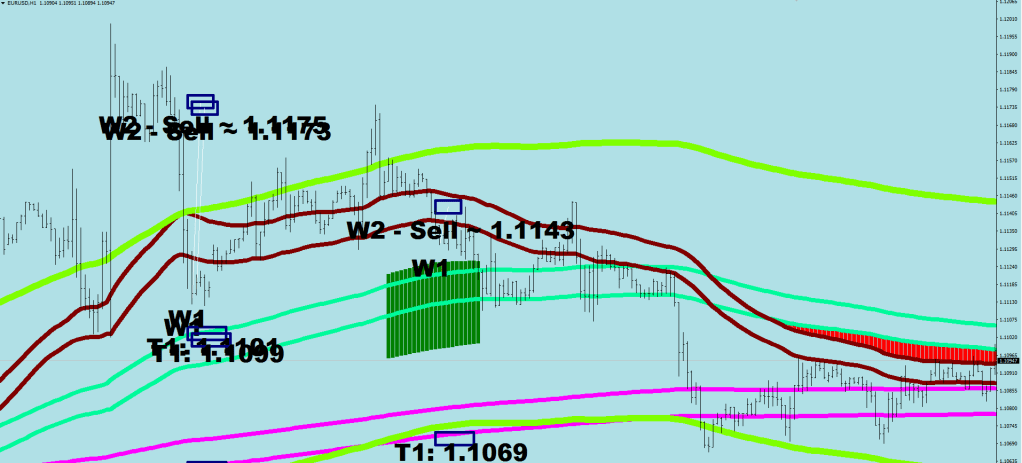
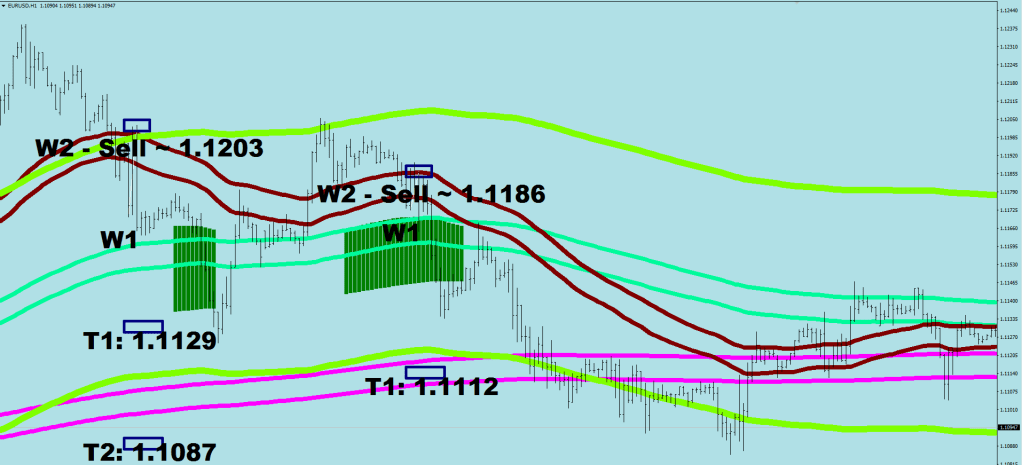
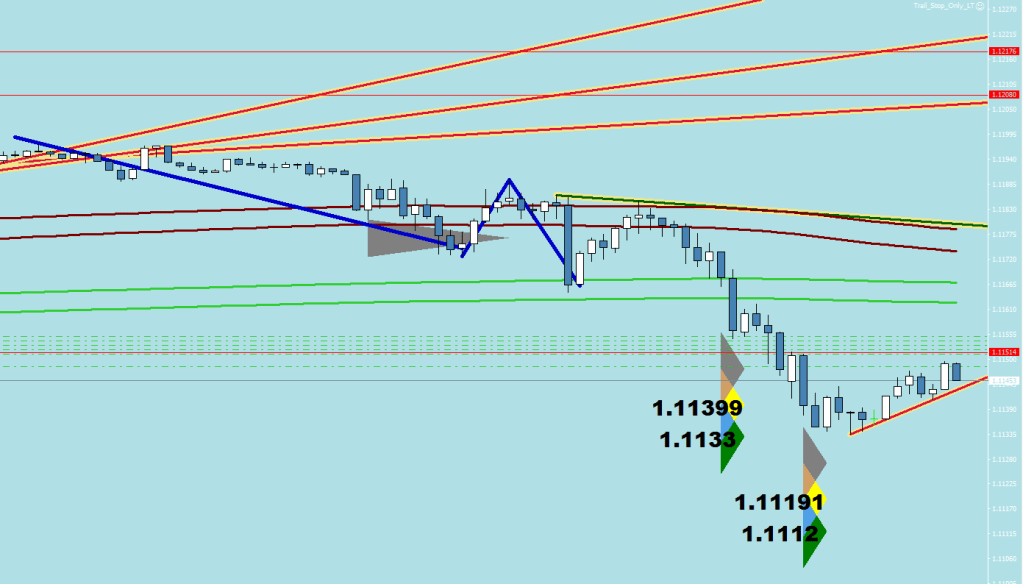
Need I say how important it is to get the wave count right?
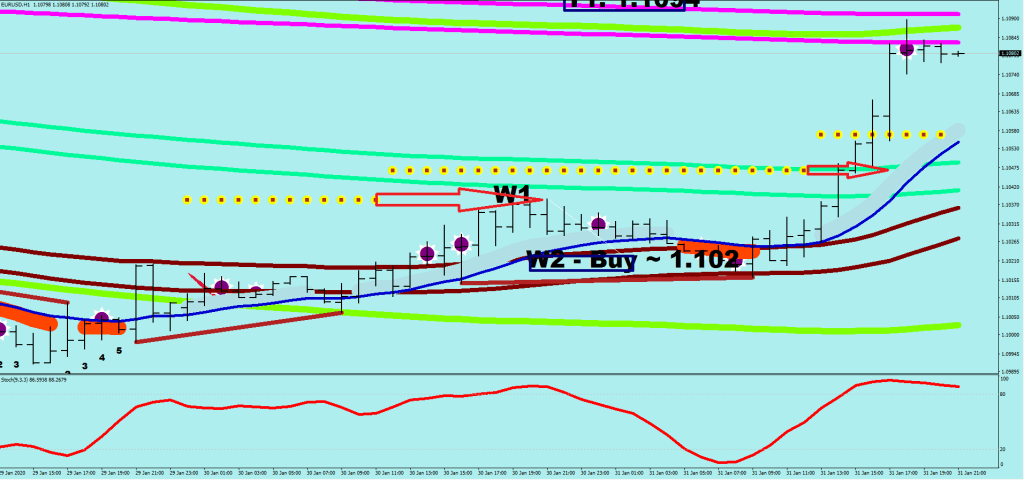
I myself counted this up move as a wave 3 (of Wave 5), but not as a Wave 3.
The difference is that I closed out all of my longs at the mean and called it a day, missing out on 1/2 of my potential gains and making merely 7.5% this week.
The problem is that I am Mr. Wave 2, and I managed to mess up the count while I have already made an algorithm (an indicator, and I never called an indicator an algorithm before, but this one is a beyond eloquent solution) back in July, last year.
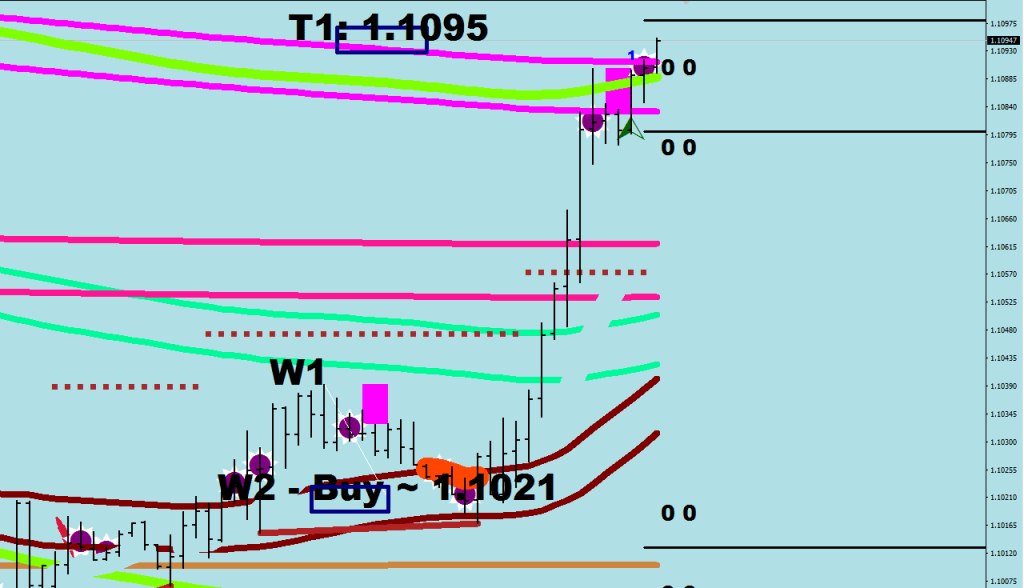
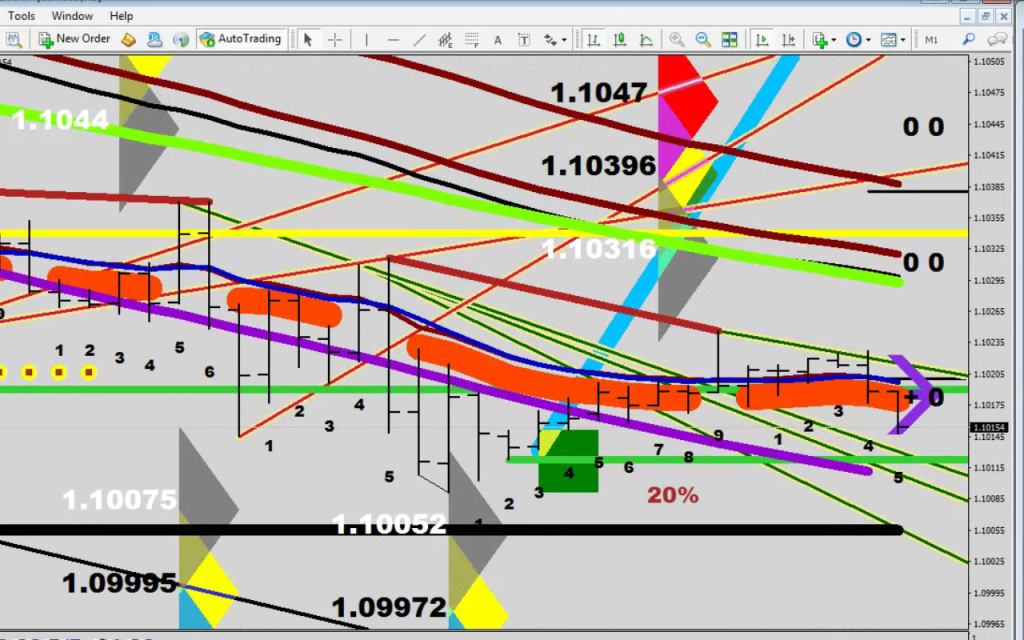
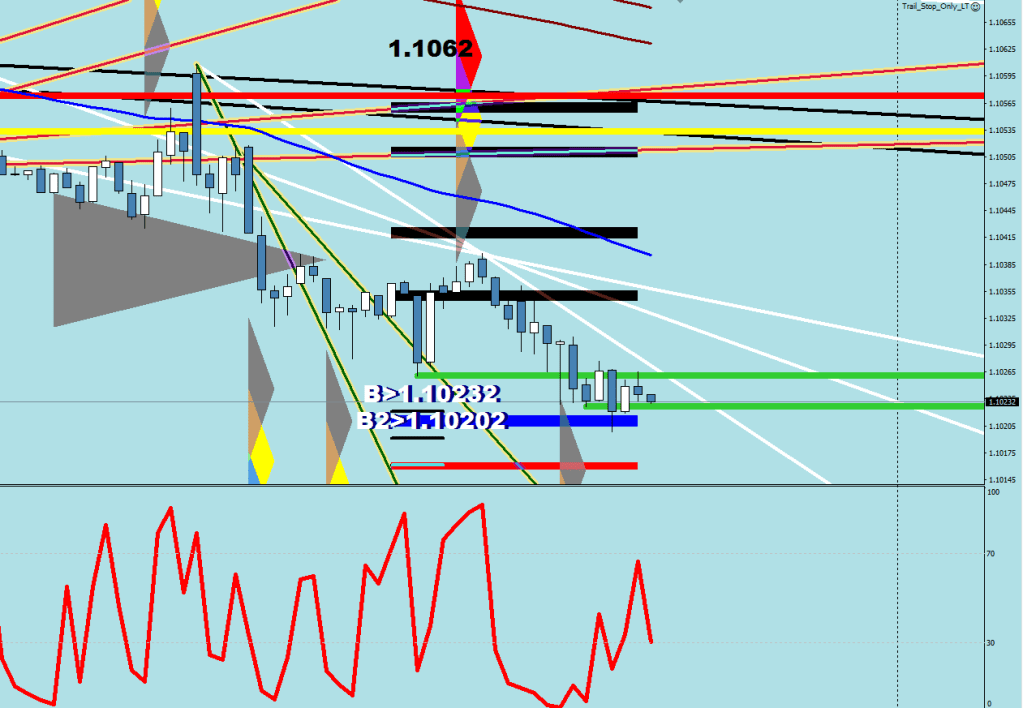
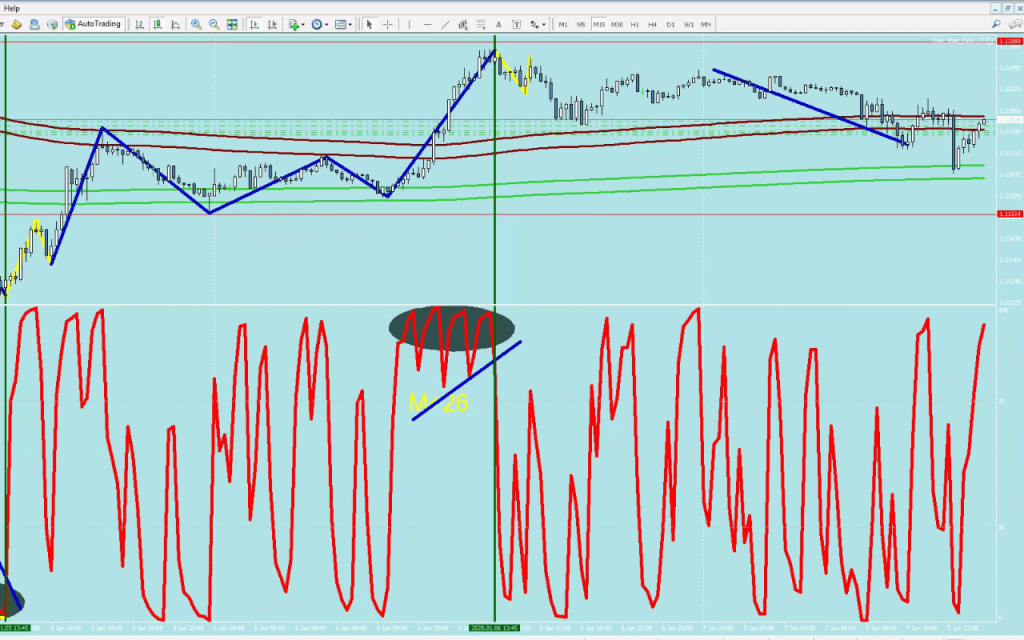
In fact, if I were only paying a bit of attention to one of my charts, I could had spotted this easily:
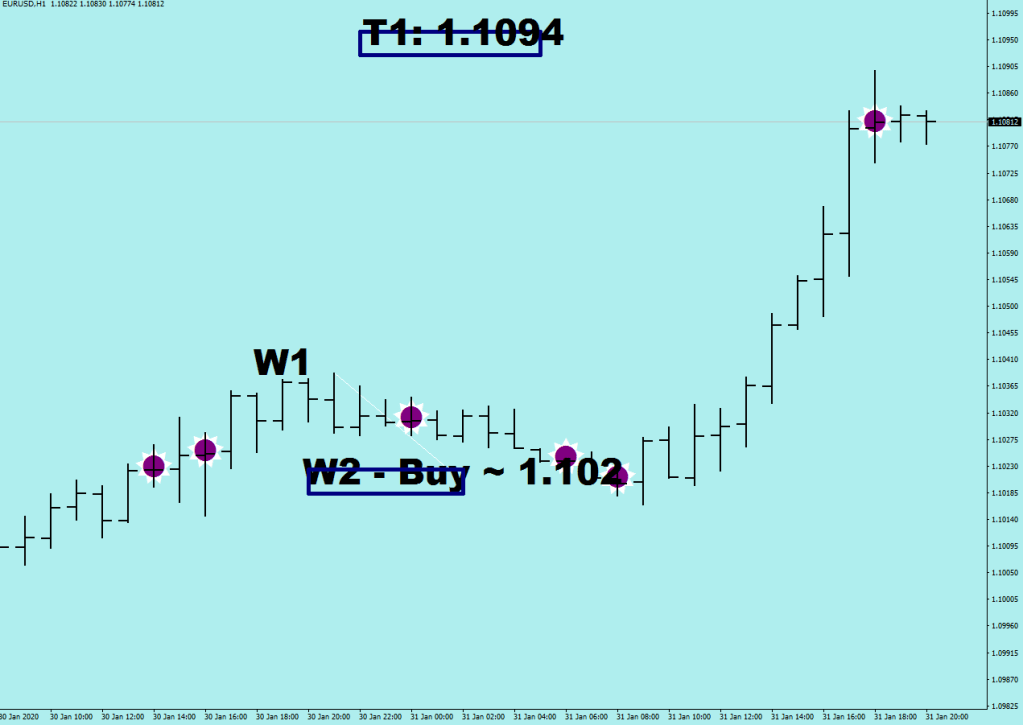
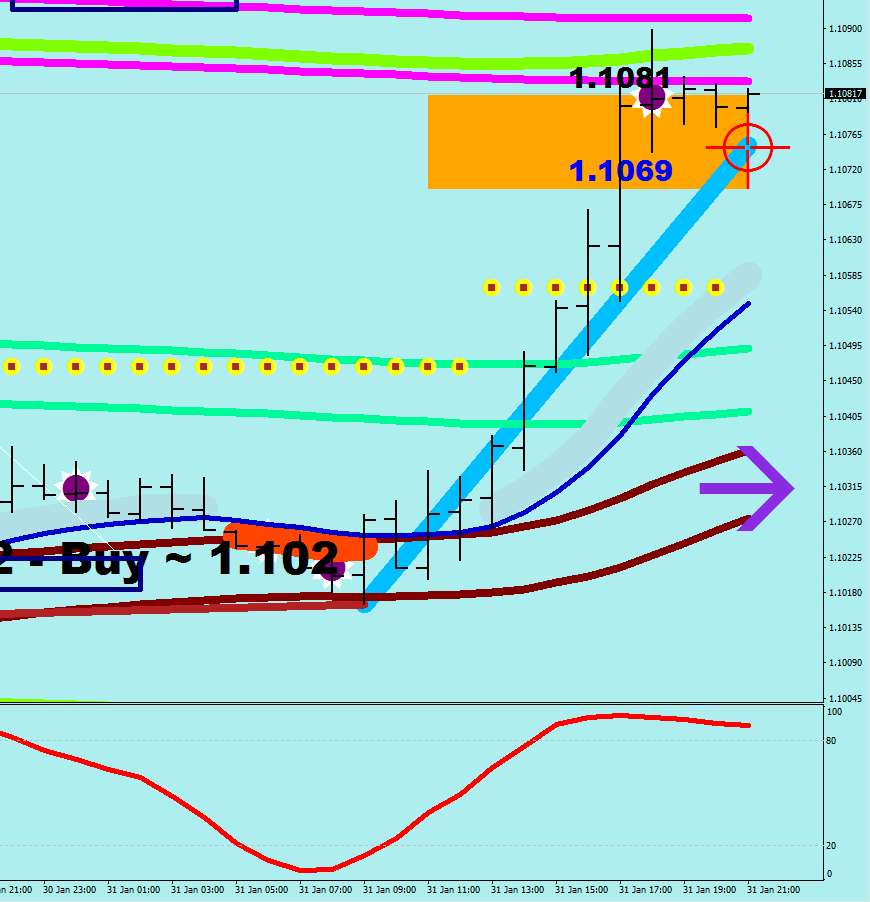
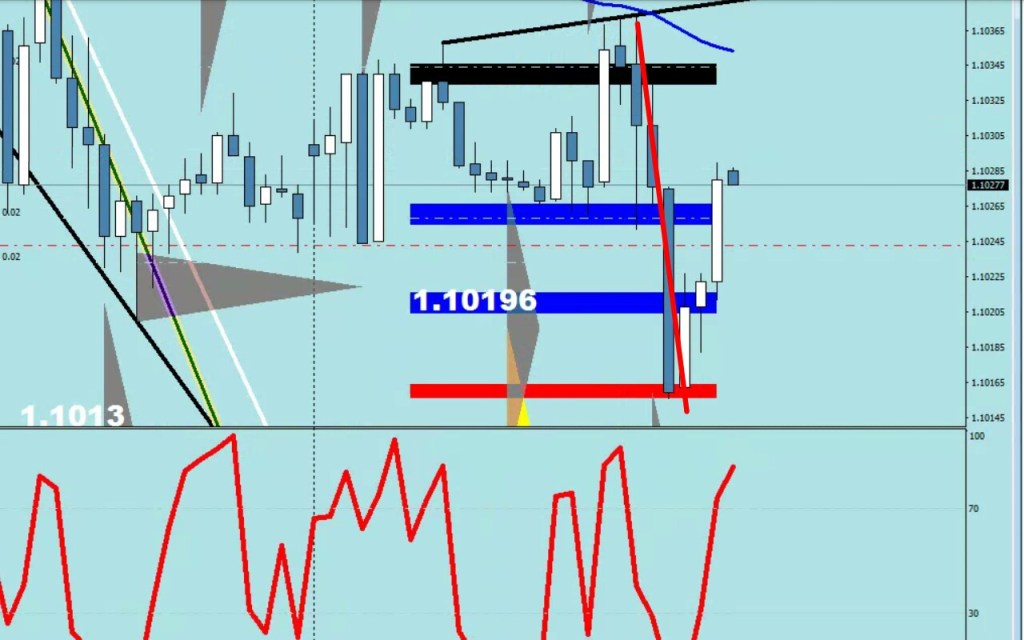
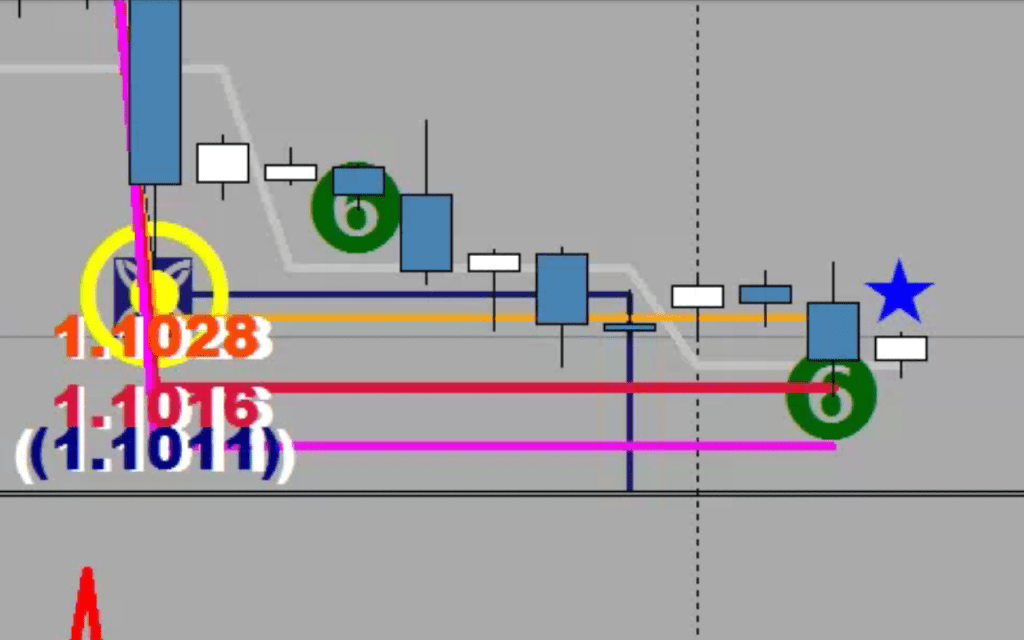
(the actual low was 1.10165, but remember, you want to get a fill)
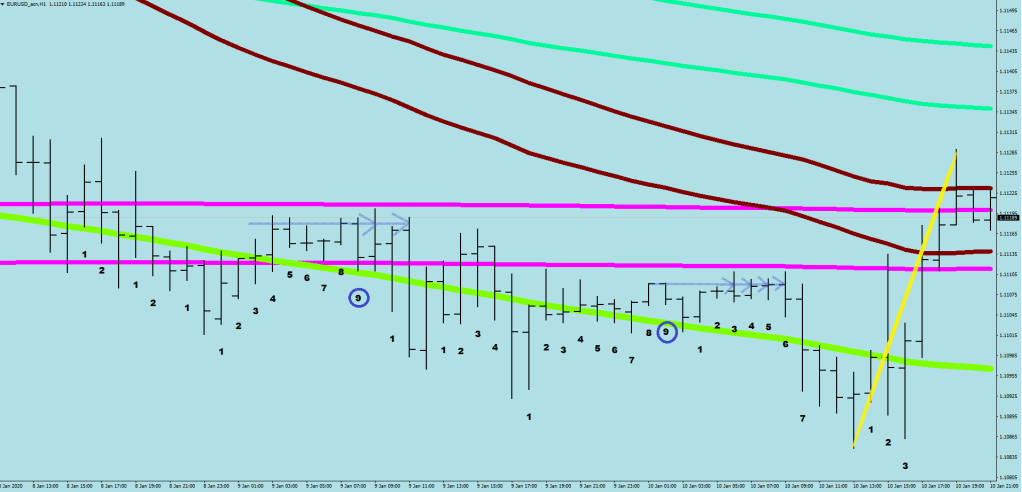
Imagine how much money you could had made with this sure shot call that counts back two dojis, factors in a 4-pip dip and tells you where the Wave 3 could fizzle out, leveraging you a guaranteed 70 pips in a matter of 10 hours from your fill.
Now comes the lesson about the difference between a Wave 1 and a Wave 3.
There are only two resistance zones that are capable of turning back an impulsive wave structure.
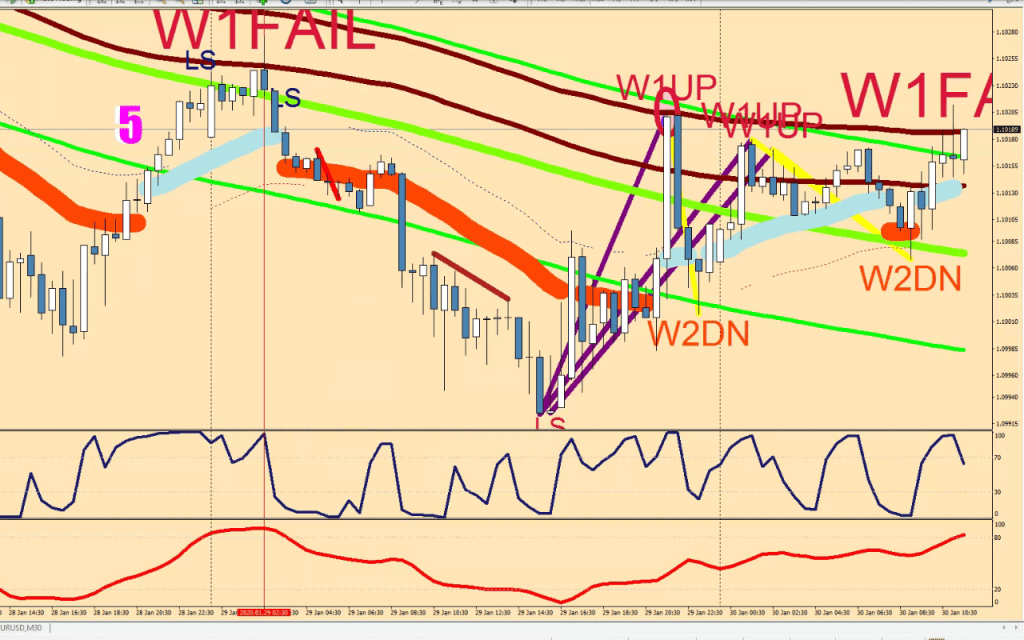
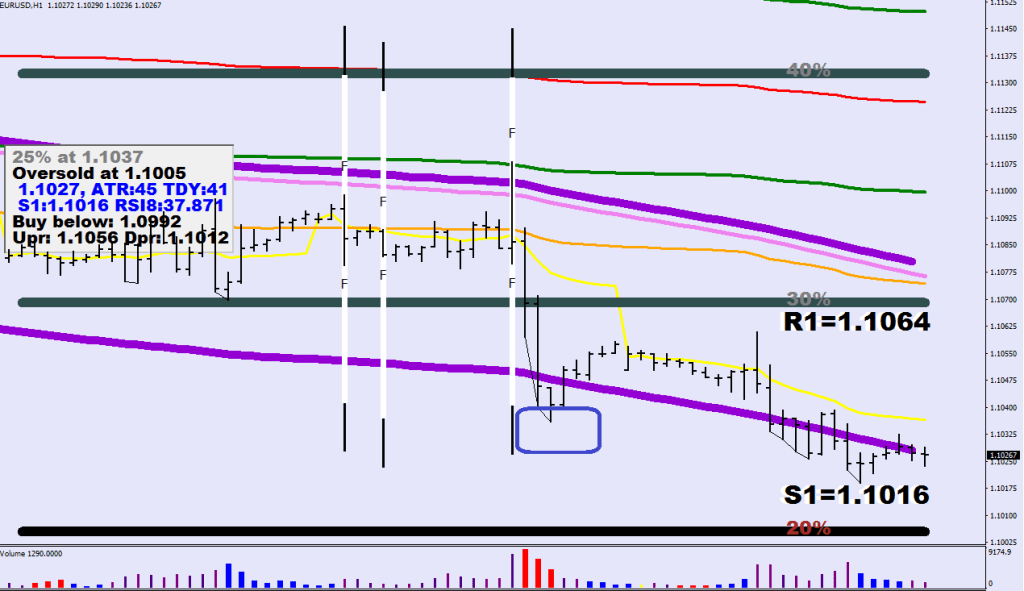
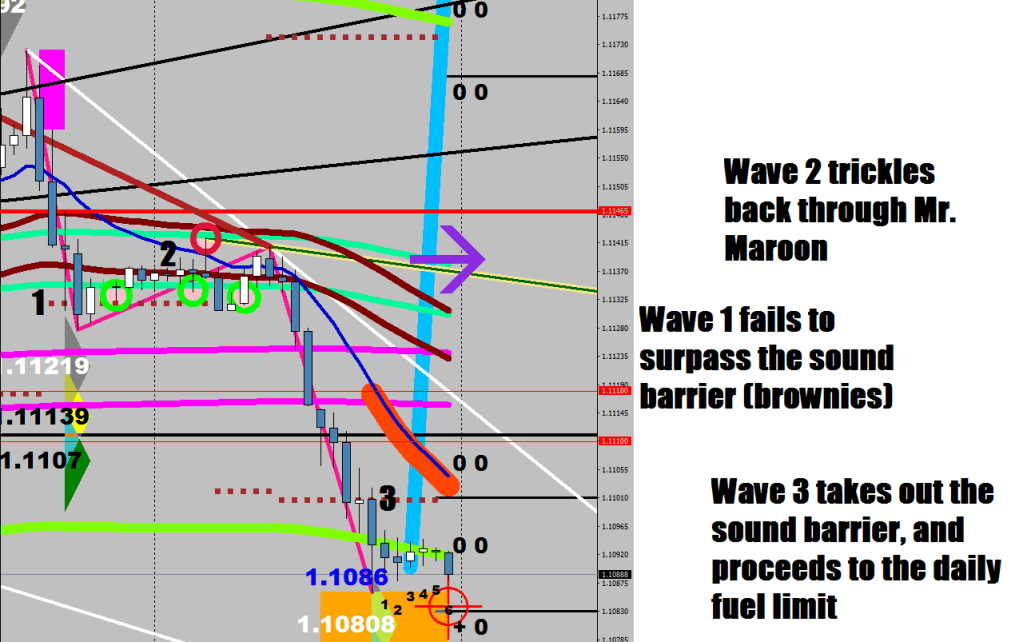
The Fluctuation Maximum or Sound Barrier (Brownies) are measured from the last swing low / swing high from the other side of E-16 (in blue).
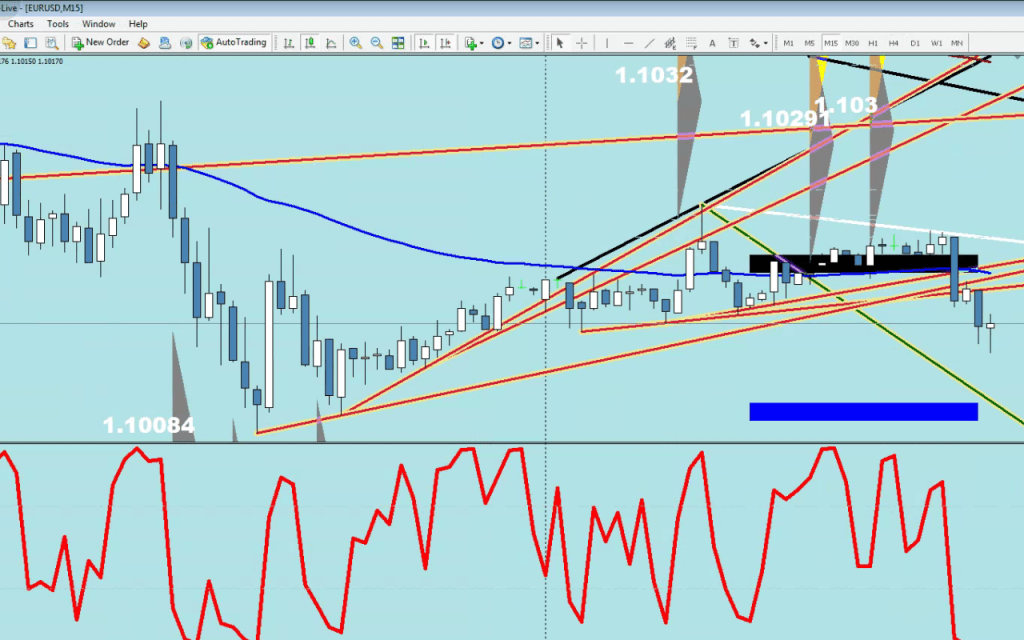
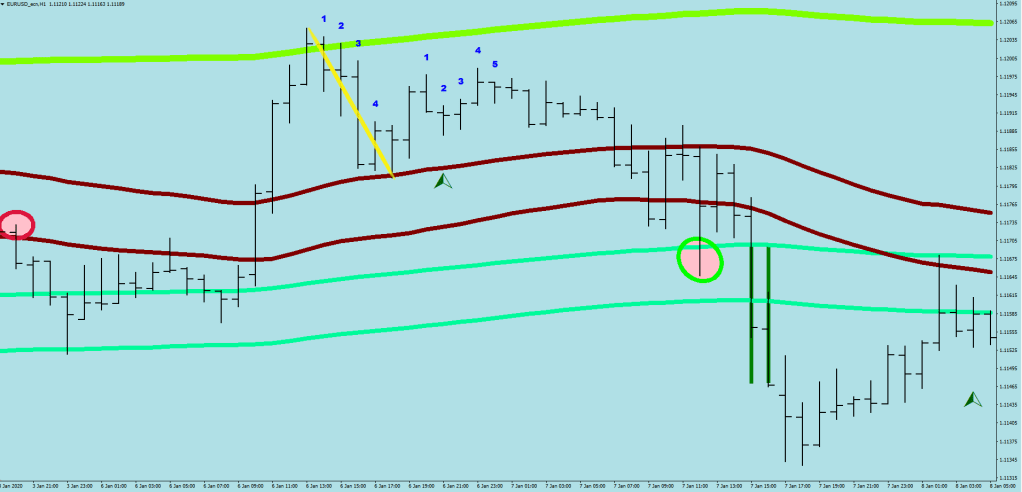
This image shows W1 failing to take out the last sound barrier, while Wave 3 managing to overcome it and even use it as a spring board.The second resistance zone for a Wave 3 would be the far end of the daily fuel limit (in orange) and a bit beyond (+9 pips or so).
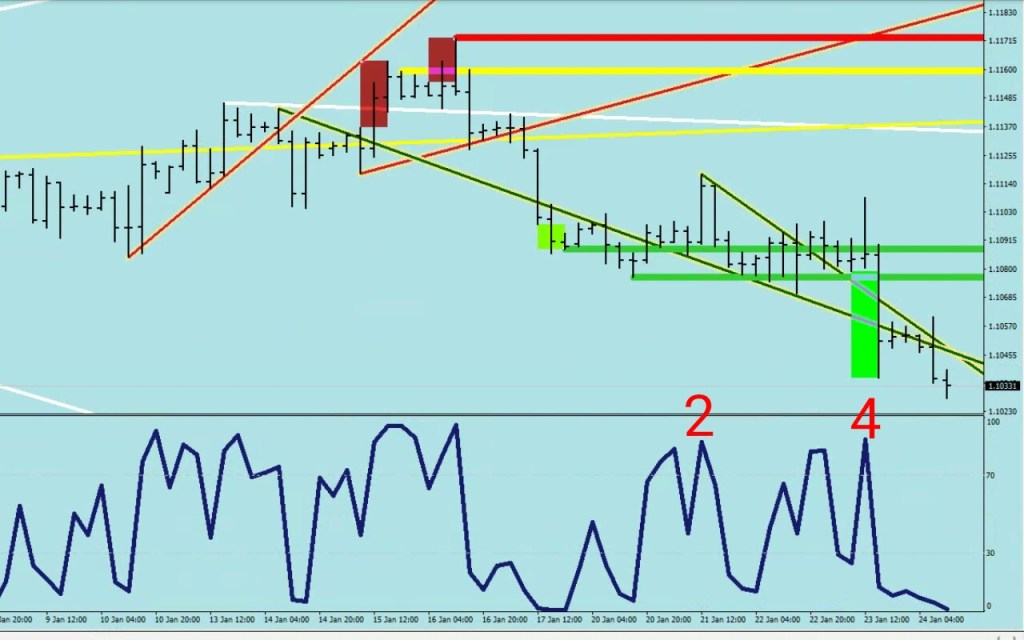
If you want to get better in getting the wave count right, start plotting a 9-sample stoch D on the hourly.
…now I need to get back to my train of thought trying to figure out why don’t some plots appear on Darwinex with the same version of MT4, and why my croppers remain idle without any errors.
A new section is in works on the blog marketing all software assets at real cheap and as a lead up I have a video planned around the Full Lambda Auto trend lines that should blow the lid off most people. See you soon!
We left off yesterday in Bear Zone 1 with a Red Tail and a new lower low finishing off the Primary wave structure.
Now the Bulls have done exactly diddly squat with their 9 hours, so we can call Time Up on them and look to ride the Secondary wave structure lower.
The volatility whip that came out of the lower low should had provided the base for a Wave 1 up. It didn’t. The second high expanded the range a bit, but by less than 5 pips, so it is a failure. 9-10 pips would had been a break out.
There is an abyss below, and it is the path of least resistance, so what is the holdup?
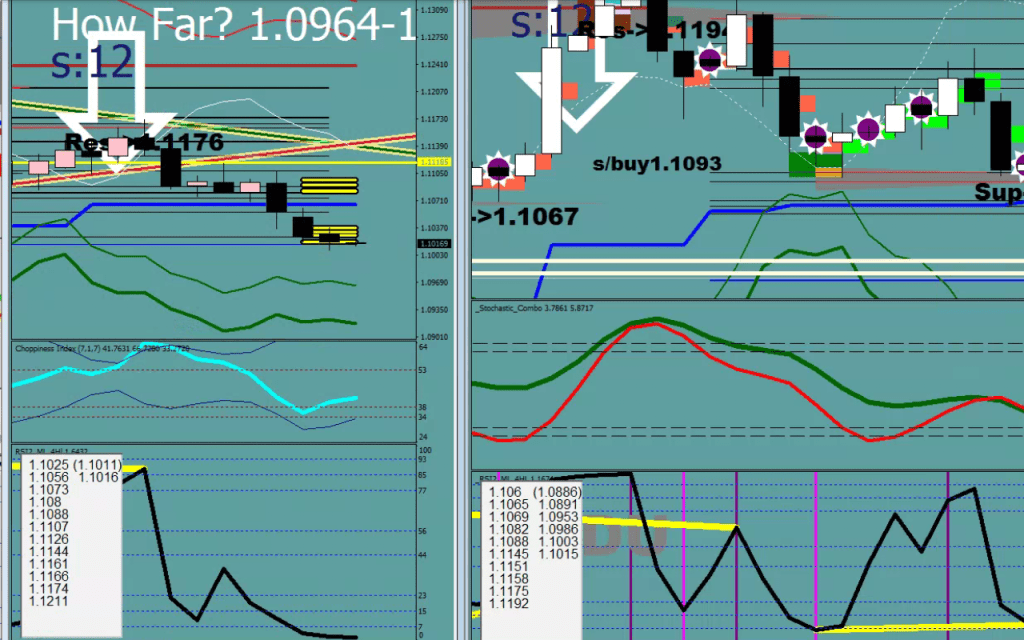
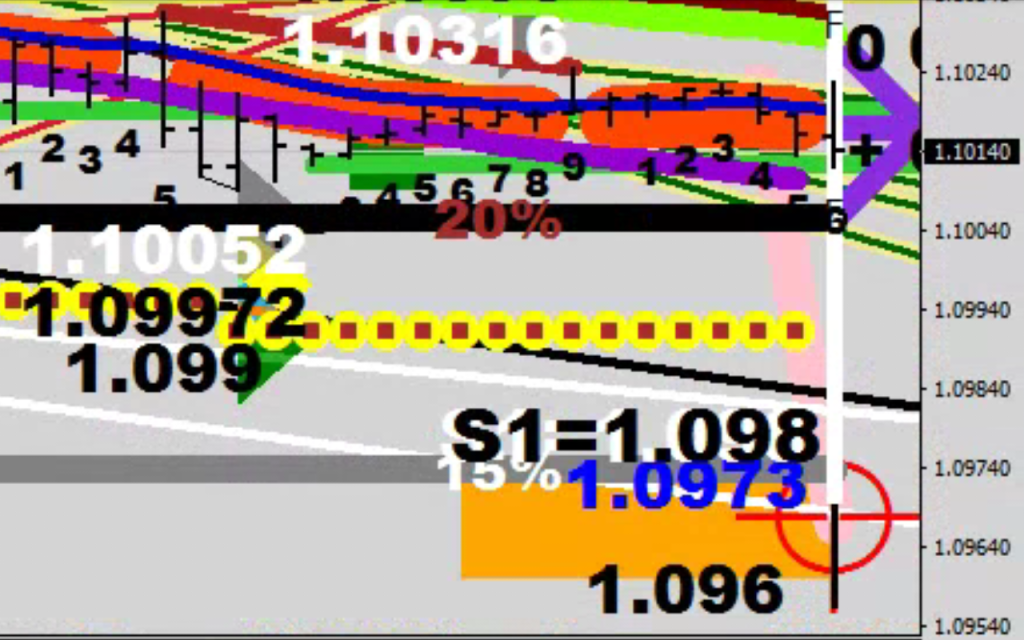
The energy bands would allow price to make a B-line to 1.0964 and then some. The “support” levels are in the right column of the white boards.Daily fuel limit reaches into the low sixties. The hourly energy just got consolidated, and the 15% comfort level is very close to the top of the Orange box.
The problem is that there is no root. You would need to see a continuation divergence for the kick start of the next wave structure down.
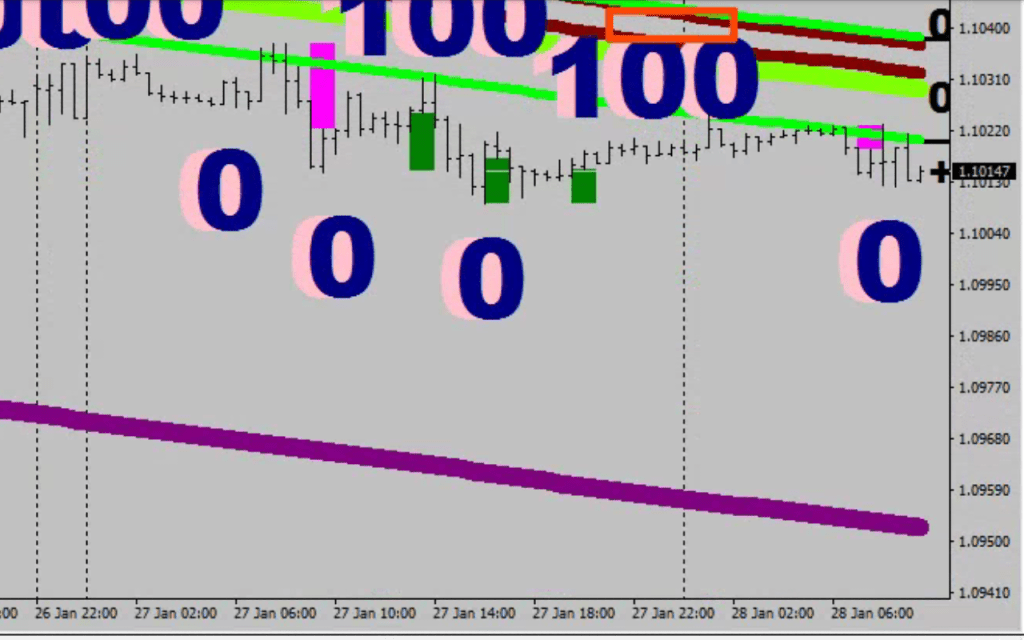
You would ideally want to see a rally falling shy of the marked high whilst RSI2 becoming more overbought and falling shy of the descending Mr. Maroon if possible. Right around the thick green Lower Guard Rail.
I hope you listened well and understand why I picked that high: Mr. Maroon tipped his hat.
In conclusion I would be scaling into shorts from 1.1028 and stop shorting before 1.1031 and would feel utterly dumb if the Market Makers let this rally slide through Mr. Maroon and throw all passengers off board.
If for some reason there would be a lower low first, fade that (refer to the support levels), and add to your shorts upon breaking the low if the perceived higher high (the short entry) would get printed.
The ultimate target would be the 3x stretch limit, the purple haze, from where a Mean reversion would be likely.
Trading Decisions should be made with factoring in
The zone price is engaged with
The wave structure
1) is the top priority for it is easy to often think that a Wave structure had ended. Your best friends are the Guard rails and the hourly count-up to know when you must hedge/ take action for a continuation is due.
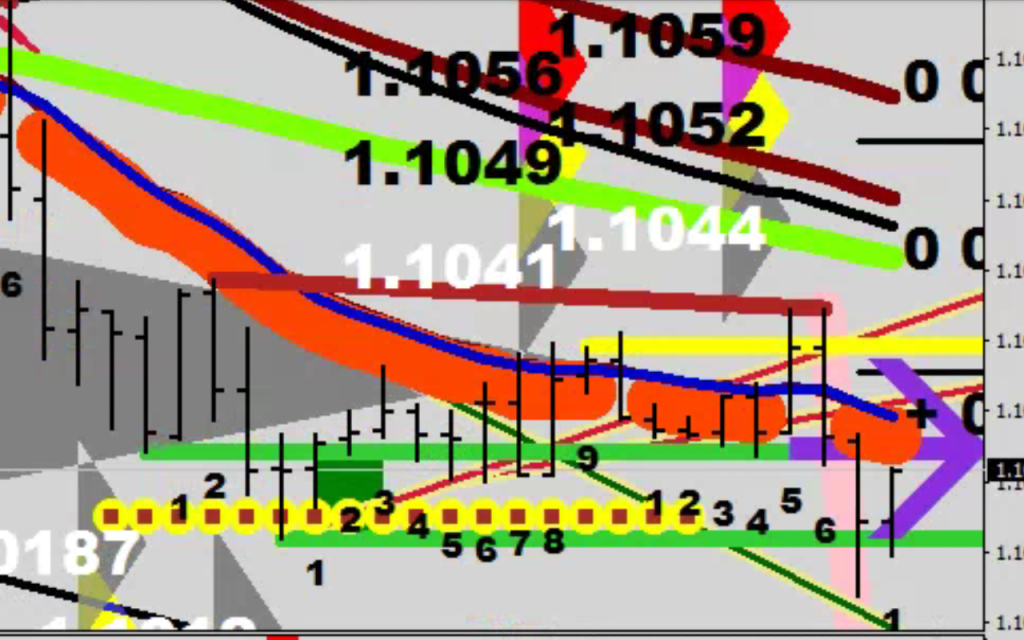
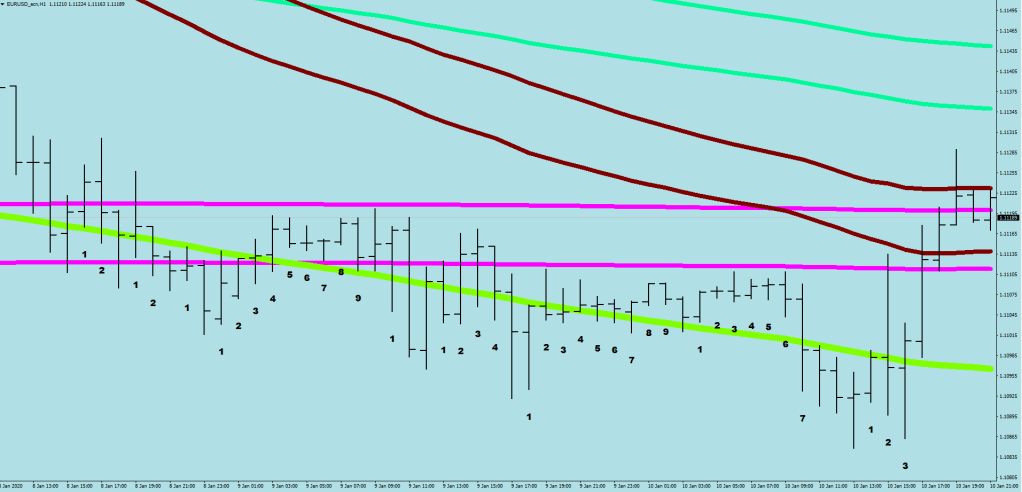
Bear Zone was engaged by two hourly lows below the Lower Guard Rail (in Green). The count up started from the fresh lower low. When the count reached 9, and the bulls failed to make a Wave 1 up by reaching the Market Maker stronghold (Mr. Maroon), you had the continuation sell level on your screen (the highest open / close of those 9 bars & beyond). A hint of a last leg starting is crossing back over E-16 (in blue) briefly.
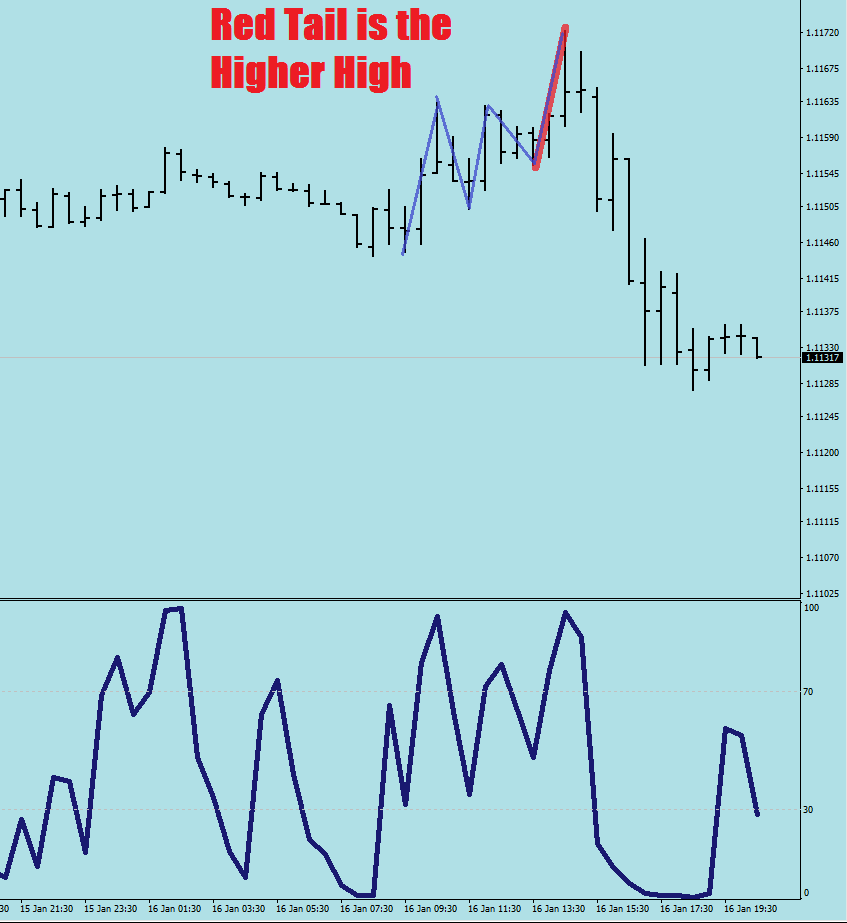
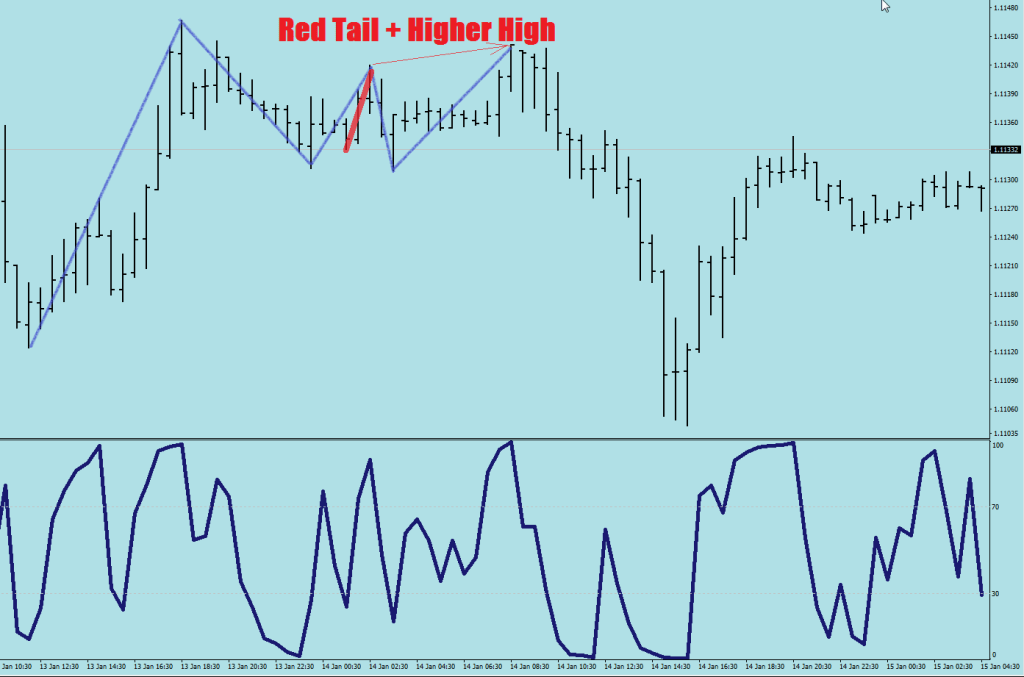
2) To pin point a wave 5 of a Wave 5, you need to be constantly looking for the ending wave, which is a) gonna end with a 22-sample (30 min) higher high / lower low b) it would not hurt if you could point out a high octane burn that I refer to as Red tail for a confirmation (30 minute again)
The Red tail is a 1.5 hr or so long burn (3, max 4 candles long swing on the 30-min). Now, with the fresh lower low there is 9 hours of Fore given to the bulls when they get to try to make a Wave 1 up. This time it should be different.
To answer the riddle I posted on LinkedIn, the next number was -16.
The Red Line is a 16-pip displacement of the last swing low. This being merely at a 1/2 fluctuation distance away is a no-break extension / break out failure.
Sent: Monday, September 23, 2019, 8:07:10 PM GMT+1
Subject: An opportunity with the best compensation
Hi Achilles,
I’m reaching out on behalf of Citadel Securities and their C++ hiring into their US offices. Your profile showed the type of calibre they are looking to add. Citadel Securities is a leading market maker globally, providing liquidity across a broad array of Fixed Income and equity securities. Their clients include the world’s best known Banks, Governments and Asset Managers, and they share the vision of making execution more efficient and the markets more fair and accessible to all. You’ll hit the ground running and be building greenfield trading systems, making markets for globally recognised IPOs (slack, Uber etc.) and working on some of the most exciting High Performance and Low-latency C++ projects finance can offer. They also pay exceptional levels of compensation, rivalling competitors in finance, and the largest tech firms. When would be a good time for us to have a call? Thanks, Zhang
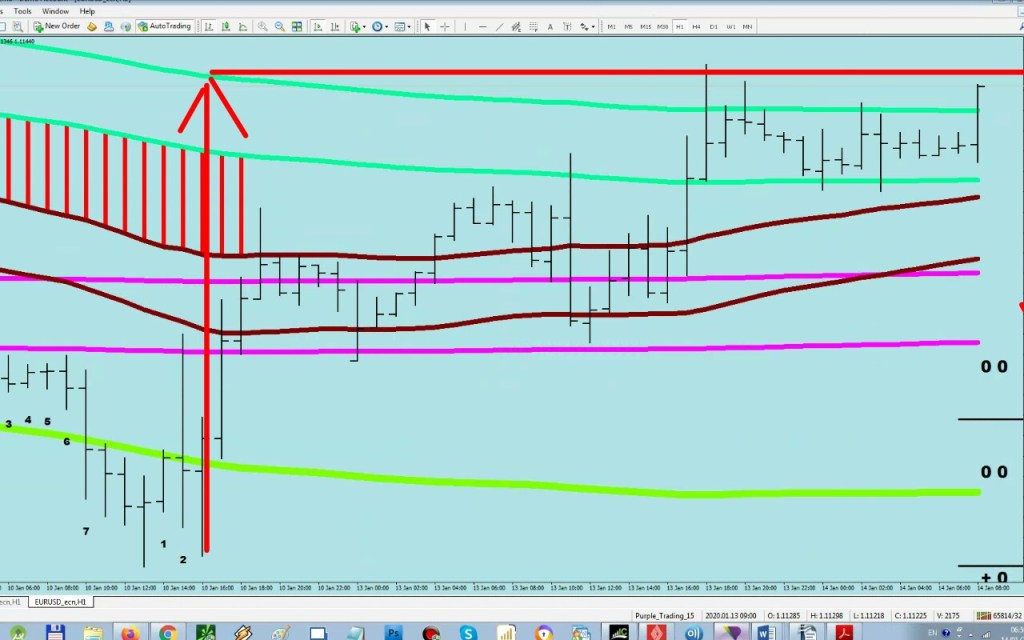
Market went to the daily fuel limit yest -> today should be a follow through with a no break extension.
wave 5 of wave 5 is likely to kick in from beyond E16.
Trading plan for the day: go short above E-16 and target a lower low, 4, 7 pips beyond the low made by Wave 3 of Wave 5.
Why? Because you are expecting the downside volatility to dry out.
Exit 1/2 at 1.1032, 1/2 at 1.1029
If it goes any further, go long for a possible mean reversion to 1.11
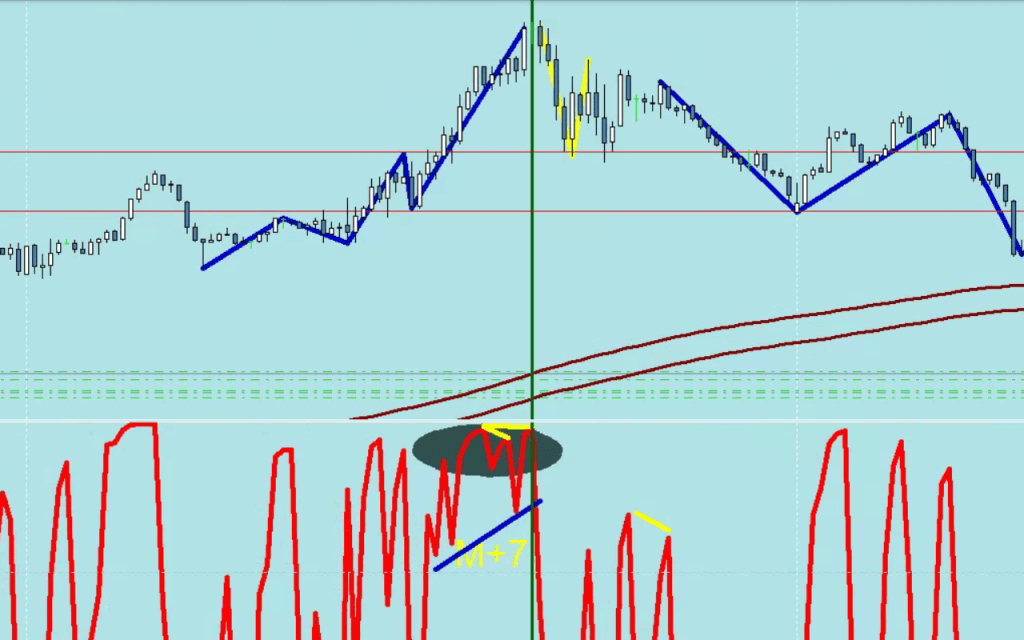
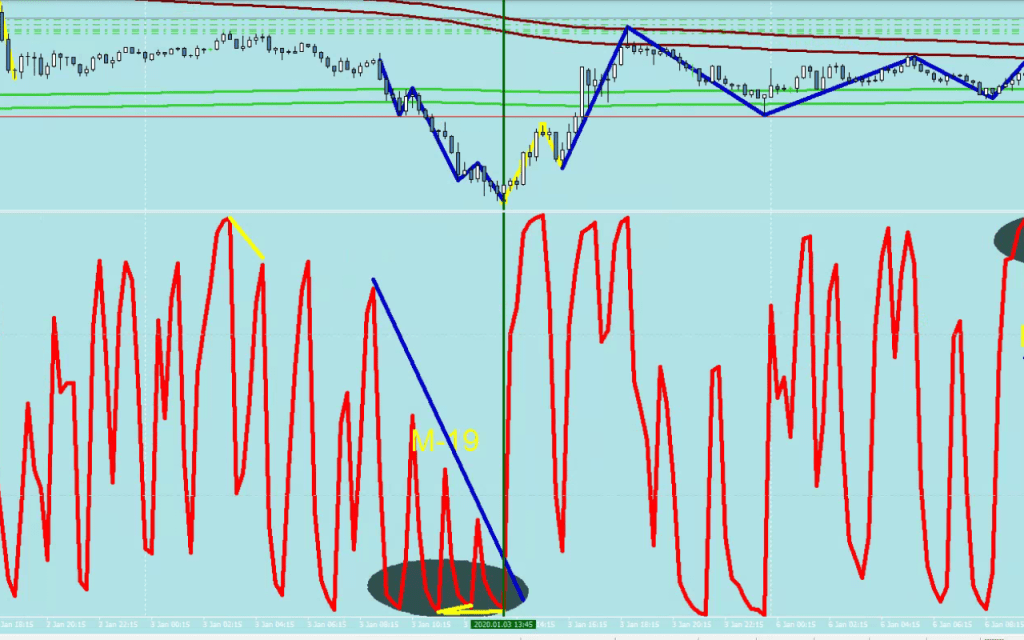
Once the Bear Zone was engaged, the count up started. After 9 hours you had an idea where to sell at, but the E-16 was also there in blue. There is a continuation divergence marker showing the end of wave 4 (of Wave 5).The 3-wave structure ends in a Measuring leg, a Divergent leg and the Beat, which is a displacement from the Measuring leg.
…
One visual representation of reaching a daily fuel limit (a wave 3 would do that). Showing no consolidation since.
Here is an example from earlier of the Daily Fuel Limit’s follow up, the no-break extension.
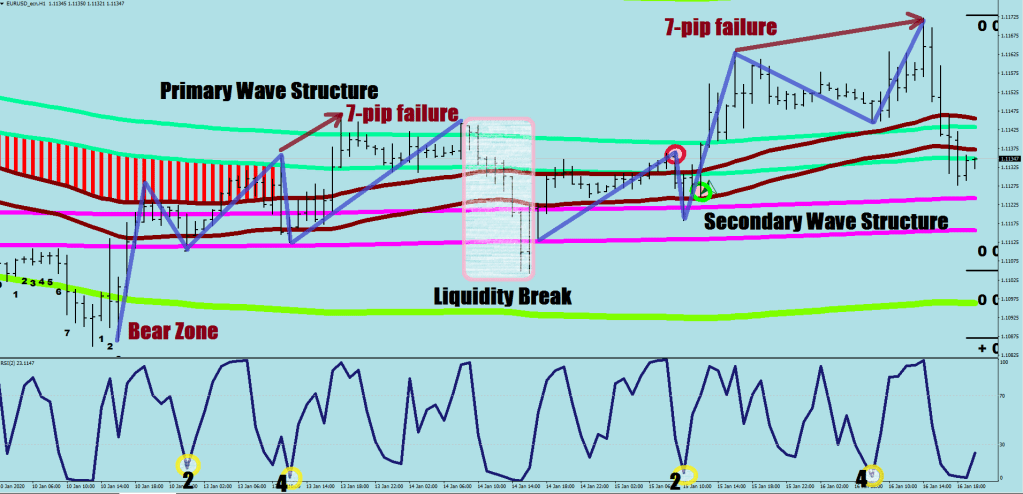
The Secondary Wave Structure is a volatility freak.
It is brought on by a prolonged, 3-wave quick break (the waves may be only visible on 15 min or even below).
The secondary structure does not have a good footing, for it does not originate from a stretched zone (Bull Zone or Bear Zone) and is preceded by a primary wave structure.
I call it a volatility freak, because the actual, directional turns (from Wave 2 to Wave 3 and from Wave 4 to Wave 5) only happen at extremes with a well pronounced continuation divergence.
Wave 1, 3 and 5 in the secondary wave all set up reversal divergences (30 minute chart) and Wave 5 has a defined 3-wave push playing out.
One hint would be looking for a red tail + higher high / lower low (depending on direction) on the 30-minute.
The Liquidity Break goes too far: a Wave 1 would fail not much beyond the sound barrier.
…
The daily fuel limit was known even before the day had started.
The final Countup is on.
The 5th Wave is expected to start from beyond E-16.
Once price had engaged the 1-time-plus stretch zone from the mean (by making two highs above the upper guard rail or two lows below the lower guard rail), the rules become rather simple.
To reverse the direction, the counter-party becomes put on a timer.
The chronometer starts counting up from the last fresh hourly high/low to 9.
The chronometer gets a reset upon a new 22-sample high/low.
So, what is this counting good for?
For figuring the perfect entry for a continuation and knowing when a Wave 1 was printed and price direction reversed for good.
Let me explain.
Once you have printed 9 on the counter, you most likely have seen the resistance level already. Your aim is a lower low – trail stop advised, for there is directional rotation in these zones: people get put with the bag.
If Mr. Maroon gets hit within 9 hours, the game is over with.
This upside example shows that a continuation support was not made successfully. The second set of numbers are there because I am looking for two highs above the guard rail within the last 10 samples.
…
Bonus image:
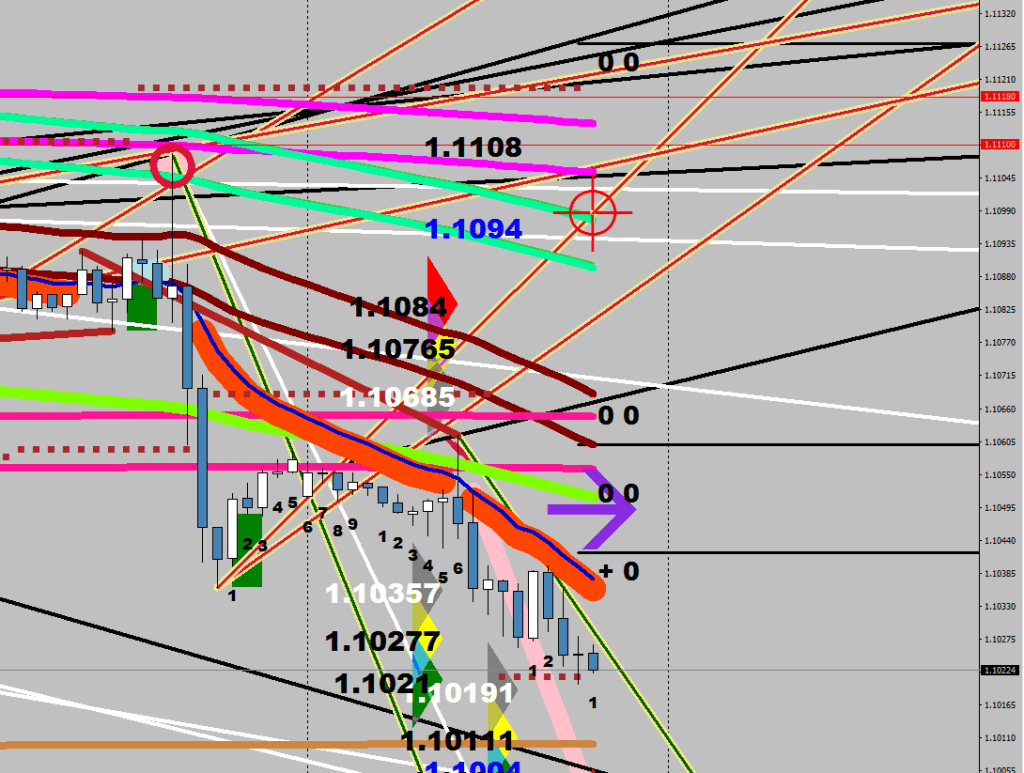
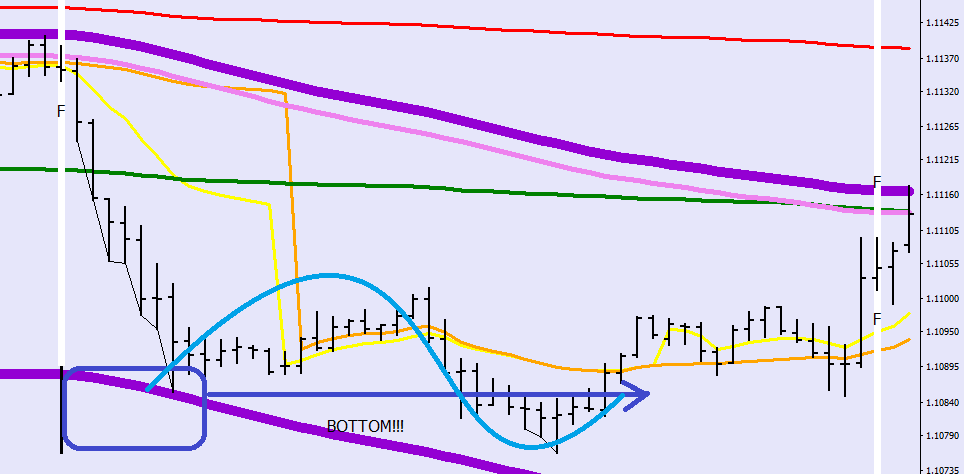
Self explaining shot about how you figure the target of a Mean reversion.
Draw in the five waves up for a mind practice and see if you got the Wave 2 trickling back through Mr. Maroon.
A terminal wave can be a Wave 5 as well as a Wave C. What is important is finding the area with the muted & dropping counter-directional volatility. On the 15-min chart you should see a sequence of 3 or 4 spikes where the last 3 would be (in order) the Measuring leg, the Divergent leg and the Beat. The Beat would normally exceed the Measuring leg on Eur/USD by 7+, 15+ or 22+ pips. The translation is that once you have a Measuring leg and the Divergent leg printed, you should make an effort for scaling out of your directional holdings and start getting in at every step with 1/3 of your pre-determined maximum size.
I have spoken of the Wave 2 (and Wave 1) having to be confirmed by the Market Makers which means that the wave would have to cross Mr. Maroon on one side at the very least.