Ain’t got a lot to improve on.
When I saw that this Wave 1 line (in off white) wasn’t getting plotted, I immediately knew what the problem was: there was no exhaustion within my current sample, so I had to move the examination out 1 bar furter, to the sixth…
|| uex[j-6]
& voilá:
I was to write something bashing about what a mistake it is to set your oscillators on Close prices… They are an arbitrary point in time with no particular meaning, and advise you to start using weight values instead.
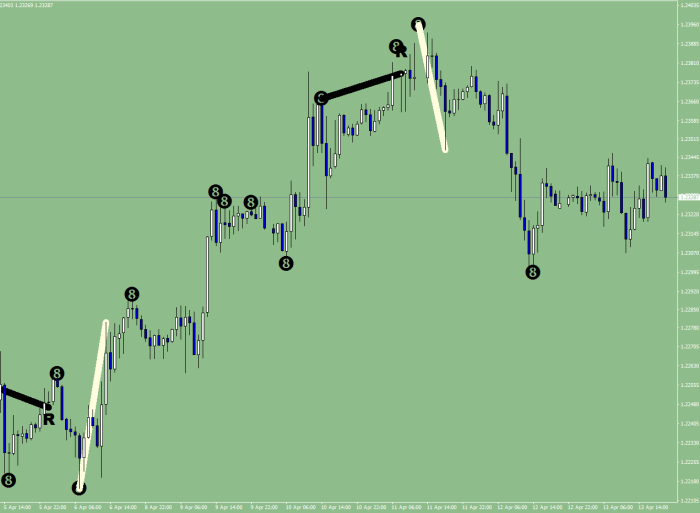
I wanted to point out for you the obvious, that a Wave 1 to the downside was made and the best entry points are (in the direction of the Wave 1)
- the pullback to/beyond the Root point (when applies)
- the pullback after the Wave 1 Terminal Swing Point was made
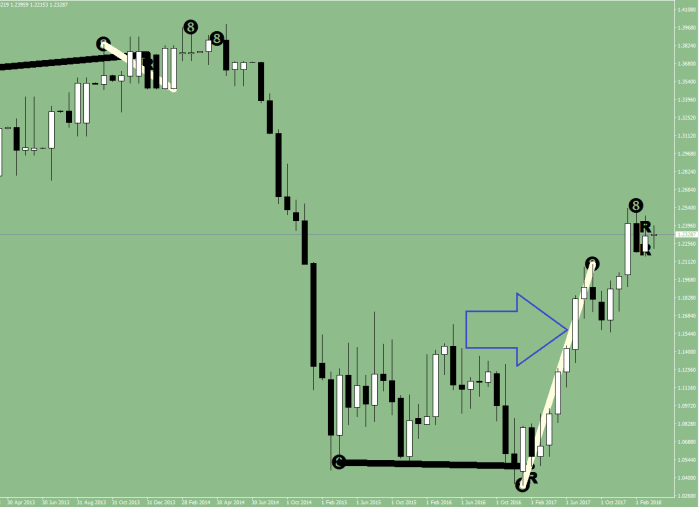
The likelihood is high that price is going to go into the monthly Wave 1 (image 1.), from where the the monthly Wave 3 to the upside is to continue.
I hope you learnt from me something about moving averages, learnt the importance of finding the wave structure, keep an eye out for double pumps (8+8) that cut the waves short, play the direction of the wind & the relationship to the green river (up to a Wave 5), and never ever disregard what the comfort levels tell you.
…
On the 1H I had to change the back dating to forward facing to get proper results.