(From the Hunting Highs & Hugs series)
In continuation to the prior articles discussing the revisited Blow off top of Wave 3 and the 3-day mean reversion, we’re hunting the highs and the lows.

From the Root on what were the identifiers of bottoms?

All of the lows went through Mr. Maroon and did not have multiple closes there plus the Crack Ho made a scare on / spanked on the 50 line.
If these were the events to get in, what were the ones to get out at?
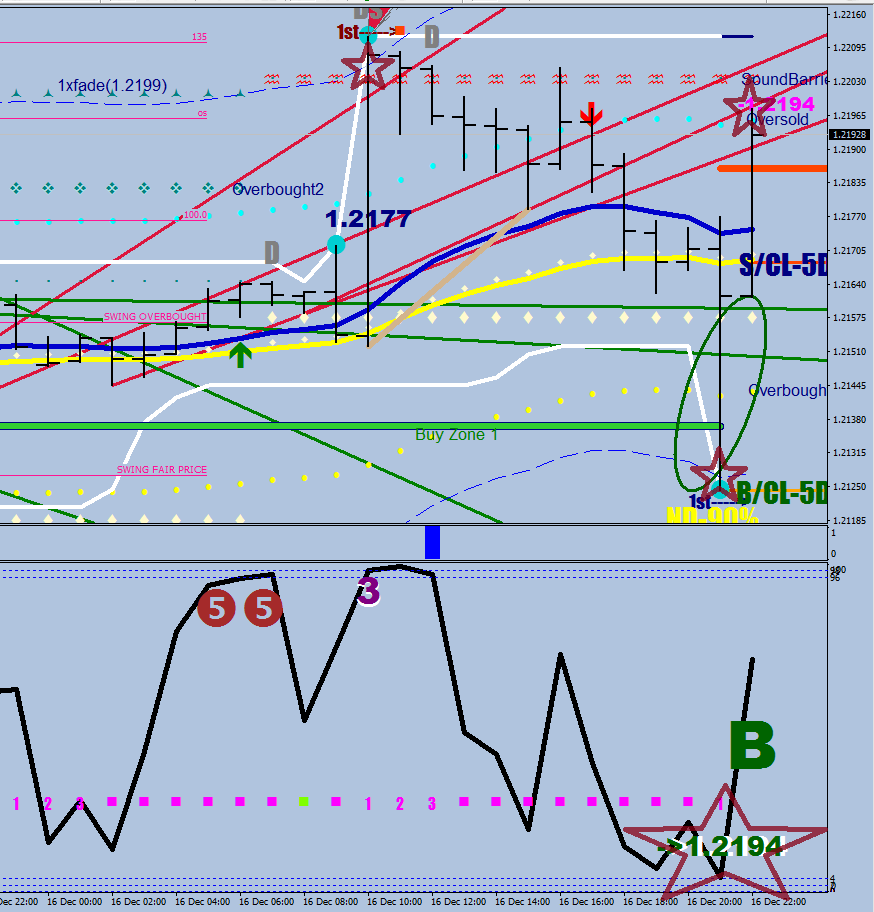
Wave 1 up being a measuring move, ran a Cooper test till a Crack Ho Stopper read of 94

After that you had the Wave 2 pullback to the other side of Mr. Maroon as it goes.
Wave 3 ended up in a reversal divergence between the Beat and the Thrust.

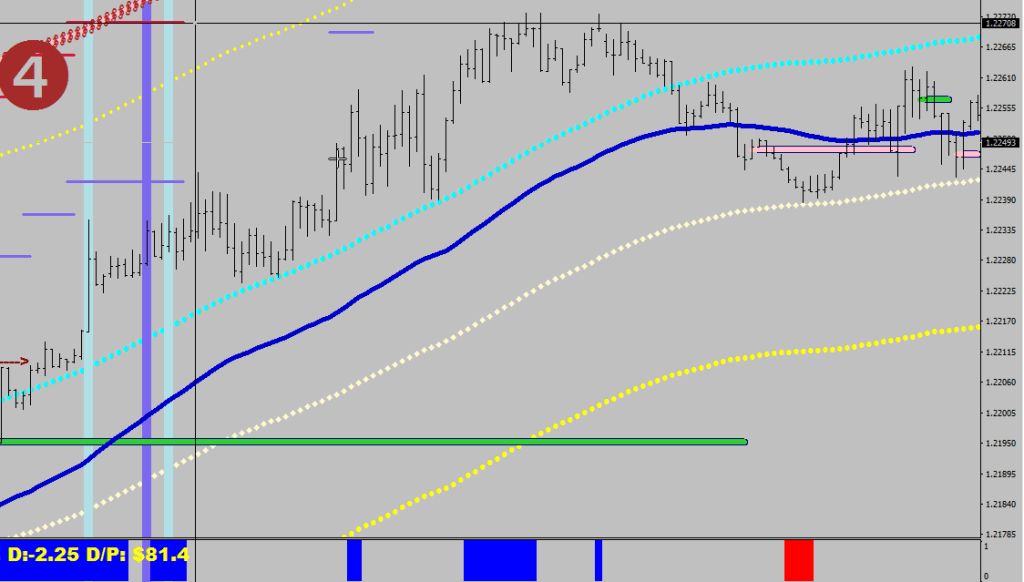
As for having the end point at hand before hand, the projected distance level was tagged (1.2210) before the correction down to the Green River for a Wave 4.

As a minor detail, the up thrust prior the Mean Reversion was the qualifying move that generated this target, so it was present even before wave 1 of Wave 5 started.
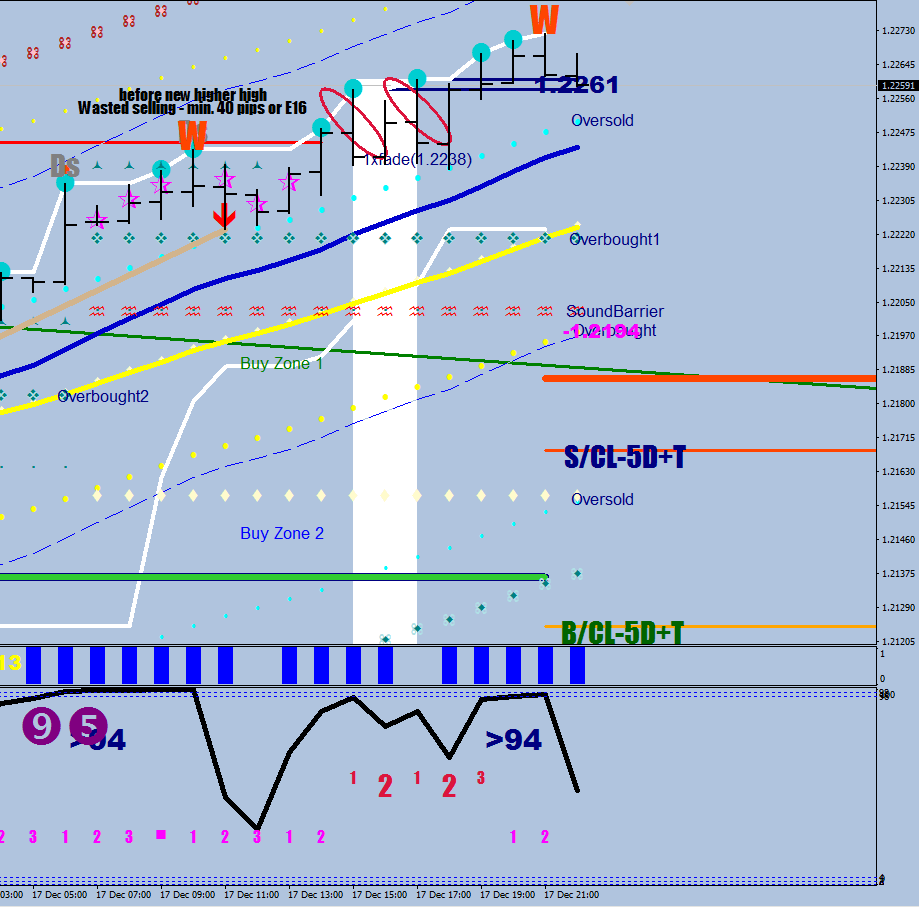
wave 4 of Wave 5 was about working up volatility – you can see clearly below how price first tagged the upper end of the E-16 channel (star 1) before it got the other slam from the other side (star 2). This was a superball bounce to stick with the sports theme.
Now, what about this wave 5 of Wave 5 up then?

There was a qualifying move up that set the projected distance. What is really missing currently is a Thrust after some pullback.
Price has been having serious issues with maintaining 3x fluctuation maximum distance from the mean, and you would need an up candle with 1/3 close down with 4 pips+ wick and good body length for a go crazy short signal, so the wait is on for LEMA30NSX to pick up something just right.

A higher high is very likely, and there is less than 12 hours left to make that thrust. I would look to buy below the E-16 and 40 pips below the current high – puts you in the low 30s.
Here’s a little trick for finding a buyable low in an uptrend:

One more benefit of my 15-minute charts: they can predict tops>