
By now I shared finding the consolidation mean, my percentage tool w/ labels and some of the things that seemed recurring as well as the static range made up of just shy of 2x fluctuation maximums from the 50 line.
You may be tired of this image, but oh, it managed to capture so much.

300 was followed by a 0 print at the other end.
The recent -100 went for the opposite 0: +100.
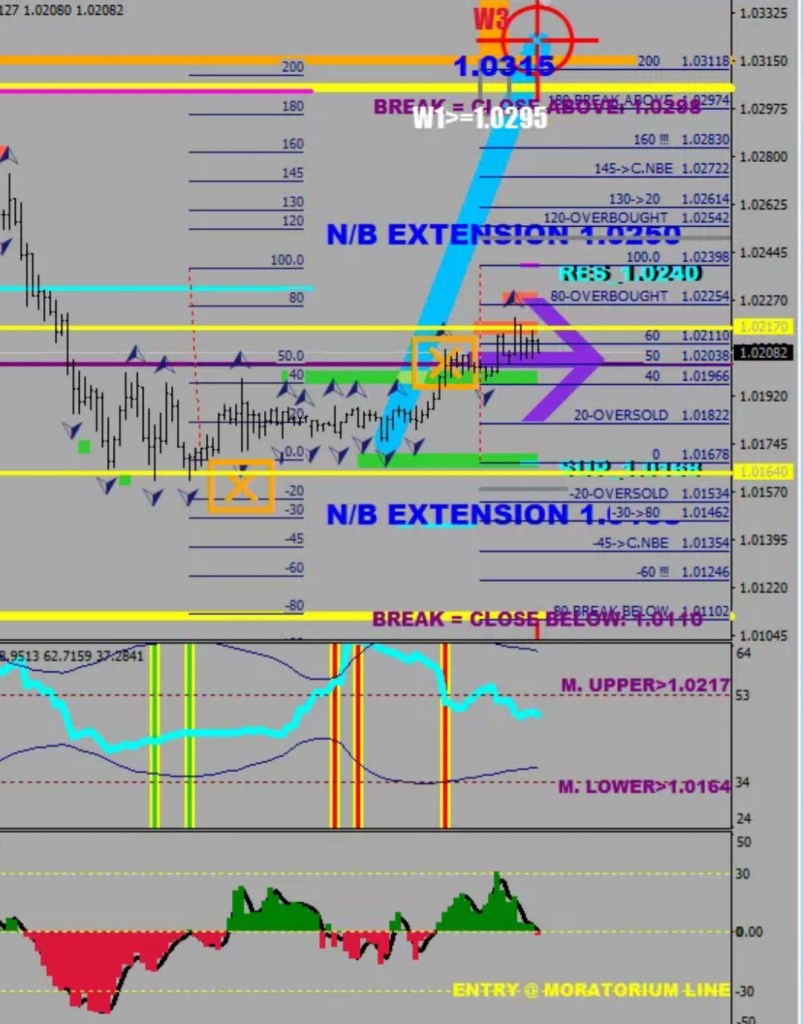
Conclusion: 0 seeks 0.
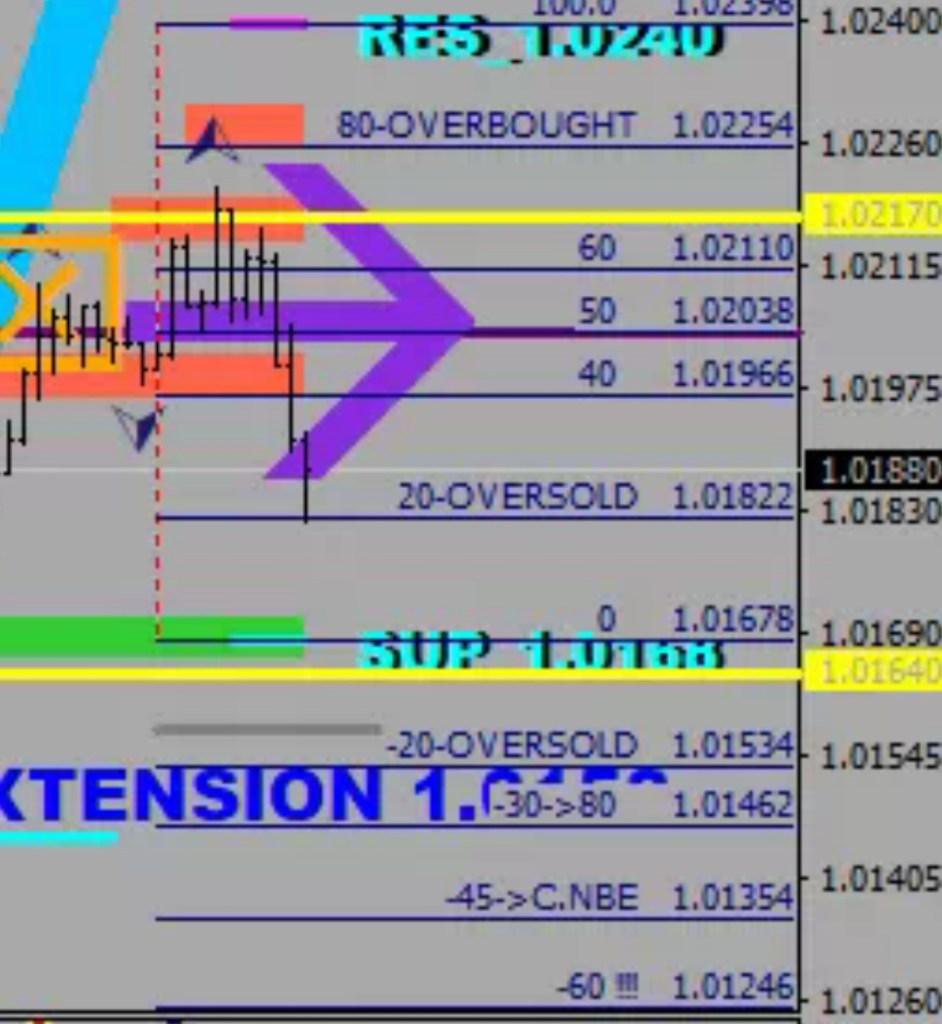
Next up -30 on a future range, then equate at out of oversold and sell more at overbought (80) until a felft shoulder print (45-70%) before the last move down settling on a 0.
If the head itself overshoots the 0 by 20%, sell the next 0 again (100) for a divergent lower low.
Either this move mentioned above or the 0 after the LS would be the revolving door.
I should also mention that the -80 print earlier did not qualify for an LS as it was more than 70.
One more lesson: when the downside move overshot -200, price did not manage the +100, only got to 90 (deeply overbought).
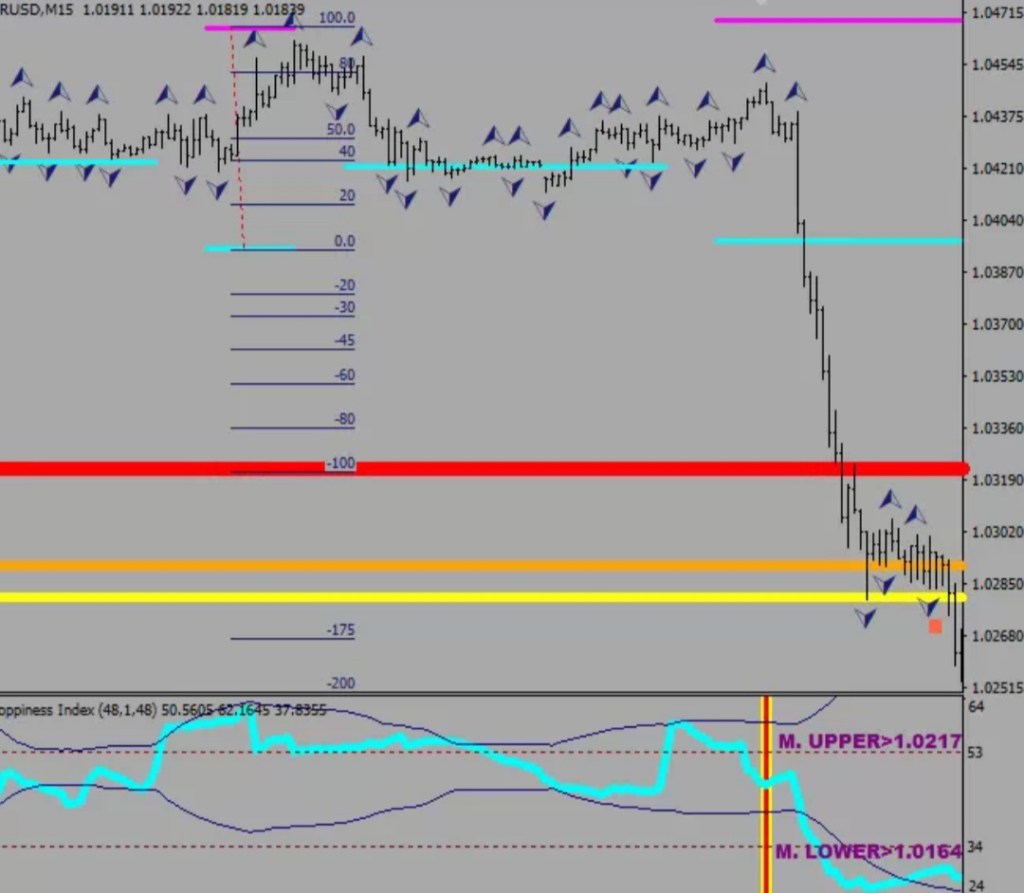
The future is bright right before the last toll.
Price just bounced off the oversold. Should continue to at least -30, perhaps beyond -45 (LS). A lower low regardless. Adding to shorts.
…
The world’s gonna blow your brain.
