Watch my hand, I’ll do it in slow motion.

Because the price arrived from inside a previous range.

The dynamite had a corresponding target – a “160 degree” full swing on the Range Pendulum.
You knew this? Very well, come sit in the front!
The First Blood print was where they dumped a larger short position into the German PMI today. They were not careful enough and they moved the market tipping their hand. I actually could spot this in the price movement.

     ///first cut up

   if (NBEU[i]!=EMPTY_VALUE && NBED[i]!=EMPTY_VALUE)
   if (iLow(symbol,0,iLowest(symbol,0,MODE_LOW,100,i))<NBED[iLowest(symbol,0,MODE_LOW,100,i)] && High[i]>iLow(symbol,0,iLowest(symbol,0,MODE_LOW,100,i))+480*Point && Low[i]<iLow(symbol,0,iLowest(symbol,0,MODE_LOW,100,i))+480*Point
      && (High[i]<taxi[i]-70*Point || (High[i]>iMA(symbol,0,32,0,MODE_EMA,PRICE_OPEN,i)+50*Point && Low[i]<taxi[i])) && High[i]>taxi[i]-500*Point
   ){
////zero dn
if (iFractals(symbol,0,MODE_LOWER,i) && Low[i-1]>Low[i] && Low[i]>NBED[i]-330*Point &&
(
(High[i]>NBED[i] && Low[i]<NBED[i]) || (High[i+1]>NBED[i+1] && Low[i+1]<NBED[i+1]) || (High[i+2]>NBED[i+2] && Low[i+2]<NBED[i+2])
|| (High[i+3]>NBED[i+3] && Low[i+3]<NBED[i+3]) || (High[i+4]>NBED[i+4] && Low[i+4]<NBED[i+4])
)
&&
(
(Low[i+22]<NBED[i+22]-330*Point && NBED[i+22]==NBED[i+25]) || (Low[i+23]<NBED[i+23]-330*Point && NBED[i+23]==NBED[i+25])
)
&& NBED[i+23]!=EMPTY_VALUE
){
ObjectCreate("Obellix"+IntegerToString(i), OBJ_TEXT, 0, Time[i], Low[i]+80*Point);
ObjectSetText("Obellix"+IntegerToString(i), CharToStr(77), 38, "Wingdings", clrDarkGreen);
if (NBED[i+23]==EMPTY_VALUE) ObjectSetText("Obellix"+IntegerToString(i), CharToStr(77), 38, "Wingdings", clrYellow);
ObjectCreate("Targeted"+IntegerToString(i), OBJ_TEXT, 0, Time[i],NBEU[i]+((NBEU[i]-NBED[i])/10*4.5)+50*Point );
ObjectSetText("Targeted"+IntegerToString(i), "TGT: "+DoubleToStr(NormalizeDouble(NBEU[i]+((NBEU[i]-NBED[i])/10*4.5),4),4), 16, "Arial Black", clrPurple);
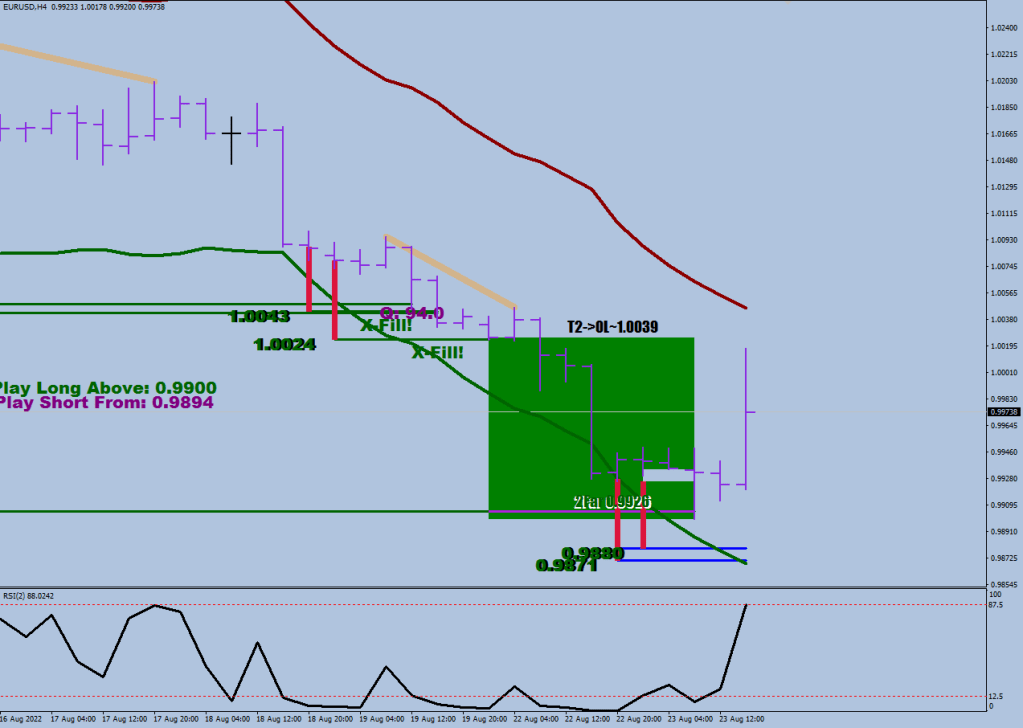
}The yellow horizontal line below is the goldilocks level.
As you can see, it splits the gray box in half – halfway between what a typical Wave 1 can manage and what a Wave 3 is likely to achieve.
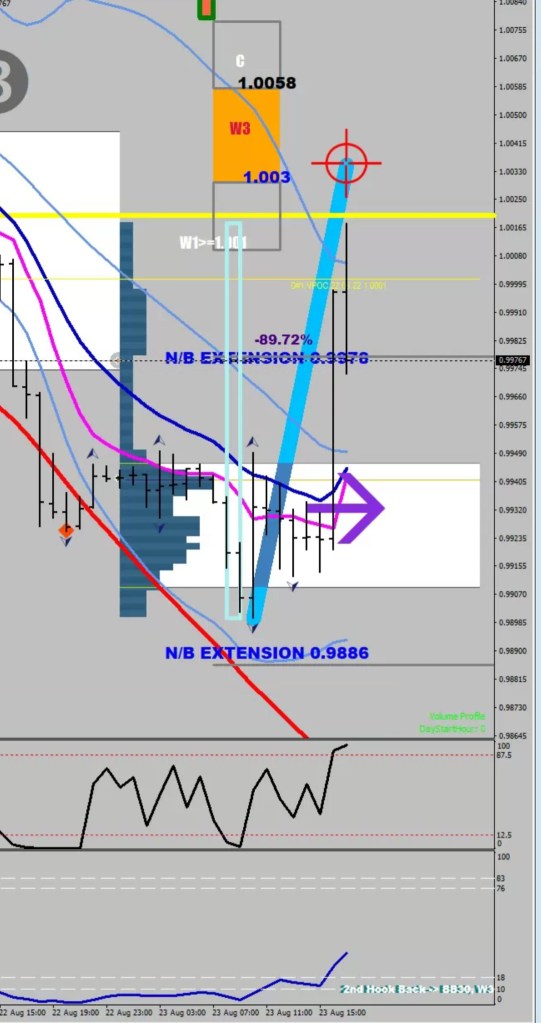
The optimal 18-sample stochastic reading for a successful turn is between 9.5 and 4.4. The previous day went too oversold, the number was plotted in white.
Why doesn’t this one say CAP for capsize attempt? I just told you, the previous day went deeply oversold. Today is a low, but not THE Low.
Too much acceleration. Have to re-balance with a divergence.
if (st18[i]<9.5) { ObjectSetText("Bingo"+IntegerToString(i), "CAP", 26, "Impact", DarkGreen); momentum[i]=1;
cap[i]=1;
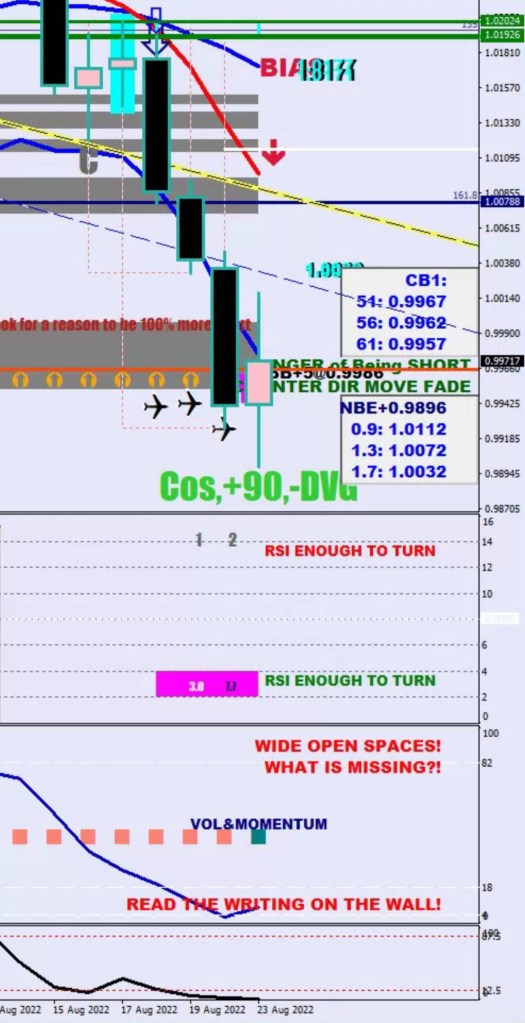
if (st18[ArrayMinimum(st18,10,i+1)]<4.4) {ObjectSetText("Bingo"+IntegerToString(i), "Cos,+90,-DVG", 26, "Impact", LimeGreen); c77[i]=true;
Here’s an example from earlier. From the CoverOverSold low to the swing high there was 113 pips.
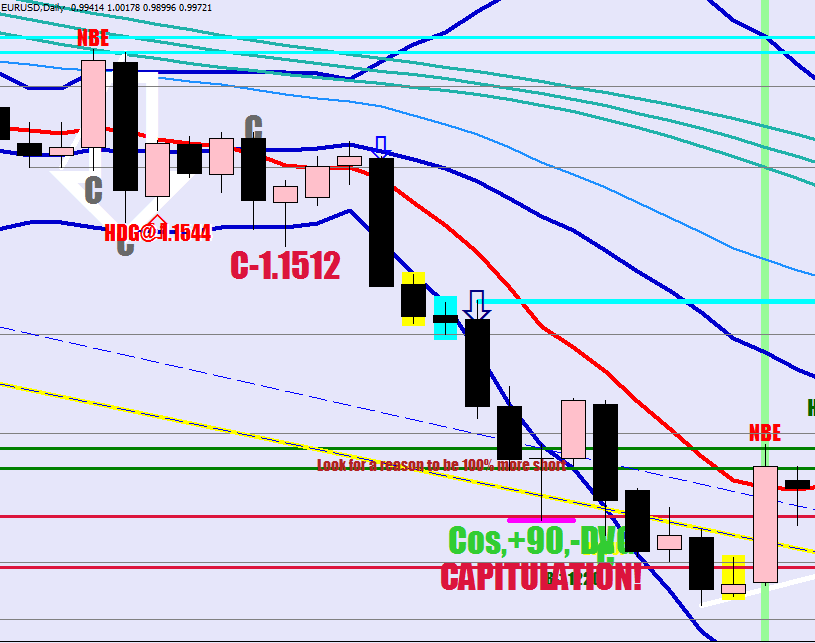
You always seem to get some additional move the next day. This one had 88 pips from the Cos low (this is why I chose 90).
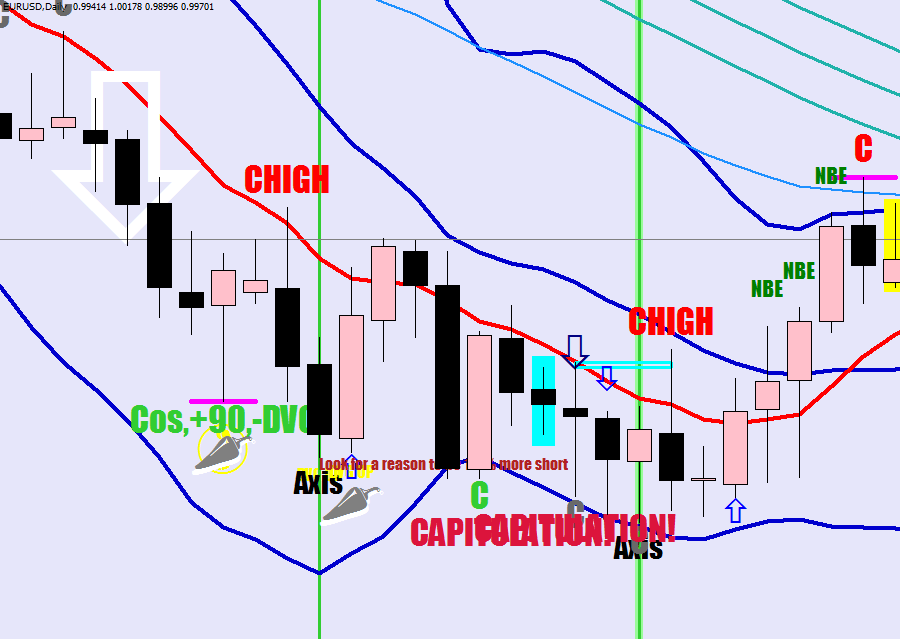
This one had 2 more days up and 157 pips in total.

I’ve shown you this before.
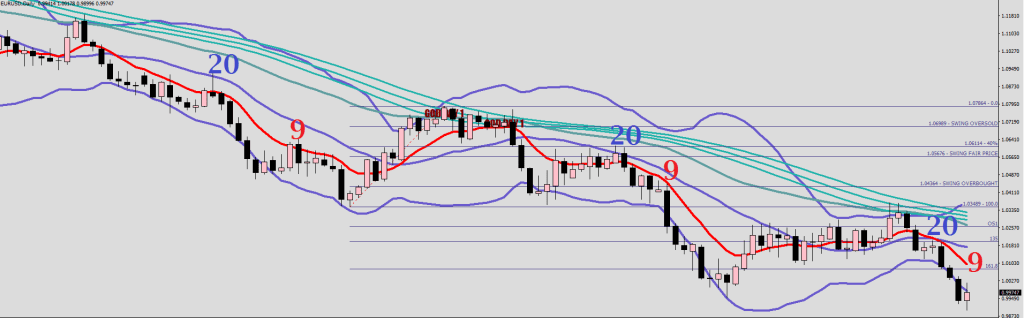
The market first fails at the 20SMA and later at the 9EMA before making the final wave down.