Wave 1 has the approval of the market makers: it takes out Mr. Maroon (or the closer end of it at the very least). If the sound barrier gets mildly violated, the wave went too far. Wave 2 is the trickle back through Mr. Maroon for the Market Makers to ditch counter positions. Scale in for a wave 3 starting at a Hourly RSI2 extreme. 4H sup / res can also give a clue. Wave 3 correct the target to beyond daily fuel limit, beyond the guard rail, find the next MM level / daily resistance confluence. Let the trail stop do its thing: wide start (3 & .3).
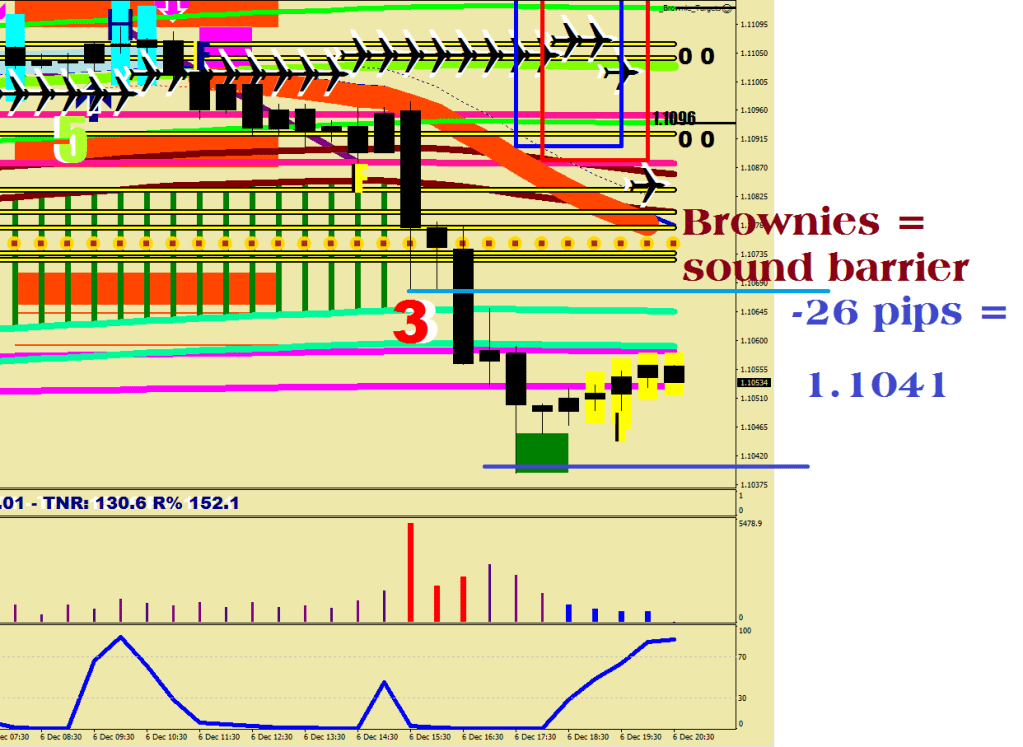
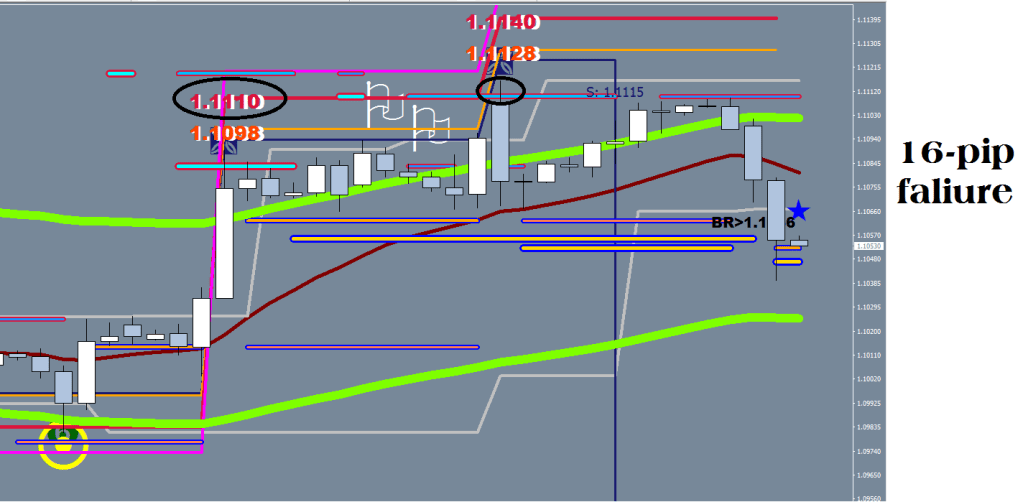
If on a wave 1 move the sound barrier gets taken out, the next support level would be the daily fuel limit. If a sound barrier gets taken out by more than 6 pips, you are looking at the end of a Wave 3 and you can calculate a 16 or 26 pips failure for the end point of Wave 5.
Wave 3 would likely be made of 5 sub waves, on the Hourly, look for Whoop, Bam and Boogie. Remember the relationship between Bam and Boogie. The failed break outs would either happen at 4 pips, 16 pips or 26 pips. Wave 5 of Wave 3 would likely start from beyond the E16, so a God Almighty print may appear.
Wave 5 of Wave 3 would end in minimum a 15-minute RSI2 divergence.
Wave 4 might go as deep as trampling into Wave 1, but for the most part the spark zone would be enough to launch Wave 5. Wave 4, the ambitious may go oversold twice before wave 5 would kick in.
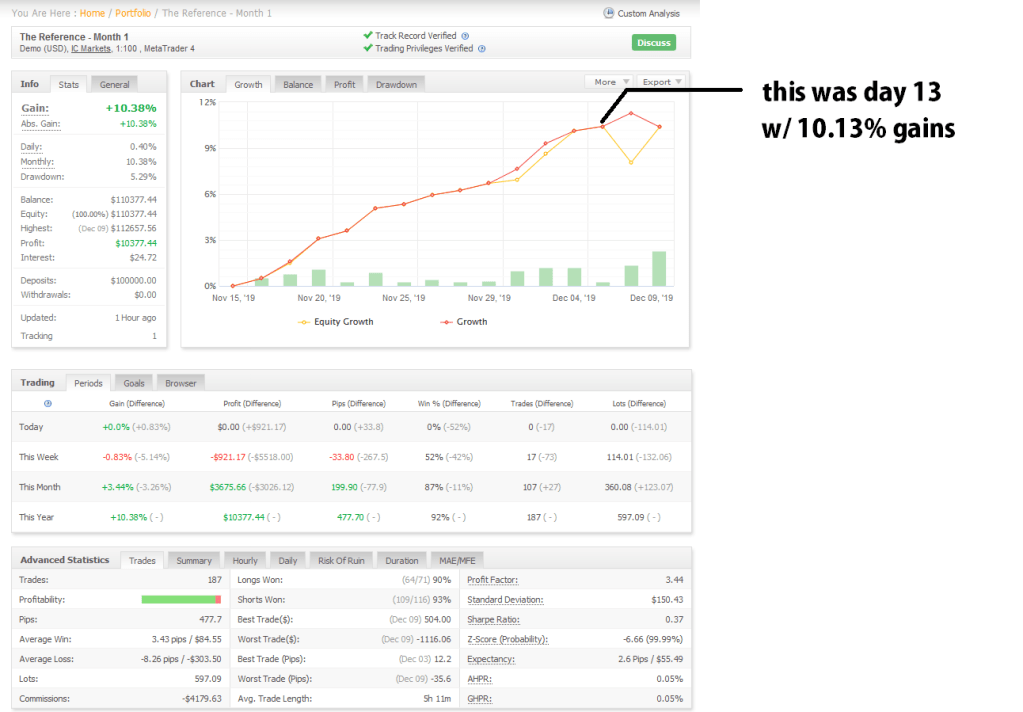
They wanted 10% gains for the 1st month, with less than 10% maximum draw down.
This is the 13th trading day, and I am calling it a month. The maximum draw down never reached 3.5%.
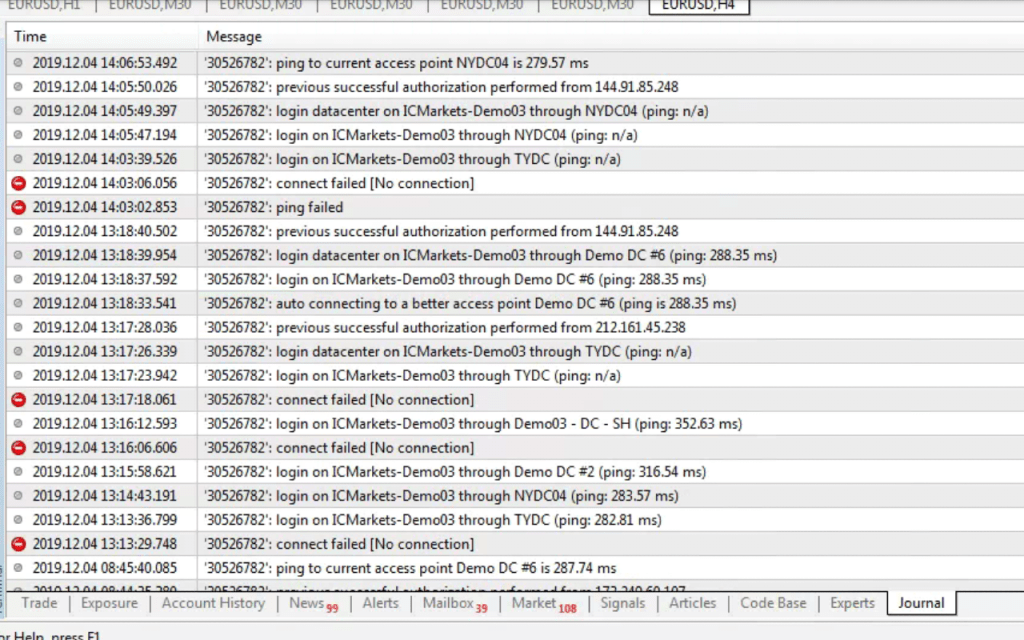
About the reality of trading with a Demo, in particular on the Demo3 server of IC Markets:
Just today I thought of having another pass at a hybrid hedger, which would leave pending orders with the broker in case your system goes offline, but with IC markets I could never fully overcome their Hyperactivity account suspension stupidity.
Plus their demo3 server goes offline frequently and for long periods leaving gaps in the data. Demo 2 had no such issues.
Since I mentioned hardware and software here, I also had to buy a WiFi signal amplifier at home after I moved the computer desk. This comes with bandwidth loss.
About the reality of trading with a daytime job:
You would certainly need a job where you are allowed to have your cell on and enough time on your side to be able to follow and interact with the changes. Maintenance was a conscious decision by me, but it has its etwork/coverage issues with the lot of moving about and its tons of rebars to phase you out. I certainly would not be able to do this in catering or with an office job.
I thought I made some kind of a record when a back test on MT4 came back with a Profit Factor of 45,000+
Durging this test with the 100:1 leverage, I was switching off between two accounts and somehow my 3 lot size went to 1 micro lot, and I opened with that. Later I just closed out this odd lot, not paying attention to the actual balance, and so I ended up with my first losing trade. I think it was probably 3 cents of a loss with the commission factored in.
Profit factor can only be figured from the comparison of your losses and gains, so you need to have a miniscule loss (especially if you are like me, and only like taking losses on your own terms.)
I was already pushing 200,000 profit factor and 1.4 Sharpe ratio, when my second accident happened.
This time I was trying to read off the market maker level with a remote view of my desktop and I ended up dragging an open orde, and not realising this, I clicked on a stop loss that was ultimately hit. Without this move my profit factor and Sharpe would had kept on going up in the skies.
These were the rules:
1. Challenge: the first 30 days
The Challenge is a 30-day simulated trading account in which you have the opportunity to demonstrate discipline in meeting the money and risk management objectives. Your trading style is completely up to you, we do not set any limits on instruments or position size you trade. We measure your trading performance based on the Trading Objectives.
2. Verification
The objective of the Verification is to verify, for the last time, that you have a solid and consistent strategy. The differences in the Trading Objectives between the Challenge and the Verification are in the Profit Target and in the Time Period. The Profit Target is reduced by 50% and the Trading Period is extended to 60 days.
3. Funding
As soon as you meet the Trading Objectives of the Challenge and the Verification, you will get a funded account. Now you can start making real money. The only objectives you must follow are the Maximum Daily Loss, Maximum Loss and Minimum Trading Days. These three objectives are protected by our proprietary software. We no longer require you to meet the Profit Target or other Trading Objectives. Trading objectives/rules
Trading Rules/Objectives: Minimum trading days:
To meet this objective you must trade at least for 10 days during the testing period. At least one position must be opened in each of these days.
A trading day means a day when at least one trade is executed.
If a trade is held over multiple days, the day when the trade was executed is considered as the trading day.
Positive Days:You must reach at least 50% of positive days compared to the number of negative days, where a positive day is considered to be such a day where the value of the account balance is higher at 23:59:59 CE(S)T than it was on the same day at 0:00:01 CE(S)T.
Maximum Daily Loss
This rule can also be called “trader’s daily stop-loss”. According to our rules, this is set as 5% (10% in case of an Aggressive version) from the initial capital value. The rule says that in any moment of the day (CE(S)T – Central European Summer Time), the result of all closed positions in sum with the currently open floating P/Ls (profits/losses) must not hit the determined daily loss limit. The counting formula:
Current daily loss = results of closed positions of this day + result of open positions.
For example, in a case of the Challenge with the initial capital of €40000, the Max Daily Loss limit is €2000. If you happen to lose €1000 in your closed trades, your account must not decline more than €1000 this day. It must also not go -€1000 in your open floating losses. The limit is inclusive of commissions and swaps.
Vice versa, if you profit €2000 in one day, then you can afford to lose €4000, but not more than that. Once again, be reminded that your Maximum Daily Loss counts your open trades as well. For example, if in one day, you have closed trades with a loss of €1000 and then you open a new trade that goes into a floating loss of some -€1200 but ends up positive in the end, unfortunately, it is already too late. In one moment, your daily loss was -€2200 on the equity, which is more than the permitted loss of €2000.
Be careful, the Maximum Daily Loss resets at midnight CE(S)T! Let’s say that one day you had a profit of €600. On the same day, you have an open position with a currently floating loss of €2500. On this day, the maximum daily loss is not violated. The current daily loss is €1900. ( €600 closed profit – €2500 open position). However, if you hold this position with the open loss of €2500 after midnight, the daily loss limit will be violated. This is because your previous day profit doesn’t count to a new day and the open loss of €2500 exceeds the max daily permitted loss of €2000.
& these are the days
Take the back seat and ride… in time…
Hi, Thanks for thinking of me. I don’t understand these draw down values, I never have. To make money you need to take risk. What if it something goes against you by more than 10%? Than you are disqualified? From what?I am not the watching paint dry type. Best Regards,Achilles
You are right, I did not mean to come across rude. Where and how get onto this program?
Another fellow trader in London that I connected with via LinkedIn told me about it. There is a fee to do the challenge and strict parameters but if it works, you get paid to watch paint dry.
Hi, That’s a lot of rules to live by. Are you sure that these people do not just try to live off the nomination fees?If you care to wager the fee, we could do a trial run, sure.Is this MT4? I would need my trail stops running.
Hi I will try to make this a good reference account. You never know. When you have plenty of funds, it may make sense to trade like this. Achilles
…
The server has been hanging for the last 16 minutes
Was offline for almost an hour. Just as I remembered. I feel doomed.
The usual 1h no connection.
28 minutes this time.30 left to FOMC.A lot can happen in 28 mins.
I’ll push on for now. I hope I won’t regret it.
Every dog will have its day, I’m obeying the rules for now. It does not make much, but it does not lose much either. Especially if after getting your two strikes you suspend trading to regroup. It is always easier to reconsider when you do not have any open positions. 16 pips has been a good choice so far, but I do cut positions too early, so I need to move out to 4h, have some plan and perhaps make the trail stop less aggressive.
…
Understood. It looks like your system is working and compliant with the restrictions imposed. Like I said, somewhat restrictive but the potential funding is for a larger acct which makes the absolute gains more attractive than the percentage gains themselves.
…
Let’s talk about the Kite
I should had started a new demo effective of the next day, for the new, more restrictive rules would have to shine through the stats not in a shape of an average for the entire period.
I did not. And I got into trouble. I did not read well enough the market maker intentions, I thought I had more time to play longs. I had two, 3-lot positions open. I clicked on an at market close at around 100 gains… Nothing happened, the demo was hanging again. When it came back, it closed out the position with a 0.7% loss. That’s what I call Russian Roulette.
I got pissed, and I started burdening the account to see what a 100:1 can take. I knew I still had time to recover.
On the 16th day I cut the balance above 10% gains still fulfilling the listed criteria of gains, losses & draw downs.
Since G.A. is the root of the next wave structure, where you expect the wave 5 to fail to surpass the furthest point printed on the wave 3 by 4, 16 or 26 pips, you can calculate your exit and reversal quite accurately.
The risk of a secondary wave structure is that Wave 5 would be immediately followed by a strong Wave 1 in the opposite direction.
A Wave 1 for the last time, is when Mr. Maroon gets exceeded with one single impulse move = Market Makers have given their approval.
The overall market direction gets decided by a wave 1 print that is visible on the 1H chart.
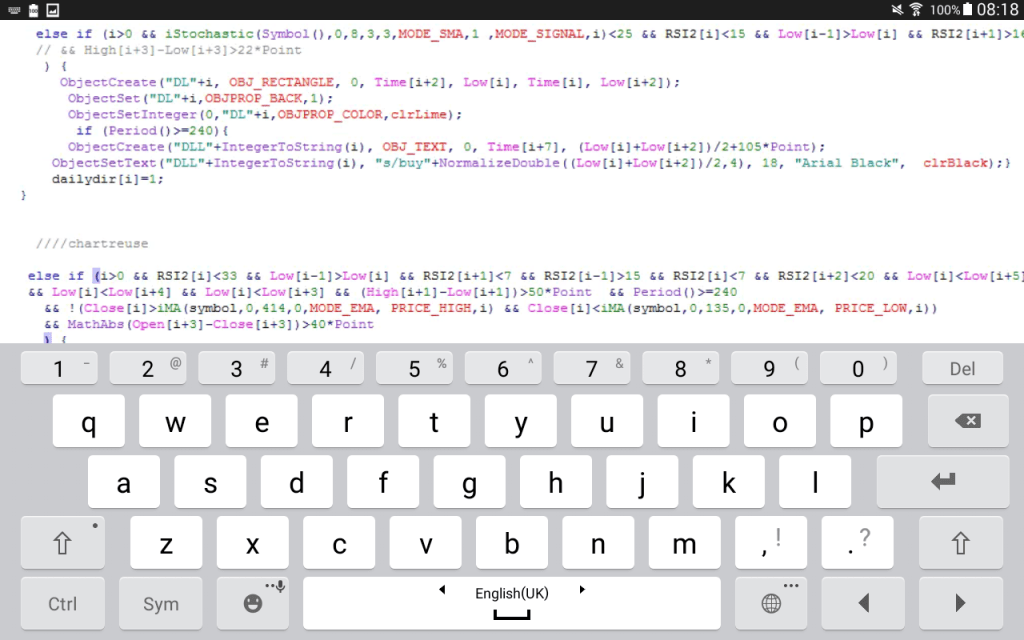
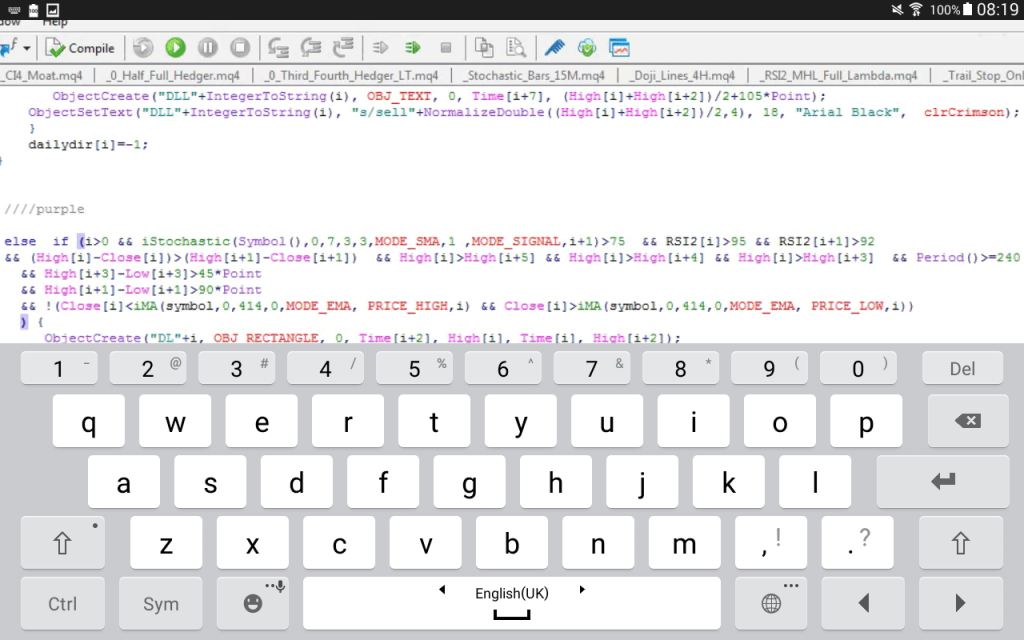
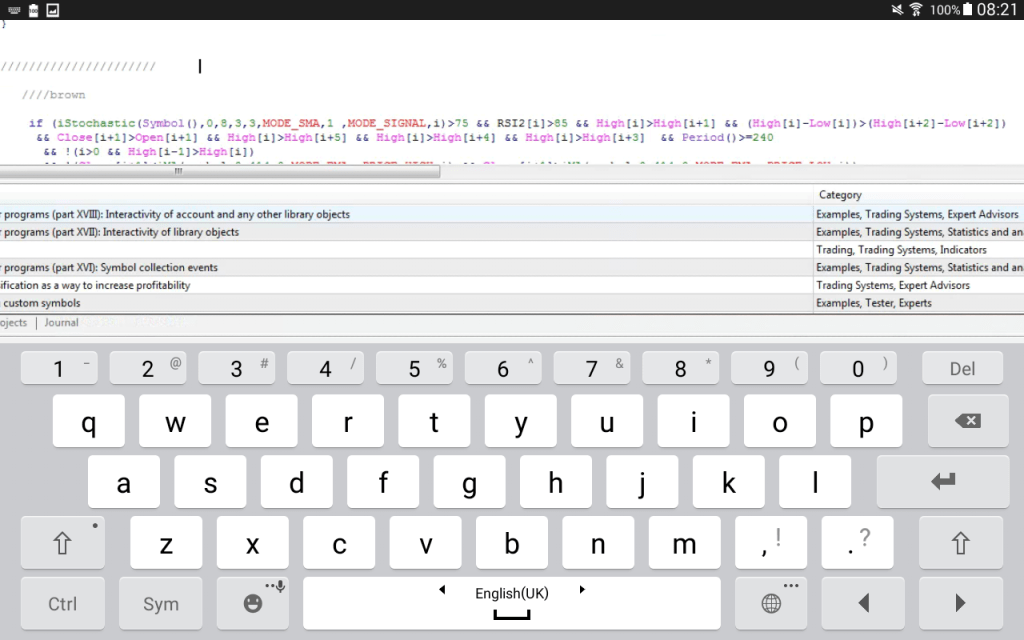
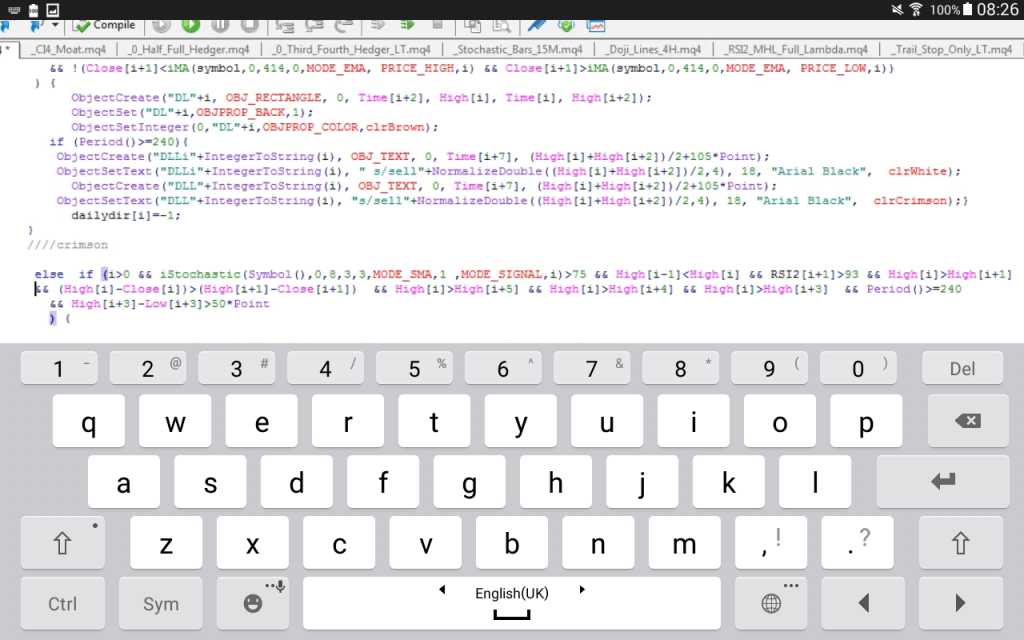
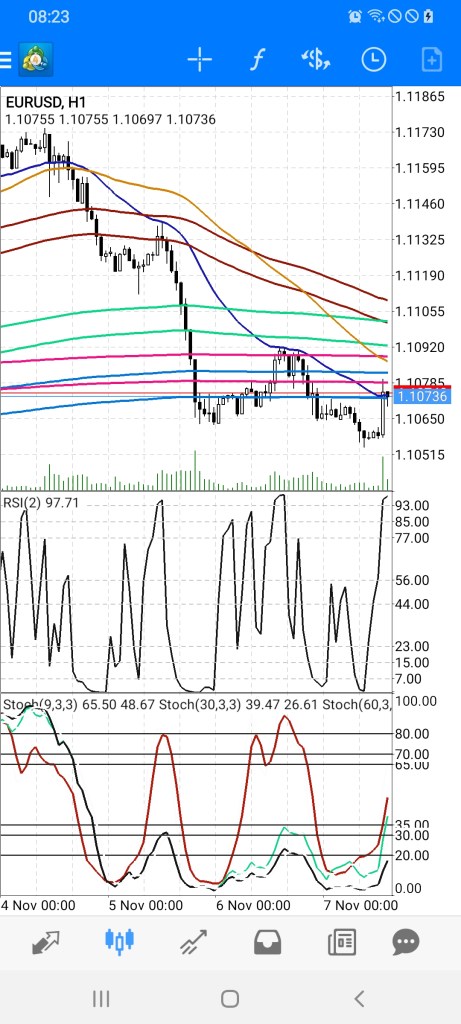
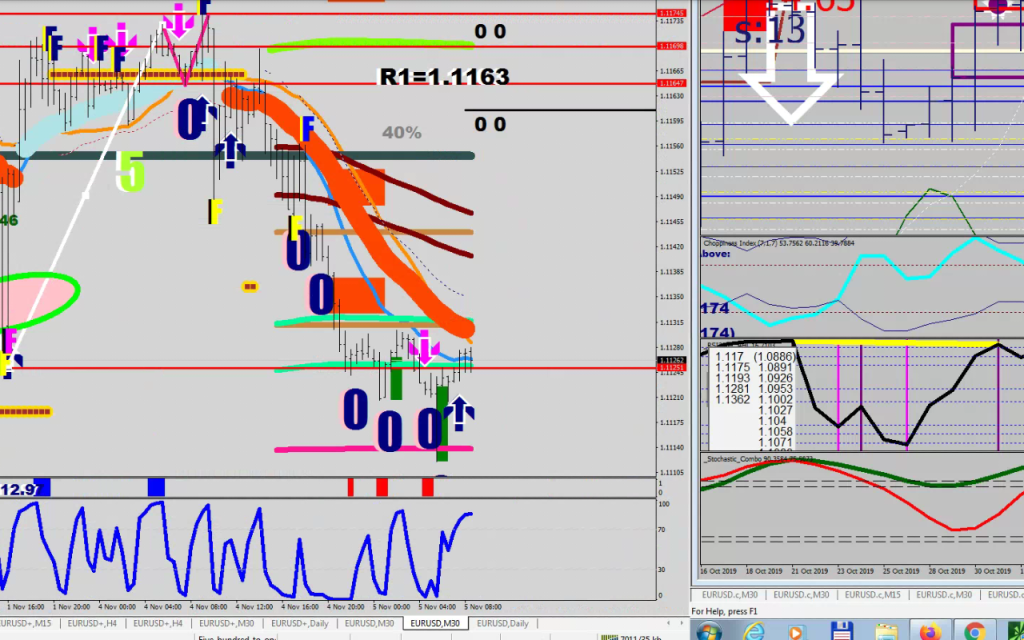
So, step 1 is to plot my Stochastic Combo indicator (will put it up from home) – now with even more plots – then listen and learn.
You would have to plot it as 3rd indicator below to see the additional plots, or change the window numbers in the source – sorry.
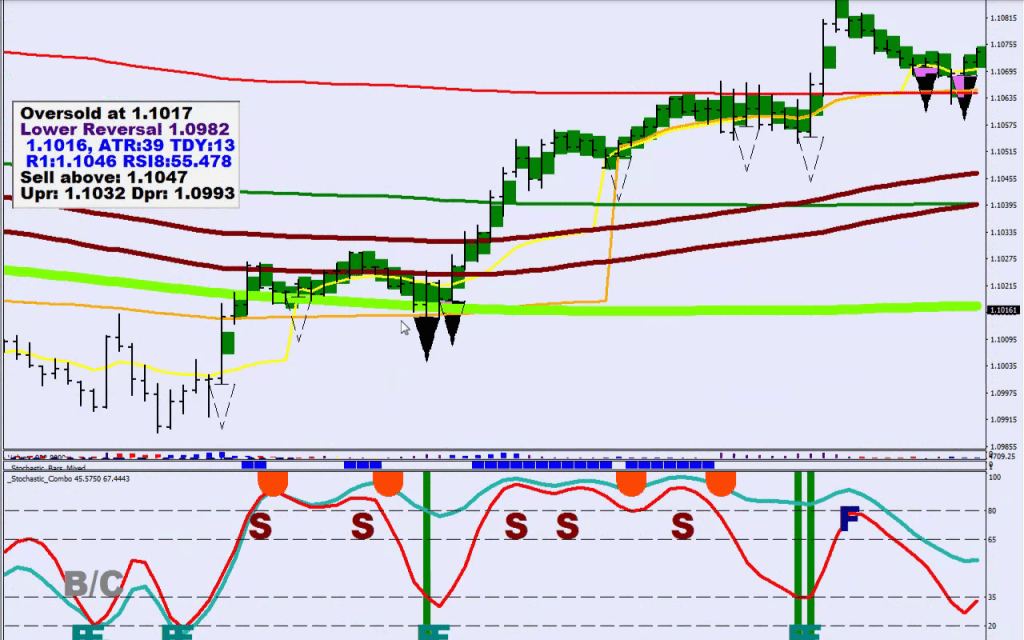
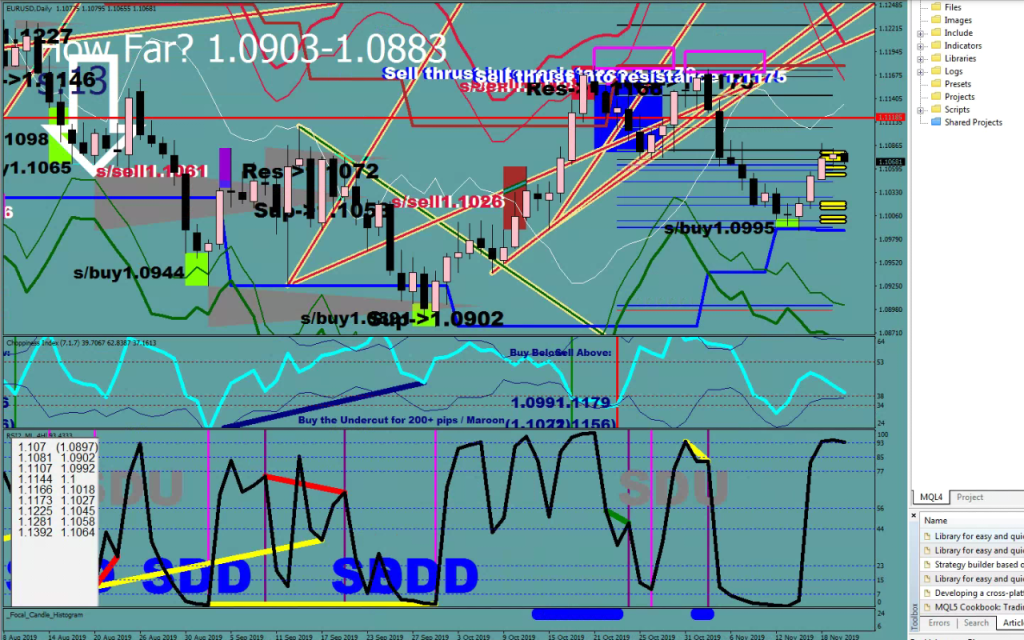
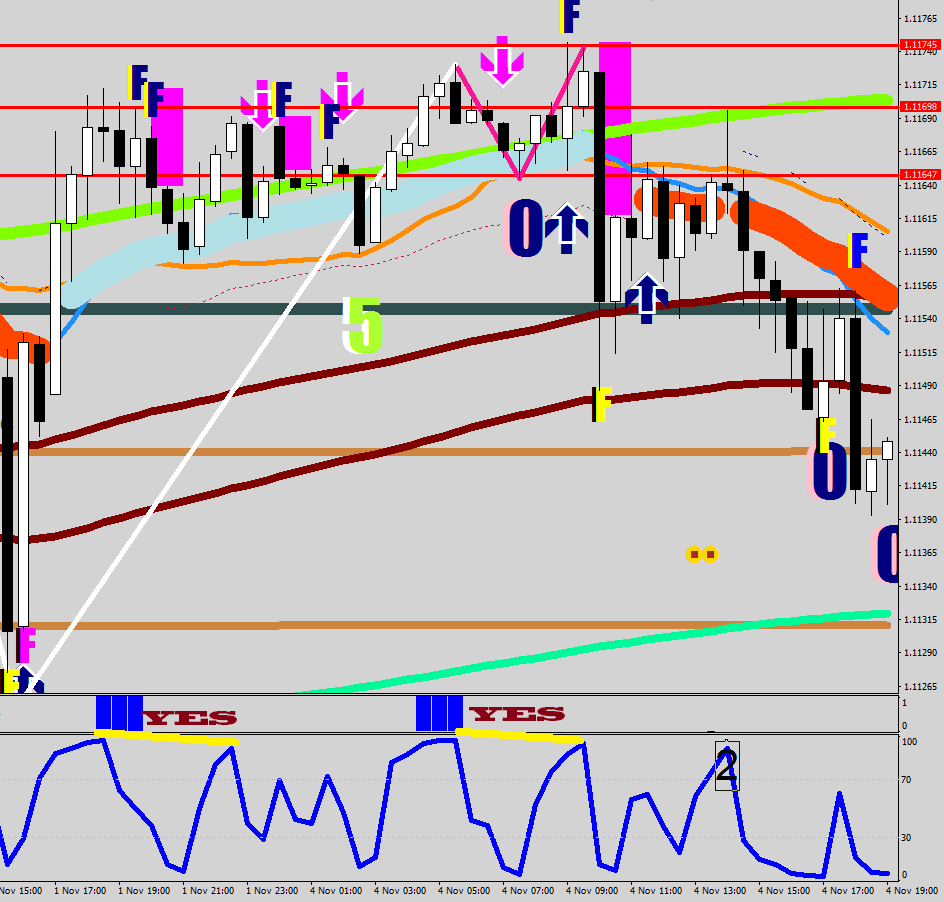
Figure #1
A wave 1 is a full throttle move, which means that both the red and the green stochastic lines make a bee line that connects the oversold with the overbought field. A wave ends in an even split – one line in the overbought, the other in the oversold. In this instance the F and the stripe both meant to draw attention for a fresh overbought sell signal. The next fresh overbought was also a wave 2 of Wave 3 down , and the 3rd blue block happened in the early part of Wave 4.
A turn should start to happen on a lower time frame and start to propagate upwards, but if you saw a Wave 1 print, you must do all in your power to change / reverse your direction holding direction on the separation of Wave 2.
As an exercise, could you spot the primary Wave 1 and the “must reverse” stochastic set up of Wave 2?
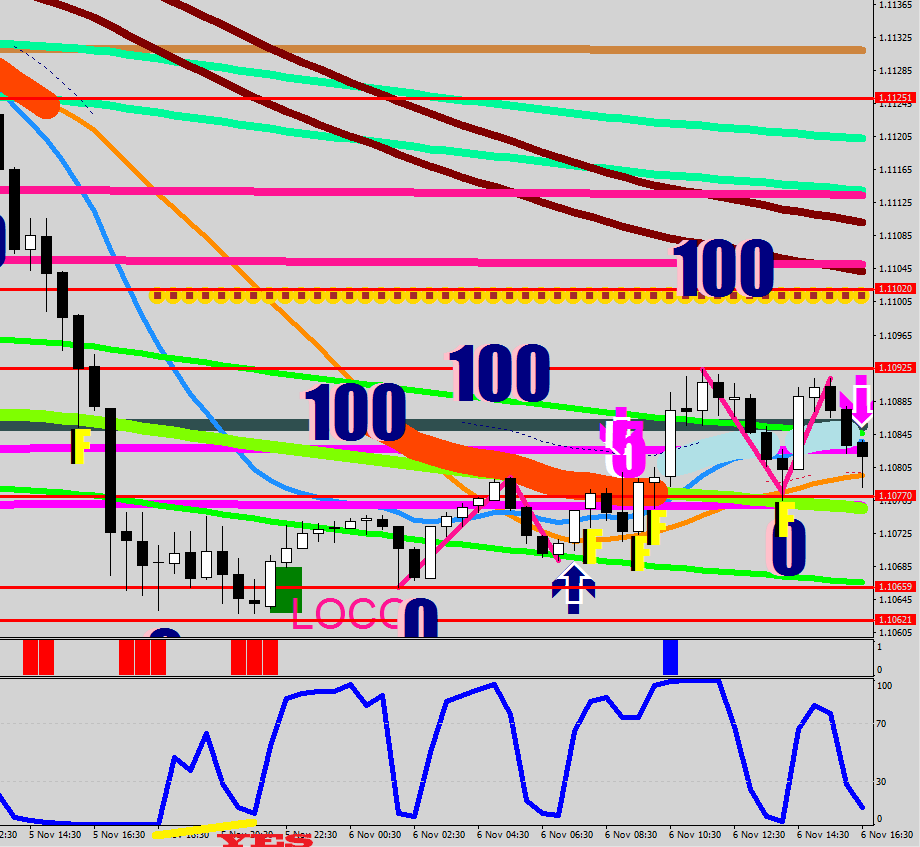
A primary Wave 1 is a Market Maker approved reversal, a secondary Wave 1 does not come with the change the of Wave structure’s direction.
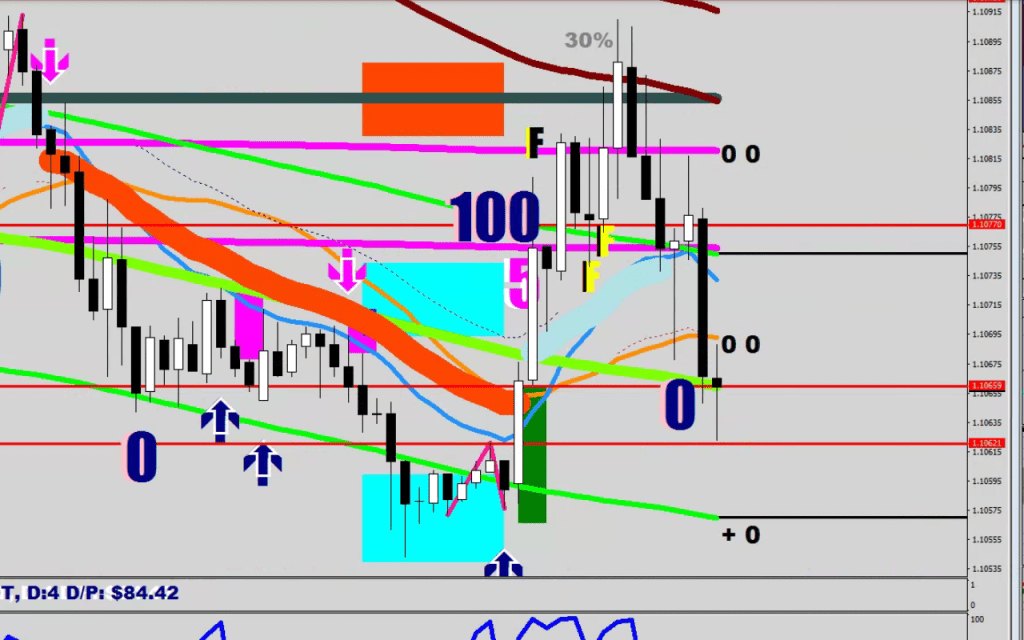
Figure #3 has a secondary Wave 1 on it
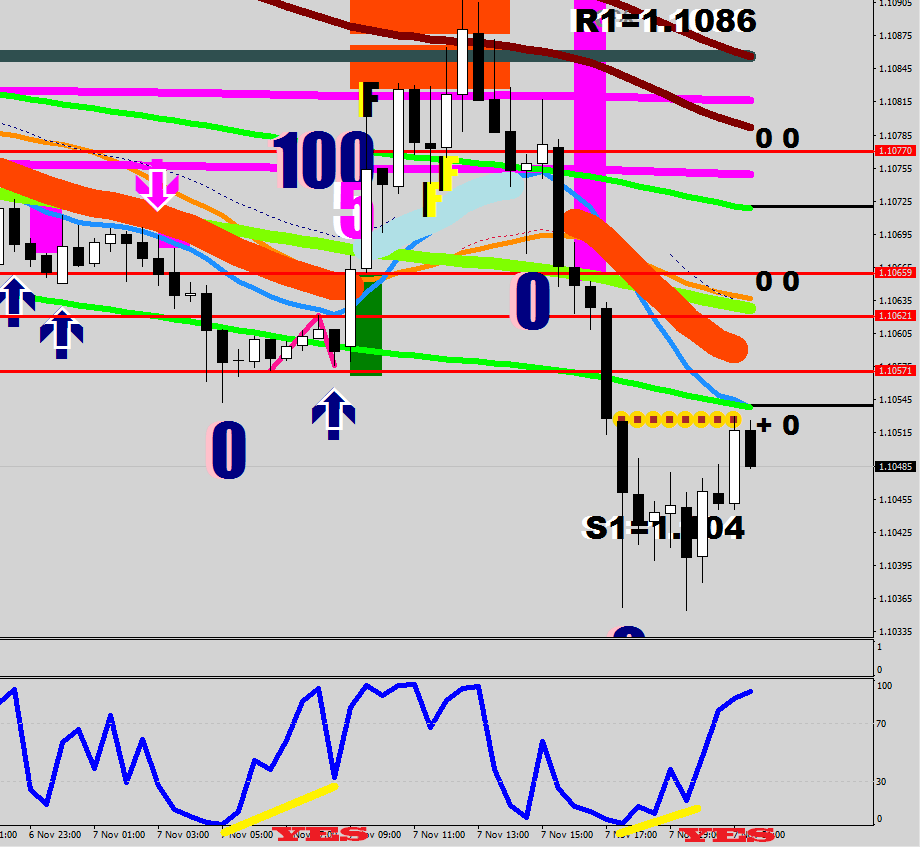
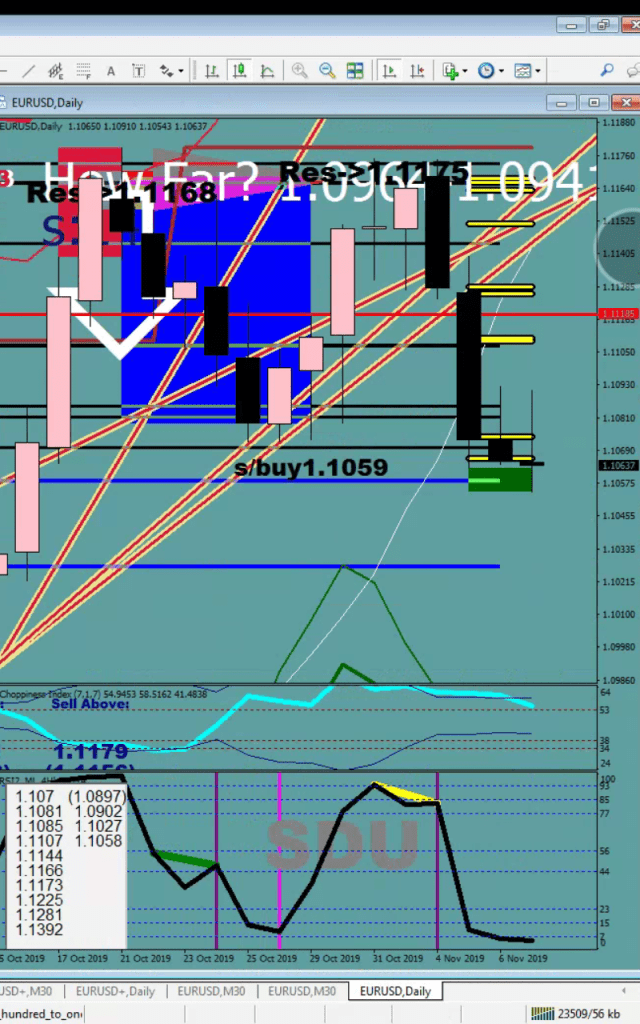
Figure #4: The primary Wave 1 down happened earlier, here
The retest of the Head is an opportunity for squaring.
The following picture shows the three runs on the head, where the market makers had to get their longs off the book.
The same thing took more runs on the downside
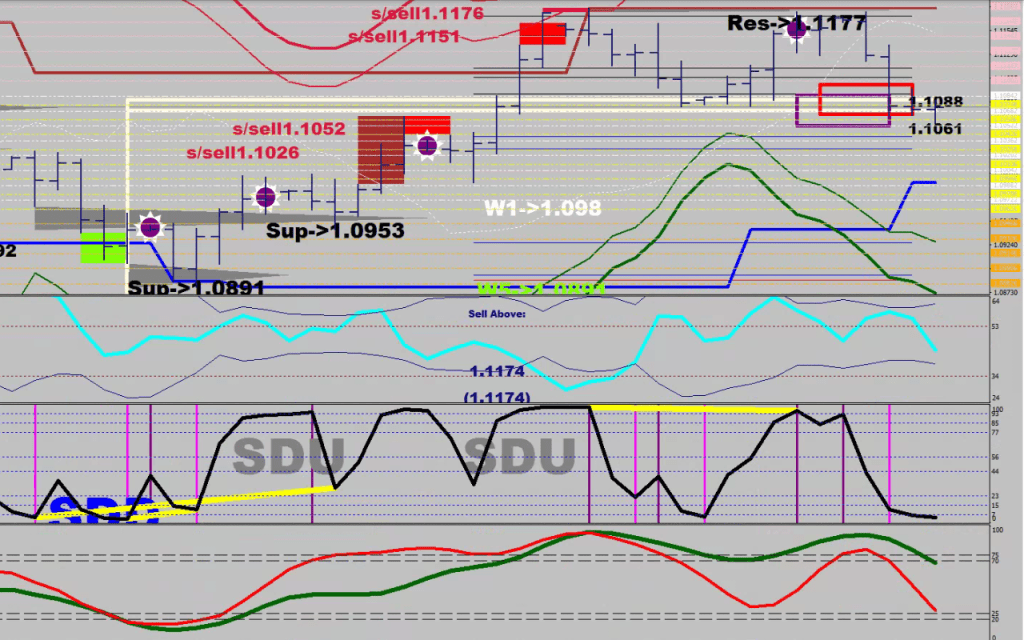
Knowing all of these, where does the market maker reside?
In general, they are closer than the other side of Mr. Maroon, but further then the guard rail.
The second picture shows that aggressive smack down initiated from where the Karma Police would be hanging out: they had to get rid of some more longs, the last three dips were not enough -> on the way up the Karma field got crossed over with ease, finding no resistance whatsoever.
I don’t know if you noticed, but there is serious pinning going on with the Euro today.
Implications.
Today is Wednesday – so they are making someones options expire worthless – or just rake in a great loss such as anything that had its maximum pain level set at 1.10 – i.e. a straddle.
This is only half of the story, for during the peg one can get a great deal on a directional play, such as a 1.12 call that would expire on Friday. These out of the money strikes 3 days into the week (most of the Theta taken out) and volatility flatlining must be dirt cheap.
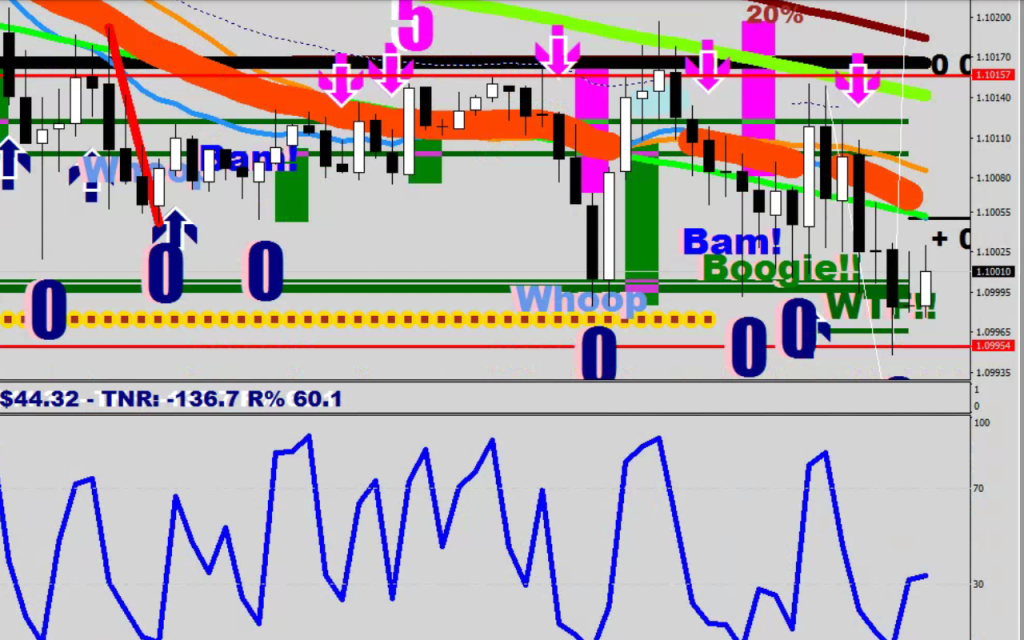
How do you peg the price? You do the opposite as you would normally. Instead of giving fills for everything, you start not giving fills. To get the price stay range bound, you need to open the Volatility Whip wide: on the picture above, after the red tail (that followed the left shoulder) comes the head with the “whoop” print – which ended the wave structure down. Coming out of the head is the V-leg with its full lambda range and the downside whip to match it is the W leg (Bam!). Until these terminal points do not get exceeded by more than 5 pips, you only saw a fake out / failed break (WTF), and this is where you must interfere to put back the price inside the range.
The first thing to say about this kind of a market (which is any market that is not embedded in the long term overbought / oversold) is that neither group has privileges over one another and the lead one may enjoy (i.e. due to a surprise loss of embedding) shall only last until the current move wears off.
By this, I mean that after wave 5 of Wave 5, the tide turns in a big way. And wave 5-s tend to be underperforming, which means that they merely match the terminal point of Wave 3, and often would fall short.
The implications would include the high probability of a reversal in Bull Zone 1 and Bear Zone 1. A range bound market would often be playing ping between the 30-minute LEMA and the 2H LEMA.
For the most part this is a calm and collected game where the parties (bulls & bears) have to wait for their turn.
The monkey wrench is when the strong handed bulls/bears override the privilege for the next move by taking over the tokens of the weak handed bulls/bears around the guard rail, and from 1x stretch they pull the band out to 3x stretch with their continuous buying/selling.
Figuring where you are at in the board game takes tools, such as plotting mowing averages, displacements and counting waves. Additional hints may arrive from the Energy Bands (arguably one of the best indicators ever invented by anyone), and from monitoring for volatility bracket breaches of the consolidation level as well as for RSI2 divergences.
As you will see, applying the knowledge you get here would make a world of difference in knowing what is happening: how far can the market go, when and where would it be turning around.
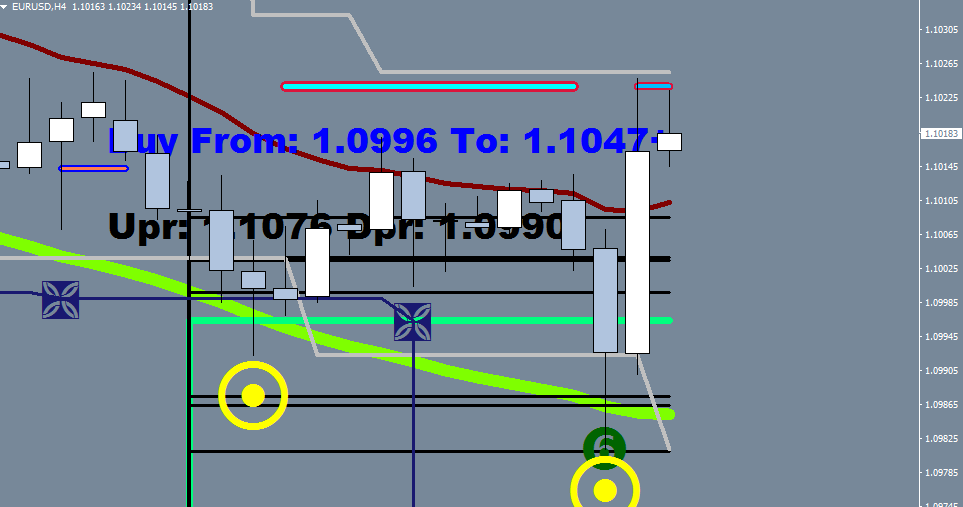
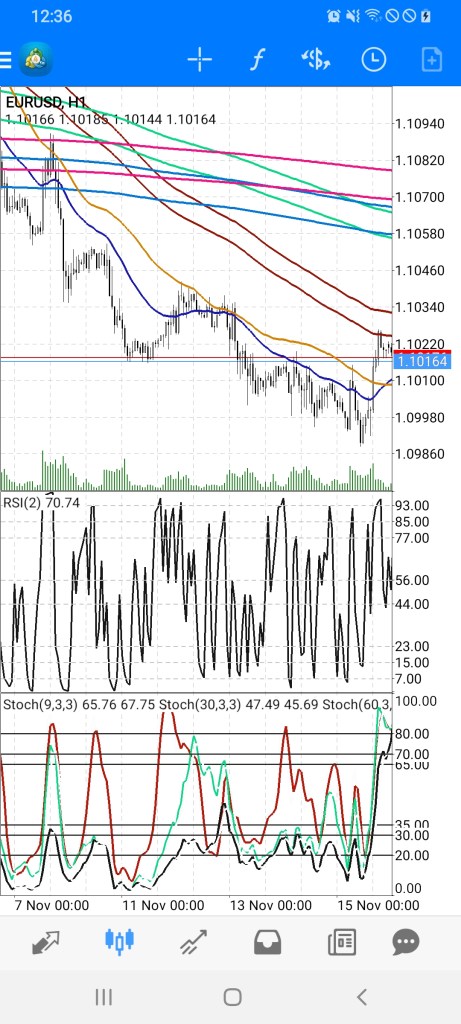
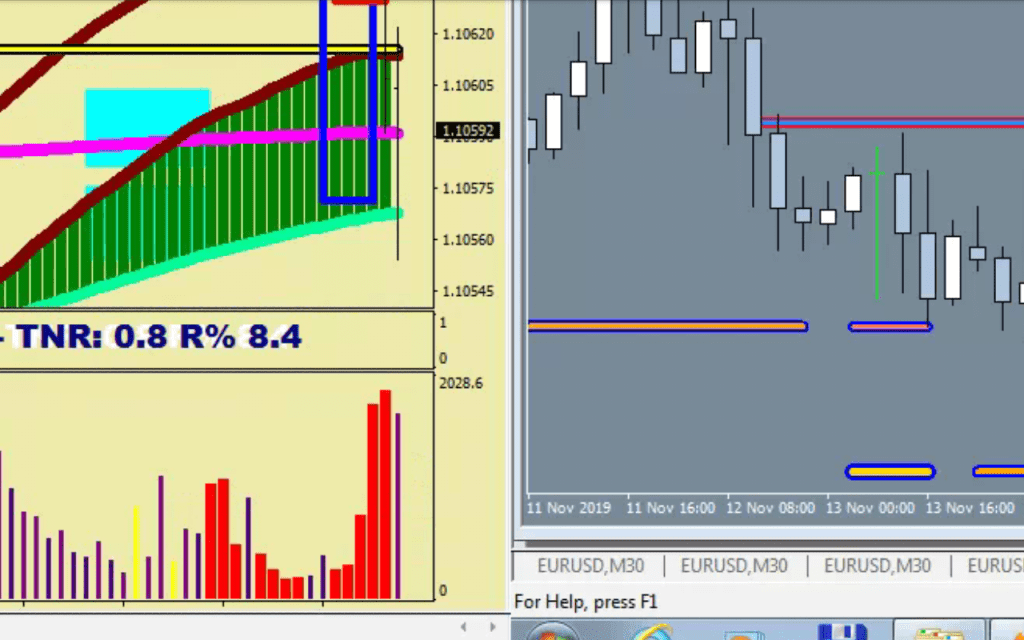
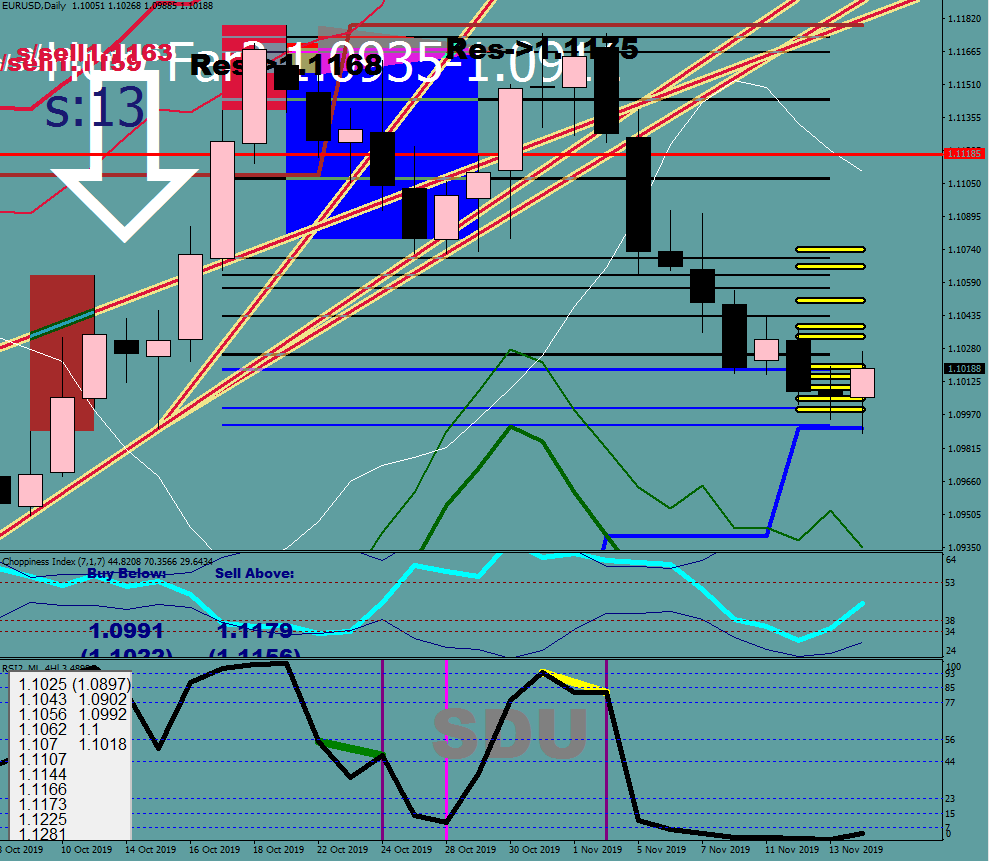
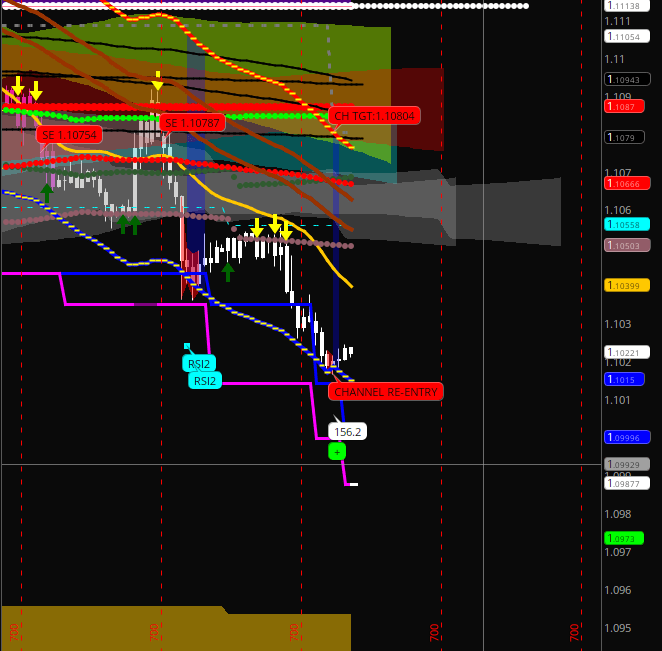
The following image shows you the hit of the Energy Bands, the back test of the high, the daily RSI2 divergence and the volatility bracket breach all in one picture.
Find my LEMA 30N indicator on this blog for the LEMAs, the guard rails and the purple haze displayed on a 30-minute time frame correctly.
Plot E-16, which is E-32 on the 30 minute. When in picture based on the Daily, 4H divergences and breaches, we are working off the 30-minute.
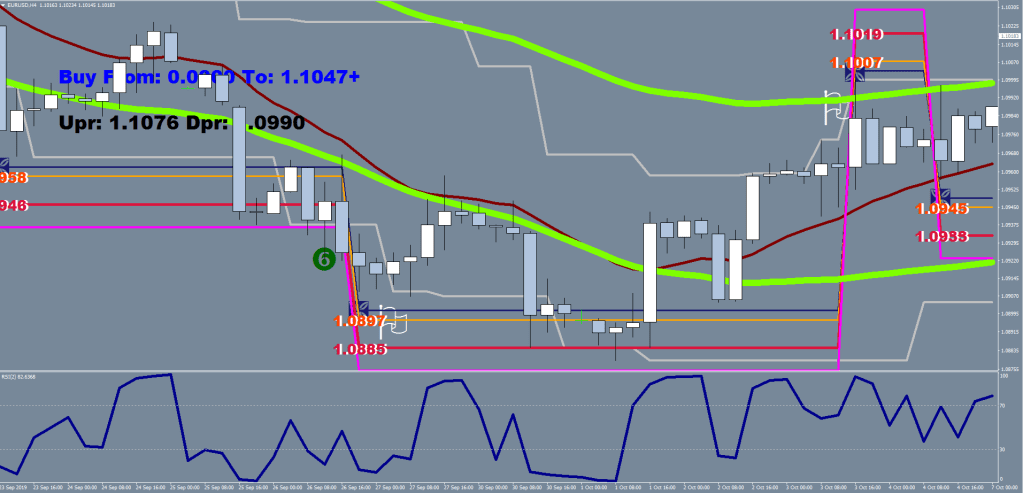
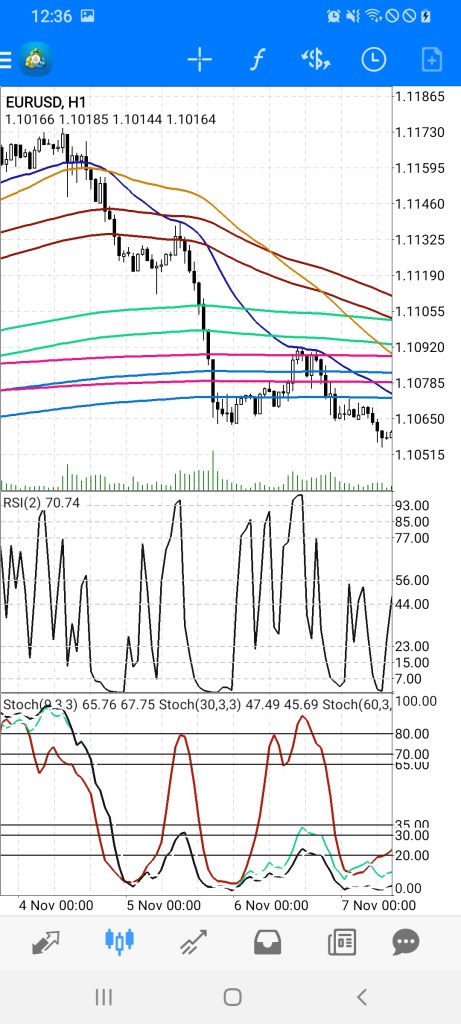
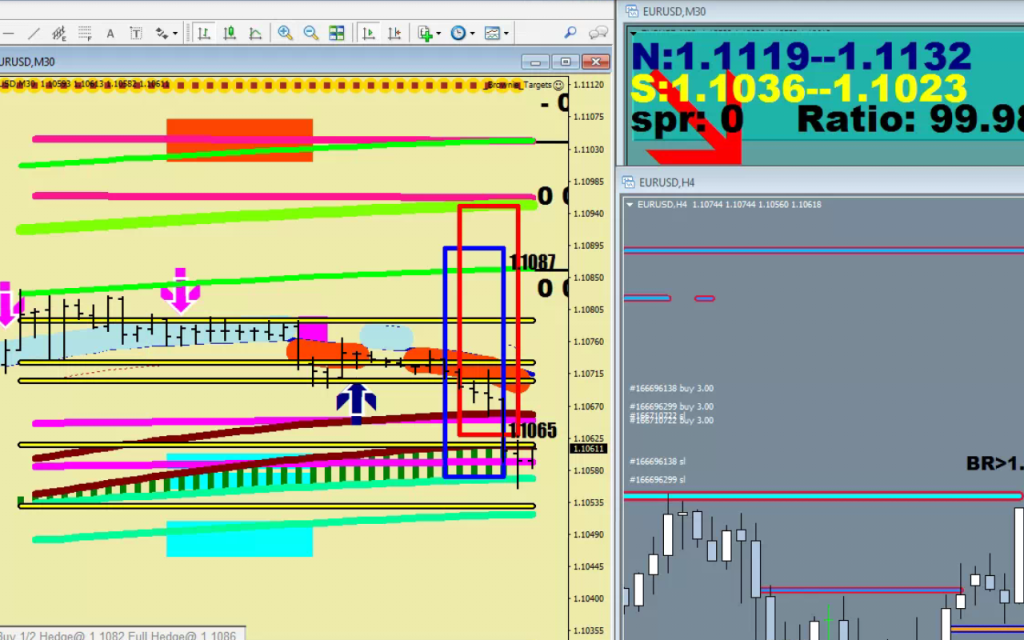
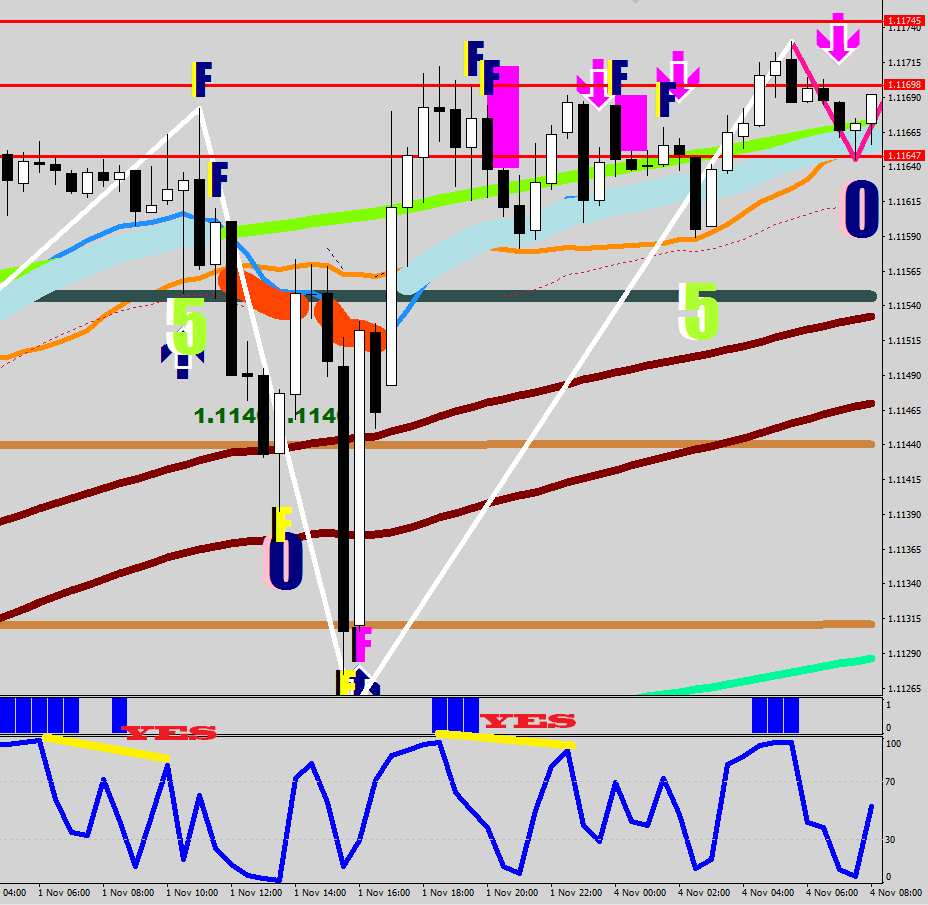
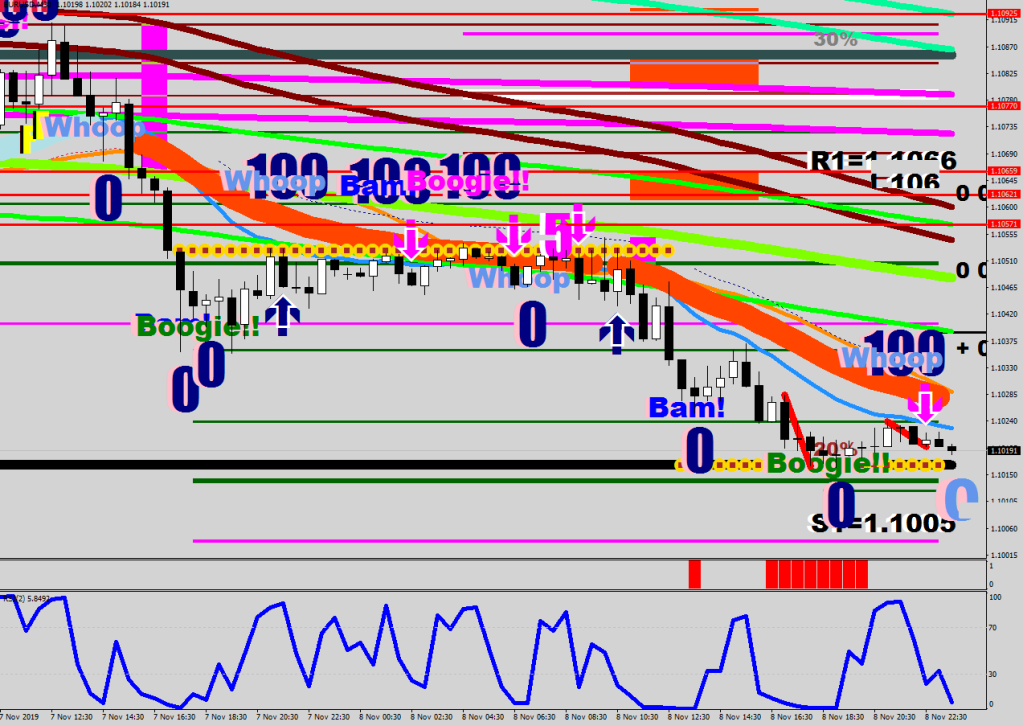
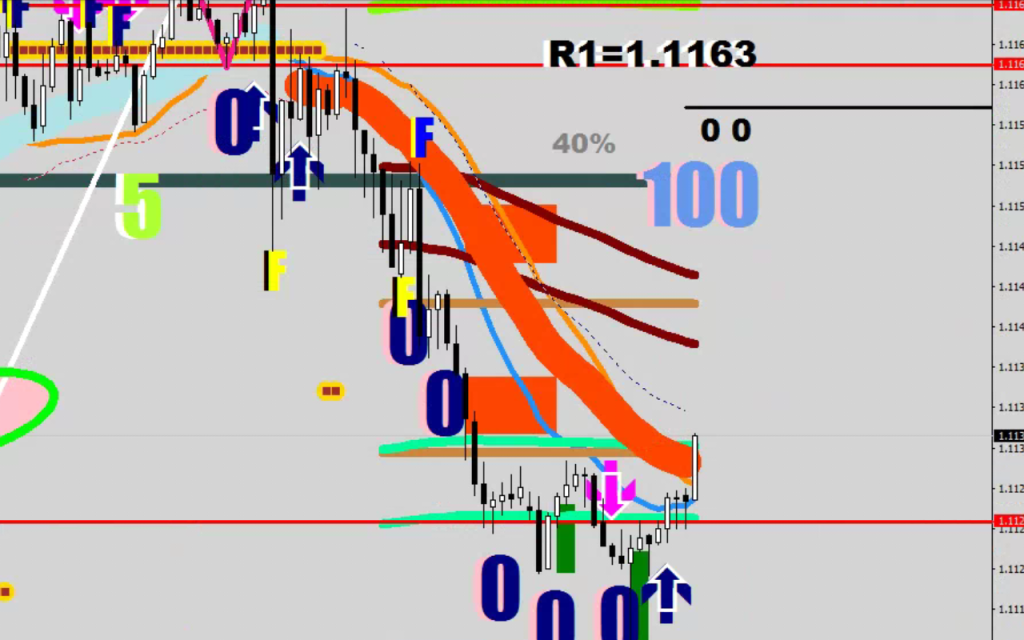
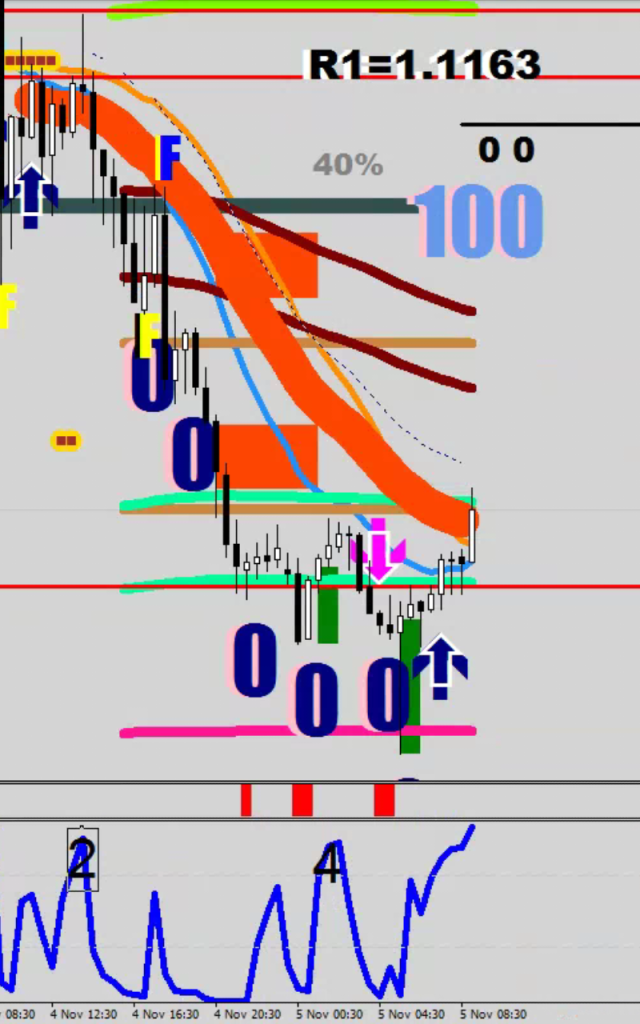
The following image shows a not very typical, but symmetrical wave structure down: both Wave 2 and Wave 4 hit the E-32. You can clearly see the whoop-bam-boogie peaks of Wave 4 on the RSI below, but to get the structure right, for Wave 2 you would have to zoom in to 15 min.
As an actuality, check out my the blog entry, “..in Acapulco”. Where I calculated the target using a fractal sequence. Look at the date of the post and the outcome as well.u
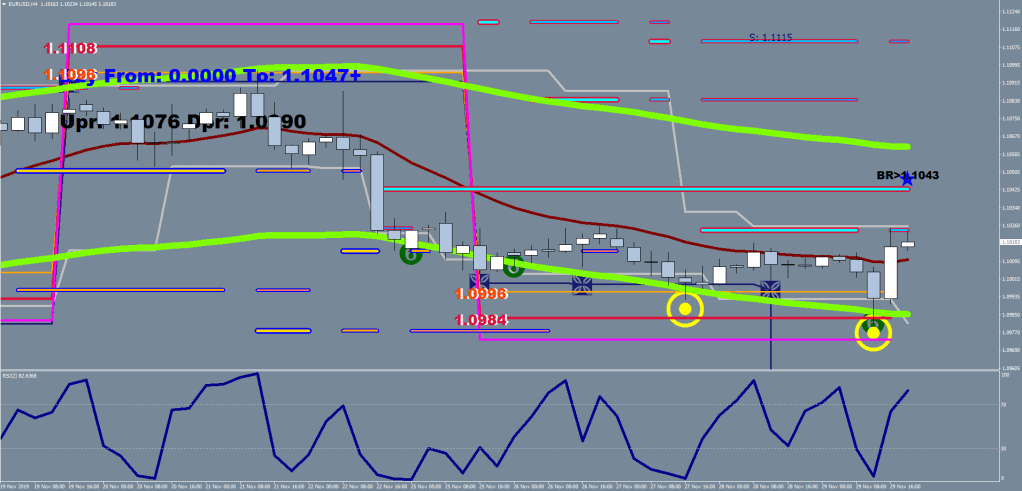
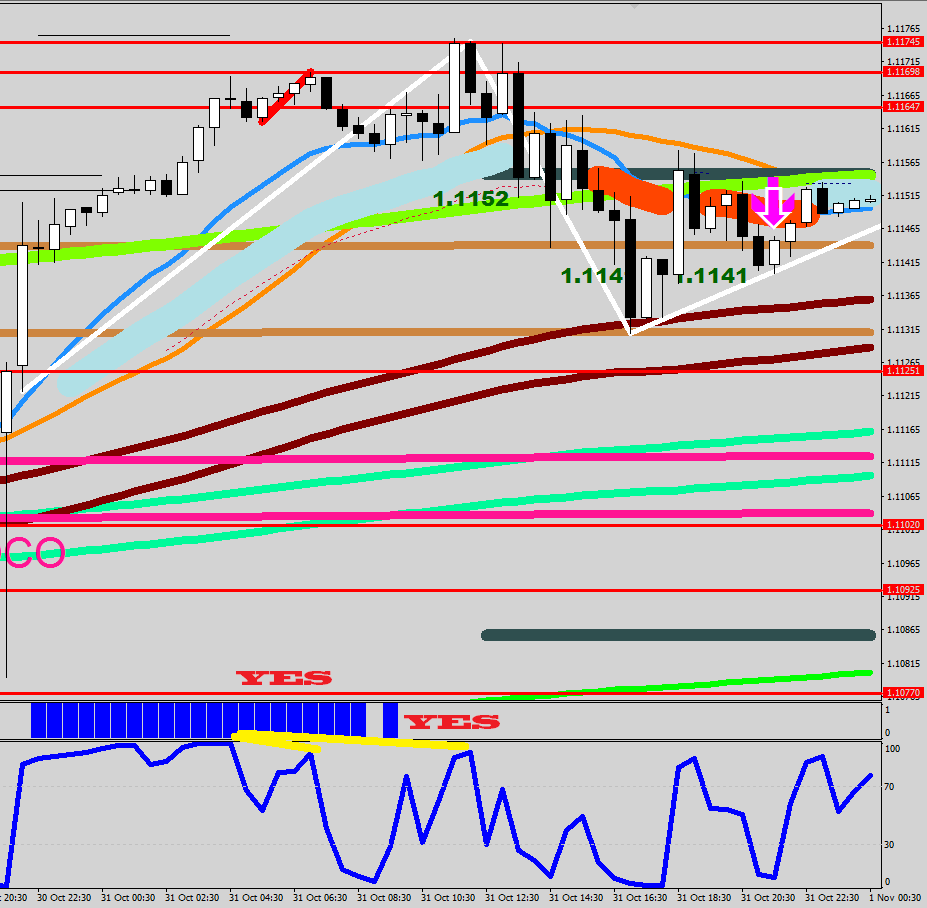
…Wave 2 down made – think Pivot, think fake out of 4H doji. A Wave 2 can also exceed 100% retracement of Wave 1, so factor in this possibility. This looks like a scare on the Volatility Whip.
What makes this move up a Wave 1? The fact that it managed to fake out Mr. Maroon. If you think about it, Wave 1 & 2 can draw a whip as well, but on a larger scale, which would mean an enormous bear trap.
…so this was the Monkey Wrench I just mentioned. Look up my entry about Trading Bear Zone 1 for further info about the rules that apply here, such as:
Sell after Whoop, Bam and Boogie finished making sandwiches in the kitchen.
Also, pay attention to the red tails at the end.
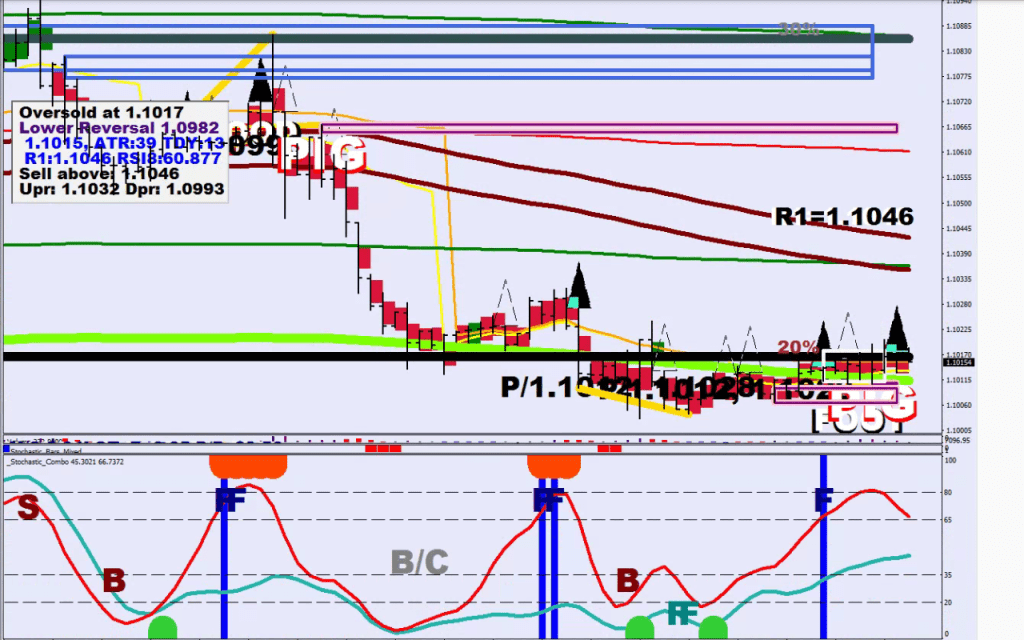
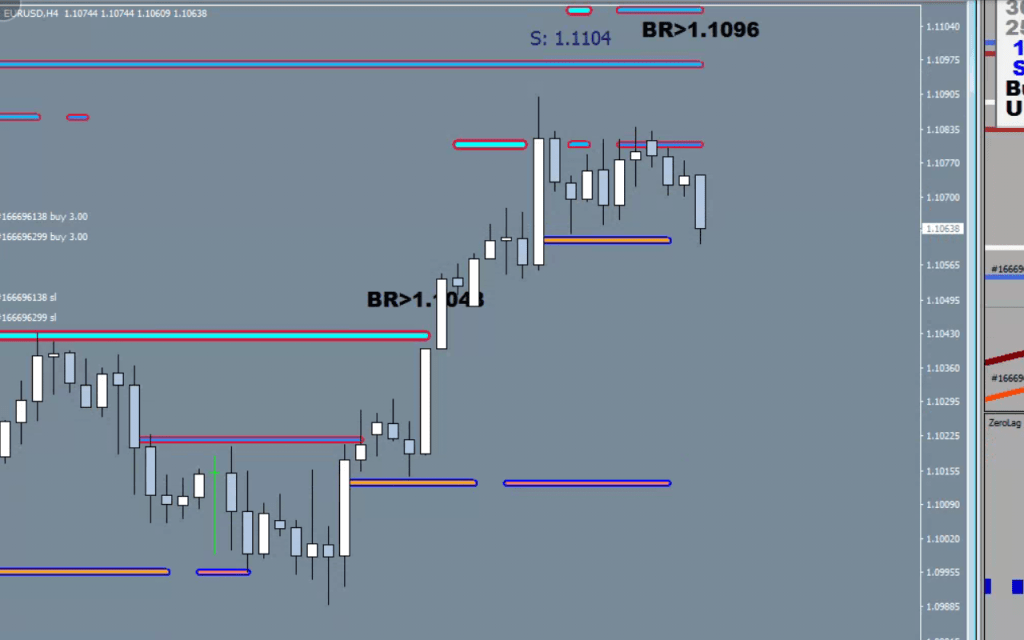
…the path of least resistance summed up in one picture
We left off with calling an end one hump early – not that this changed much: both failed breaks fell shy of five pips extra. So the Volatility Whip correctly had the whip leg longer this time, and after a quick fake-out of Mr. Maroon this head served as the terminal for wave 2 up.
Whoop, Bam, Boogie, and #5 matched up perfectly.
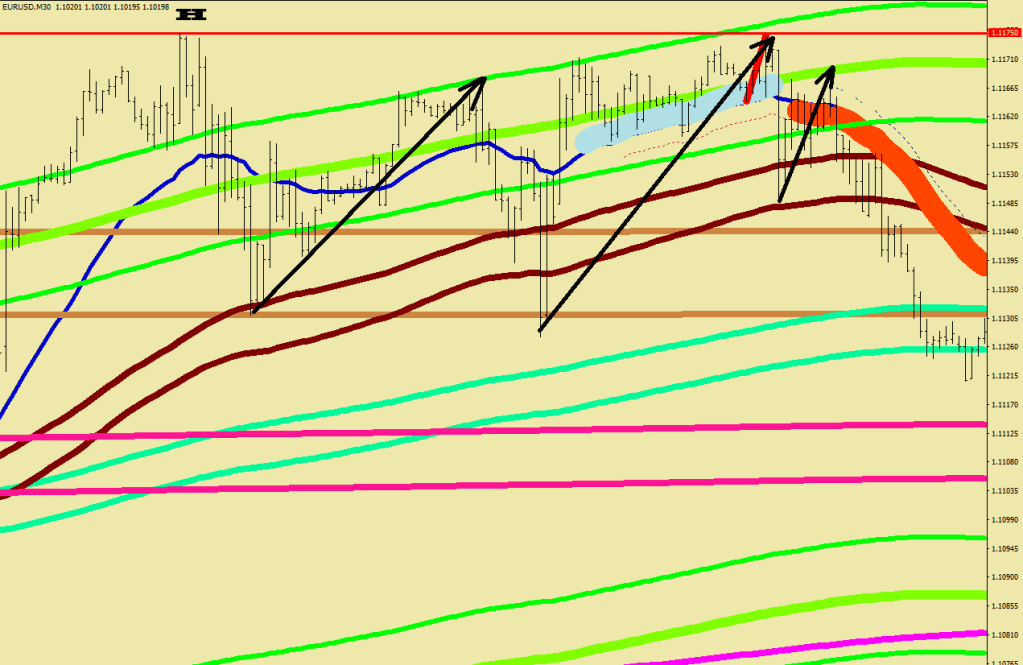
The topic of this entry is to be able to spot how the thrust follows the build up in a wave structure.
This would be a good time to call in the clowns candles.
You already know where wave 1 down started: it came after the volatility whip. It ended in the thrust at the end of the same thirty minute candle, so in order to see the blown up structure of black candles plus the thrust wick, you would have to go down to the 5-minute timeframe, and we are not going to do that now. The previous article should had given you the feeling of how things were speeding up gradually.
Wave 2 and Wave 4 ends I marked up with the numbers.
What you need to appreciate here is that Wave 3 had two of the black candle streaks followed by a thrust each (sometimes you would see one big bodied candle if your time frame is too close to print a wick, but this is the same thing), but between the two the RSI2 did not register enough strength to call a wave. Your reference point is the read on wave 2, and if that one is barely visible because of the wave’s steepness, go to lower time frame again.
You can also see that there were 3 Full Lambdas (3 diagonal cyan lines) down during the move, since there was no shot over the bow in the middle of wave 3.