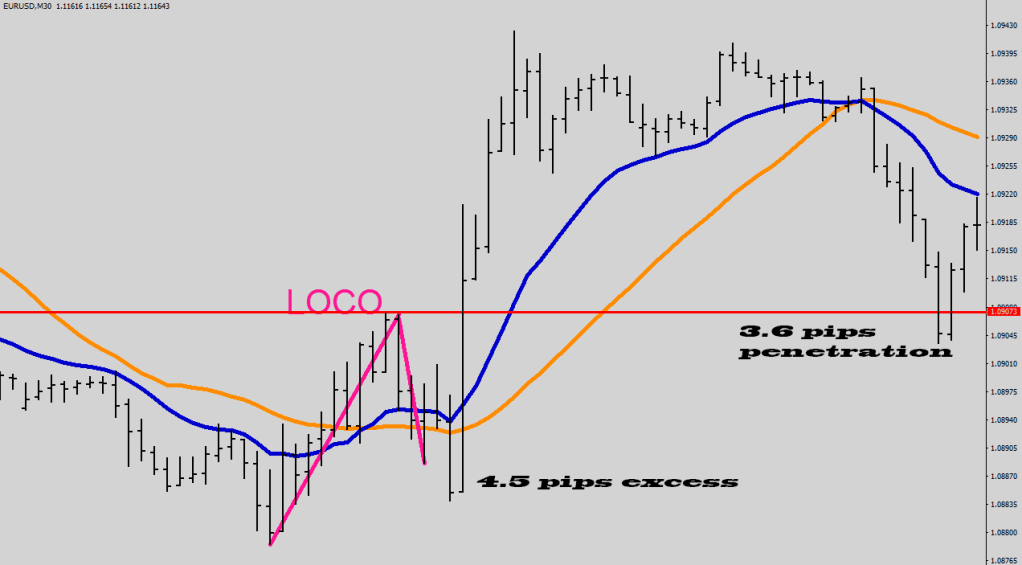
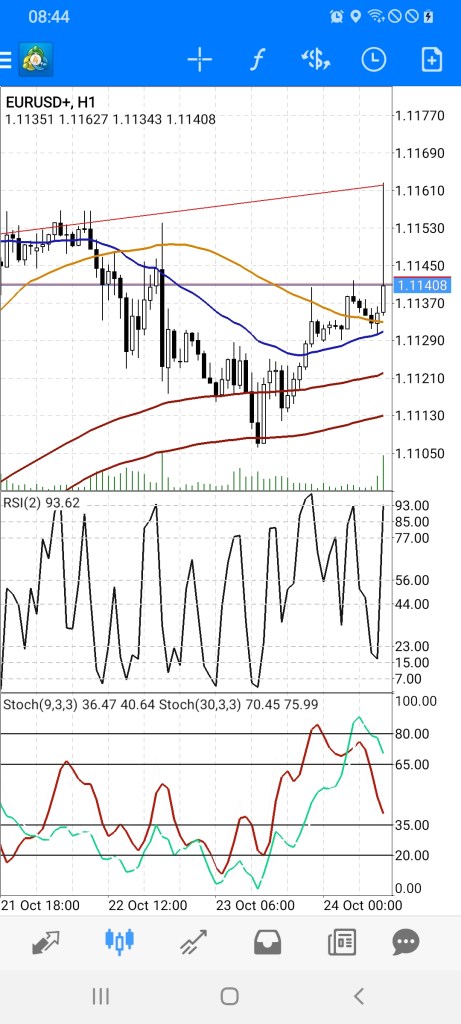
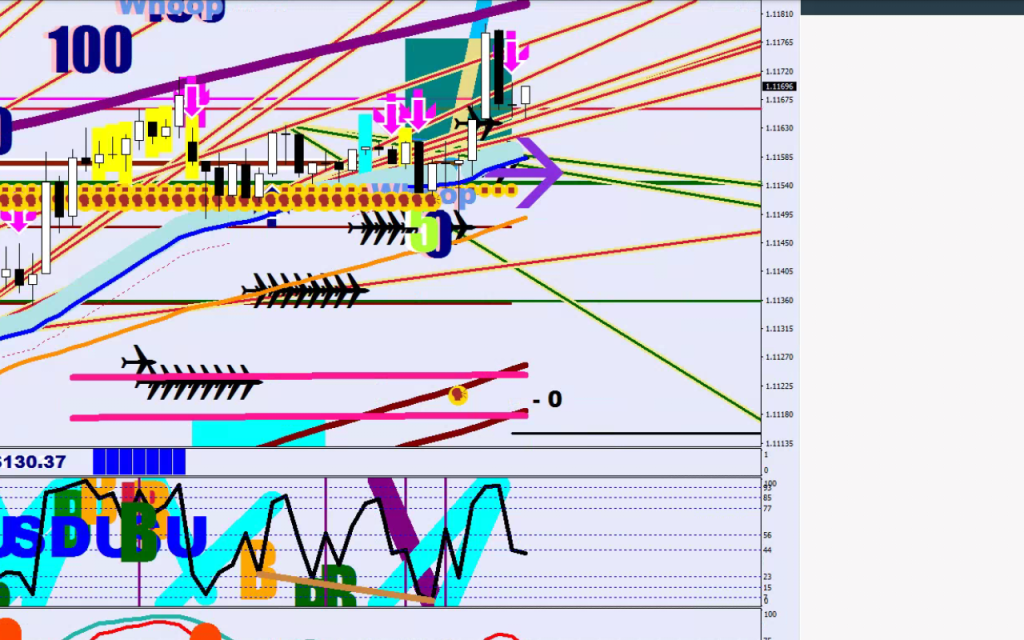
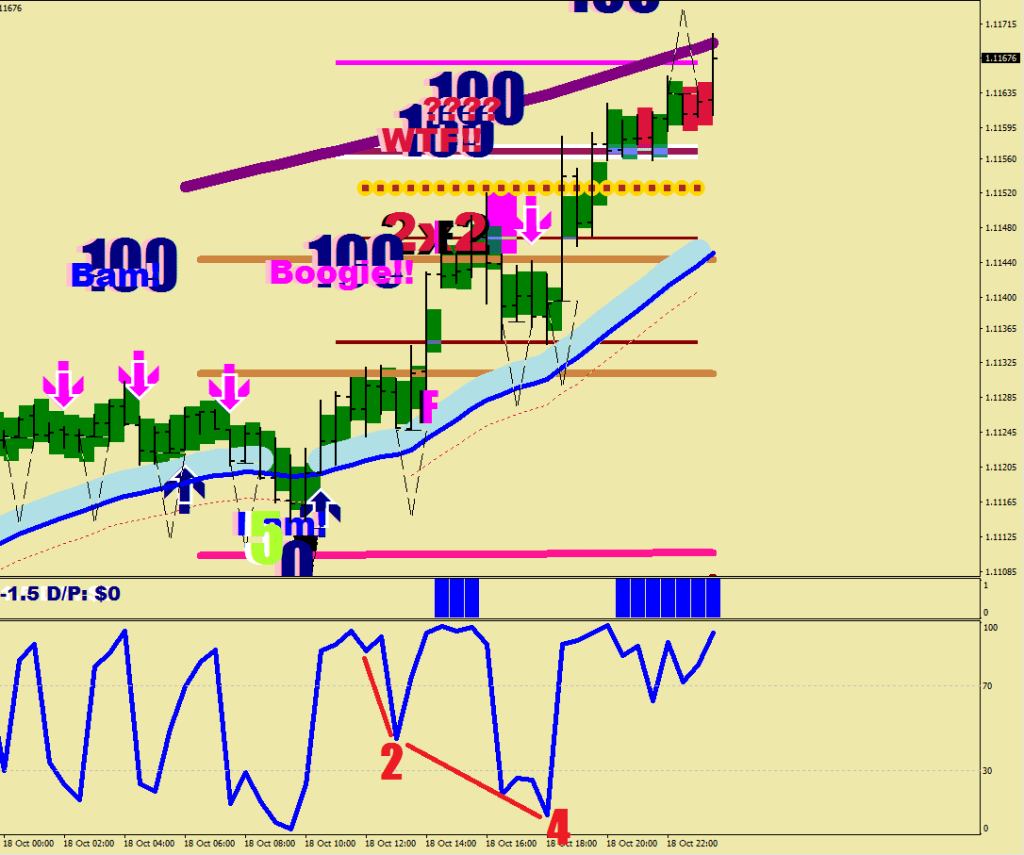
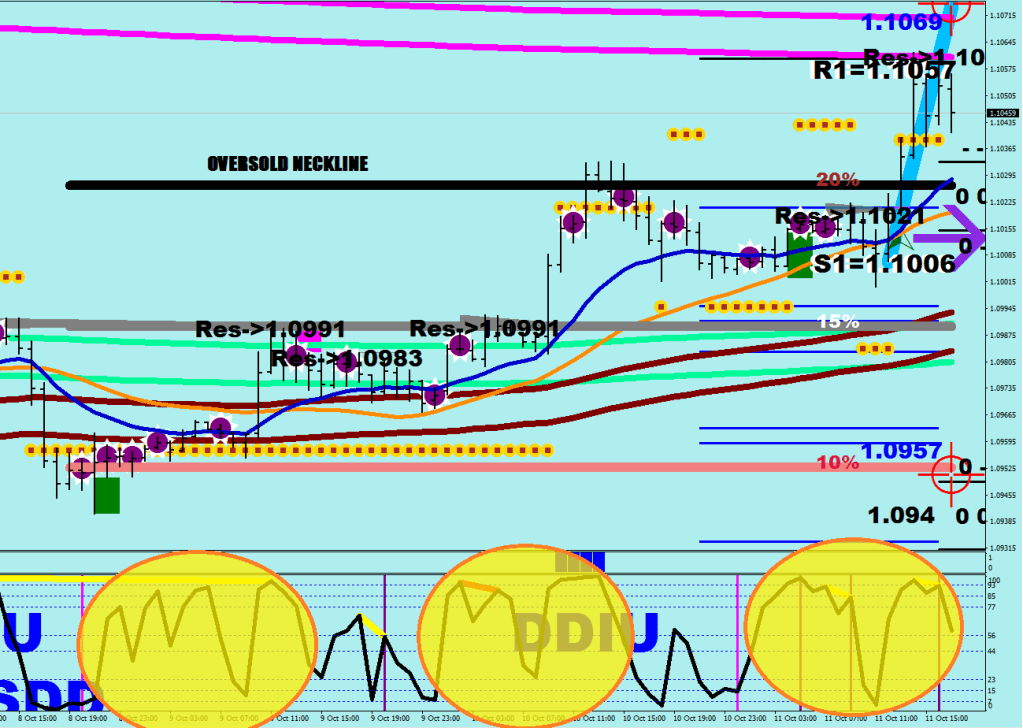
Figure one shows a Volatility Whip (VW) in deep pink after a wave structure ended to the downside.
The Lock Out Close Out point is at the end of the V leg.
1h time frame
The W leg does not taken out by more than 5 pips, so this is a failed attempt to the downside.
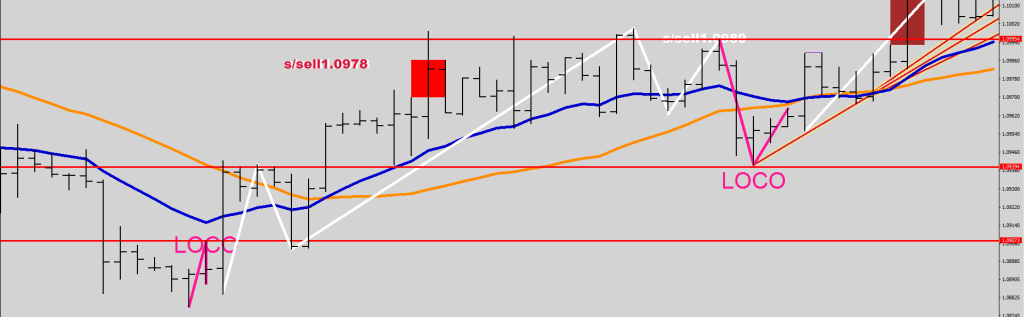
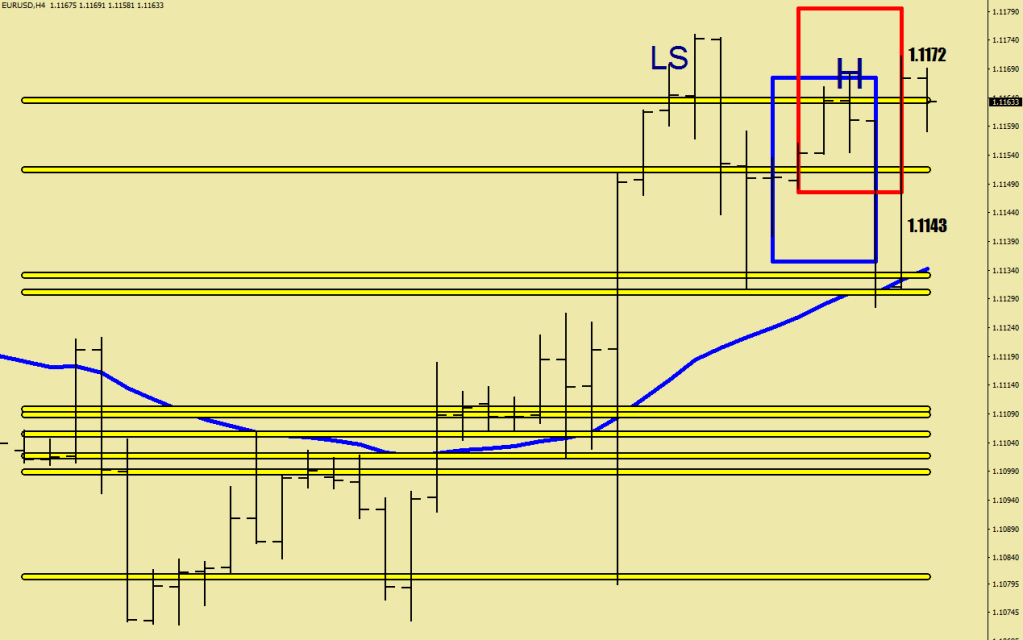
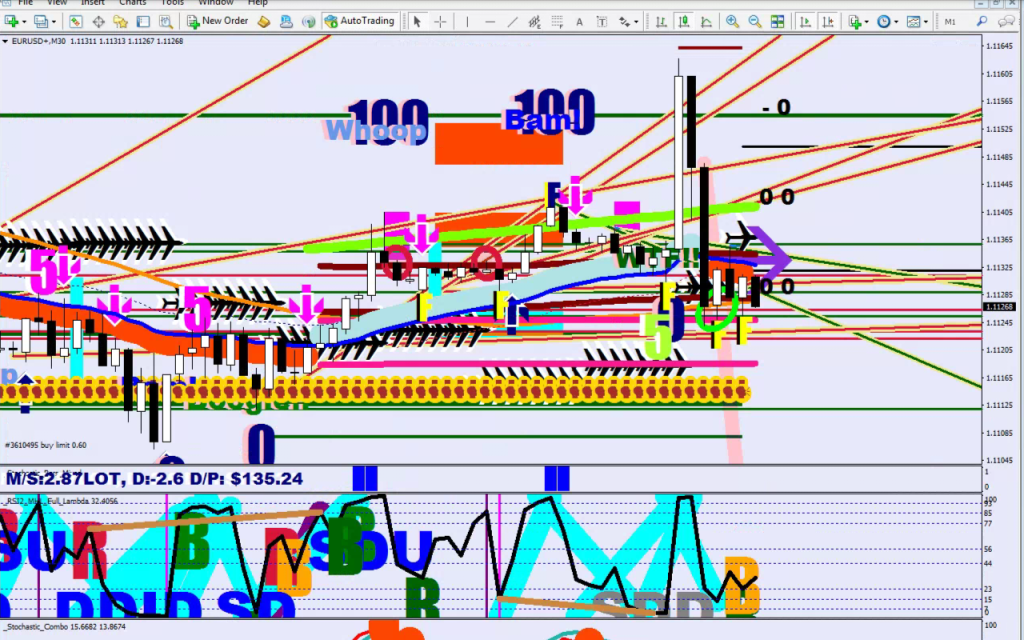
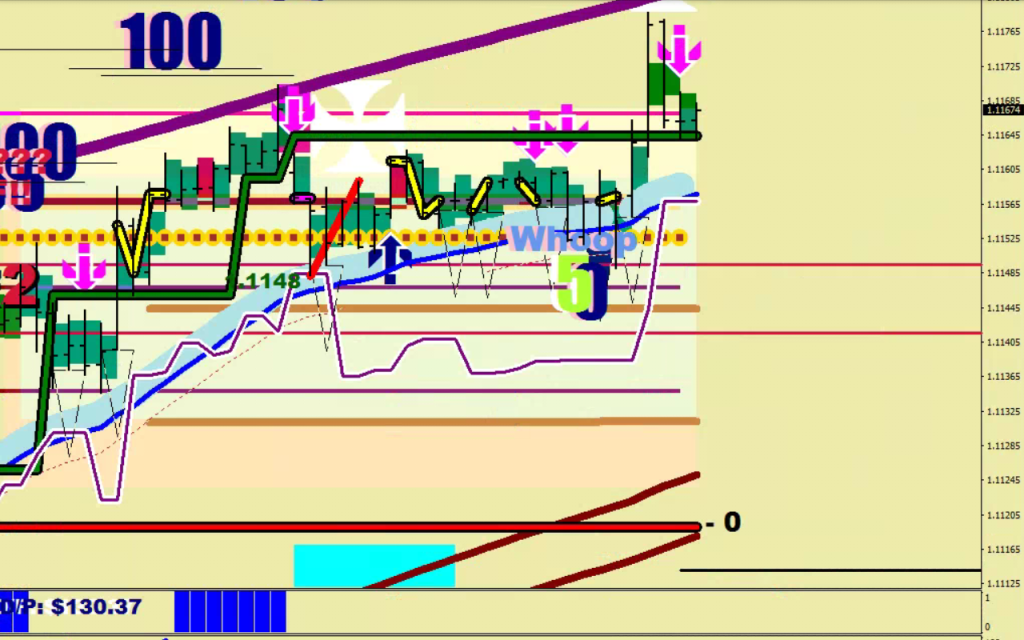
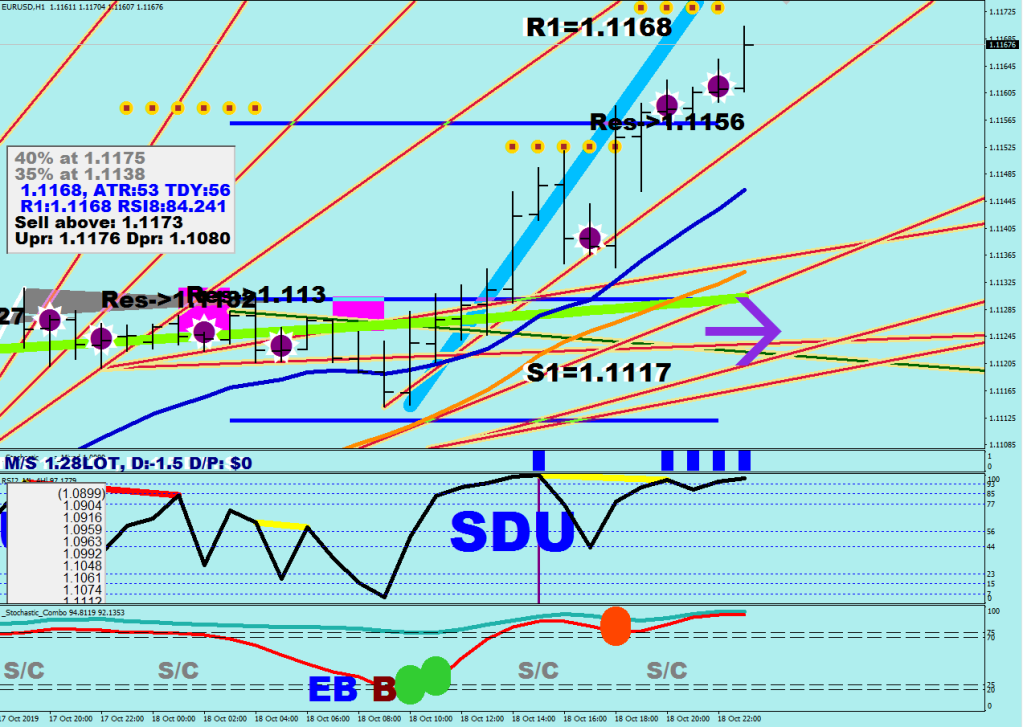
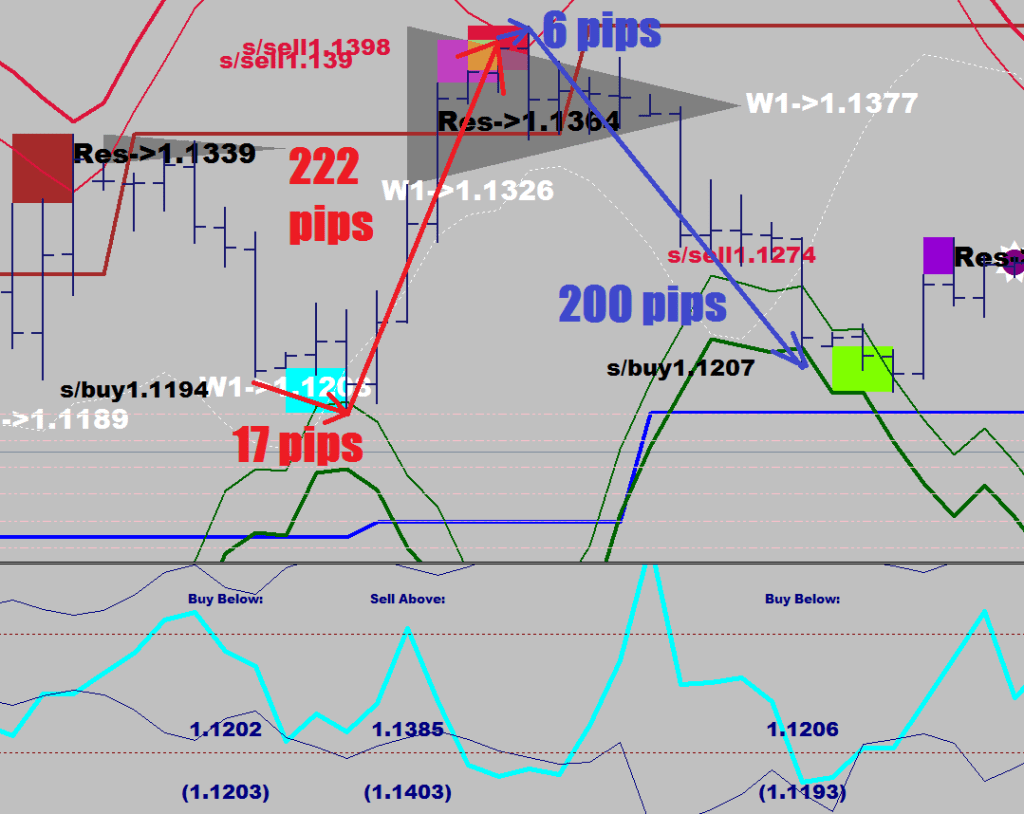
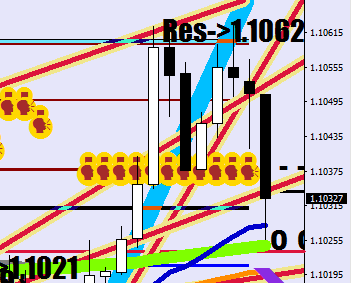
Figure two shows the new wave structure starting from the excess and after wave 3’s three-push rampage, the wave 5 single blow’s rebound is already a V leg. Since the structure was to the upside, the LOCO point would be on the bottom.
The starting point of Wave 1 is inside the V leg and is the first pull back of the W.
4h time frame
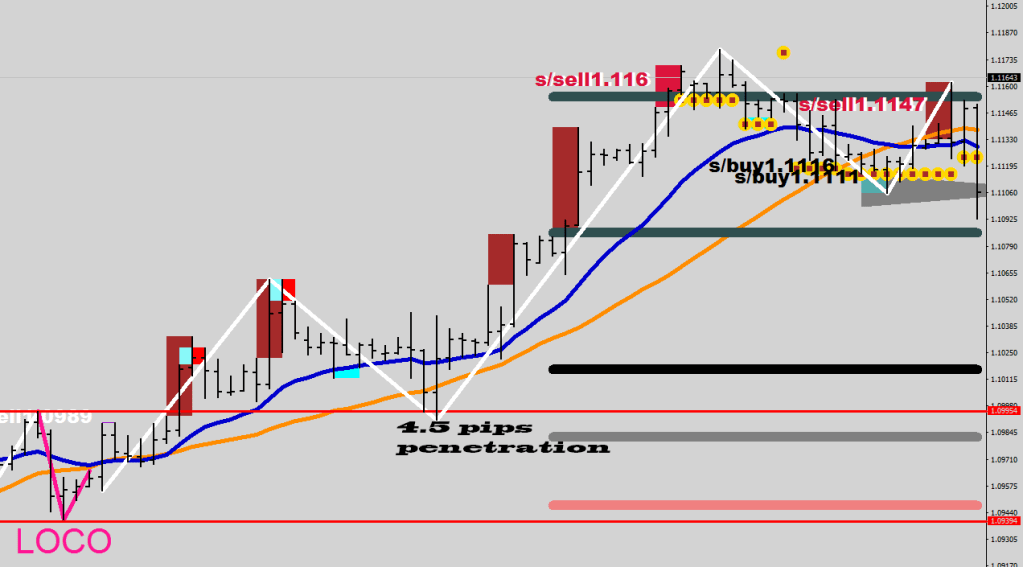
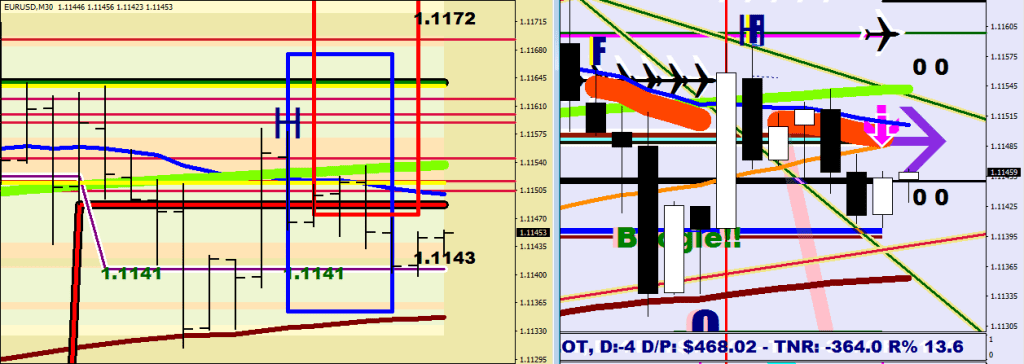
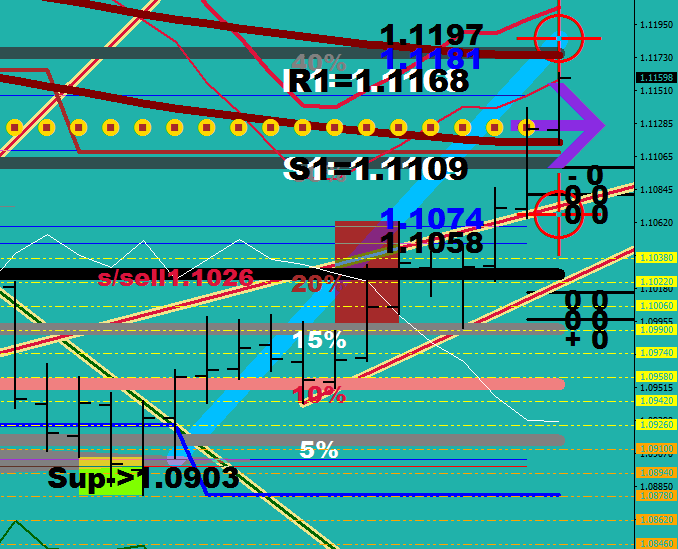
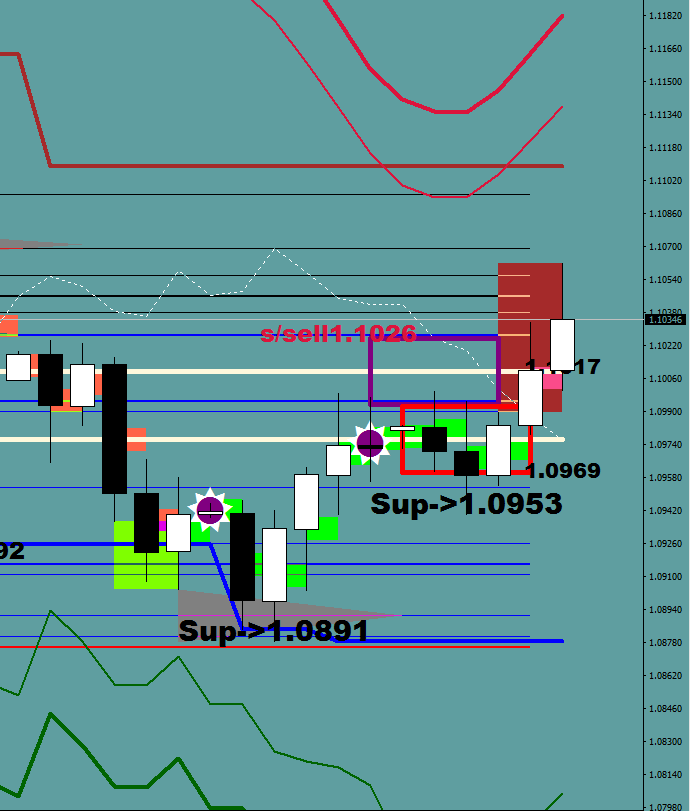
Figure three: Wave 2 gets picked up upon the penetration into the last V leg within 4.5 pips .
4h time frame
The market shifts gears, things start to happen faster.
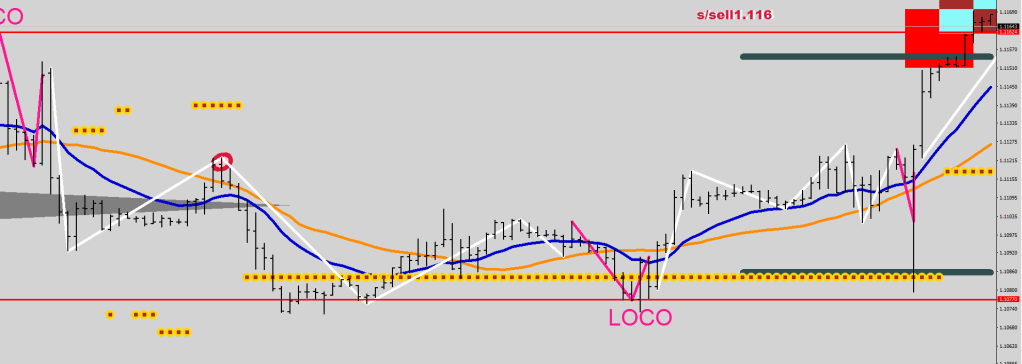
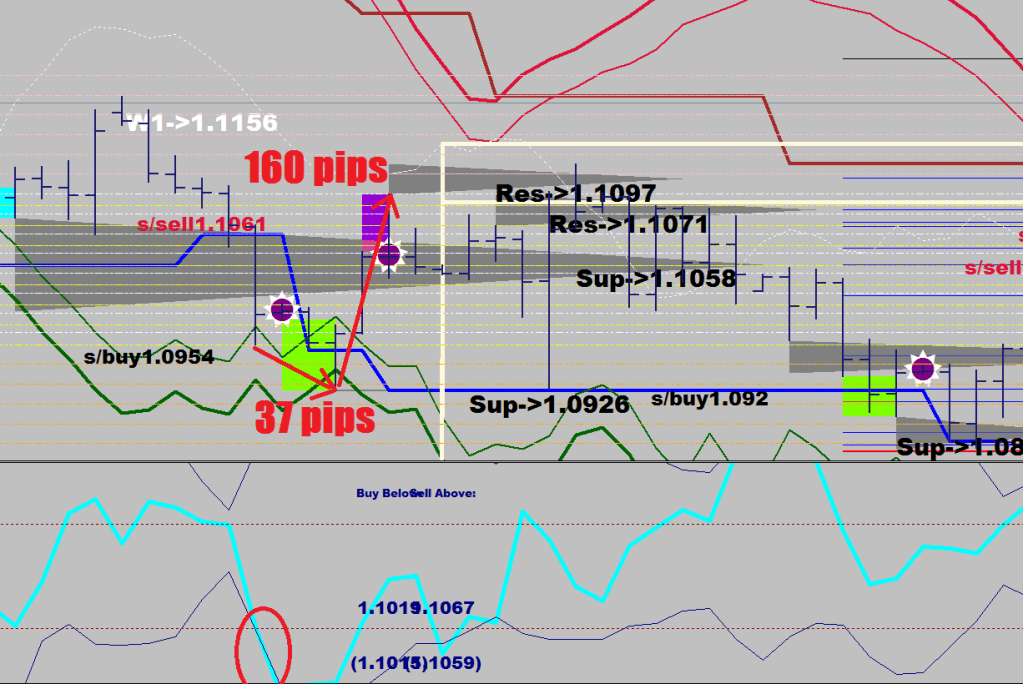
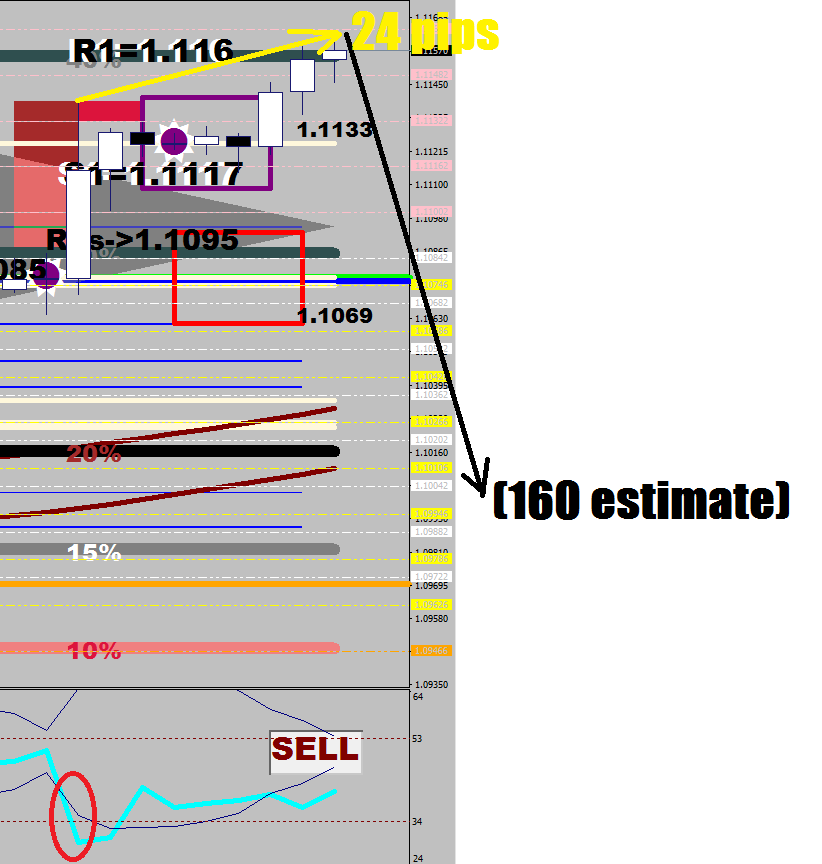
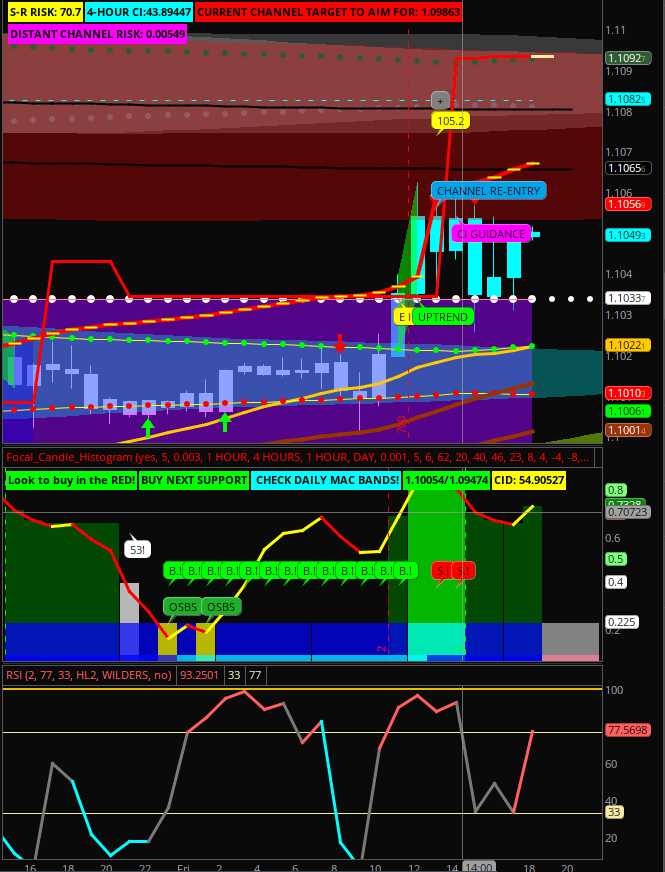
Figure four.
LOCO gets placed on the top.
Wave 1 starts just from above the hourly close of the W leg.
Wave 2 is a 3-pip penetration into the V leg (red circle shows the fake out of the Hourly Maroon).
1h time frame
The Loco point just falls shy of the low made by Wave 3 to the downside, to the actual matching of the lows becomes a 4-pip fake out out the LOCO as well.
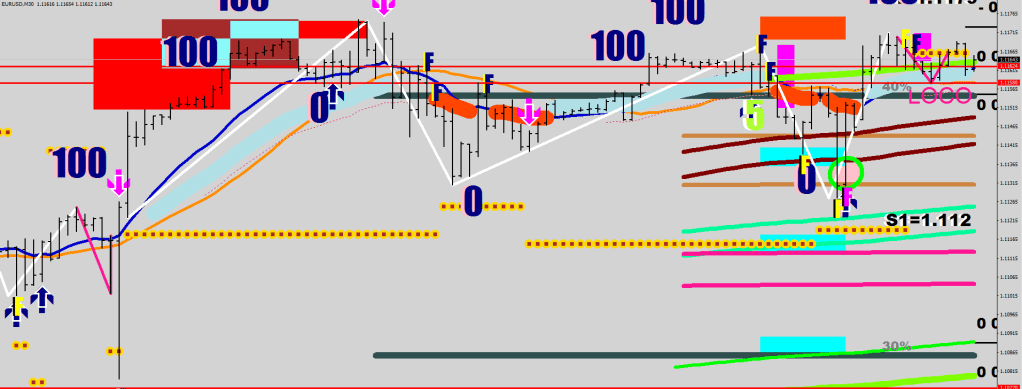
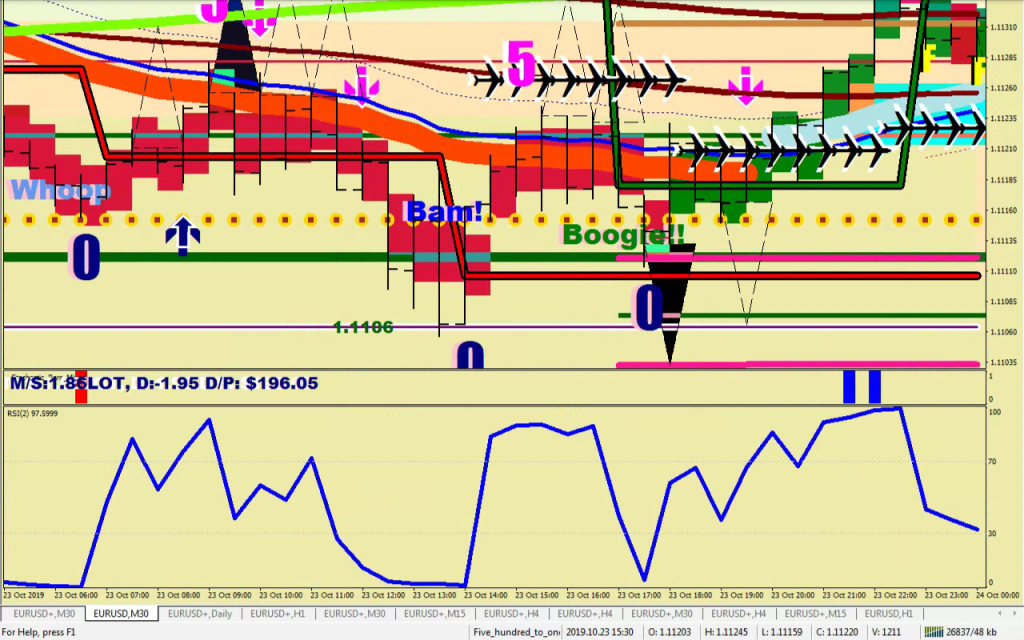
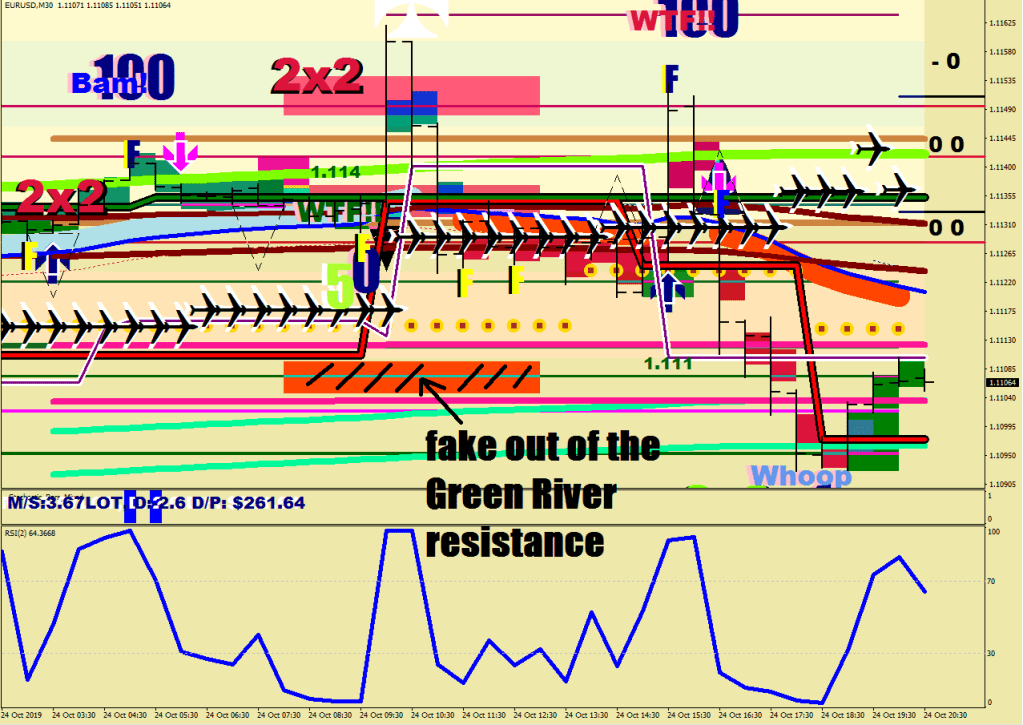
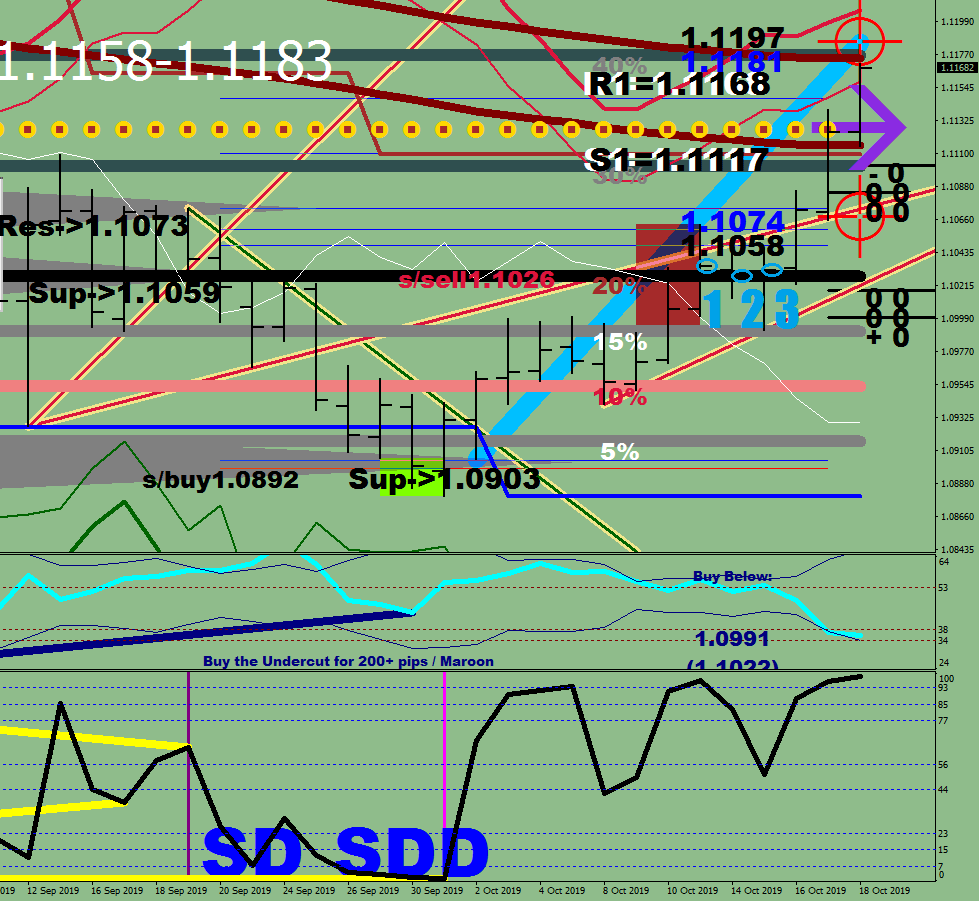
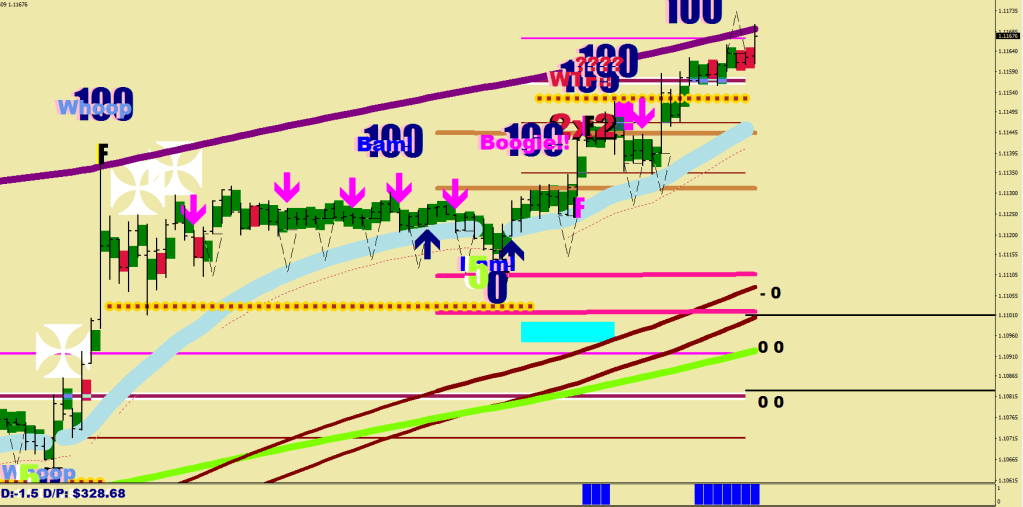
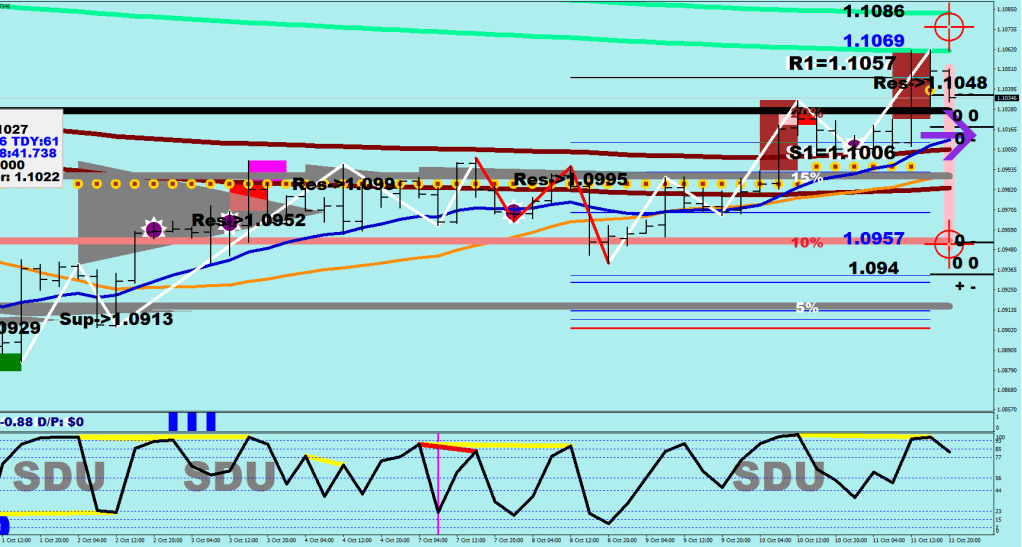
Figure 5: the ominous Institutional market move & the present.
30m time frame – the green circle is a fake out of Mr. Maroon
Looking at this image the institutional move looks more like a market making move: they put in longs those who never in a million years wanted to be.
The wave structure ended just above the previous LOCO line and a new LOCO was printed. Fake outs galore. Having an open that would reach below 1.1153 would set up a back test of a now doubly wide LOCO pair of lines = Kiss GoodBye.
Now, what if they gap it up? There is some potential (5-15%) here to go crazy and milk more buying. A small gap up would change nothing on the picture. You would need to increase your tolerance beyond a 5-pip fake out of the V line for a bit, so I would only start hedging shorts gradually, and starting beyond 1.1181. Watch out for the increased spread at the open as well, for your ask line might be showing a break out 4-5 pips earlier.
To me, at the moment it looks like Wave 1 down was started with the back test of the overbought area, and there were more than Four Tops made above the Upper Guard rail (in green) which is the Bottom Rail of Bull Zone 1.
See you all in Acapulco!
(The fact that the time frame had to be blown up by the end shows that there is less liquidity up here for the market can only sustain shorter moves. The Market wants liquidity, the brokers want commission.)
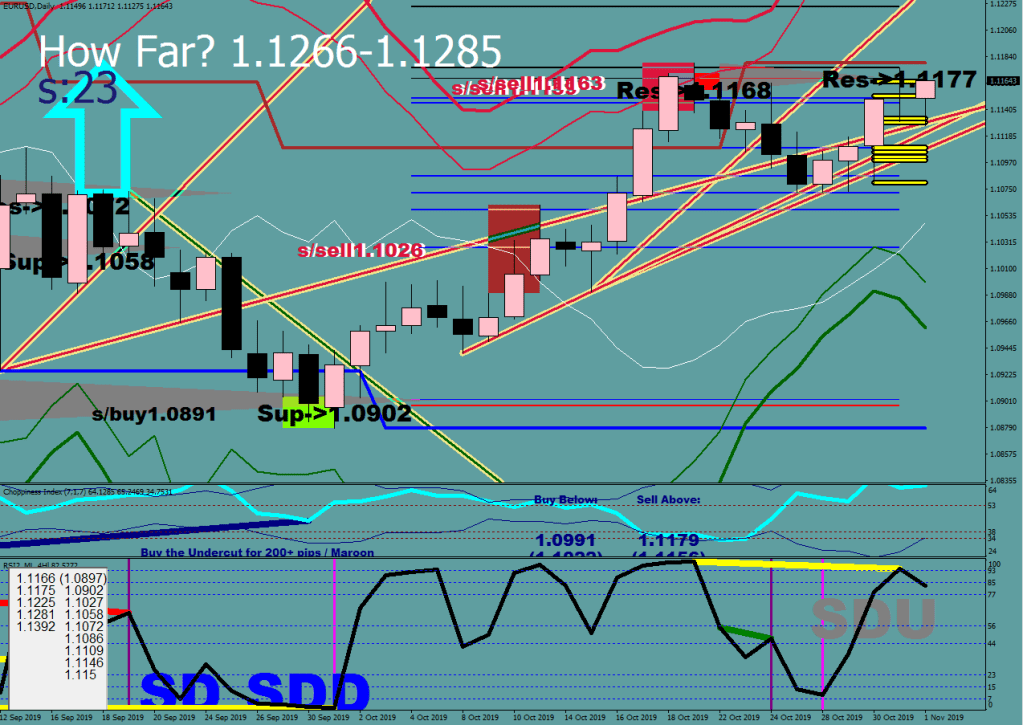
Do remember the possibility of a continuation still, and be prepared for it.
Another 5 waves up would put price somewhere between 1.1266 and 1.1285. So, if price violates 1.1158 first, then comes back through it, surrender all hopes that the next wave structure would occur to the downside and ride it hedged (or overhedged) to the nearest check point.
This one is gonna be a rant on waves and the behavior of the funny guys.
Calling things symmetrical would be a little bit harsh, but the rhythm of the market more or less remains the same.
Take a look at the following two 5-wave structures.
Although they are certainly not identical, they have commonalities. Three attempts to take the price as high as possible is one of these. In both cases, 2 out of the 3 peaks managed to achieve overdrive prints on the stochastic bars. Both wave structures had #4 undercutting #2 which speaks of a corrective wave structure (by this I mean you should start fading heavily by the time wave 5 is up). In both cases, wave 5 fell short of the overall peak, and they were less than 5 hours long.
Now, let’s discuss for a moment the deep break and why none of that move is connected or marked as part of a structure. They aren’t.
The volatility whip was utilized by some institution smelling funny guys to take over as many longs as were possible and make a killing on the 10% move that transpired in about 6 hours – about one session’s length.
The volatility whip is a thrown up ball, there are no rules other than the idea of making a measurement on what the downside volatility versus the upside volatility relates to each other on a current full throttle.
This institution spotted the short term opportunity: wave structure over with, 10% score on short notice pending, all they needed to do was serving as an amplifier, plus putting a lot of orders out at & below the 30% line.
My assumption for generating a very efficient “trending” move is having a program run that gives every fill at market in one direction. It takes a lot of capital to do this, no doubt. There are about 10 banks in the world that have the funds.
This overwhelming move knocks out everyone on the way down from their longs -> they become taken over by the bank, showing an ever increasing draw down, then they hit their target area that should be strategically placed beyond a lump of orders (stops) that were left out for good measure.
This is by when the auto fill program (in this case auto buy) gets turned off. Appreciate that they cannot exceed the demand on the way down, only match it, so the down move in this case was an “aid” to escort price into their own net. They will have a bottom heavy averaged down entry price and a ghost print on the chart that others would start drawing trend lines onto.
The overwhelming buy is a notch more aggressive, it has to also front run the orders, getting other routines excited and wanting to interact.
It does help the cause that the liquidity is relatively light in the cluelessness of what is happening. A big news event can help their cause, no doubt.
The major puzzle is now, that the 5-wave structure is over with, would they bother to mirror their own cash cow Vol Whip event this time?
Oh, the arrow for hedging? I lifted it from my TOS era. Don’t quite remember how I came up with the expression, but it works.
I probably have mentioned before that I use codes for trail stops,
code 1 applies a 1-pip stop loss first upon hitting 4-pips in gains,
code 2 applies the same protective stop loss, but starting from 8-pip in gains, and
code 3 jumps over the first 3 lower steps and only starts trailing upon having made progress beyond 1/2 of the fluctuation size (i.e. 4 pips locked in beyond a 16+4-pip move) which comes in handy when the market does a whole lot of nothing and would likely take you out for break evens with its back and forth motions.
One recent modification was to figure in the swap when determining about applying the trail ( OrderProfit()+OrderSwap()>0 ).
Code 4 is actually an automatic target setting: it adjusts the get out level relative to the last 8-sample low/ high and displaces it by kickback * points – if the position went into gains, and if the new kickback displacement leaves the minimum of 1 pip on the bone (my EUR/USD round trip cost is 0.6 pips)
Code 5 is quite stylishly adjusts the target to E-16: this is where you would be expecting your wave 4 to end and start wave 5, if your count is correct.
for(i=OrdersTotal()-1; i>=0 ; i--)
 {
   if(OrderSelect(i,SELECT_BY_POS,MODE_TRADES)==false)
        {
           Print("Access to orders list failed with error (",GetLastError(),")");
           break;
        }
The hedging starts at 4-pips above the candle high with the arrow, and balloons into a full hedge within 10 pips, but for total naked risk I use the value 7-pips out.
I am currently net 4 lots short, and booked $468.02 in gains, which means that today I managed to purchase 10 pips of movement relative to the naked risk carried forward. This 10-pip measure is the name of the game plus not losing equity when you are managing holdings.
Kickback is 90-160 points depending on recent data.
The following indicator should be placed as 3rd indicator below the chart in order to have the letter plots right – or edit the plots from “3” to the number you want it to be (OBJ_TEXT, 3 <- that one).
You need the green line to be “fresh”, not embedded.
In the fresh overbought you are looking for a sell signal.
Now you need to make sure, that a turn is happening. Go to a 30-minute chart and look for a hood in the overbought and a root in the oversold.
These can be spotted with an RSI2 divergence (thick red short lines).
Now you start to count the humps to get the exit right.
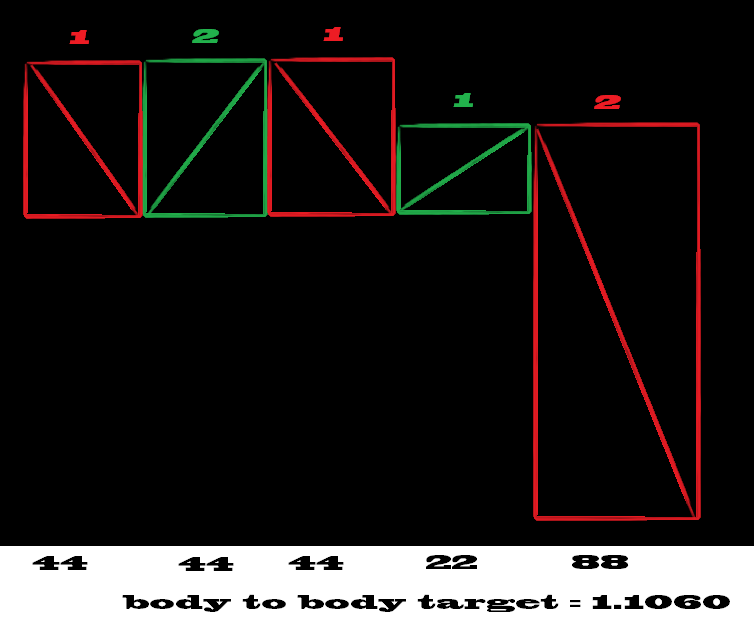
Self explaining picture coming up:
The corrective wave structure does not show a continuation divergence between wave 2 and wave 4.
You are calculating the approximate distance of failure from the end of 3 wave (the peak that occurs right before the #4 print in the opposite direction) 1/2 fluctuation size away and factor in the possibility of a failed break as well.
Now you know a lot.
(TNR stands for Total Naked Risk in dollars).
I am planning on releasing a book on Managing Naked Risk in Forex in the coming years.
What is a Vol Whip? It is a calibration after a wave structure, that consists of two full lambda moves – one in each direction and defines a trading range.
The VW is not part of any wave structure.
The wave structure ends with the extension move.
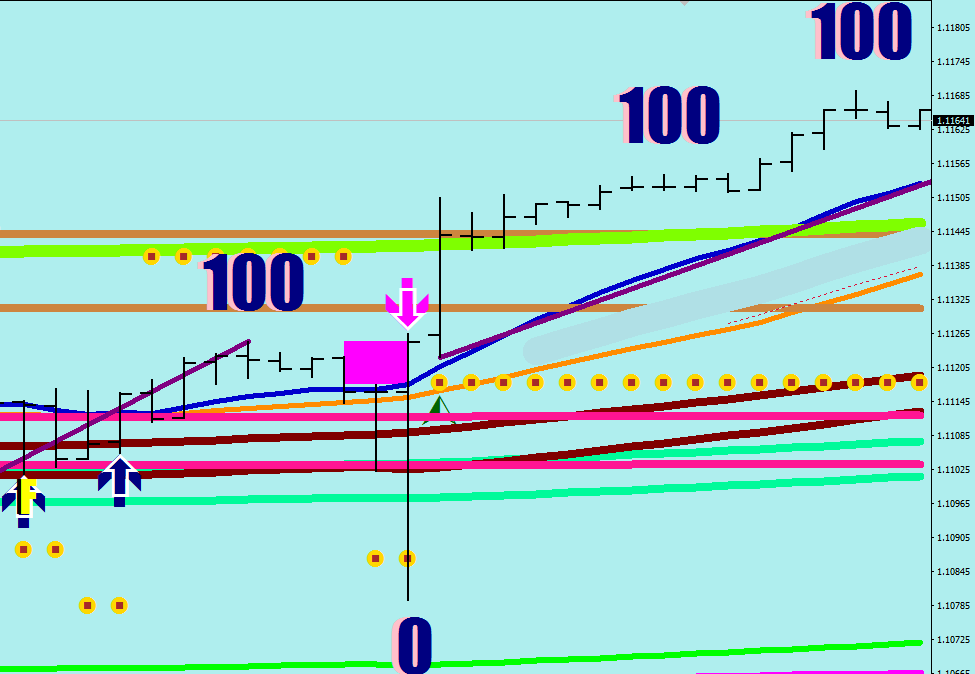
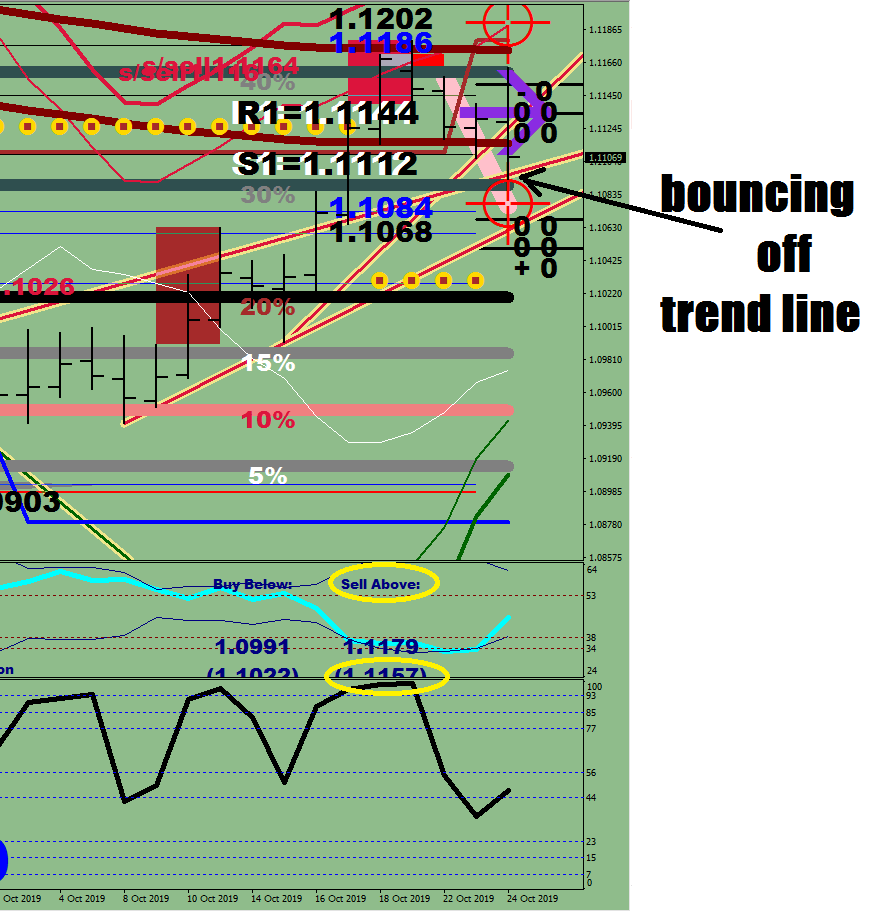
Let’s look at the following inverted head and shoulders to put things in perspective.
The purple-white line is the 22-pip buy line of the last swing high above the E-16
The three zeros represent the head and shoulders terminals.
The one on the left with the corresponding red bar (below) is the left shoulder or the overdrive.
The head that sets up the divergence in the middle, does not register anything on the stochastic bars. It finishes the wave structure down.
What follows is the volatility whip that prints the right shoulder in the process. Wave 1 up was started when the volatility whip’s terminal points got exceeded by more than a fake out size (5 pips+).
Remarks: the right shoulder can surpass the terminal point of a Wave Structure, yet it would not become part of it.
I have been talking about the relationship between outmost reading the wave 3 printed and the extension (that wave 5 ends up with): they do not in general get spaced further apart than the instrument’s fluctuation maximum reading.
In the case of the EUR/USD the fluctuation size is 32 pips and so 1/4 more would mean a healthy fake out on top of this = 40 pips. Nothing scientific about this, it is merely things you might notice.
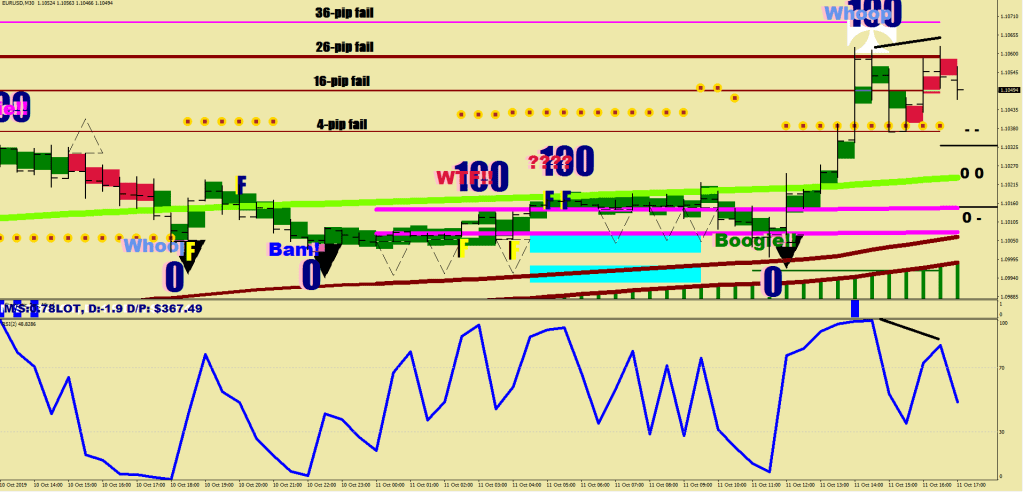
There are the likely extension sizes, and this is how I came up with the 4, 16, 26 and 36 pips failures.
…
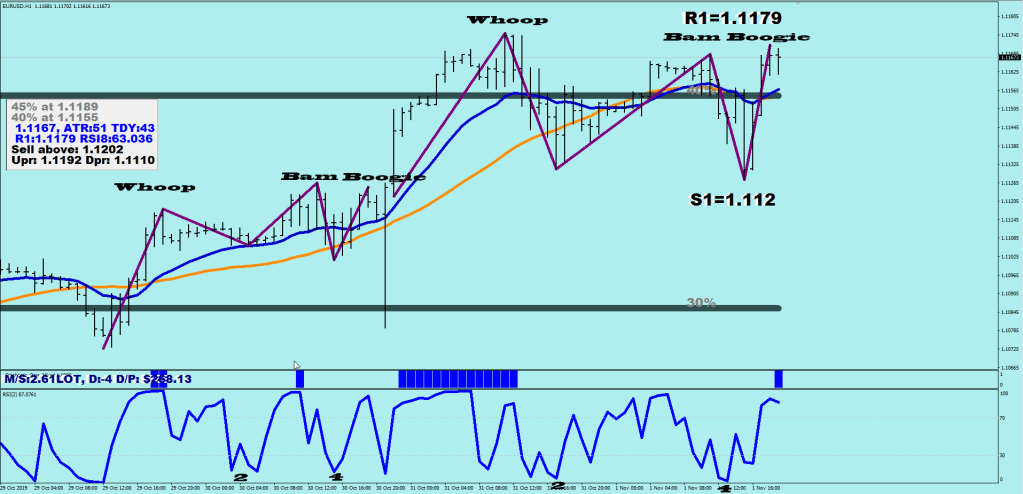
I don’t often draw trend lines
Feel free to check if there was a 16-pip failure between Bam and Boogie on this wave up.
So, you just had seen a wave 5 of a Wave 5 transpired. Or did you?
Bear in mind, that your wave counting might be off, and what you thought was the end of Wave 5 was merely the end of wave 3 of Wave 5. Then, there was a continuation divergence printed by the bulls.
Right there in brown colour, the ending divergence of wave 4 of Wave 5 up.
I was trying to suggest with my last article that the “head” you are looking for…
(#4)
…would likely show up as a miss on your stochastic bars, and another clue to the final burn could be the length of it: it is likely going to be 1.5-2 hours altogether that would very likely arrive with a higher high / lower low depending on the direction (red/orange tail). A pullback to E-16 should always be a suspect of a wave 4.
Therefore, coming into today you could had said, that the head was missing, and so was the final burn. This in itself is a viable trading plan.
A market does not end on a high note – I’m pretty sure I have said this before somewhere.
Can you spot what you cannot see on the last un up resulting in a higher high?
Blue Bayou missing
My most downloaded indicator is the 36 Only. This upper plot puts butterfly marks on potential heads based on the miss – turned an admiral cross as of late.
1, 2, 3 are the 3 daily closes outside the oversold zone -> stochastic embedding.
Where was the last broken trend line? What does that mean for the current direction?
How Far can you go in that direction? (Energy Bands)
How Far would the daily fuel limit support the move without trending?
What wave are you in? Whoop, Bam or Boogie?
Talk about the interactions with the comfort levels
How does the market behave around overbought / oversold? – does it stay embedded? = Trending
Was there any volatility breach on the CI? Has the outside value it been beat for a reversal to take place?
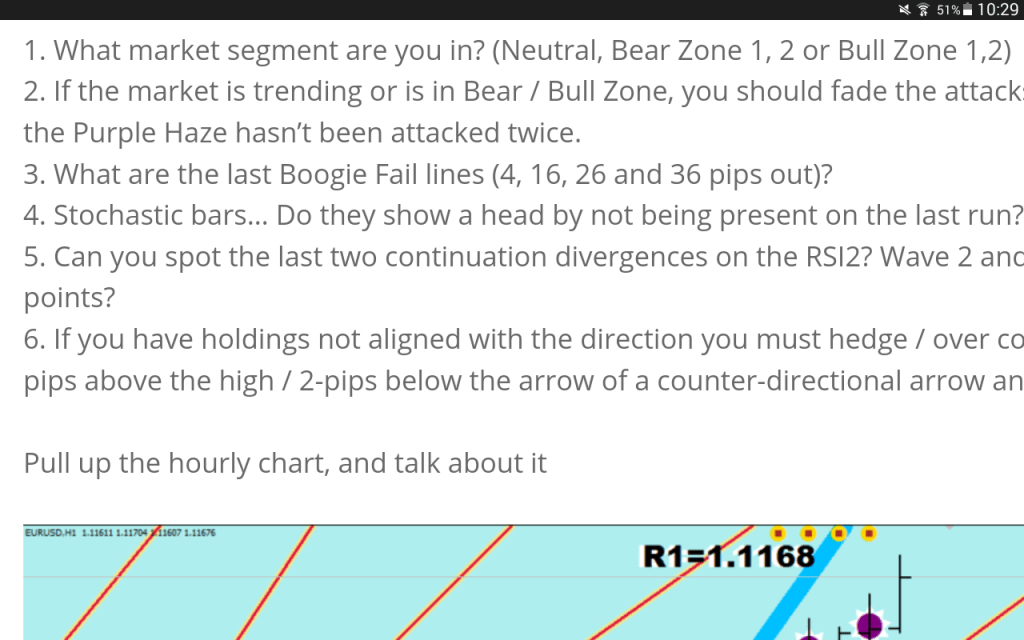
Pull up the 30-minute chart and talk about it
What market segment are you in? (Neutral, Bear Zone 1, 2 or Bull Zone 1,2)
If the market is trending or is in Bear / Bull Zone, you should fade the attacks on the E-16 if the Purple Haze hasn’t been attacked twice.
What are the last Boogie Fail lines (4, 16, 26 and 36 pips out)?
Stochastic bars… Do they show a head by not being present on the last run?
Can you spot the last two continuation divergences on the RSI2? Wave 2 and Wave 4 end points?
If you have holdings not aligned with the direction you must hedge / over compensate 2-pips above the high / 2-pips below the arrow of a counter-directional arrow and hold
Pull up the hourly chart, and talk about it
What are the 4H support and resistance numbers (Comfort levels)?
Are the mid-term memory support levels mostly above or below?
What is your suggested maximum naked risk size?
What is the current balance of your holdings?
The stochastic combo is your timer for getting in on the direction (is the 30-sample D embedded?)
The conditional buys / sells (s/c, b/c) need fine tuning by the use of a 30-minute chart
The last wave does not end on a high/low note, hence the back test of the top / bottom for measuring purposes. The divergence at the back test of the top is shown by the black lines. The failure lines are relative from the Wave 3 peak.
Whoop and Bam were the A and the C terminal of wave 4.
Admittedly, it was a little hard to separate the wave 4 from the wave 5 because of the undercut of the low, and 30-minute wasn’t the best for that.
So what exactly went down (beyond a possible fake out of the long term oversold neckline / bear market).
You’ve been getting these double humps for the impulsive waves that were characterized by letting the RSI drop to the lowest possible level to make for maximum umph length on the final thrusts up.
So what now? Being outside the oversold for one day does not change anything, it is called “saving” if the next day closes back in the oversold.
If you end up with multiple closes outside, the market would have transitioned to a balanced/commuting market where the bulls should be aiming for the median at 1.1250 as primary goal.
Most likely you shall see the long overdue ABC correction – usually 2 4H dojis lower for the hourly stochastic would have to go oversold twice. This would put price back below the 4-H Maroon at 1.0974 with a small, say 10-pip undercut for good measure.
However is all the selling that is about to take place would not be able to keep the price below the oversold neckline, the bear market would be over with until further notice.
It would certainly clear up the intentions to see where they place the price upon the Sunday open.
Bull zone 1 neckline (Upper Guard Rail in green) giving the first slam.
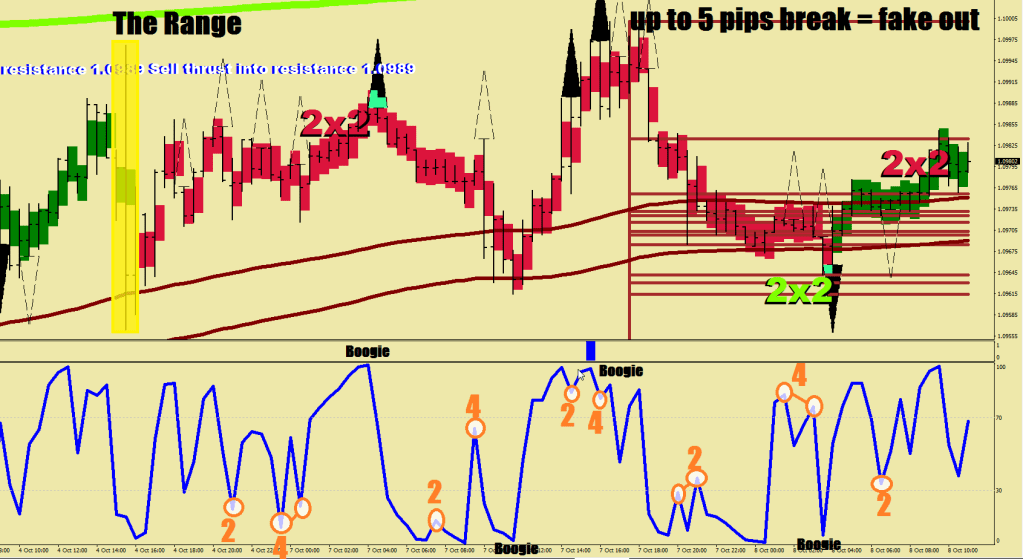
The next image shows how to find the Boogie hump – since these are not waves.
Once you found your hump 2 and hump 4 hooks, you know that you are in the Boogie leg. This is where you close the previous direction and roll into the opposite one.
As you can see, sometimes there is a second peak, mostly for 4-s, but sometimes for 2-s as well, what makes an echo-like peak a suspect is the close proximity in time.
On the way up the 4 would reach lower than the 2 and the opposite goes for the downside.
On the picture above you can say that you are in a hump 3 to the upside since a #4 hasn’t printed yet. You could also say that the market is potentially printing an inverted ABC.
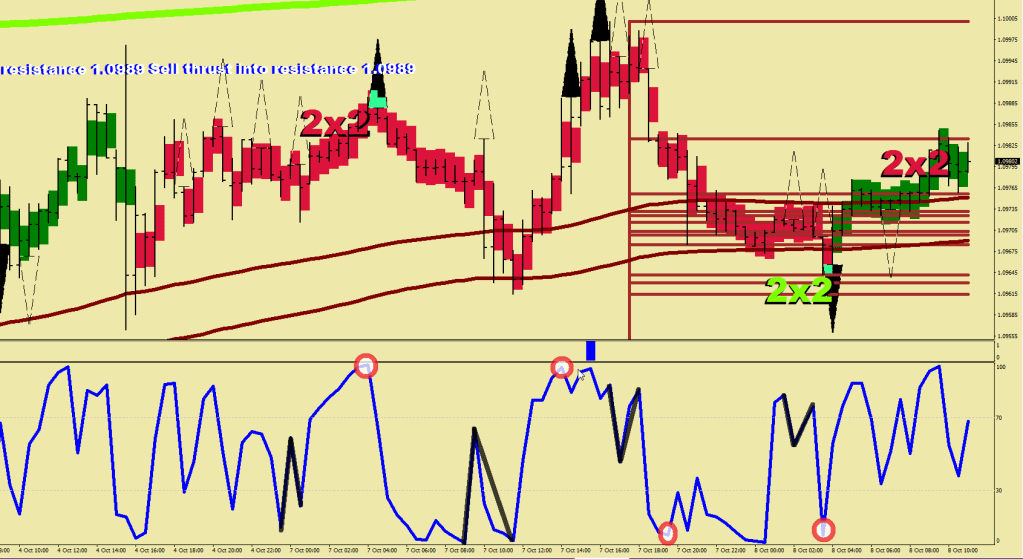
So, let’s talk about another signal for catching a turn: the inverse ABC.
On RSI2, of course.
The inverted ABC (in black) comes from the oversold / overbought area and the C leg would fall short from the RSI starting point of A.
For exit you can utilize the nearest Peak (Oil) or one of the Boogie humps – that may or may not coincide.