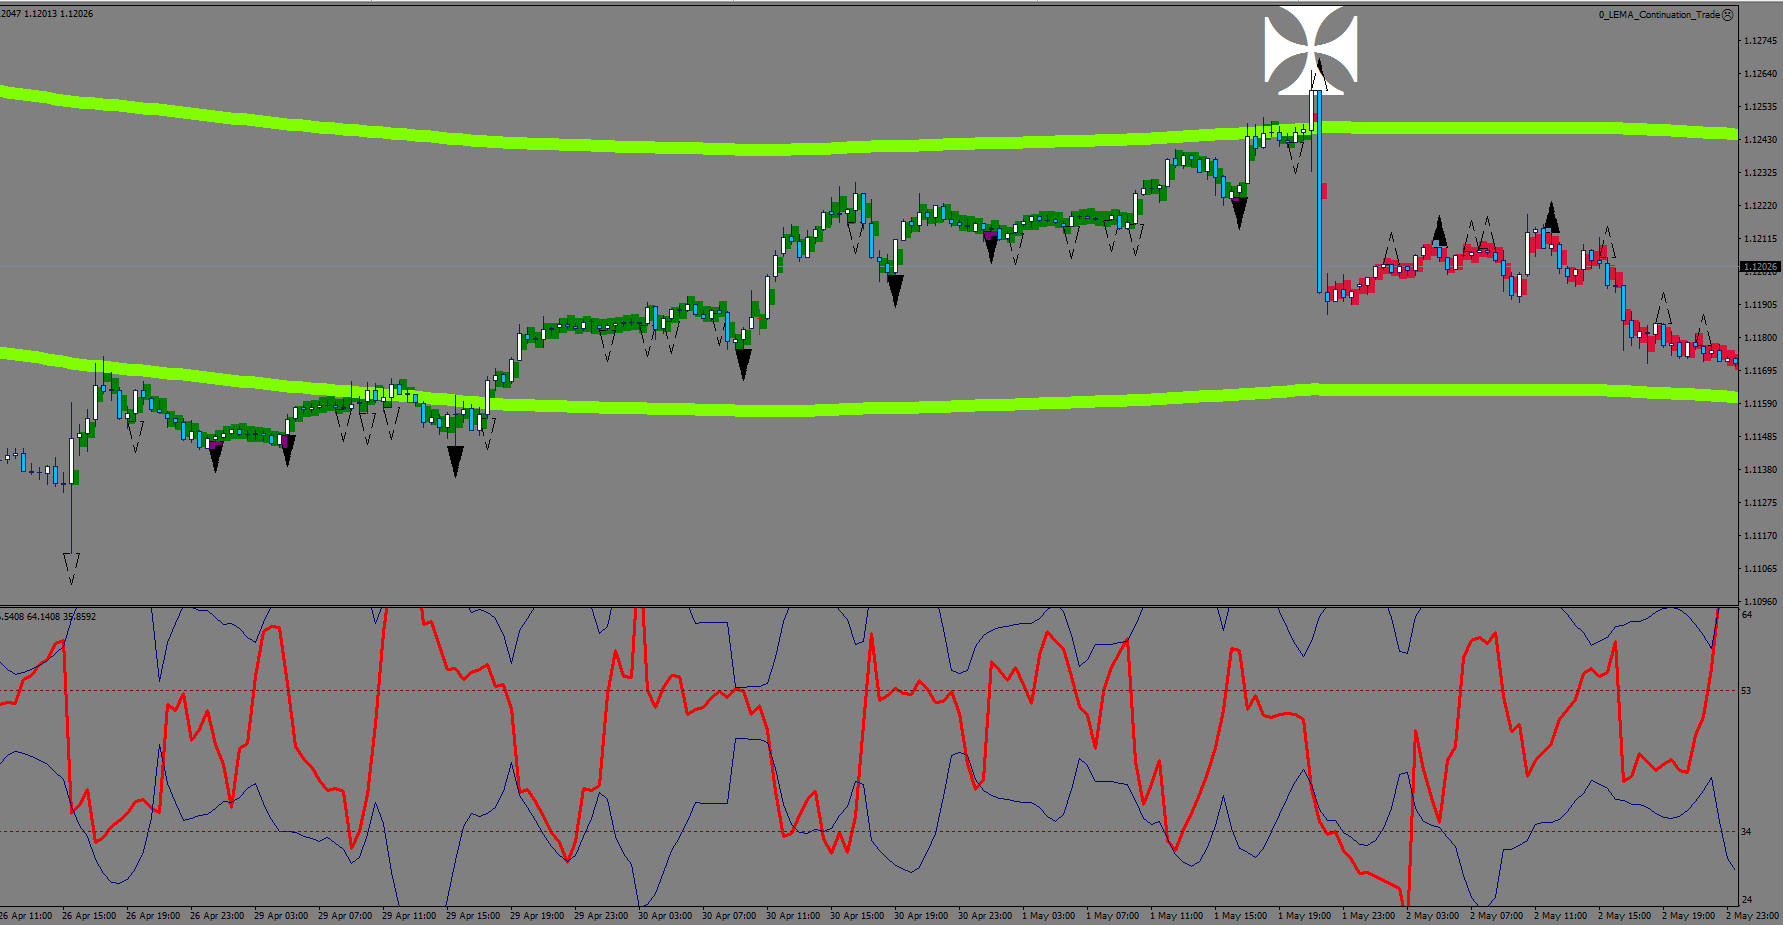
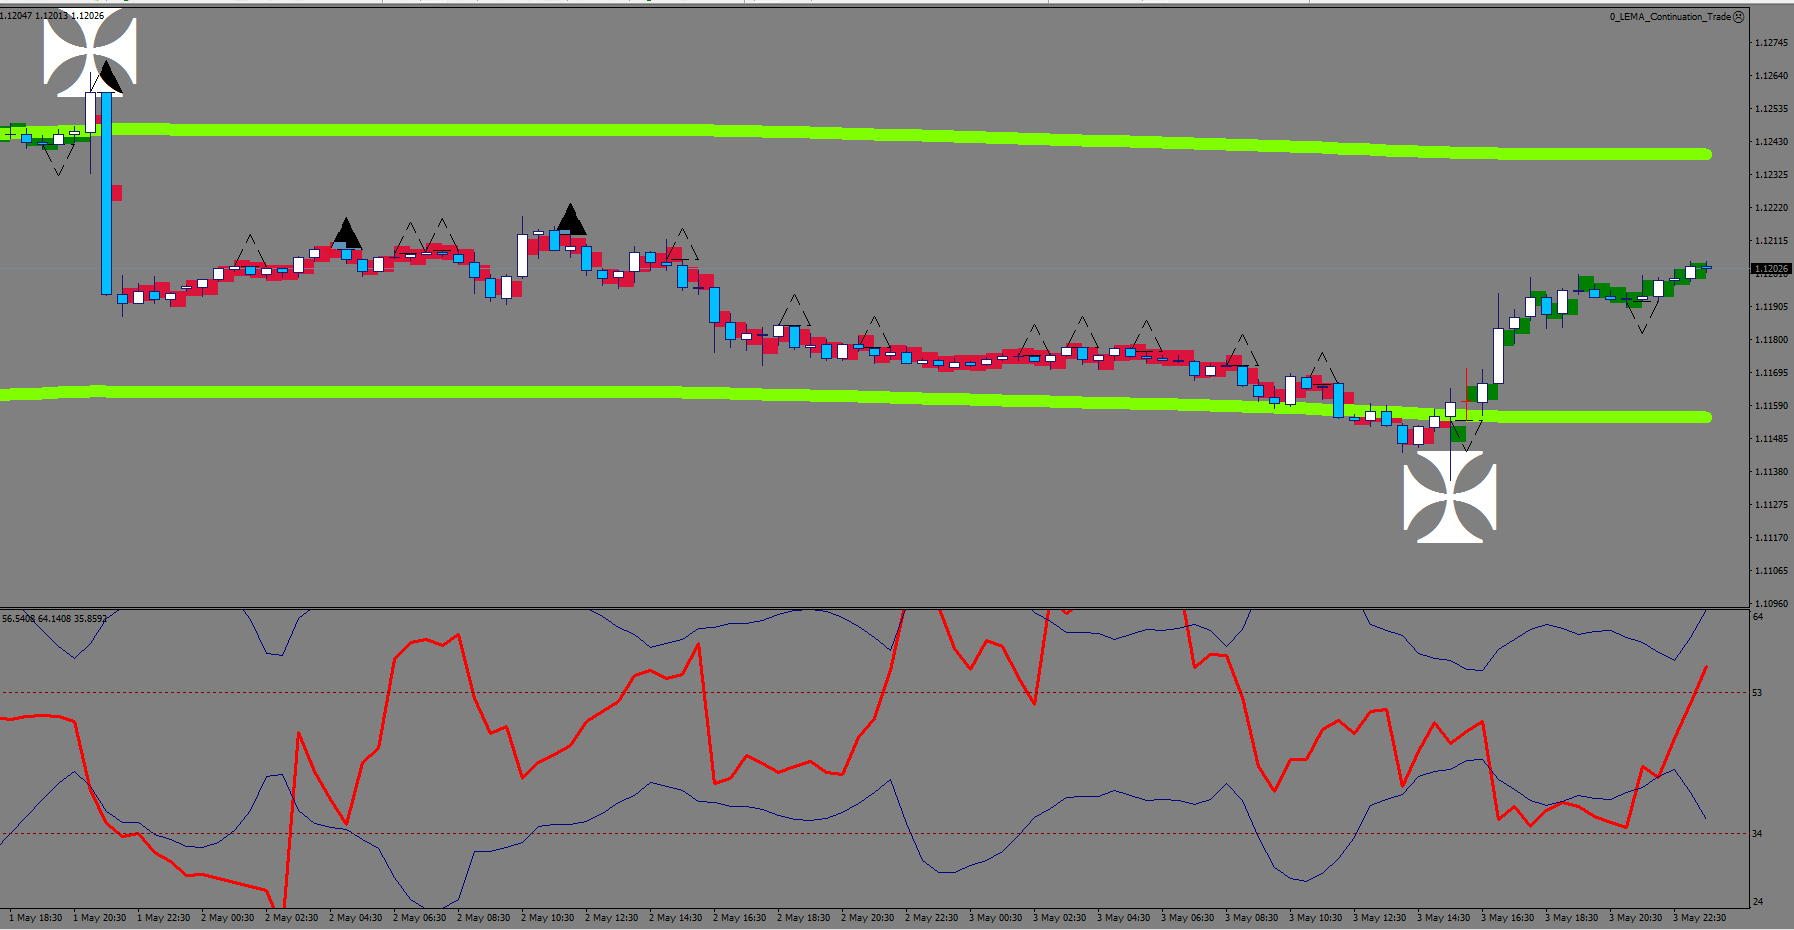
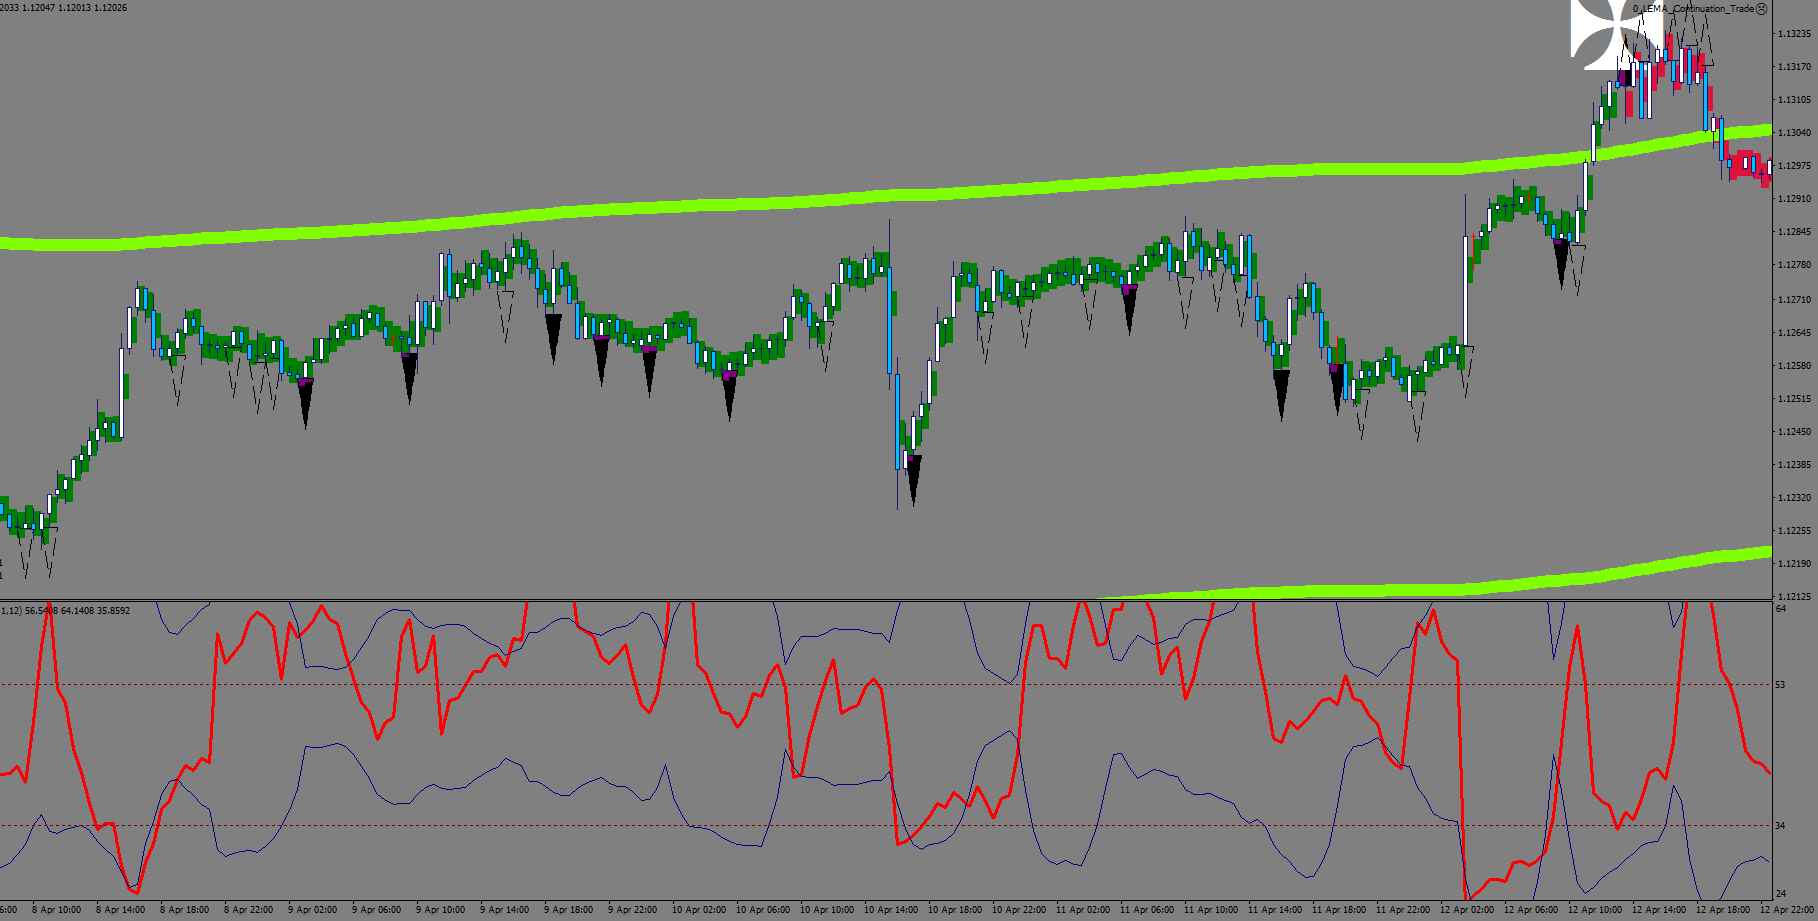
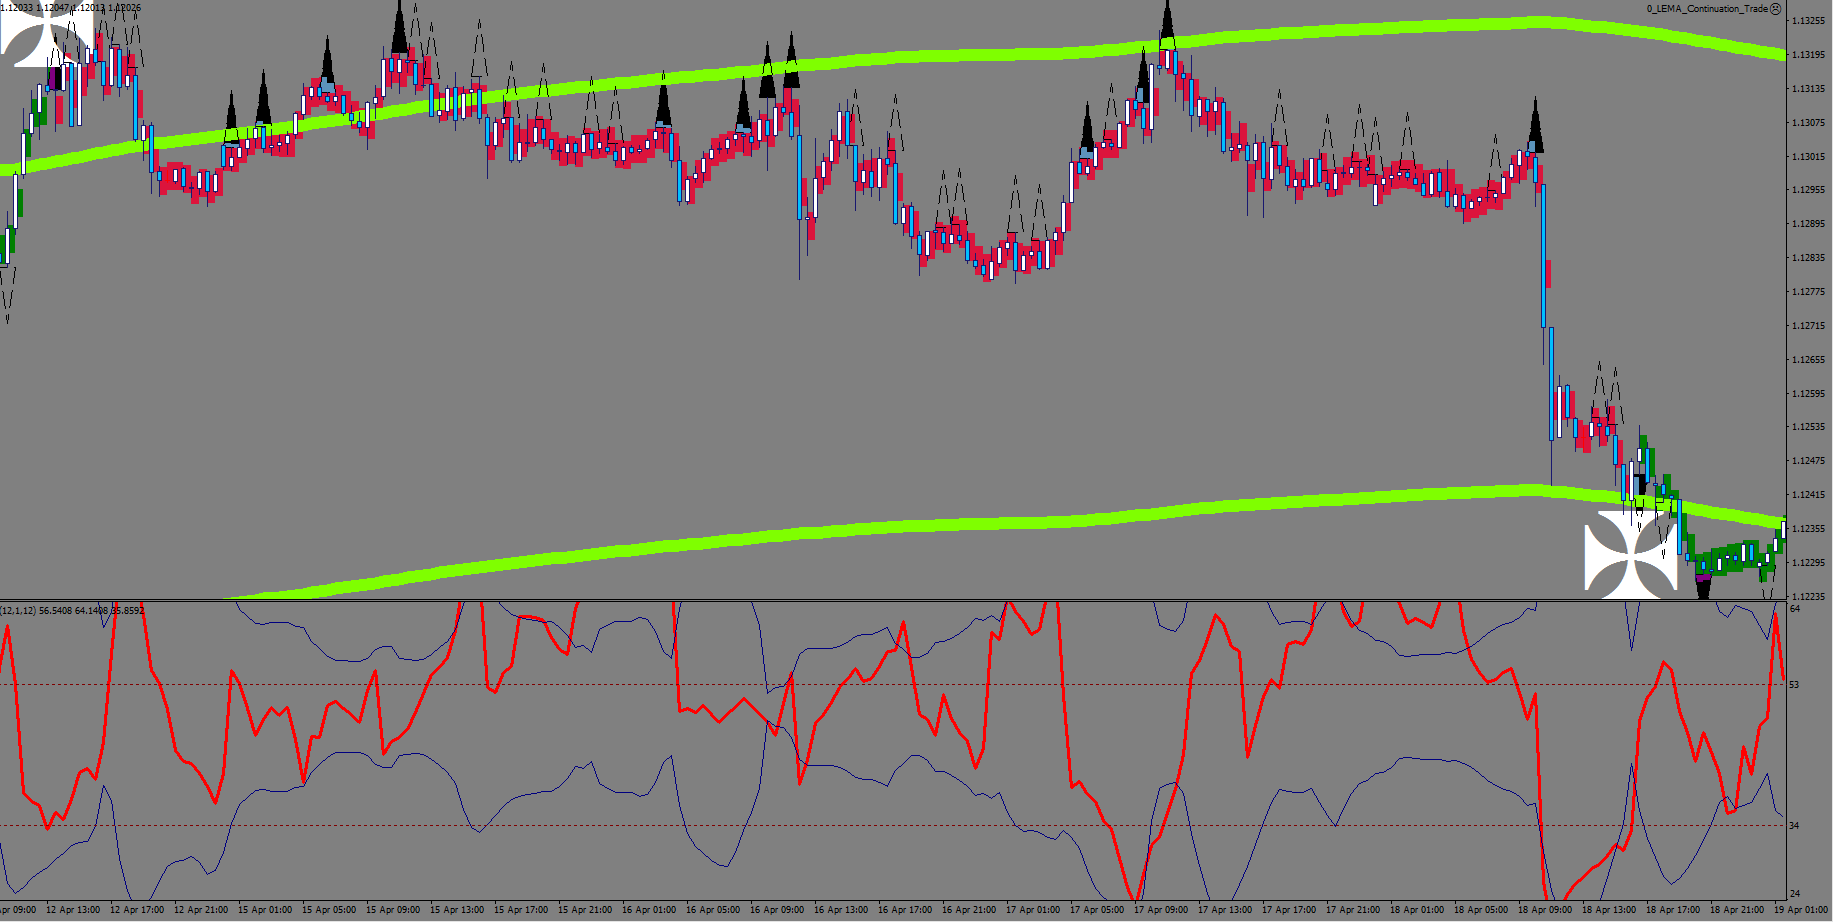
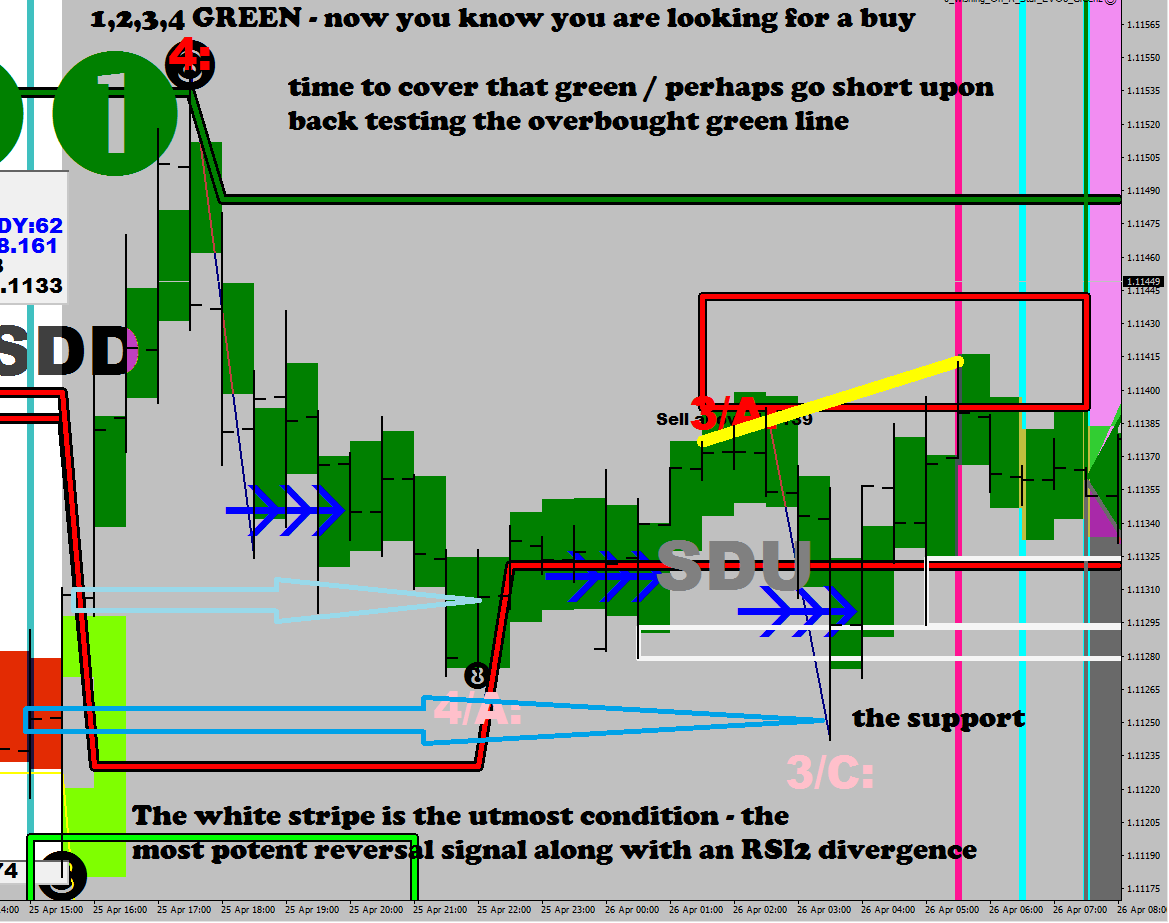
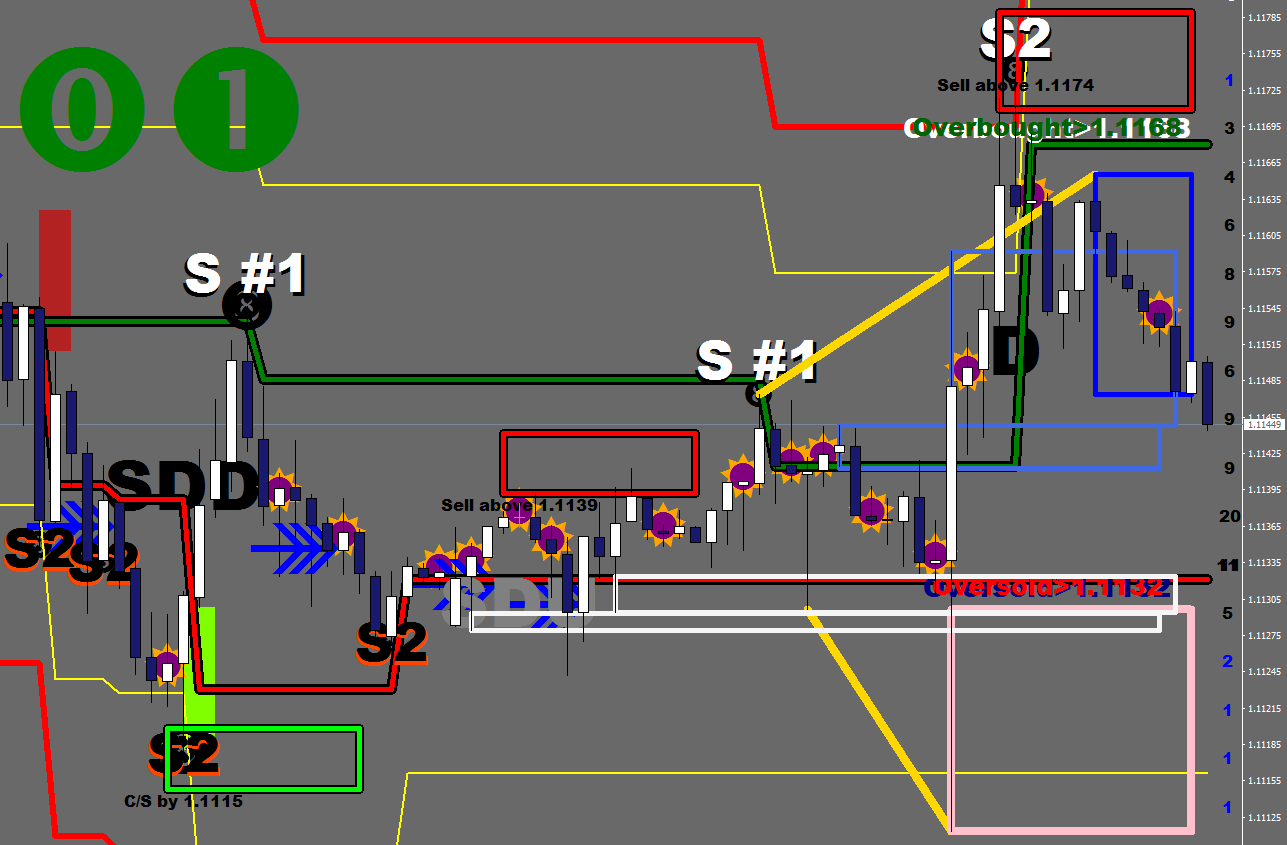
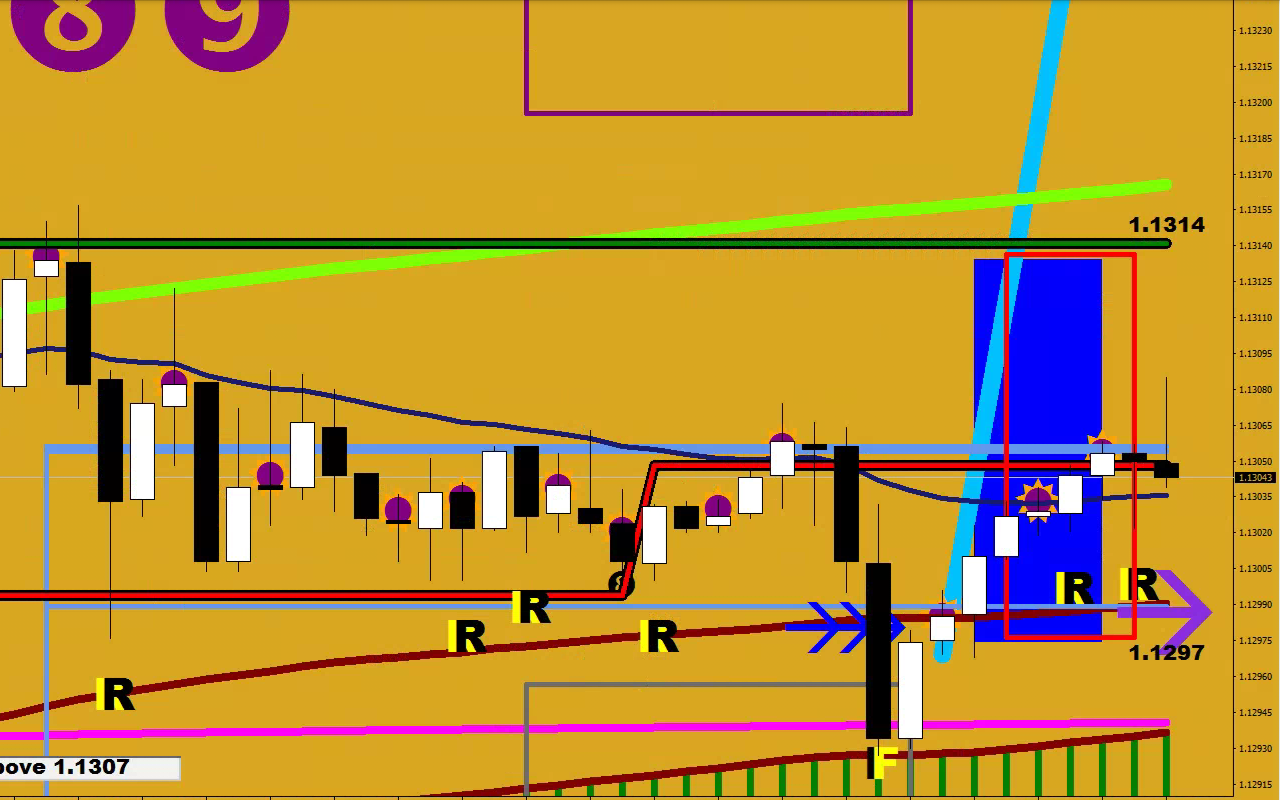
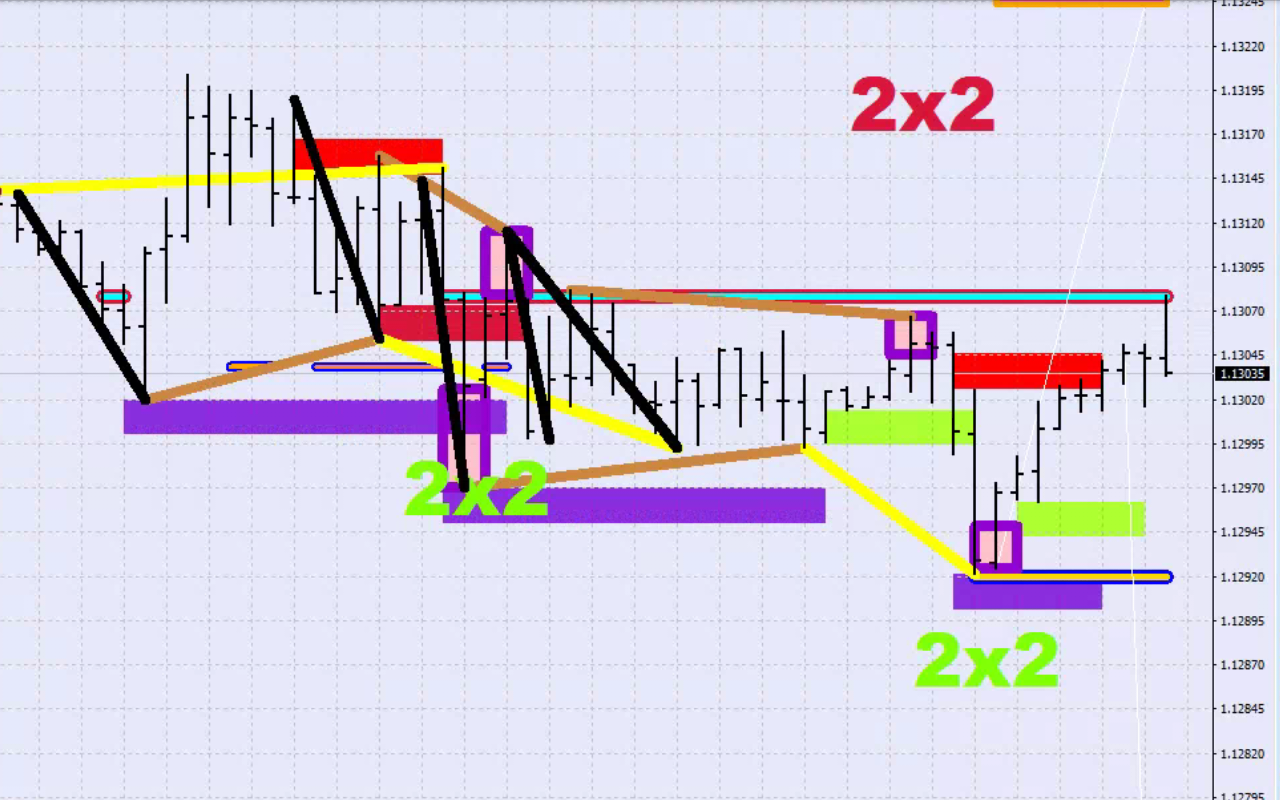
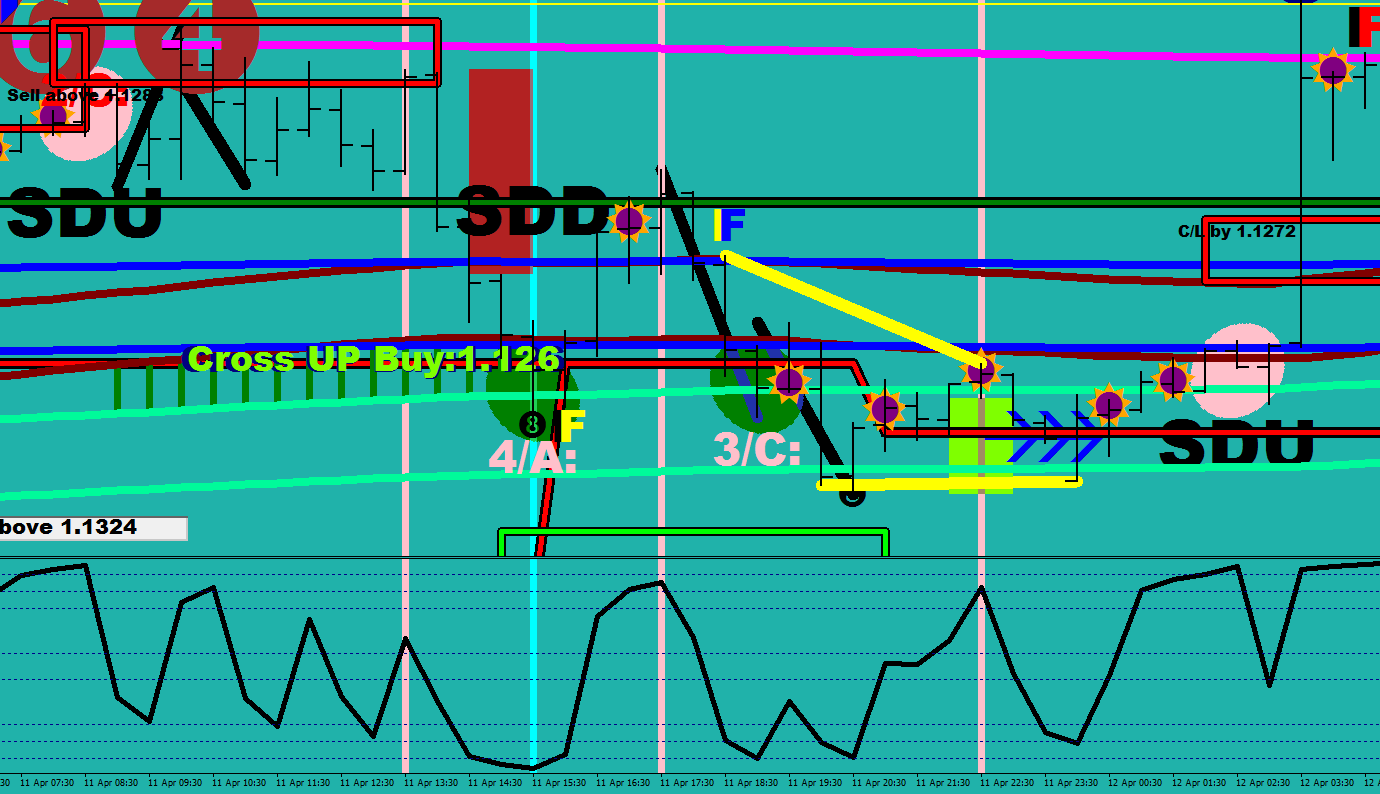
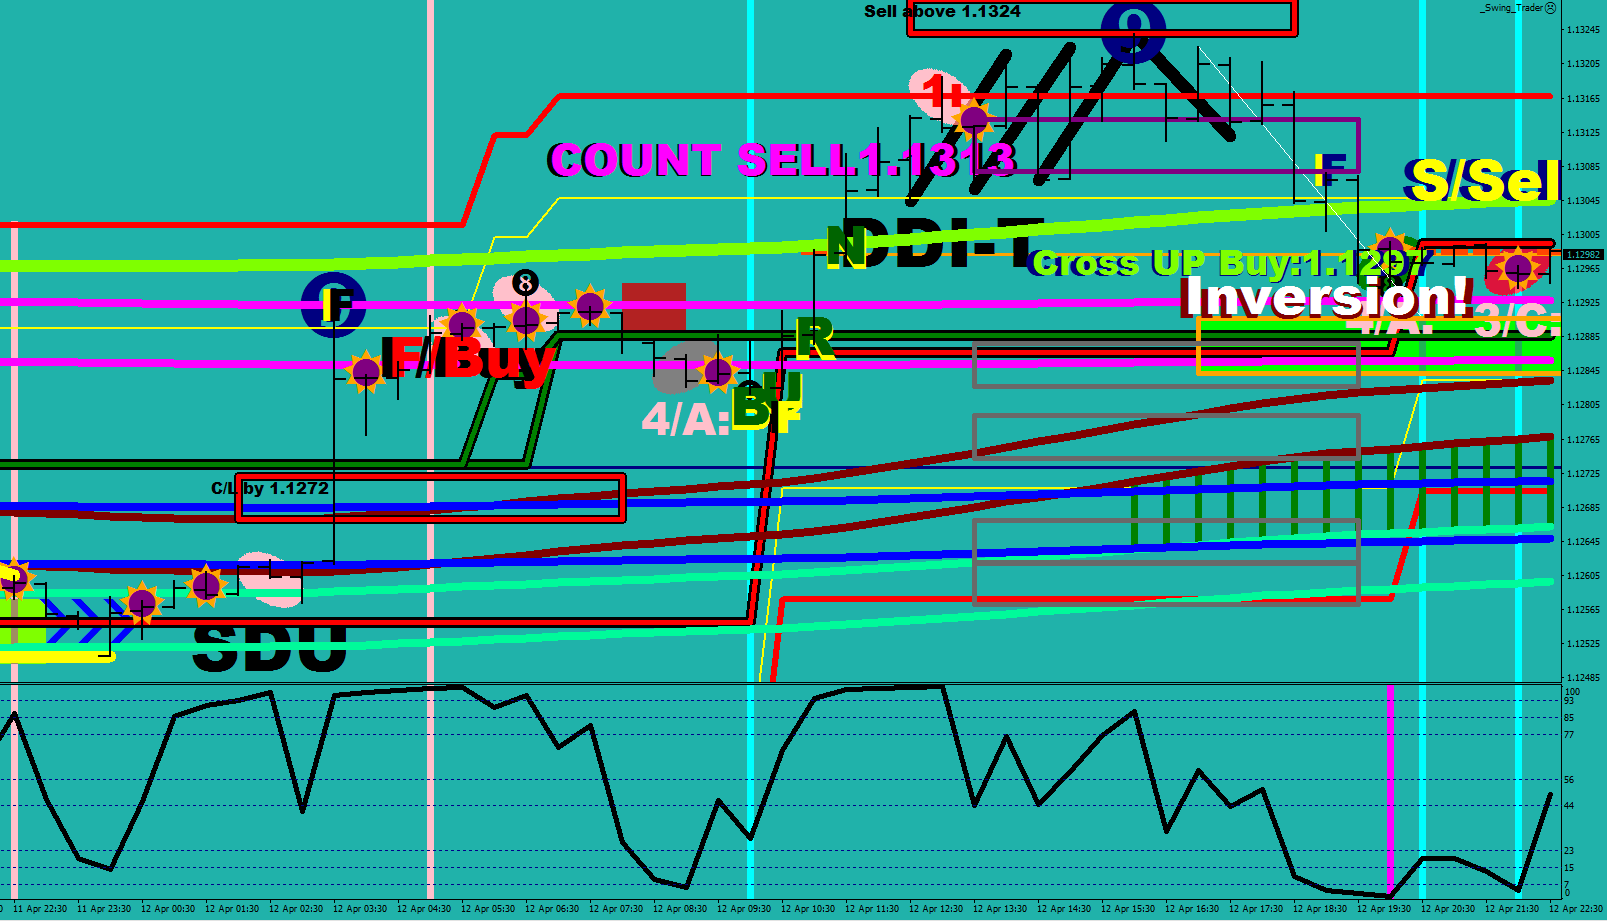
In short, I had to come up with a better logic for hedging than anything before. (I had both my D-Day Hedger and the DDI Turn routines open positions in the wrong direction the other day while I was trying to trade in the proper direction – and all of this happened right after the RSI2 Hedger wasn’t supposed to open a hedge.) Since my RSI2 mania hasn’t been subsiding for about an eternity, I decided to use the pig in the attic and the pig in the basement for a change of direction. Interestingly, the reversals down seem to overwhelmingly happen in the Bull Zone 1 – when the bulls cover and tip the scale – and the reversals up, you can guess after this. A pig would get called off upon a re-visit of its block, and in general the price has the first 30 minutes available for it to leave for good.
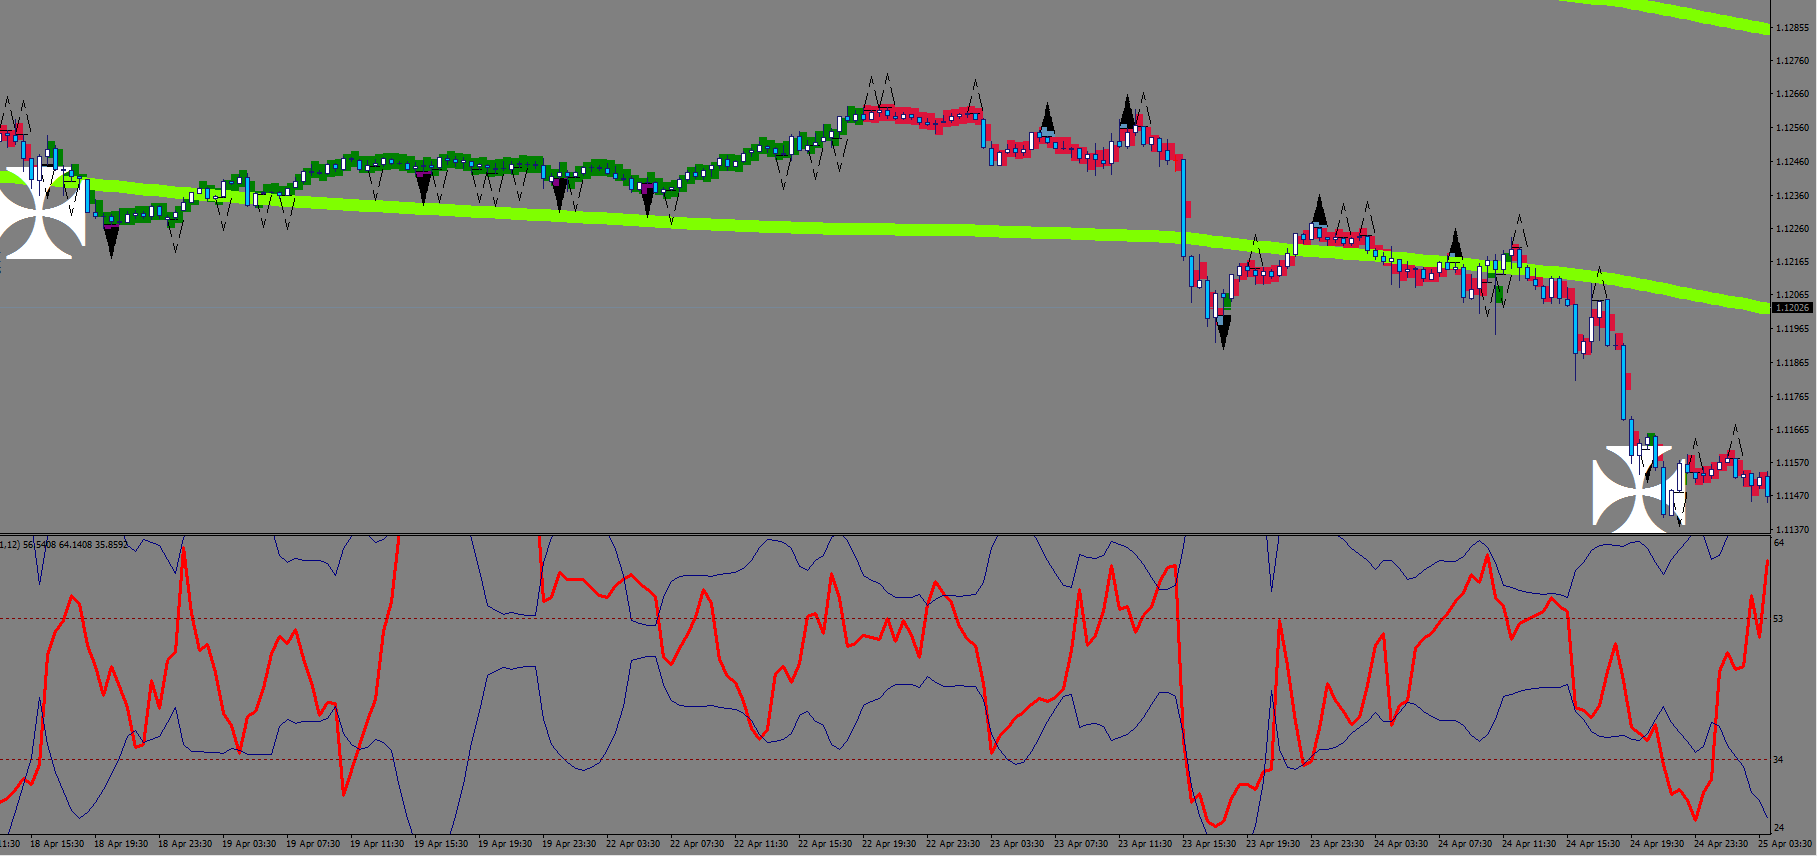
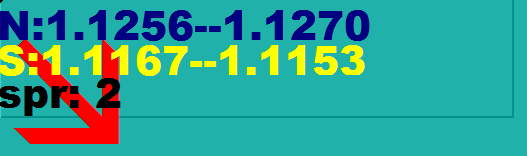
Among the filters I am looking for a wick that is larger than 5.5 pips and an RSI2 sharpie sequence.
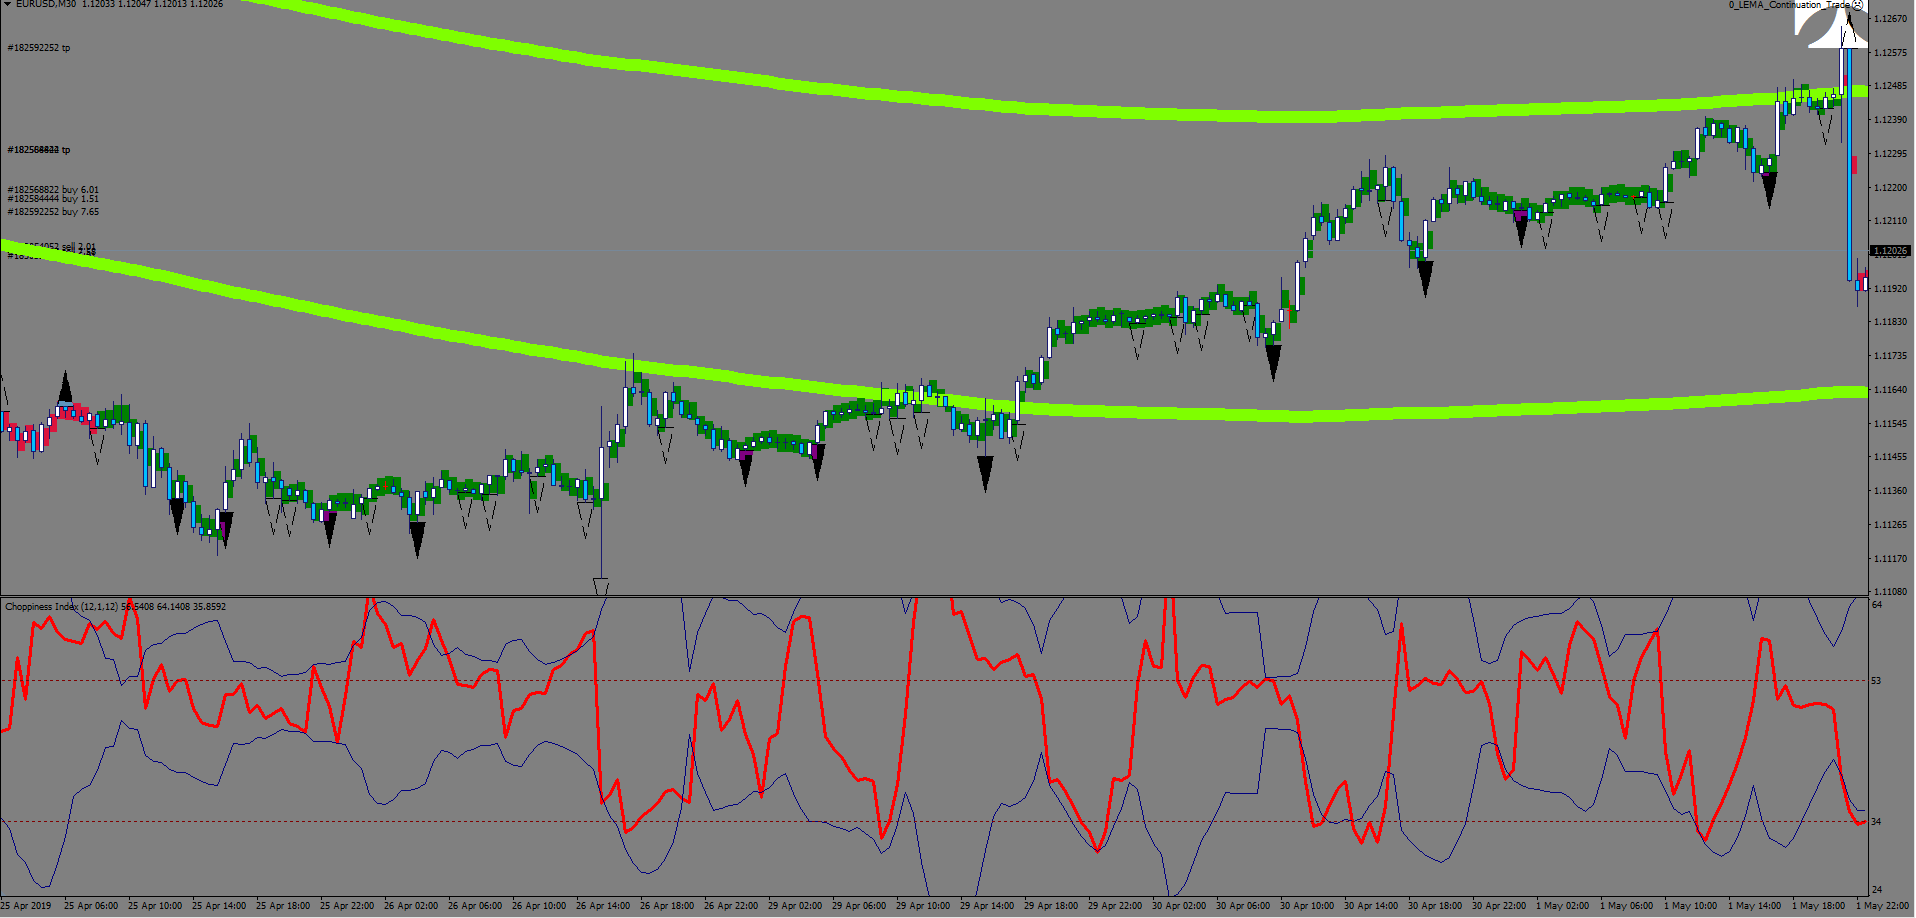
The black, filled triangles are the primary entries, the black triangle outlines are the secondary entries, and the white admiral cross marks the exit condition. To better understand, primary means quality = put plenty of the fire, the secondary means to throw a log.
As for an additional deciding factor, I started plotting again a 12-sample choppiness oscillator – I intend to measure bull/bear strength with it.
I do realize that I may need to add further filters in the future, but this is not at all a bad start. See for yourself!
In this piece I’ll show some examples that are some of the less obvious ways automated trading can chip in with correcting human errors.
Human can have a fixation of wanting to do this or that and override/ignore signs that would suggest otherwise.
With all the good intentions, the human has to learn to comply as well.
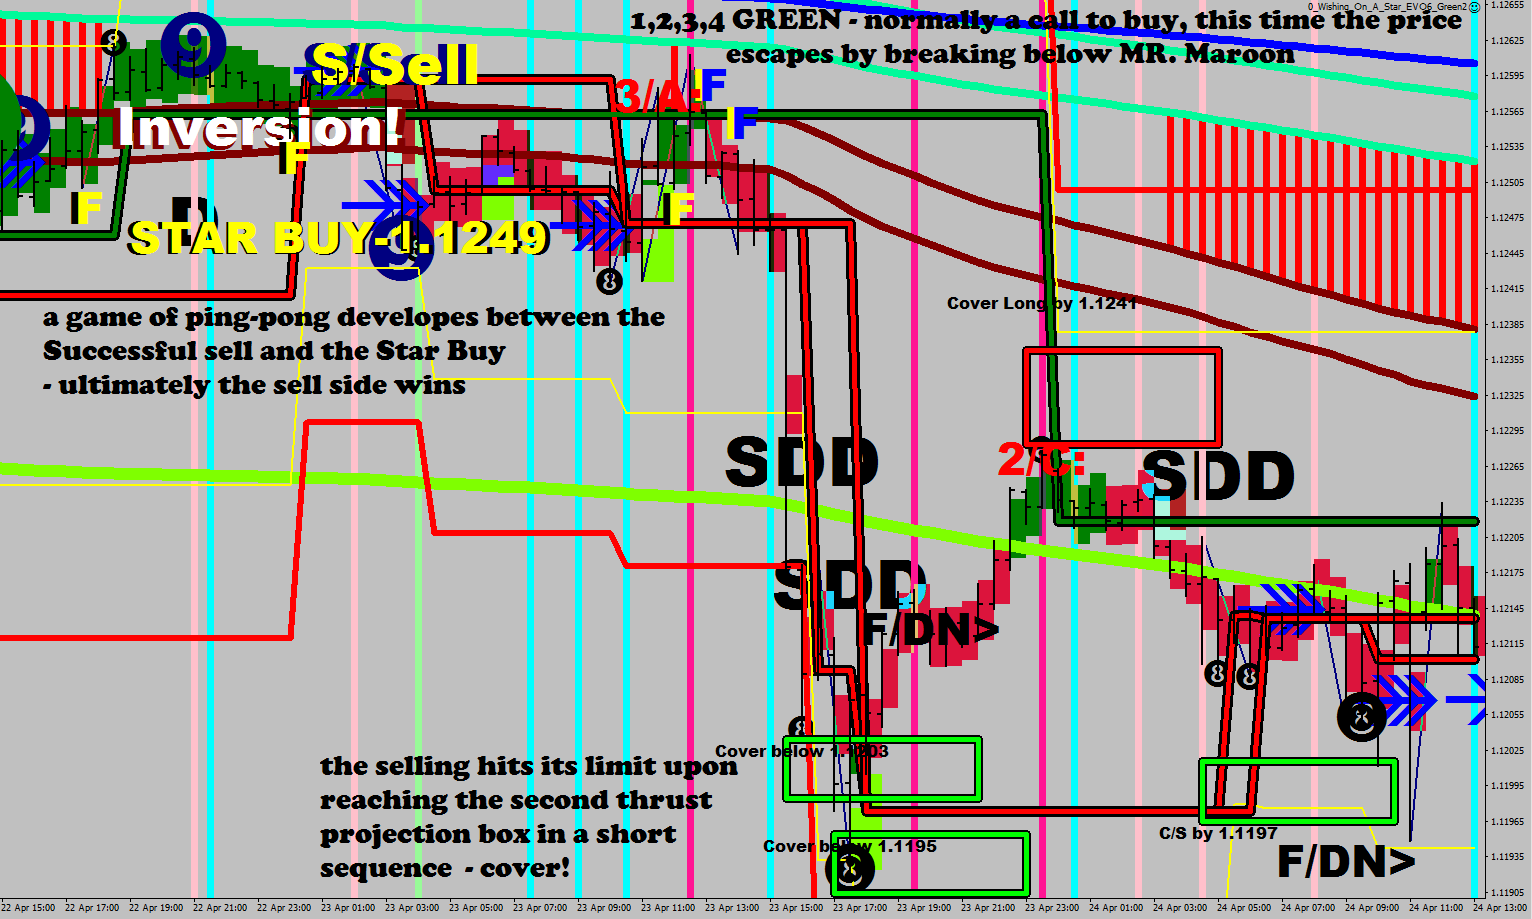
I, as a human being with all the possible flaws in the world failed to acknowledge a zillion signs:
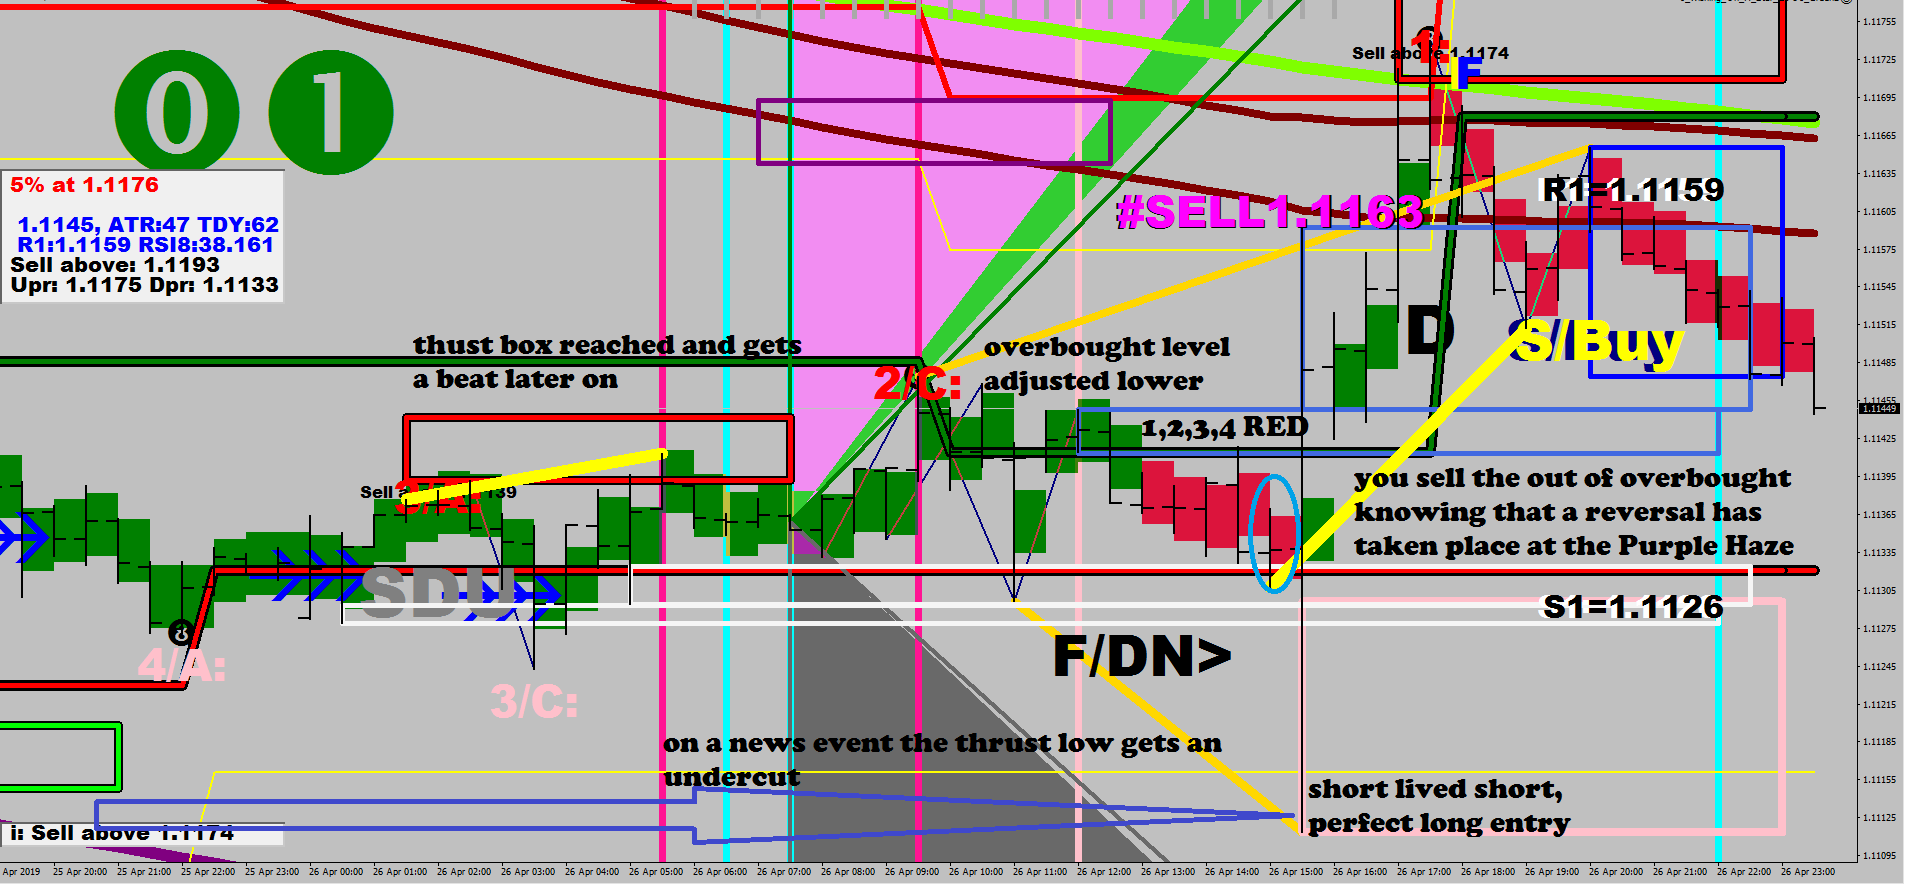
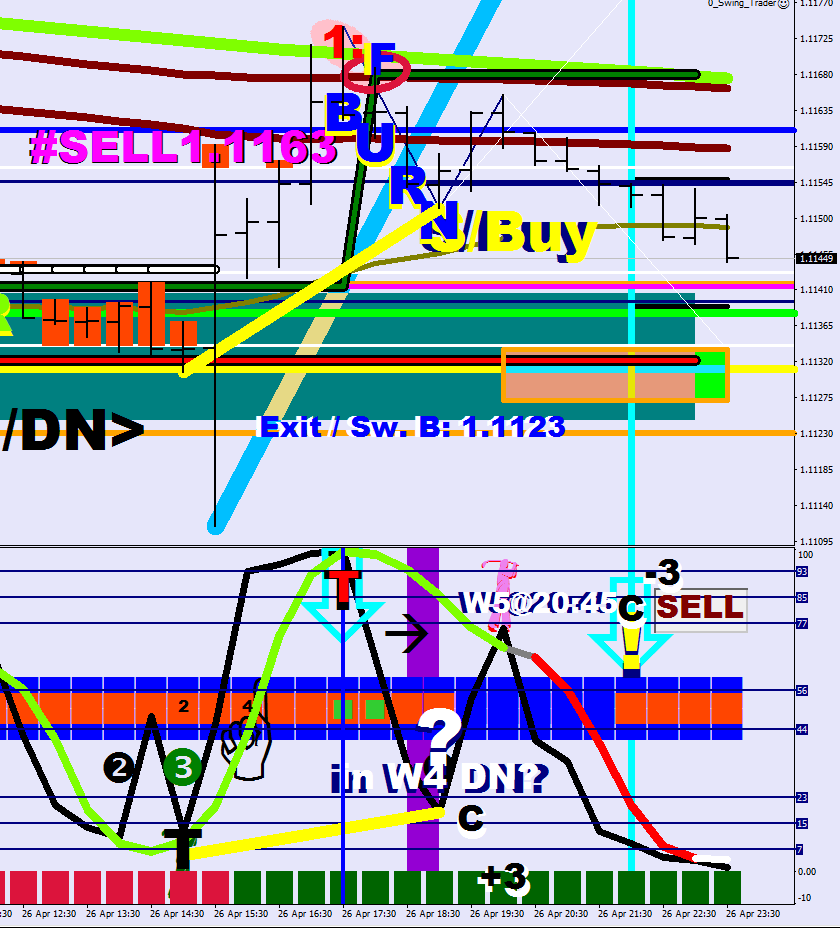
the fake-out of Mr. Maroon (in Maroon, see “F”)
the failure at the Lower Guard Rail (chartreuse)
the wave count down to 1 – corresponding “# sell label”
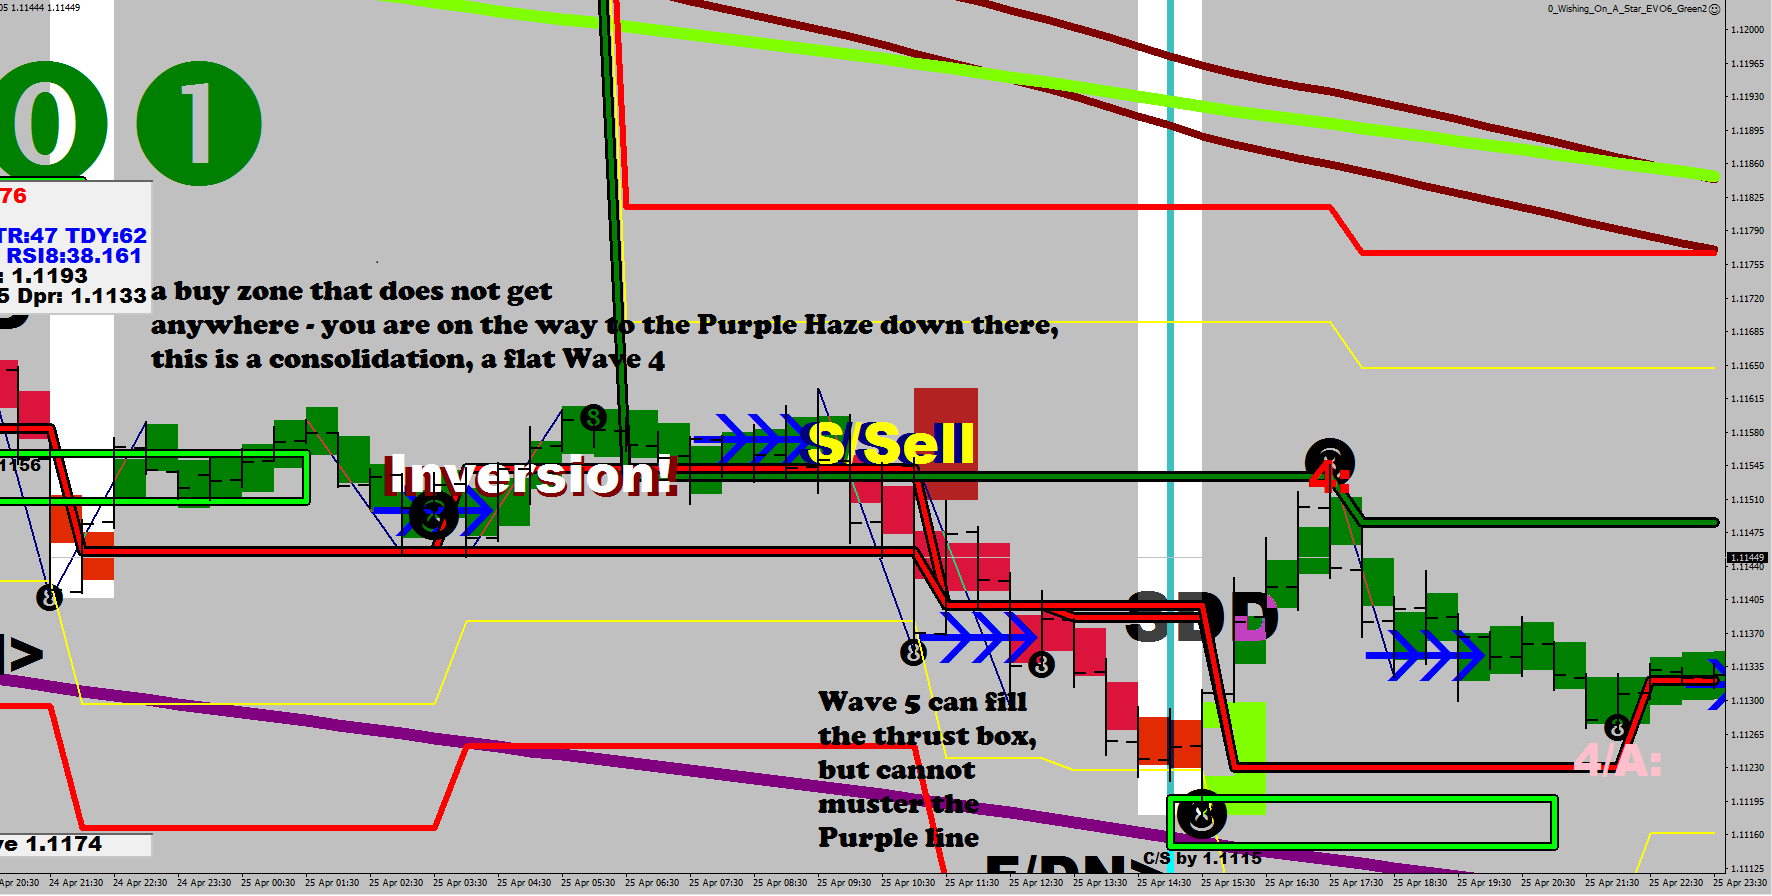
the wave 4 warning (purple stripe below)
the BURN plot highlighting a starting move down
wasn’t acknowledging the navy slim line up as a wave 5 or B up
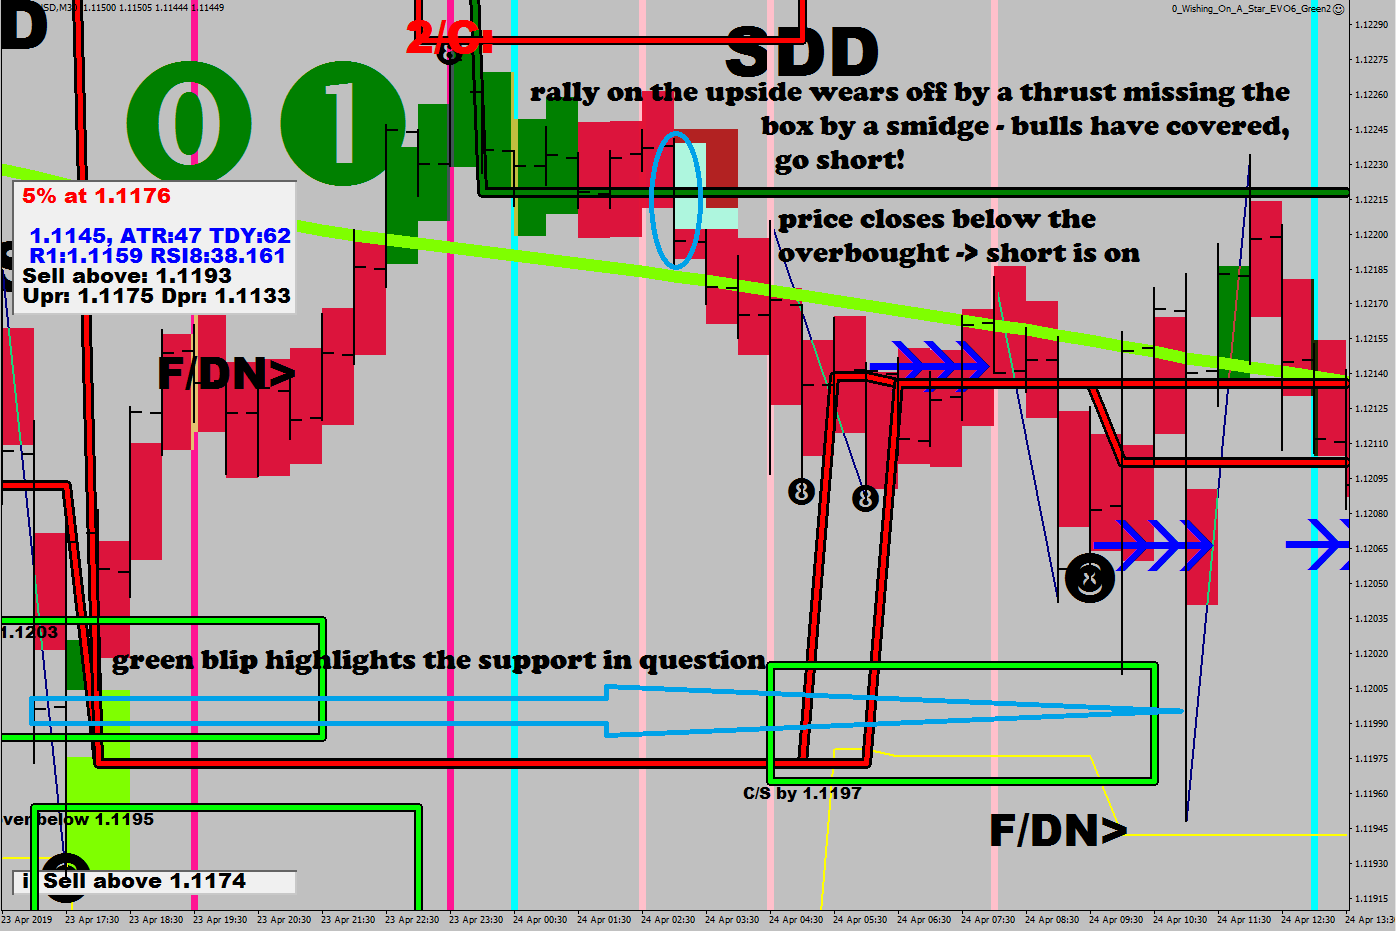
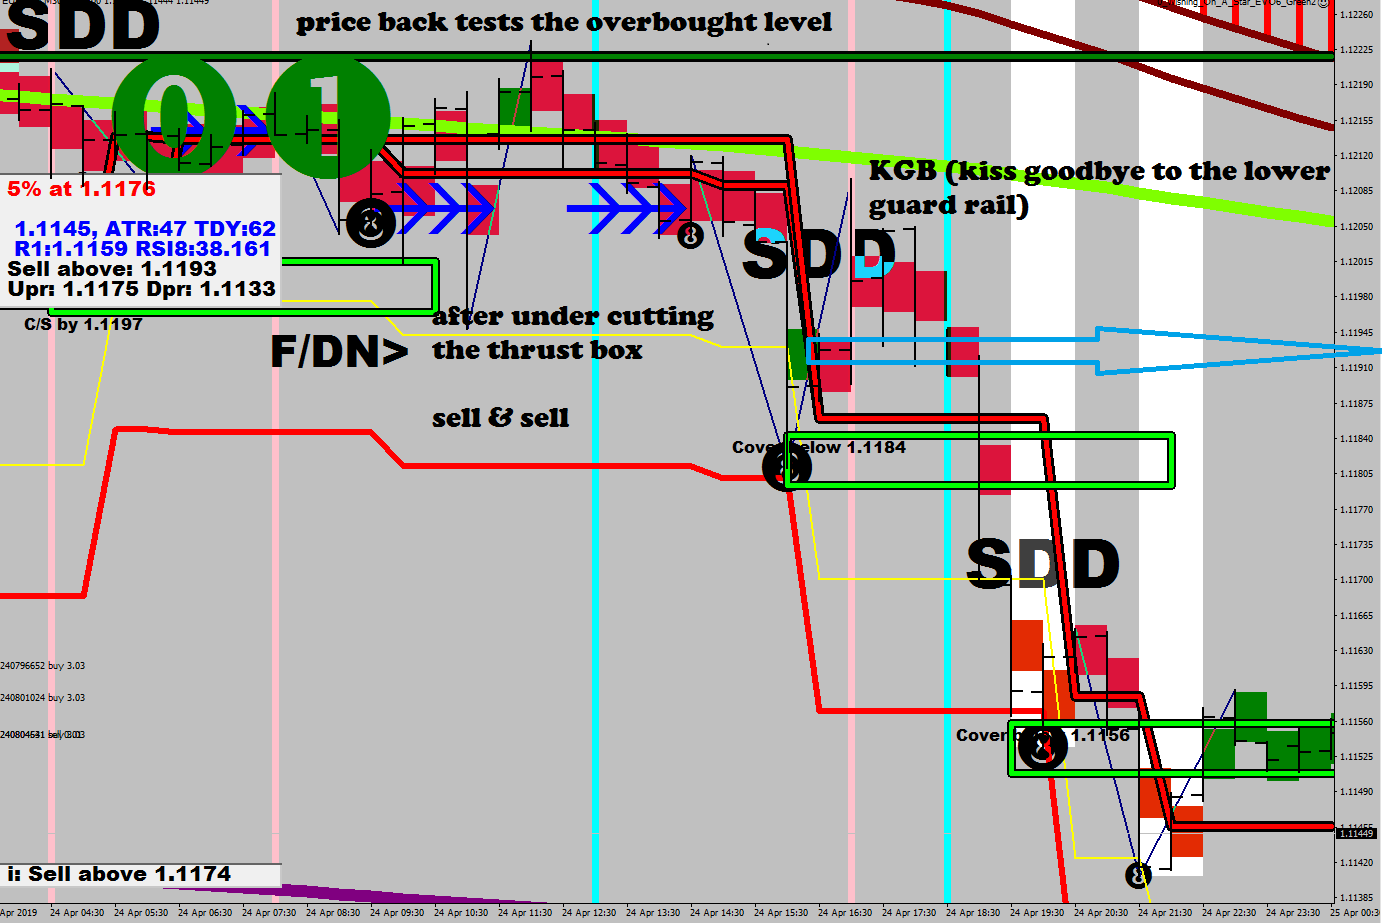
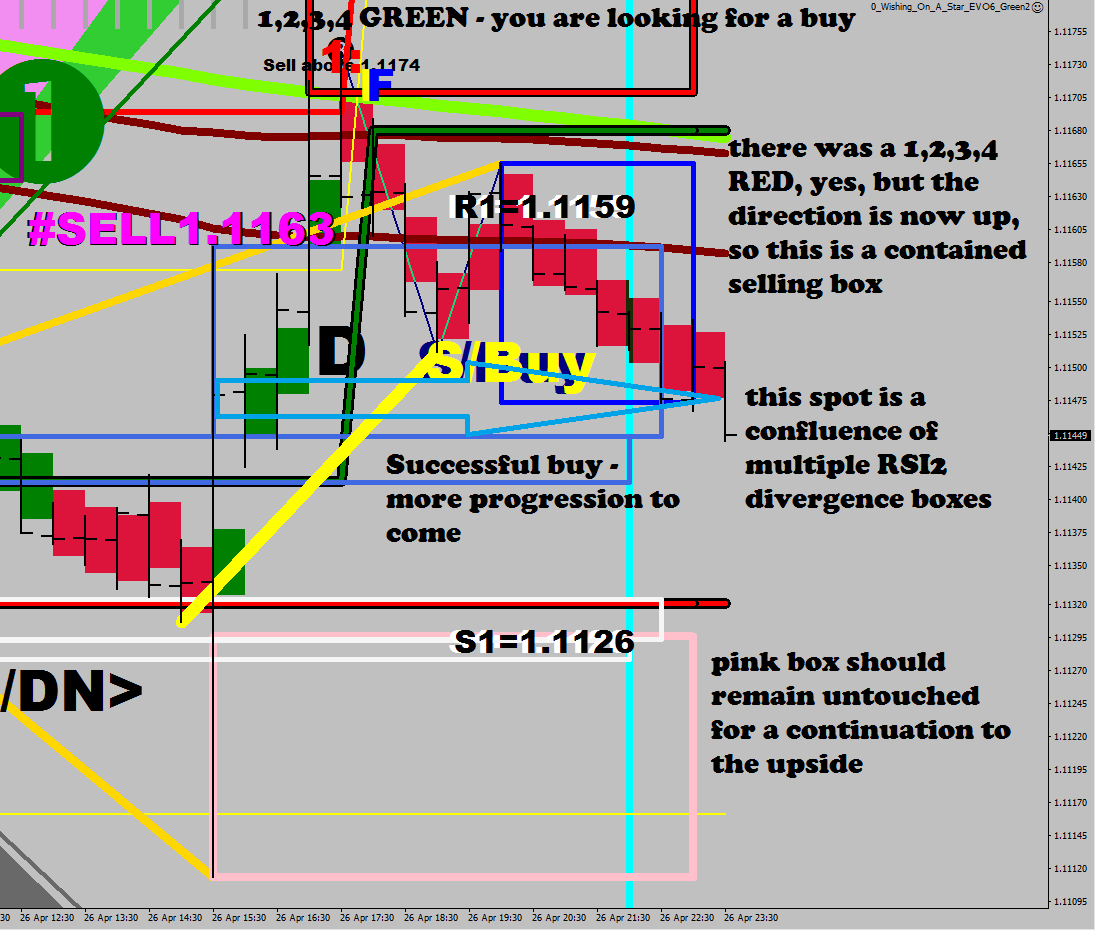
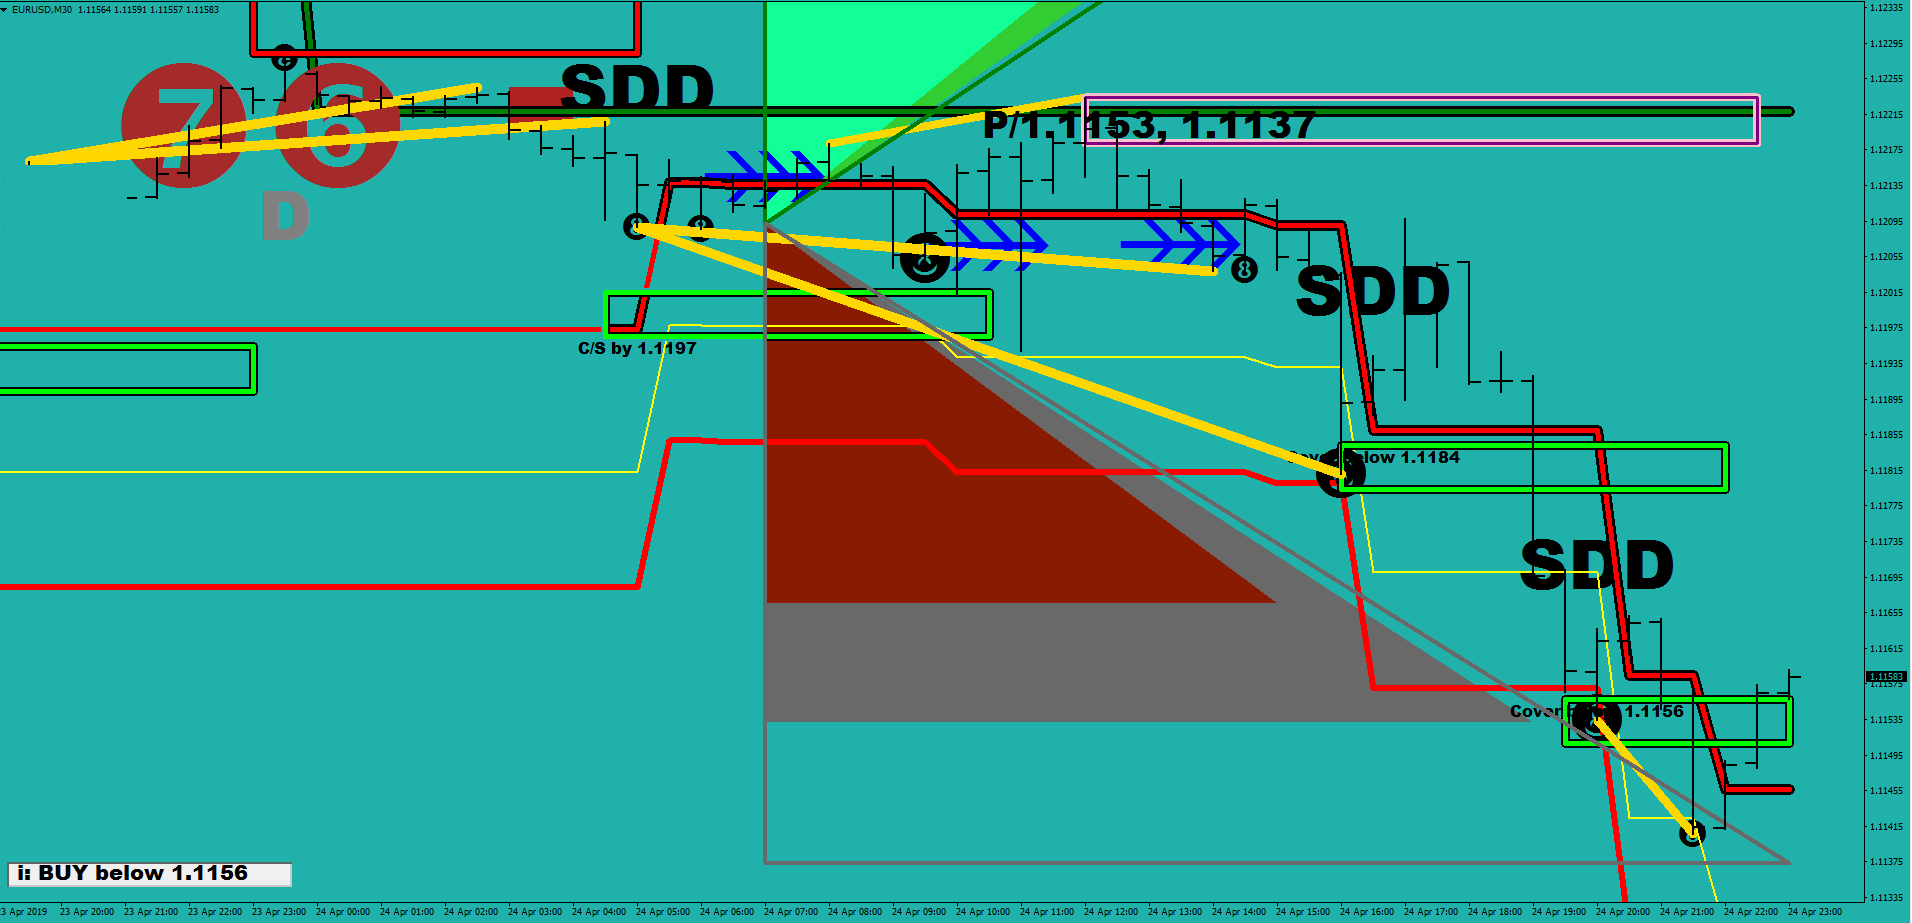
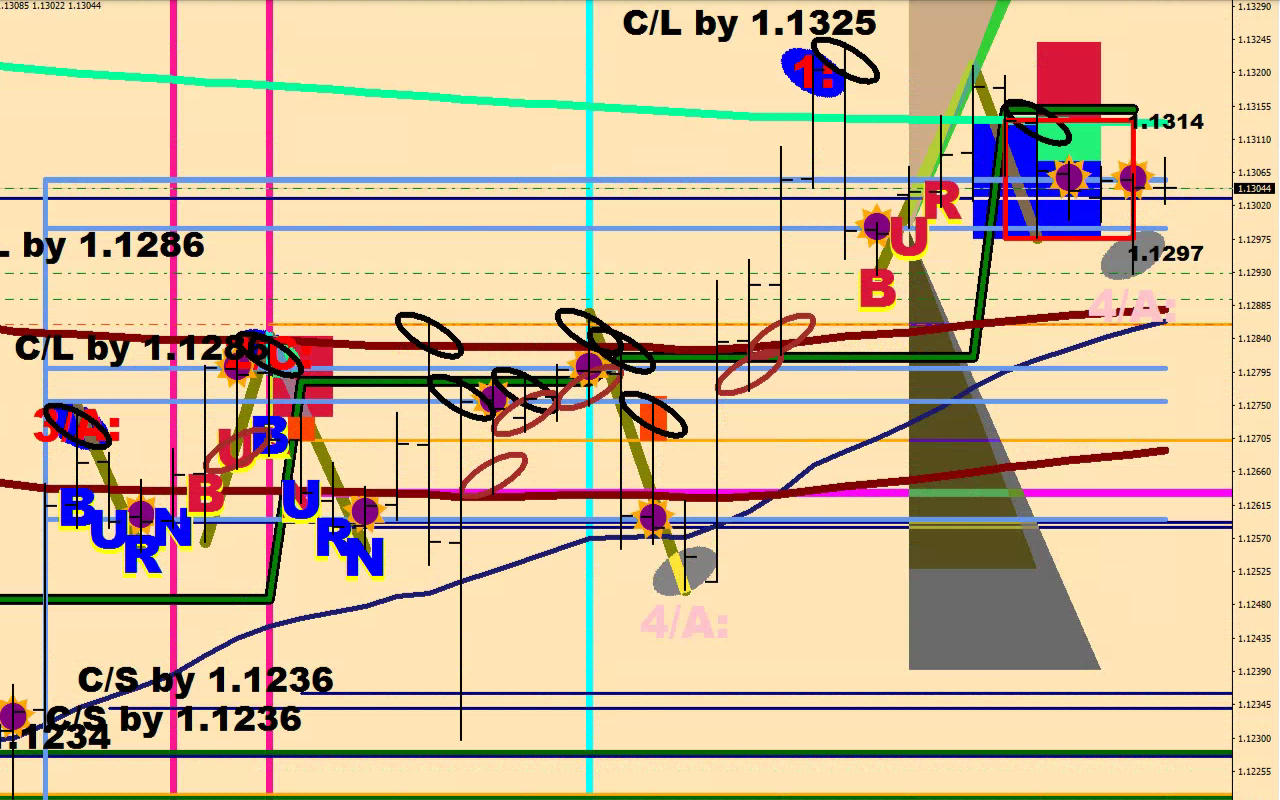
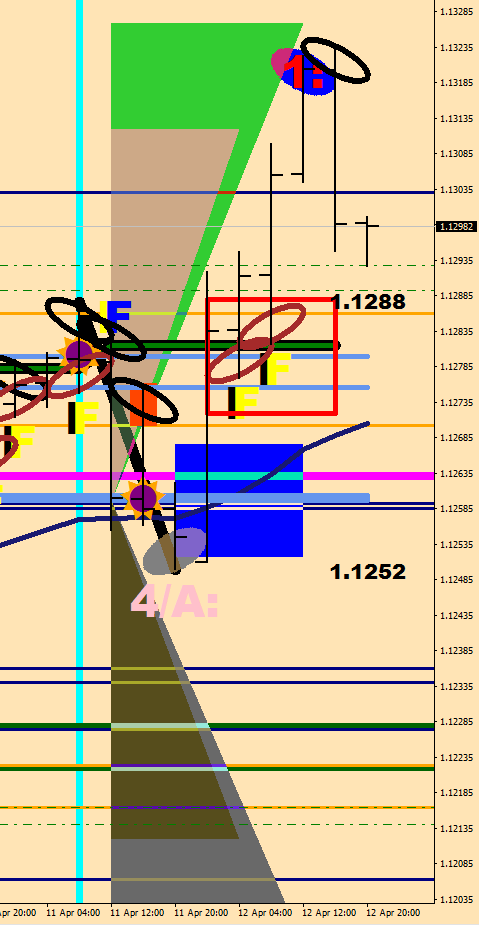
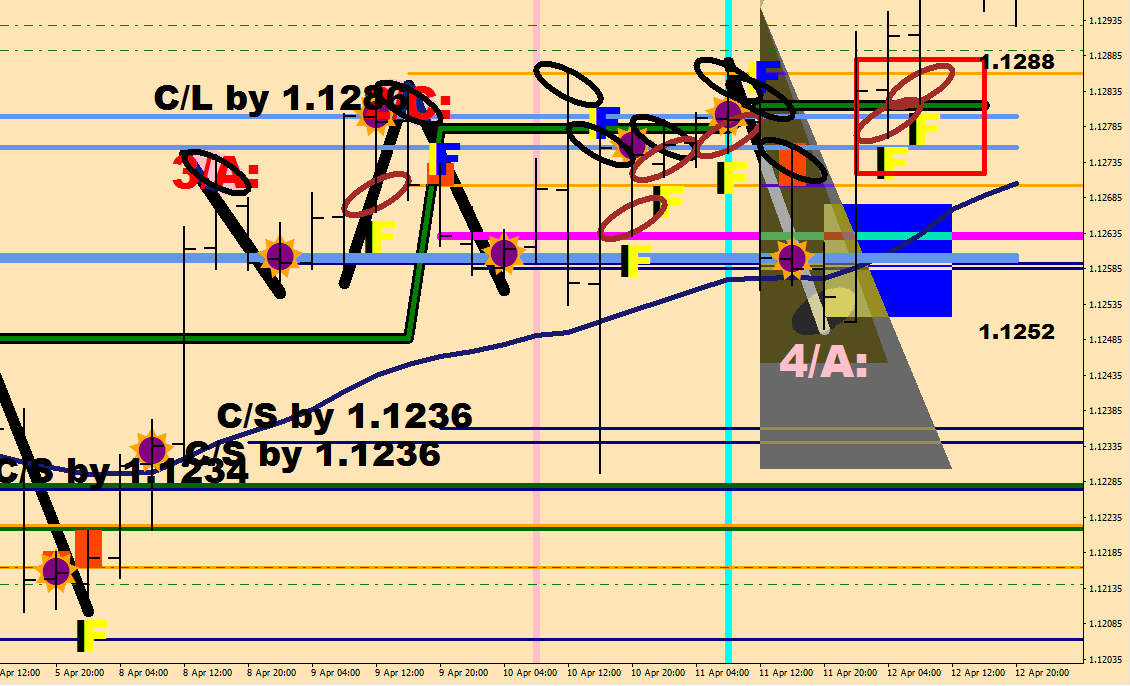
that the market made a thrust into the thrust box (image at bottom)
that the market spiked over the red line (image at bottom)
(not to mention the pause before the lower reversal zone at 1.1176)
and above all the Golfer on the RSI2
The computer did notice it, and it kept on cutting my longs.
(Buy adding a stop loss of other than 0, you are submitting the trade for a review by the croppers.)
This frustrated me, because my croppers should be programmed not to take a loss. These losses were miniscule, $4 and $9.
My first impression was that I would have to change this and implement a protection for cutting only after a pip of gain, so that I can have some chump change left after the commission.
…and I did change it… and then I realized that the program was right all along. You may not get the luxury of a full pip in your favor. So I had to revert it back.
Here is the golf cropper for a long, now the bid line (that was inserted on an implusive decision unnecessarily, commented back out)
////Exit Long (Golfer On Top)
    if( OrderType()==OP_BUY && OrderMagicNumber()!=48 && OrderMagicNumber()!=50 && OrderMagicNumber()!=51 && OrderMagicNumber()!=52 && OrderMagicNumber()!=53 && OrderMagicNumber()!=54 && OrderProfit()>0 &&
    //Bid>OrderOpenPrice+10*Point &&
    omegam[0]<0 && RSI2[0]<60 && RSI2[1]>75 && RSI2[2]<75  )
        {OrderClose( OrderTicket(), OrderLots(), MarketInfo(OrderSymbol(), MODE_BID), 5, Red );
            Print("Golfer Cropper Closed LONG @ "+MarketInfo(OrderSymbol(), MODE_BID)+" for ", OrderProfit());}
The second thing to talk about having to always update the system – which usually would come down to adding filters as problems arise.
The Slope Trader was most definitely missing a filter. You do not try to short near a fresh bottom.
There was a short opened on the spike low, and this was not the fault of the automated trading system, this was the fault of the designer not thinking things through.
Correction was made, but I am still traveling with the surplus weight of the short.
This is an excuse for having longs of course, but is a head ache as well.
Gotta think forward: if there was a short already opened occupying the maximum lot size, this trade would not had been opened or merely with insignificant size.
So, as a further prevention measure, I must allow the new Porker routine to open trades even if there are no counter-directional trades open. This of course does change the identity from a hedger to a trader.
Edit 1: (now equal included)
if (overhedging_allowed &&  Close[0]<iMA(symbol,30,135,0,MODE_EMA, PRICE_LOW,0)&& overdrivecounter<1 && no53s==0) {
//now 0 longs = 0 shorts is a legitimate opening condition
if (nshorts<=nlongs && piginthesky  ) {
Shadings show a directional logic.
Edit 2: New orders now can be opened with the equity dependent Max Lots size
if (i < 0){
      if (nlongs>0) if (OrderSend(symbol, OP_SELL, NormalizeDouble((nlongs-nshorts)*1.25,2), open_price, 3, stop_loss_price, take_profit_price, magic_number4+" OVERHEDGE SELL 0/0", magic_number4,1) < 0)
        Print("Error: ", ErrorDescription(_LastError));
              if (nlongs==0) if (OrderSend(symbol, OP_SELL, NormalizeDouble(MaxLots-nshorts,2), open_price, 3, stop_loss_price, take_profit_price, magic_number4+" OVERHEDGE SELL 0/0", magic_number4,1) < 0)
        Print("Error: ", ErrorDescription(_LastError));
        }
Edit 3 and 4 are the counter part long overhedge lines.
One dilemma is reinstating the Rope trade at 15% equity draw down.
Lately I had only 50% hedge at 80% equity/balance ratio and 100% hedge at 70% ratio (for equity hedging, but there are plenty of other hedge warranting conditions), because it all may end up being a juggling act having to deal with too many hedge positions.
I recently added additional 2 hedges further down the equity line in case the human does bad things again.
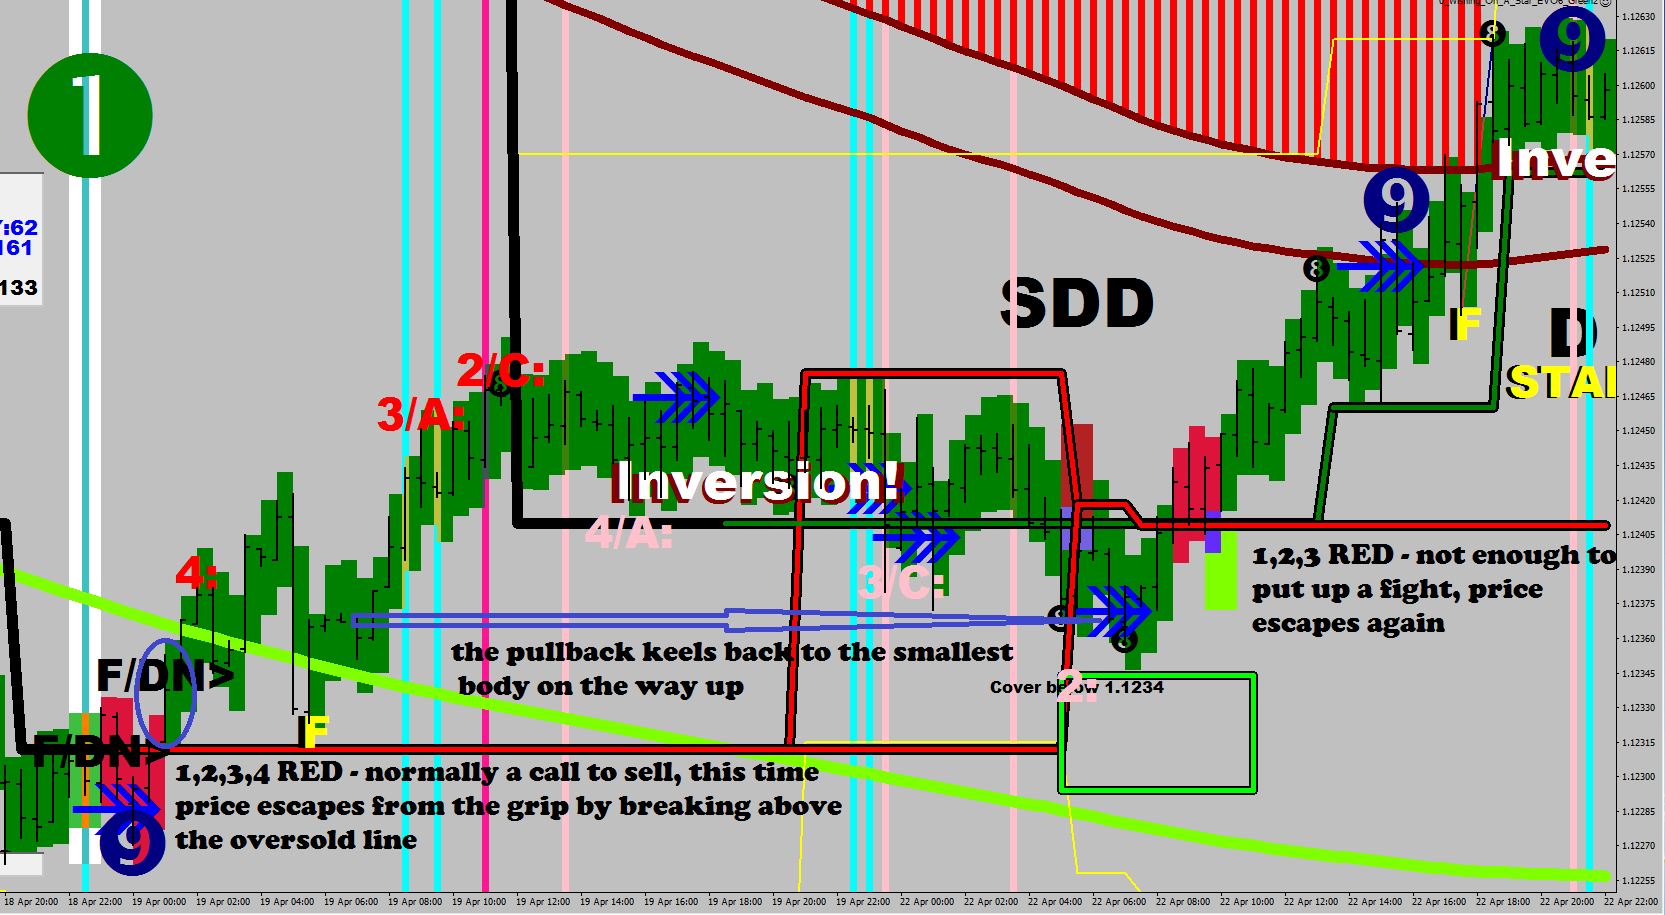
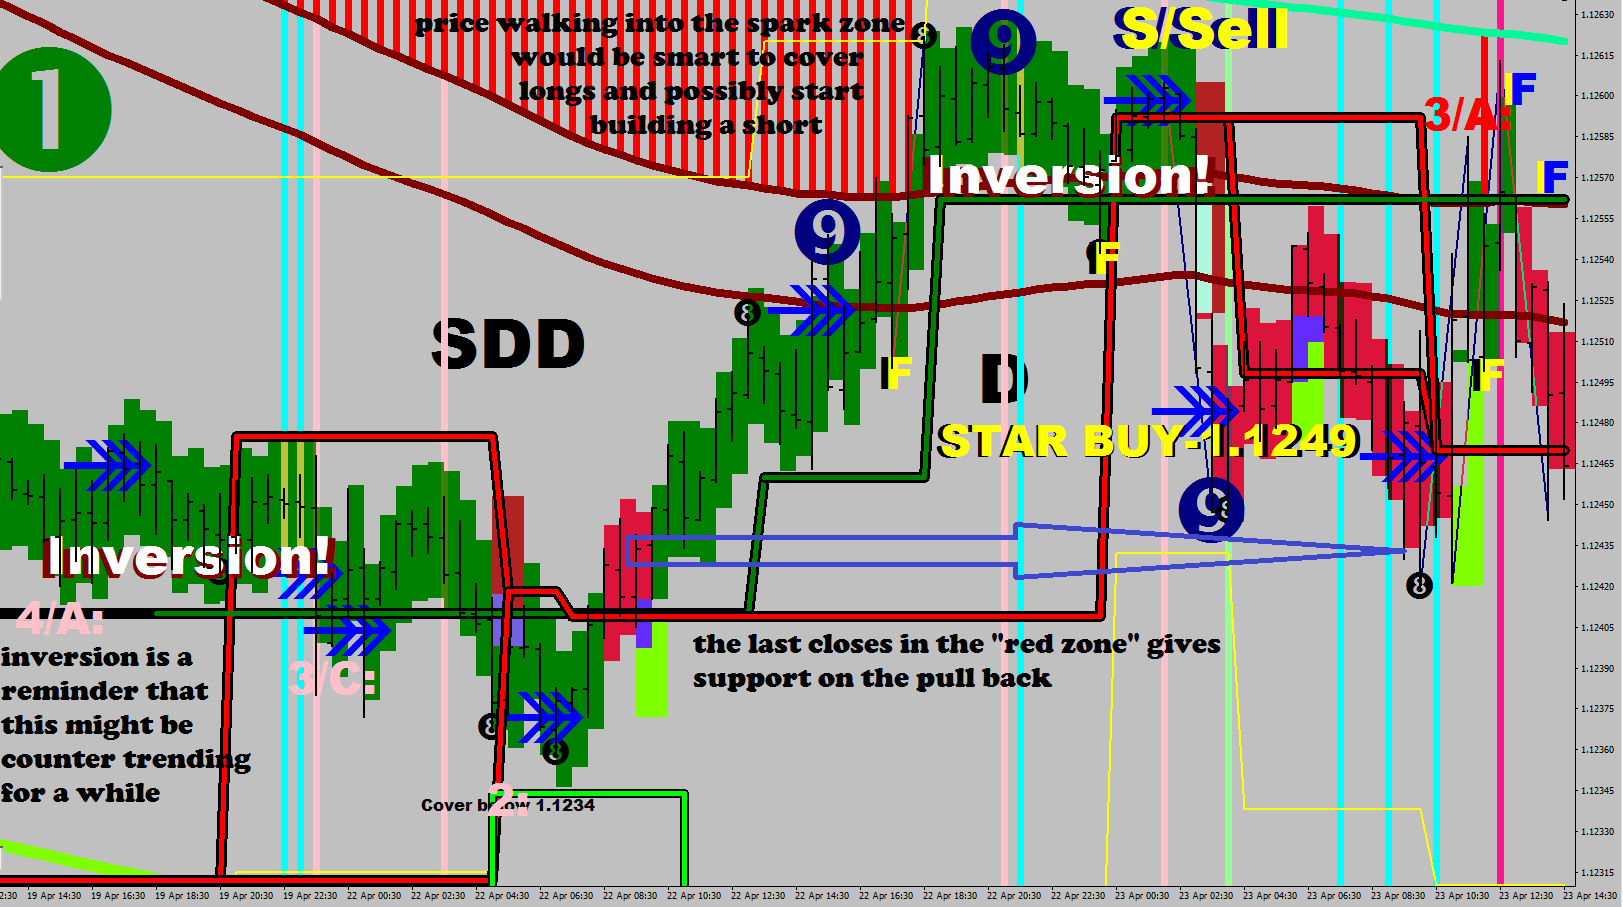
image: thrust into the thrust box, spike over the red line
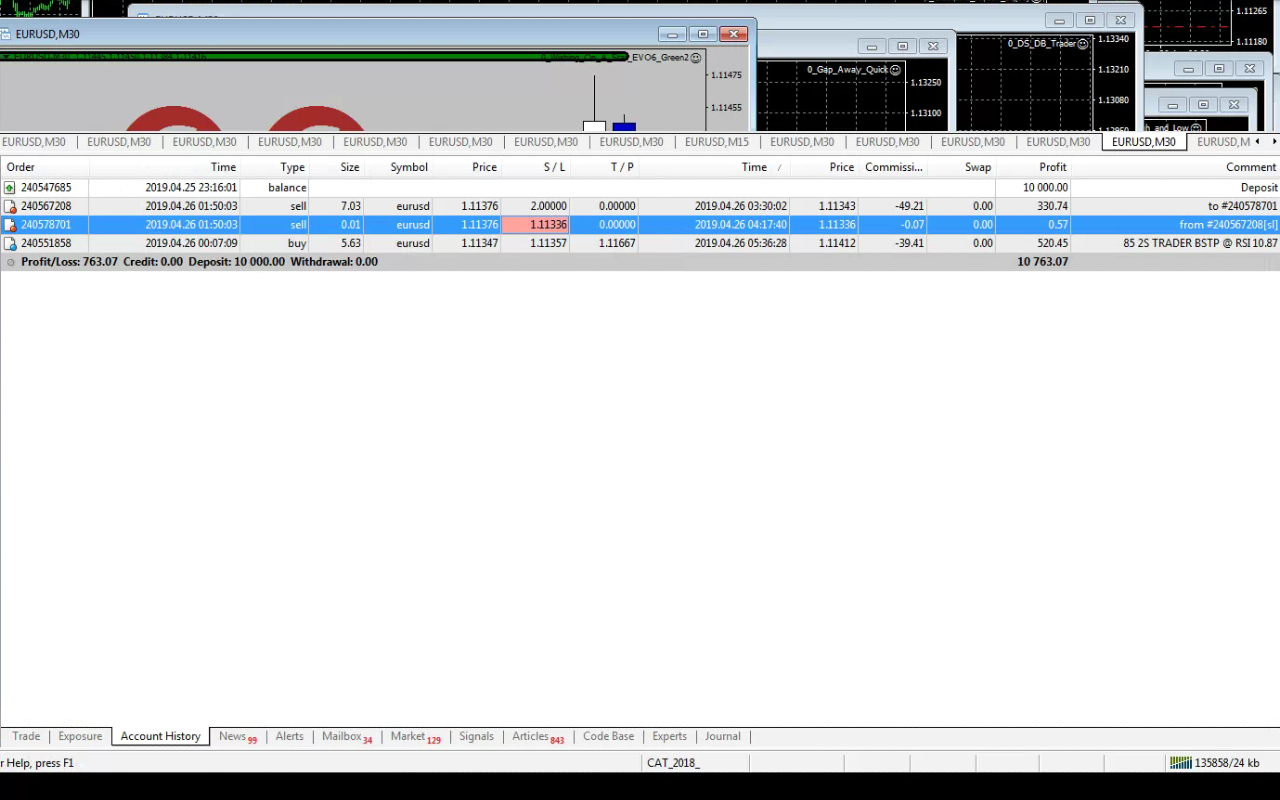
Let’s see what this account did since last night’s open.
The 2S trader opened a long at midnight (server time), and a 4% cropper killed it 5.5 hours later. Pretty straightforward so far.
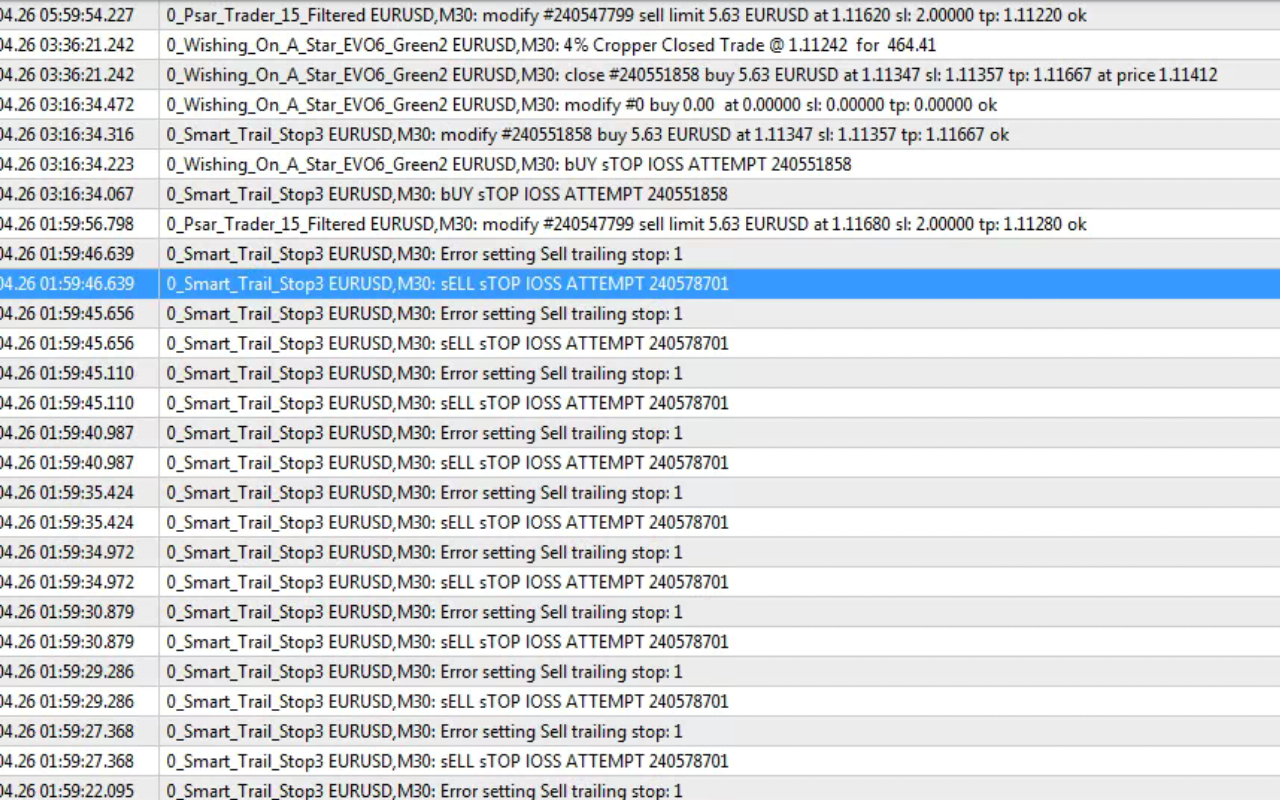
As for the other trade there is a whole lot to talk about. I cannot find any more which routine opened it, because the comment lines were overwritten by the system with to/from, and the magic number was lost. The experts history by now is littered with stop loss attempt entries, so the open has been pushed out from the log. The size is somewhat of a clue. It had to be a hedger routine with a which ever is larger logic or an overhedger. 5.63×1.25 = 7.0375. So this order was opened by the Porker Overhedger (that I coded yesterday), and the magic number was 54.
Since the sell order was opened two hours after the long, if may had been a hedge order. By this I mean, that the short possibly would had never gotten opened if there weren’t any longs on the books.
Lesson number one is an order is merely an excuse to make money. You should not be afraid from being in the market most of the time, and nor should you be afraid of leverage. In a sense you need to provoke yourself into making money. You need to think things through properly at the designing table is all. Remember that both trades were opened with “codes” instead of stop losses, that determined which kind of trail stop / crop can be applied. You must always think of the individual routines as a part of a well oiled system.
Lesson number two is the way the hedge trade was eliminated. The first close out had to be triggered by a cropper (doji cropper, golf cropper or star cropper), but these croppers were intelligent enough to leave 1 micro lot open from the full size upon closing. Why? Because of keeping the magic number in the order list would prevent the hedger from wanting to re-open the hedge in case the opening trigger is still valid. As you can see, the smart trail stop was entrusted with finishing off the micro lot that was left behind.
This was a well orchestrated effort from an automated trading system.
As I mentioned, I am not following on anyone’s path, but there were people that handed me some tools to work with. Props for George Lane with his works in Stochastics. J. Welles Wilder… what would I have achieved without your RSI? I am grateful to all those contributed in the development of the MT4 platform and the mql language.
I saw the use of RSI2 first from Craig Severson (although he only used it on daily charts for his swing trade), and a lot of the lingo I use came from him. Credits to Ira Epstein for hammering away at stochastic embedding. Credits to Simple Ton, who showed that there is no need to be afraid of saying things out loud. Scott Barkley was an influencer even if in a backward manner: his statements helped me to disprove redundant things. Like when he mentioned about “Big Boys” having Fibonacci built into their tools. Simple Ton said it first: Fibonacci is only in your head. It is entertainment for the retail trying to act scientific about something that has no science behind – I could add. Scott kept on pulling his phrase out from somewhere saying “The retail trader makes 5-8 pips on a trade. If you are doing that, you would have to be right 90% of the time for the rest of your life”. I have disproved every stupidity in this sentence countless times. I had 10% plus days with 2.2 pips average trade gains, with 60%-70% percent trade success rate. I can do a 100% gains in 2 weeks, or even in a week. I made 94.5% last week with 5.5 pips average gain size. A 100% gain means that you can withdraw all of your initial capital and your risk from then on would drop to 0: now you are trading with capital that did not even exist a week or two earlier. Scott, you just keep at trying to fish out the largest pip size trade – perhaps one day they would start selling bread for the largest pips instead of cash. It would look good certainly hanging your largest sizes on the wall, something to show for and sing ballads about to a grand kid. Keep putting those lines on your charts – especially the heart one, that’s very cute. I myself haven’t been drawing trend lines and retracements for ages and I intend to keep up the habit till I live.
In closing, I would mention, that I am judgemental of the redundant phrase, “price action”. As Simple Ton put it, “What happened to people’s brain? Did it turn into mash?”
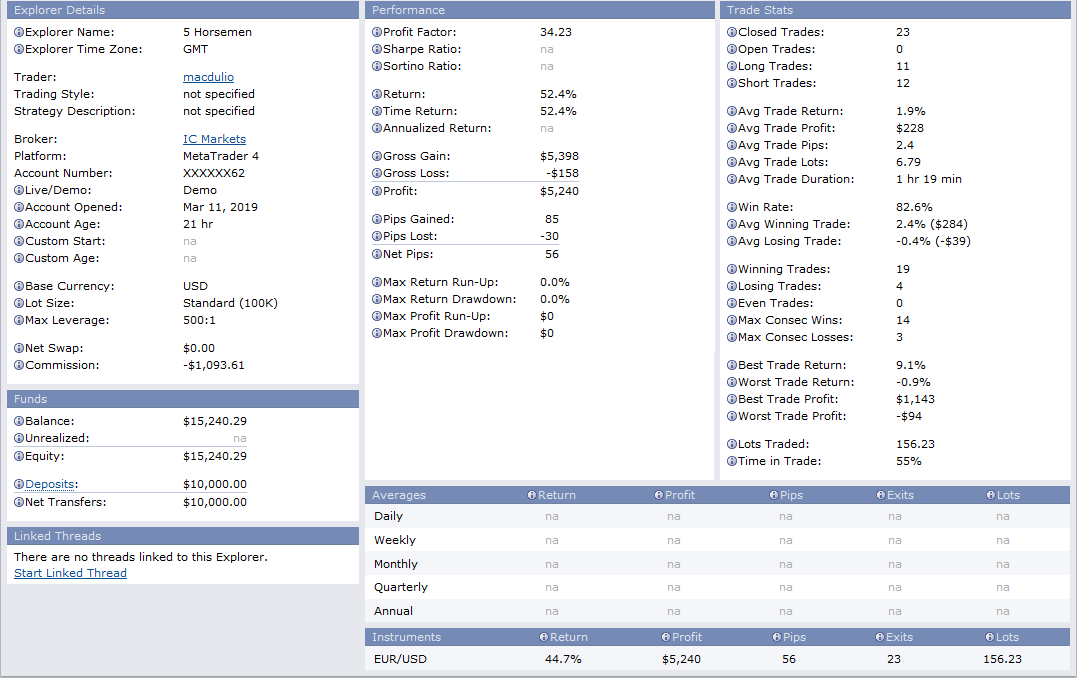
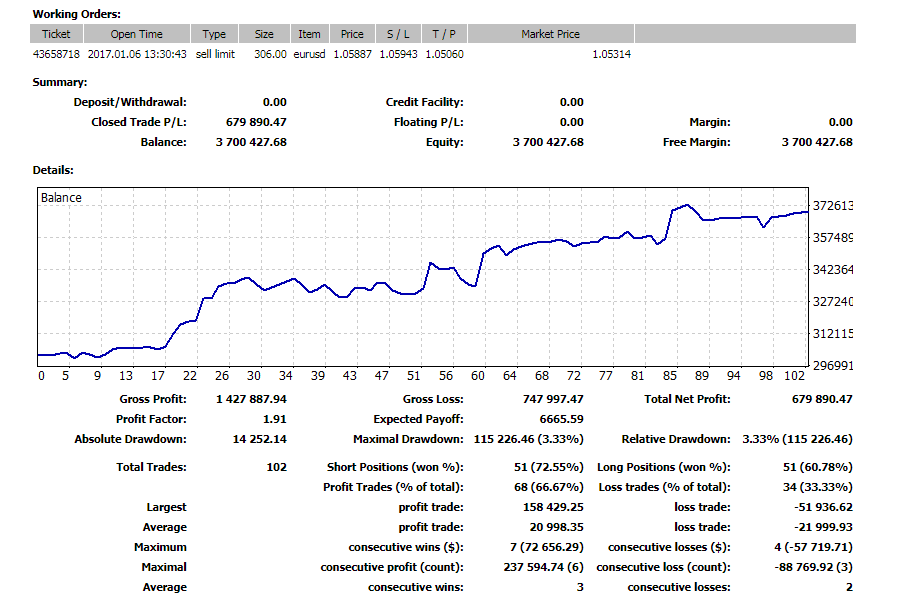
2.4 pips on average per trade did not prevent from making 52.4% gains in 21 hours.
72.55% of the long trades and 60.78% of the short trades being successful did not prevent from making profits.
In the first part I gave you the #1 objective of a trader.
In this second one I’ll give you the second and the third most important rules of trading.
#2: yield to reversal divergences
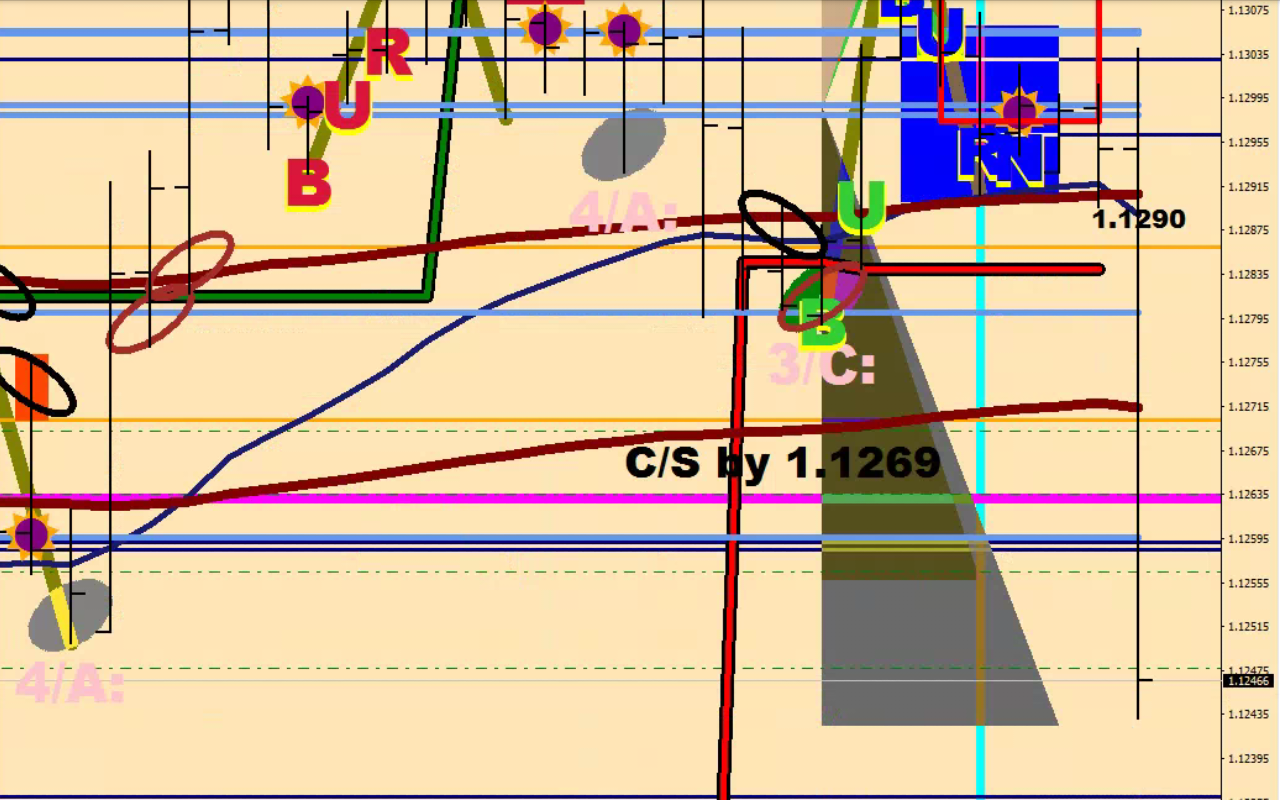
#3: prepare for a sound barrier failure
My all you can diverge buffet, God Awesome Indicator got an upgrade in the 1.7 version by including a search for the last 3 RSI2 divergences on the up and the downside. They are plotted in gold colour.
The yellow lines are stochastic reversal divergences.
The brown lines are stochastic continuation divergences and the red ones are as well but with a more serious sample bracket.
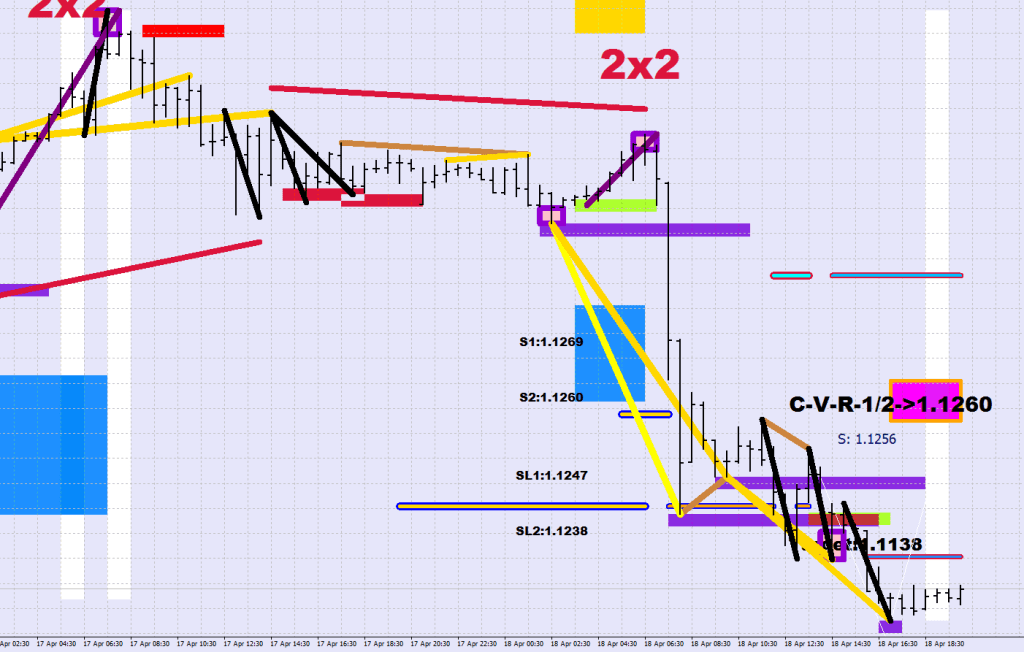
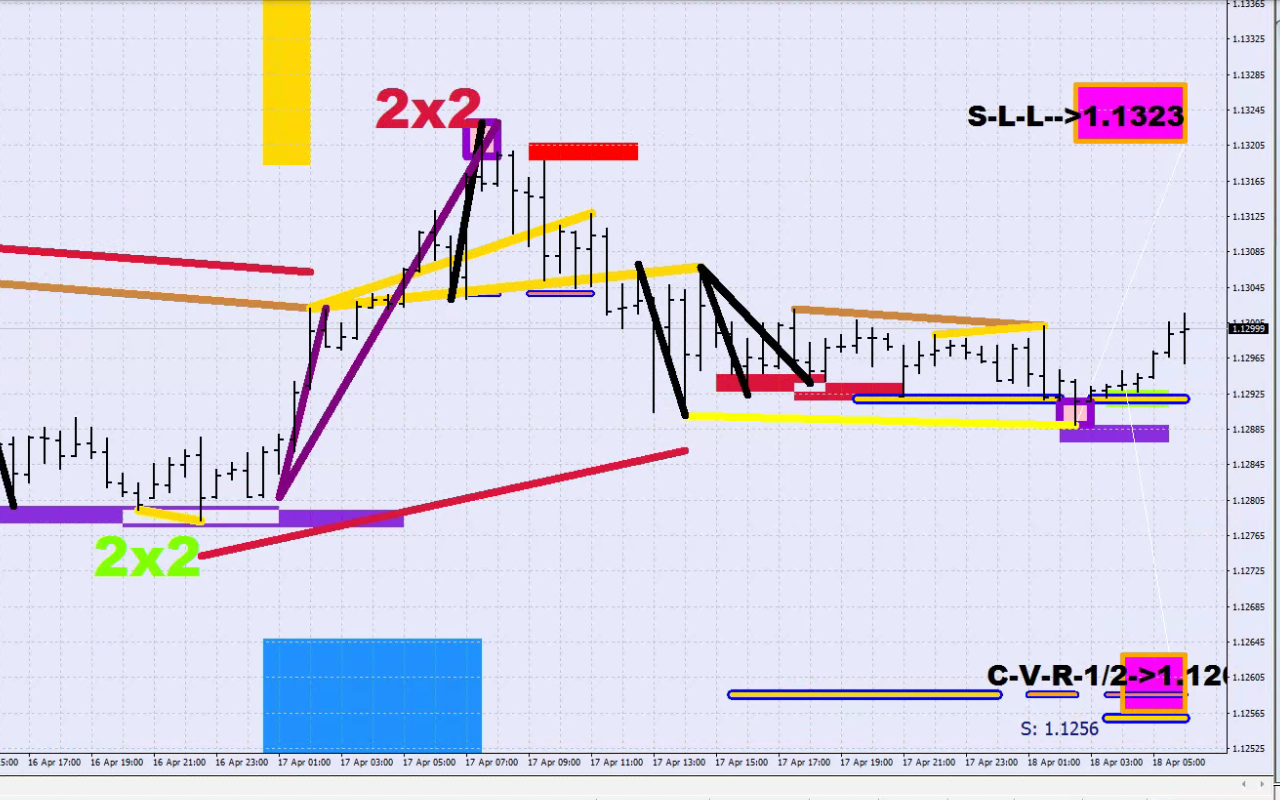
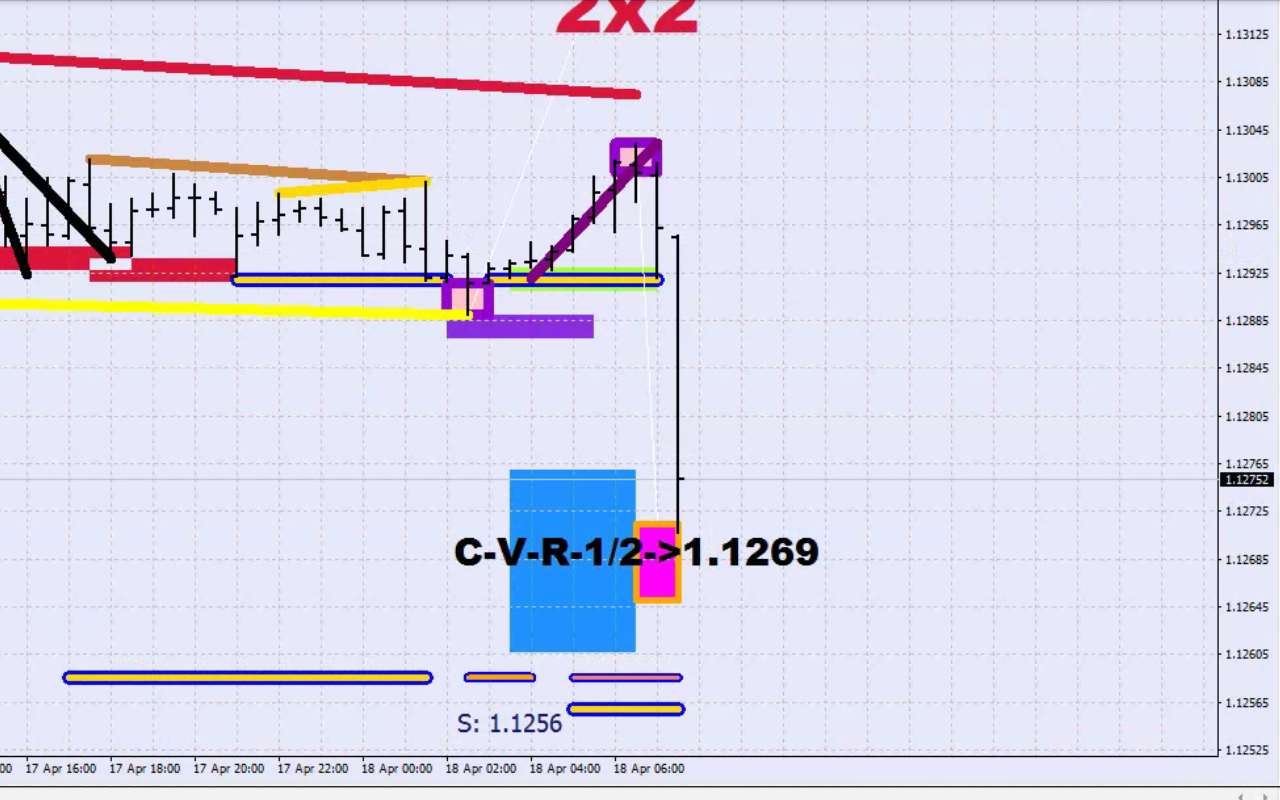
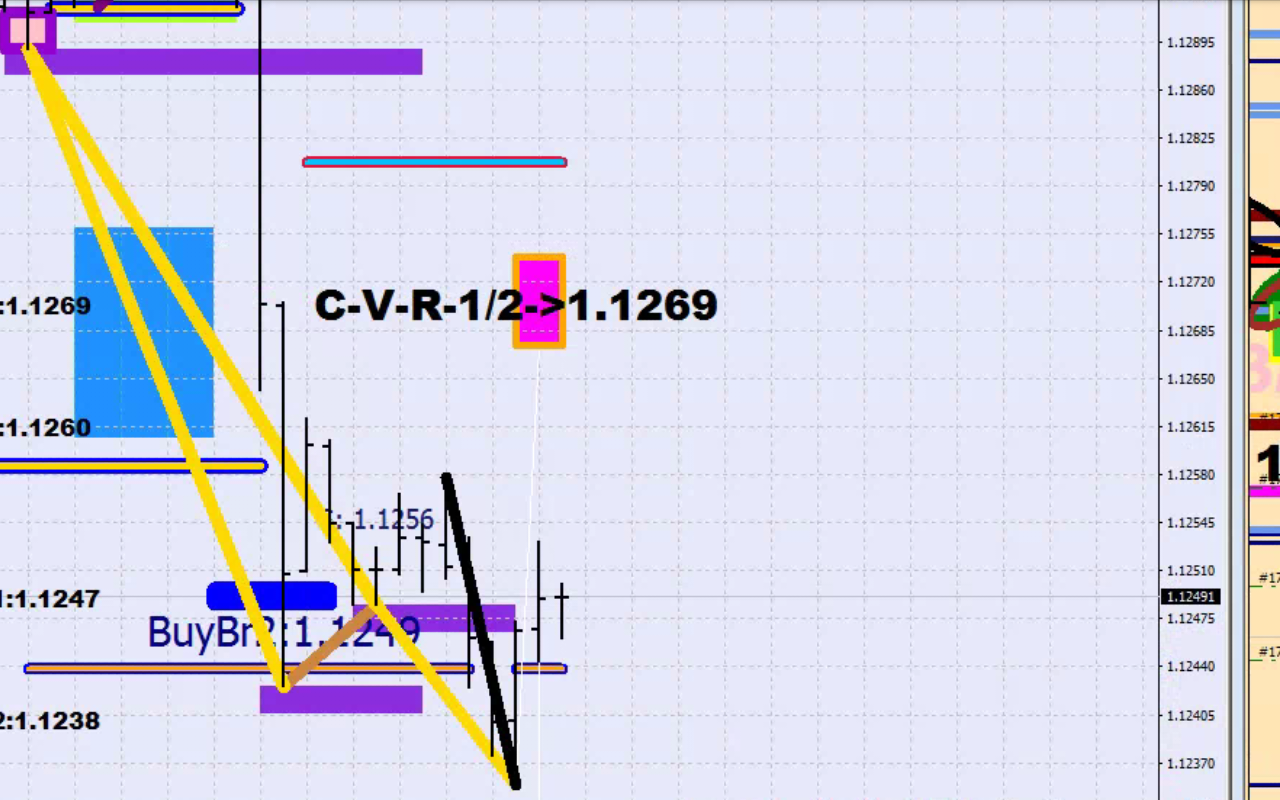
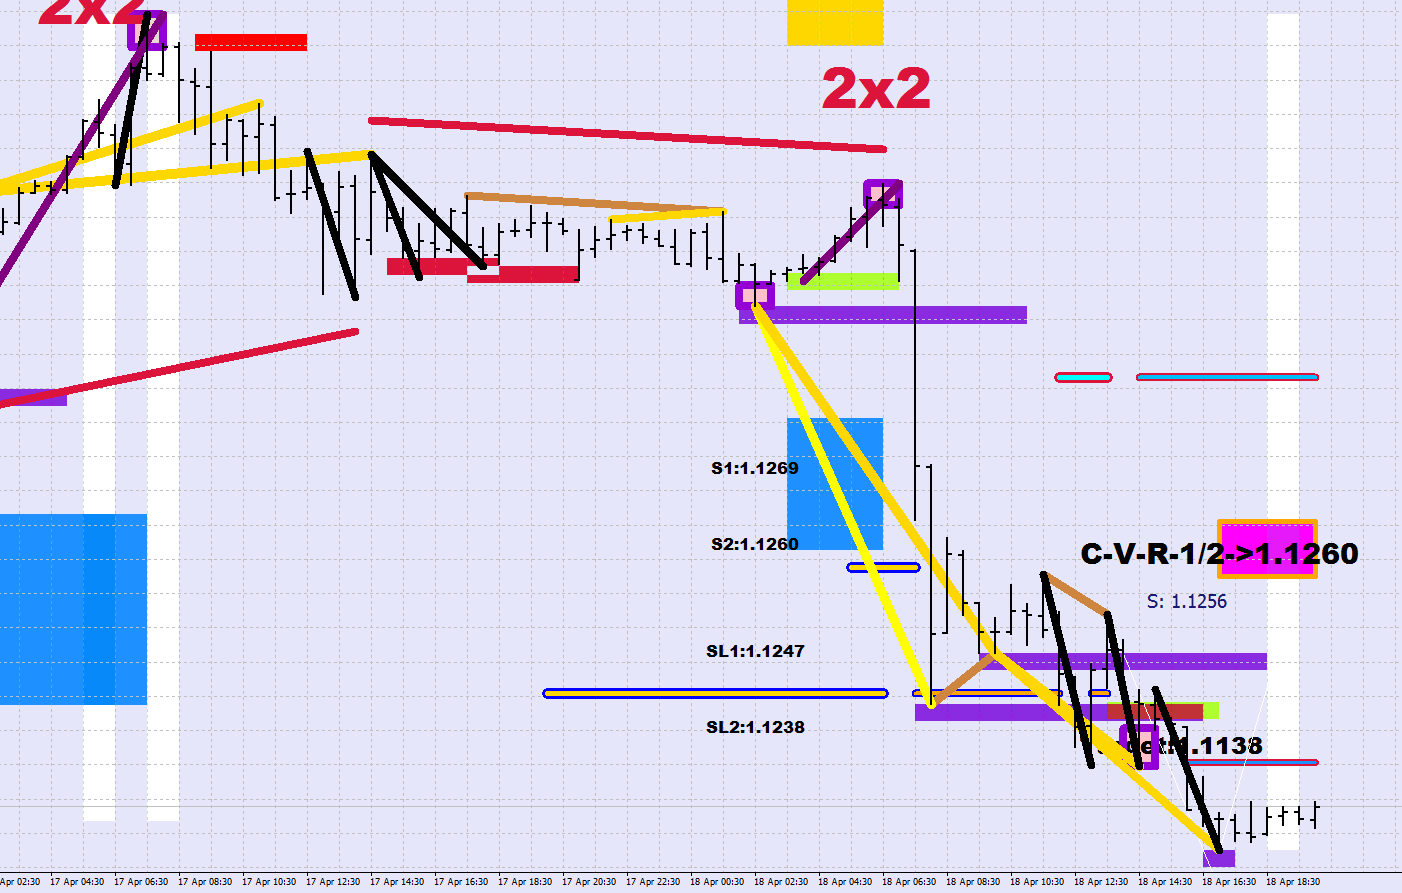
Why did I sell at the price level on the above image? Because price walked into the net of the last RSI2 divergence (after printing an RSI2 Sharpie at the bottom – purple square). See, price does not have to stop dead at the RSI2 divergence plot, it may exceed it by 1/2 fluctuation size which is 16 pips on the EUR/USD. Only upon exceeding that would I consider the divrgence failed. And if you look left there are additional untested RSI2 reversal divergences nearby. These 4 altogether (one is no longer plotted, the 4th – it has its end at the last upper sharpie) would make for a rather tall order to overcome.
The sound barrier I referred to is the fluctuation size distance which is another plot of the same indicator – the white lines projecting the limitation of a move that does not mange to step outside of the fluctuation range (the box itself is from Fluctuation distance to Fluctuation maximum).
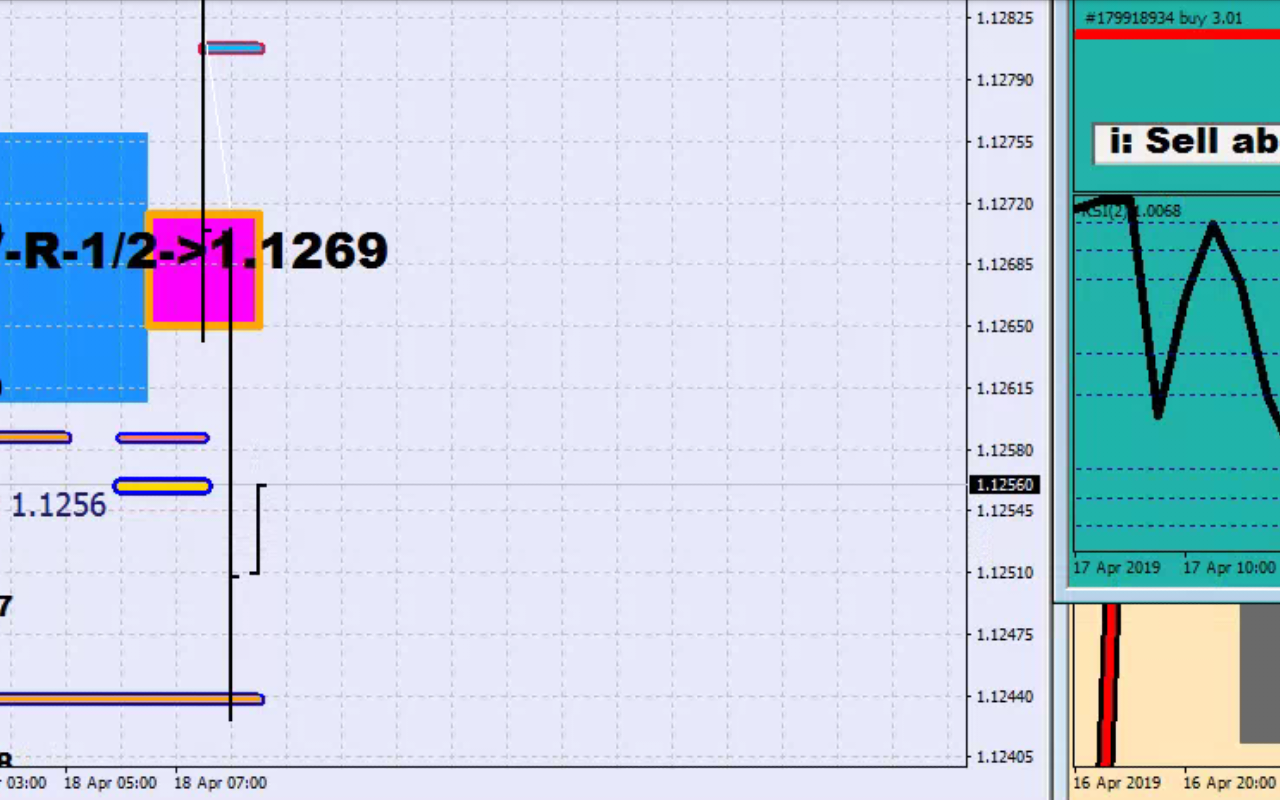
What is important here is gives you with high probability the extent of the move you could capitalize on and spells out a number as well. (I.e. CoVeR 1/2)
An RSI2 divergence can be considered as a root that is likely to yield the untrapped participant 3 pushes in their holding direction. Respecting this would be closing the holdings in the opposing direction and only reinstaging them upon breaking the divergence (by 20+ pips).
I have articles on the Blog about the Fluctuation size as well as about the features of the God Awesome Indicator.
Call me to say how much it would be worth to you to have a copy of it.
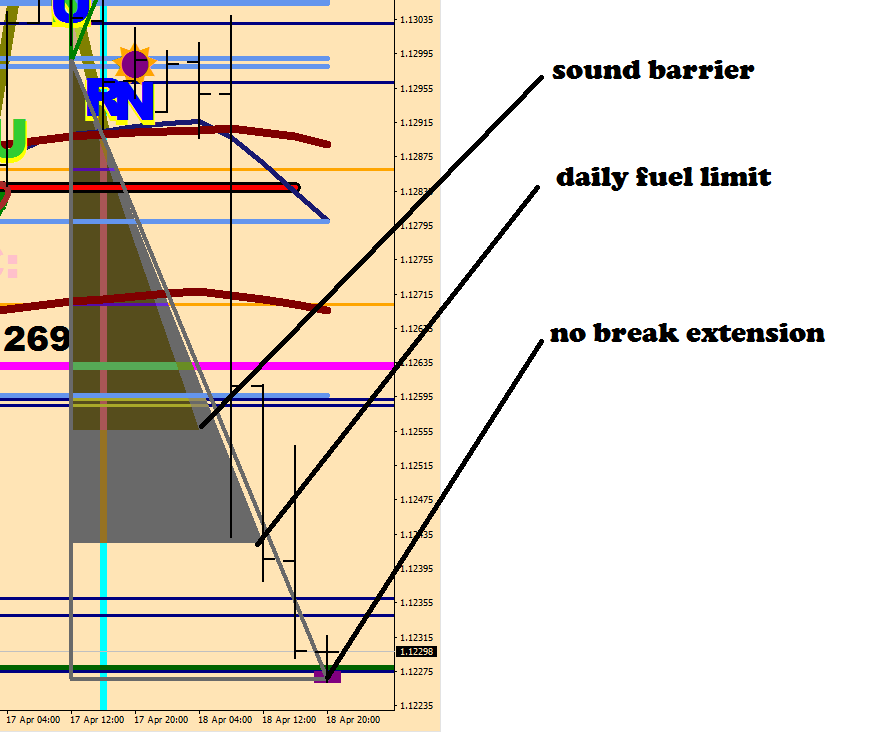
The bounce back up was contained in the box, and was a sell again. Daily fuel limit reached
An extension is a no break after a power move. 1/2 fluctuation size = 16 pips would be a no break. 43-16=27
The utmost condition is no more stars (overdrive) and RSI2 divergence = bet the farm now!
Let’s discuss one mistake I made today and the ways I invented in order to prevent committing the same mistake again.
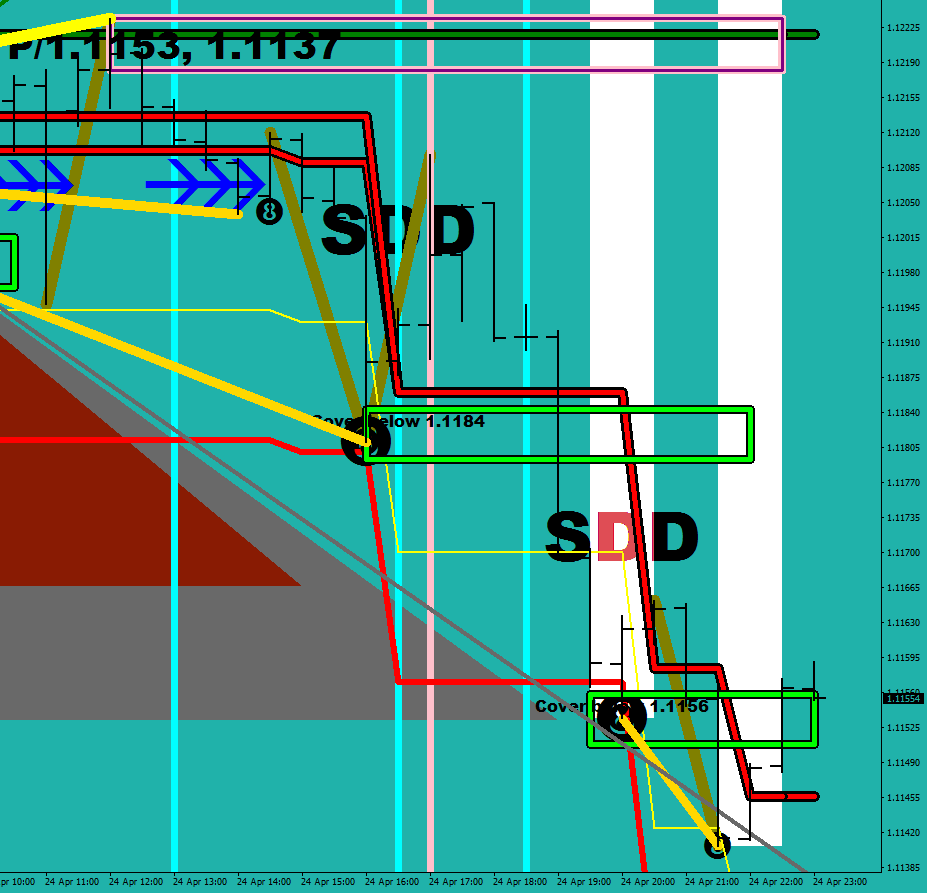
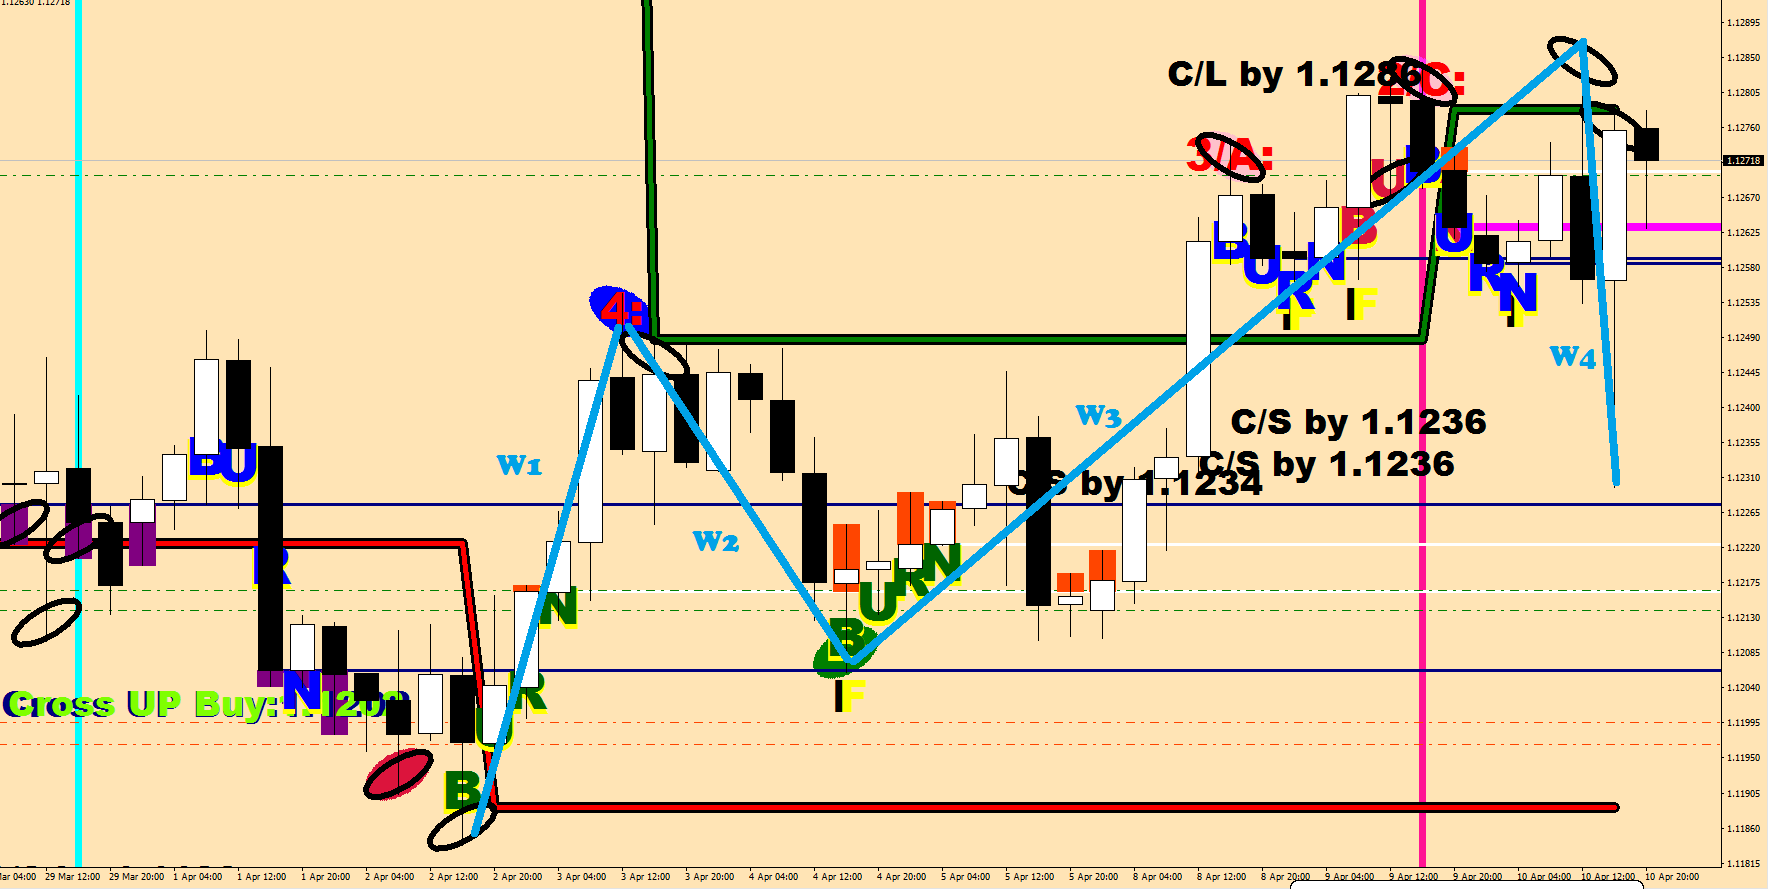
So I made this image the other day about the wave structure. That W4 did not seem right for it went down and back on the same candle. It was a liquidity break.
A liquidity break happens when the market is trying to find footing, trying to find orders. During a news event the participation dies off, so a “larger” stack would turn the price away.
The Burns outlined the Cover Long level – with a displacement of 16 pips on the upside, and the Cover Shorts levels by a displacement of 20 pips on the downside – so this part was already in order.
As you can see, the Green Burns were the starting points of Wave 1 and Wave 3. The beginning and the ending of a move are not that different – this will come back later.
Now, let’s talk about the real Wave 4.
The most obvious thing on the image above is that the wave 4 found footing at the Green River. I have been saying out loud, that the Green River has the power to reverse a move, any move. What’s more is that usually the first leg would land on the closer end and the second would go to the further end.
Dynamics: a subtle thing, but you could read this above as well: the SDU projection box on the upside was thrusted into, the SDD projection box on the downside was left untouched, and the SDU to the upside was blown right trhough (a sign of a starting move).
Of course there are the Green ellipse highlights of the lows by the Wishing on a Star, which mean buys as well as the green rectangle, which represents losing the oversold status (- which is now factored in the candle shading).
The blue arrows represent a right shoulder (for this was a Head and Shoulders reversal). There was a cross up warning earlier.
The 2 new added features are the on screen RSI divergences (in yellow) and the black, computer identified Terminal looking moves (based on 3-4 candle price behavior).
Let’s talk briefly about what happened afterwards.
There was a Failed Buy (no liquidity/too fast run up) that represents a warning: Sell the next cross below RSI2 – 93. This means the first settled 30 minute value below 93 – after being above. If you look in line with the DDI-T print, you shall find it. (I just noticed that the price actually spiked into the DDI-Ts projection box).
The last wave (I would argue that the whole Wave 5 was an ABC up) got kicked off with a Green Burn again. Price failed in the Bull Zone 1 where the Short Time Frame Bulls covered. There was a count sell, the red line got exceeded and there were 3 overlapping terminal lines – as well as a starting, – terminal looking – move to to kick off the move to the downside.
The Successful Sell would urge you to take a sell again on the cross below 93.
The green highlight box is 1 fluctuation size away from the swing above – white line connects it. There is an inversion of the overbought and the oversold lines – this may mean the market embedding – which of course would mean counter trend to the upside, since this is still an embedded oversold market.
If I had to pick a buy zone, it would be the spark zone with the green sticks.
My personal mistake was the wrong wave count and complacency: 235% gains in 2 weeks does not exactly make you being on your tip toes wanting to hedge – the 82% balance to equity ratio and the late night combo made me turn off the Auto Trading (and the auto hedging with it), for at 80% half hedge would kick in and at 70% another half, and overnight a mere wrist move at the broker would push the ratio below 80 even if the price did not proceed further. There was no disaster coming out of this, but I missed out on plenty of monies as a result (i.e. my usual daily 20% and only made 5%).
Another, in your face screen plot from yesterday is yet another way of plotting the daily fuel limits. Now they are two triangles projected from the weight and the fuel overbought/oversold areas are the two flat ending lines of the triangles. The coloring has a path of least resistance logic which is based on the number of near term 4h dojis above versus below.
The 4-h overbought embedding may sustain as long as you do not get 2 opens below the overbought line which is going to be adjusted to the new swing high soon (during the Sunday open). The way not to lose the embedding to the upside at all is by taking out the high in the first 4 hours.
If it loses the embedding, then these 5 waves to the upside were all she wrote.
Risk is just as relative as everything in life. You have the
illusion of having time, but you don’t.
You sit up for the notion of setting stop losses, and
thinking that your capital is protected. It isn’t. To hold a position into the
weekend carries an enormous risk for instance, and it can cost you all of your
risk capital if things take an unexpected turn.
The earlier you realize that all of the money is at risk
that you put in on a bootleg brokers account, the better off you would be.
I opened an account with a Russian broker once – when I was merely
trying to open a demo to find out what their spreads were like. I got a phone
call later that was almost threatening: “You opened an account with us, we are
waiting on your next move” – they told me. I would never expect that they would
care to pay you out any gains even if your account would show them to exist.
Who are you going to turn to for justice? Your mommy? Whom are you going to sue
in case of an offshore broker say on the Marshall Islands?
You would find that despite all of your efforts, having a
pending order placed for a hedge with the broker – to eliminate the event that
you go offline, i.e. during a power outage or if the internet provider goes
offline, your safety isn’t assured.
One of the brokers I have an account with goes offline during
the morning hours quite frequently and does not even feel like they have to
apologize for it. I guess the attitude is that people would blame their cell
phone connection / provider. But I have multiple accounts with other brokers
and I can see that they are on; plus I can log into my home computer remotely
and look at the terminal’s journal where it would say “unable to connect”.
Other times your app would come back with “common error”. Anything can happen
when the market is open even in the matter of minutes, let alone when you are
unable to make any changes for hours.
One time I had to phone up the broker when an account went
into red lining (margin call, not margin cut) – they claimed that they sent out
an email – which I never saw (blaming a French vote taking place during the
weekend), and arbitrarily they took away the leverage on a Friday, which meant
the 1:300 became 1:50 and the account that was fine got rendered into being
under margin call when you are unable to hedge. I had to get them to temporarily
re-apply the hedge so to be able to take on a hedge, but as you can read out of
this, there are a lot of ifs, and ultimately this poses another risk factor
that can cost the account itself. Brokers have the tendency to utilize men made
chaos to turn it into a payday for themselves.
So, what is the answer to all these? You need to choose the
broker well. You mustn’t use stop losses unless you feel like volunteering for
losses. You need to have a hedging system in place instead, that can save your
ass, and all of these would account for nothing if do not manage to develop close
to perfect senses to what market you are in and be able to anticipate /
acknowledge turns incredibly well.
Brokers sometimes do not acknowledge your stops either. I
read someone’s story that when the Euro peg was released by the Swiss Bank, and
they moved against each other by 42%, he got stopped out from his USD/CHF
position with a 10% loss, and was happy with his broker. Others were not as
fortunate, and their brokers did not cut their losses until losing 25-30% on
the same trade.
Is this an impossible quest then? Not, but it would
certainly cost you anything you are willing to give and more. If you are lucky,
then you come across somebody like me, whom can spare you losing everything,
for I have been through it all, and I managed to learn and develop things for
it.
Now, let’s compare quickly the average Joe putting on these
perceived risk/reward trades trying to catch the big fish with someone who has
a philosophy of “getting some”.
If you listen carefully, you may end up understanding how
Capitalism works.
Exhibit A, your so called proactive trader gets very good at
his/her game and manages to make some money by the end of the month, in the
neighbourhood of 5-10% relative to their deposit size. He constantly volunteers
for losses.
Exhibit B, the frequent hedger guy does not get every turn
right, and may get called into partial / half / oversized / full hedge,
starting from 15% relative draw down, but in return, always ends up making
something, very often is holding counter positions that takes away some or all
of the risk, has control over when to take a loss, and his objective is to gain
equity faster than it is moving away from him. He makes money every day, but to
be able to pull out funds, he would have to get very good at recognising and
catching the turns – and be not afraid to take smaller losses if that prevents
further draw downs. Mr. B can make on his high leveraged account (1:500)
50%-100% gains per week. If things go well, he can take out all of the gains
biweekly or so. His risk went to zero relative to the risk capital on the
second week of trading: he got his capital back. Now all he has to do is to
repeat the same thing 25-50x more that year, without forgetting to take out at
least some of the gains when the account has no holdings (open positions).
There is a size limit that despite of greed the account should not exceed,
which derives from the broker imposed maximum lot size. Once the broker can
deny you the ability to hedge, you would lose your edge and you do not want
that.
You can also begin understand now that in Capitalism,
production, even money production should become more and more efficient over
time, and the overall risks would drop further, for the risk capital’s increase
would fall short from the increase of the wealth.
A relevant comment from my pal, Dutch:
Had a run in with a binary broker out of Nicosia, Cyprus
years ago. Ran $500 to $43,800 in 45 days. Asked for my money. NO response.
Finally, called them. Bunch of Russian gangsters but FUCK them. Told them they
had 72 hours to get me my money or me and my crew of ex-Marines would board a
plane, first to Brussels to lodge complaint with any regulatory body. Then, we
were flying down to Cypress for a man-to-man conversation and the outcome would
NOT be pleasant in the slightest. Got my money in 48 hours. Nothing worse than
waiting for a wire out of some fucking Bulgarian bank.