The Swing of Things

This would be a long one, so grab a cup of a tea.

To understand the story of the market, the very first thing to do is to ditch the single-line moving averages and start using double lines instead – and the correct sample sizes.

Using my LEMA 30N indicator would be perfect for this.
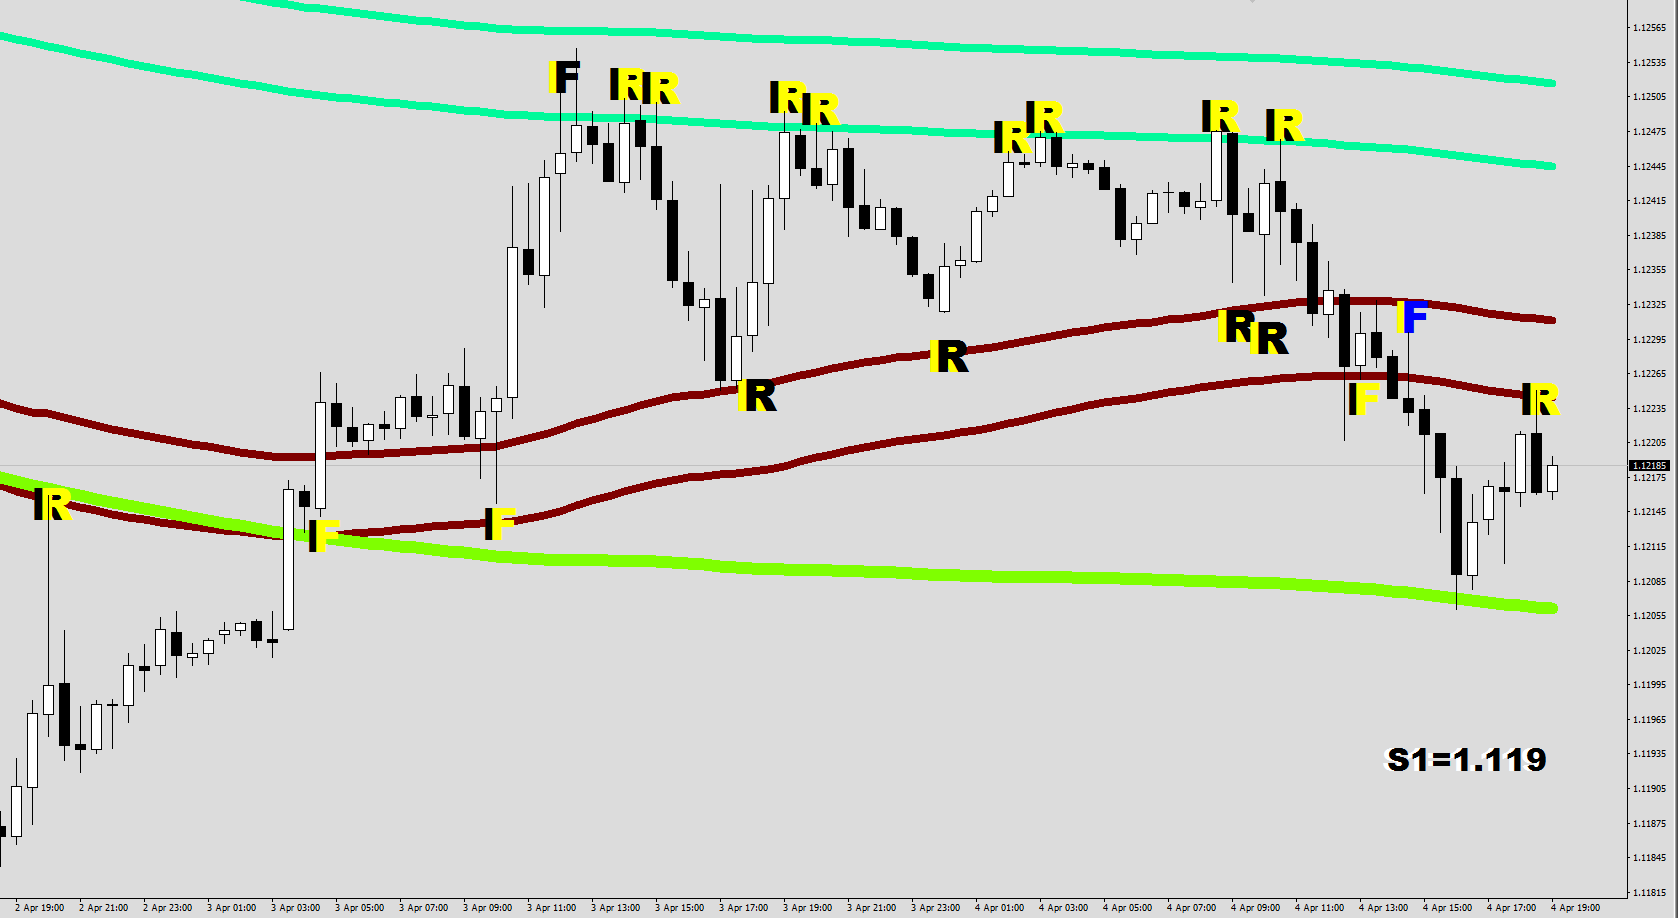
See, you have to be able to decide if you saw a Failure or a Ricochet. With a single line this becomes very uncertain.

With one EMA plotted on the highs and the lows, you can start calling the turn-aways at the closer line as Rebounds / Ricochets and the turnarounds at the further line as Failures. (You may pick your tolerance, but the ones I went with – for the purpose of the screen plots – up to 3 pips beyond and falling within 2 pips of the actual line.)
It is not because an F cannot be under/over cut, but it certainly should give you more confidence that the base would be holding up for a while, and to give you a suggestion for the trading direction: away from the F.

Ricochets simply make price Relapse having to make a part or all of the progression Repeated.

Now, let’s sort out quickly what happened at the Lower Guard Rail – which is at 1x Fluctuation Maximum Measured from the Green River above.

Was that a Failure or a Ricochet?

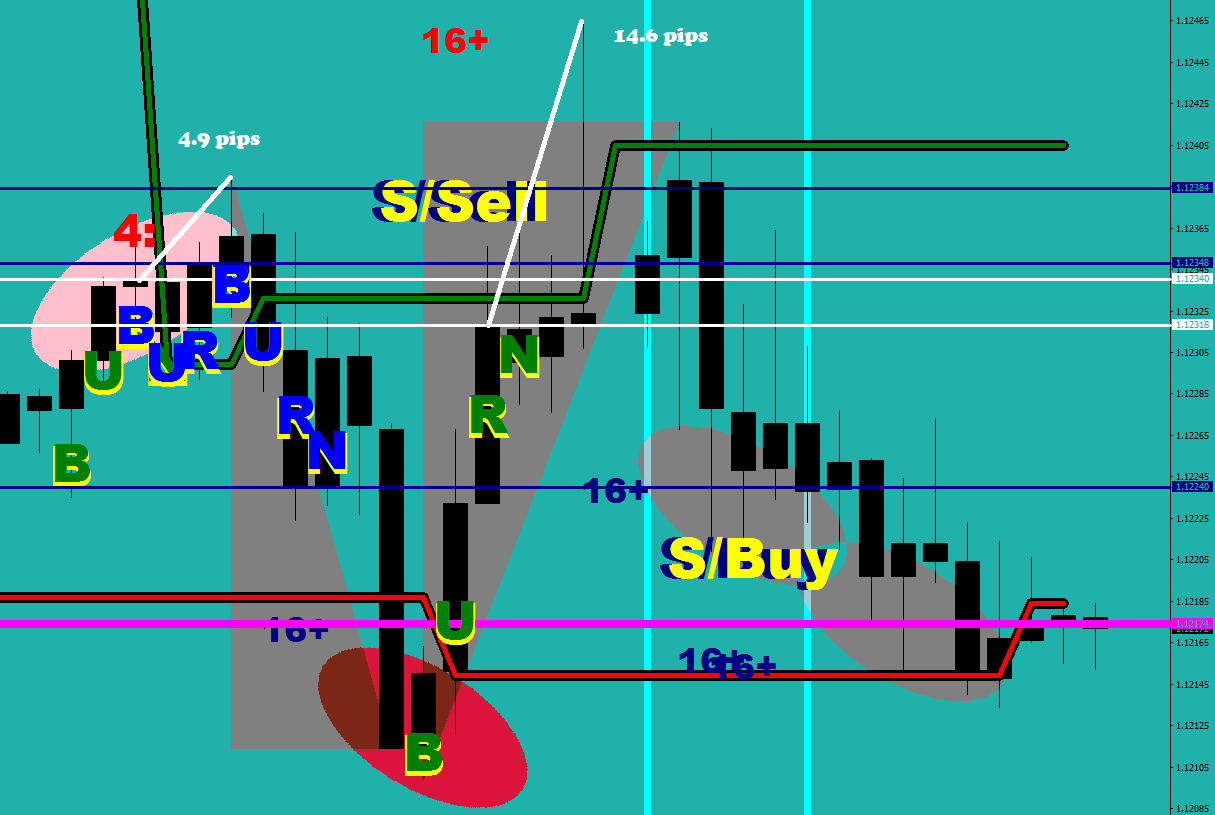
It was a quick dip into Bear Zone 1 from the neutral. The weak handed / short term bears cover in this area, making it potentially a very bad location to go short at. I would call this a Failure of penetrating into the Bear Zone.

Following the same, “in the vicinity of” logic with the BURN lines, the following can be said:
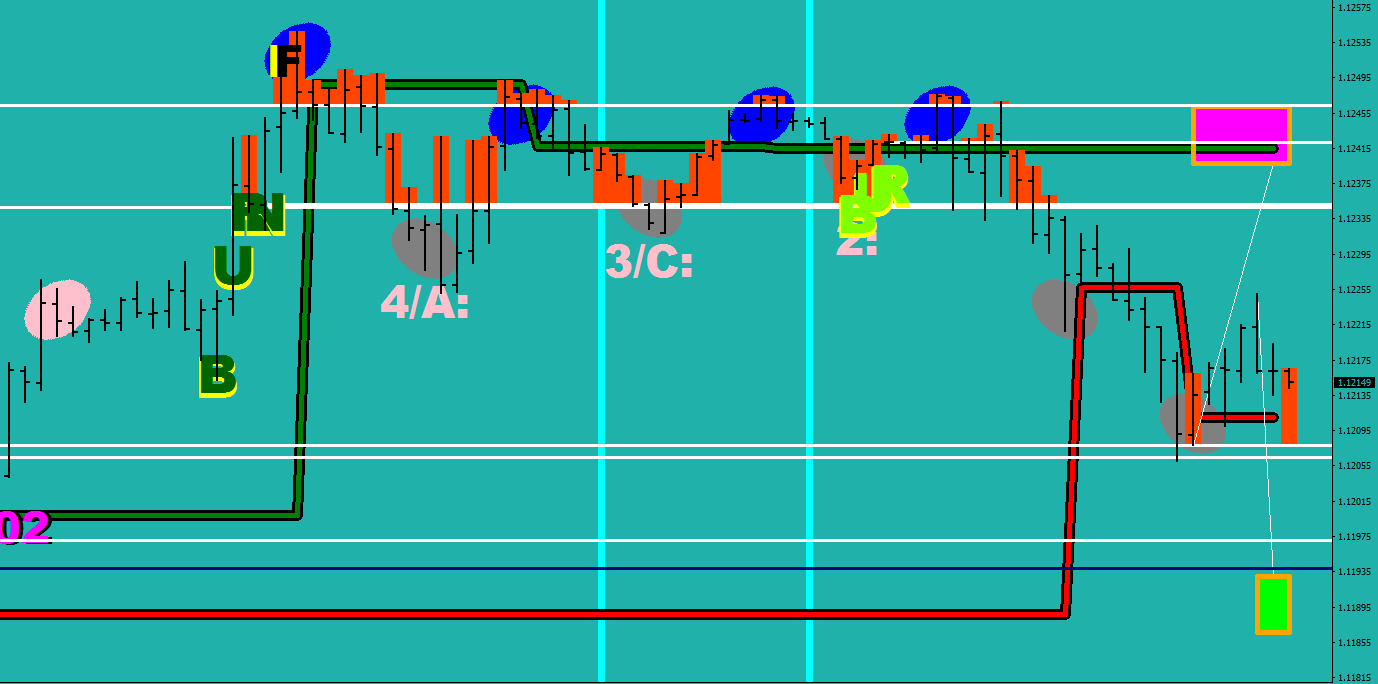
You want to initiate your shorts just above the white line (the green, overbought line is there to fine-tune), and only for up to 8 pips above the line. After that you would need another white line to be crossed for your next entry position.

Similarly, your covers would be just under a white line, preferably 2 white lines out. (When two lines are much too close to each other, they should be counted as one).

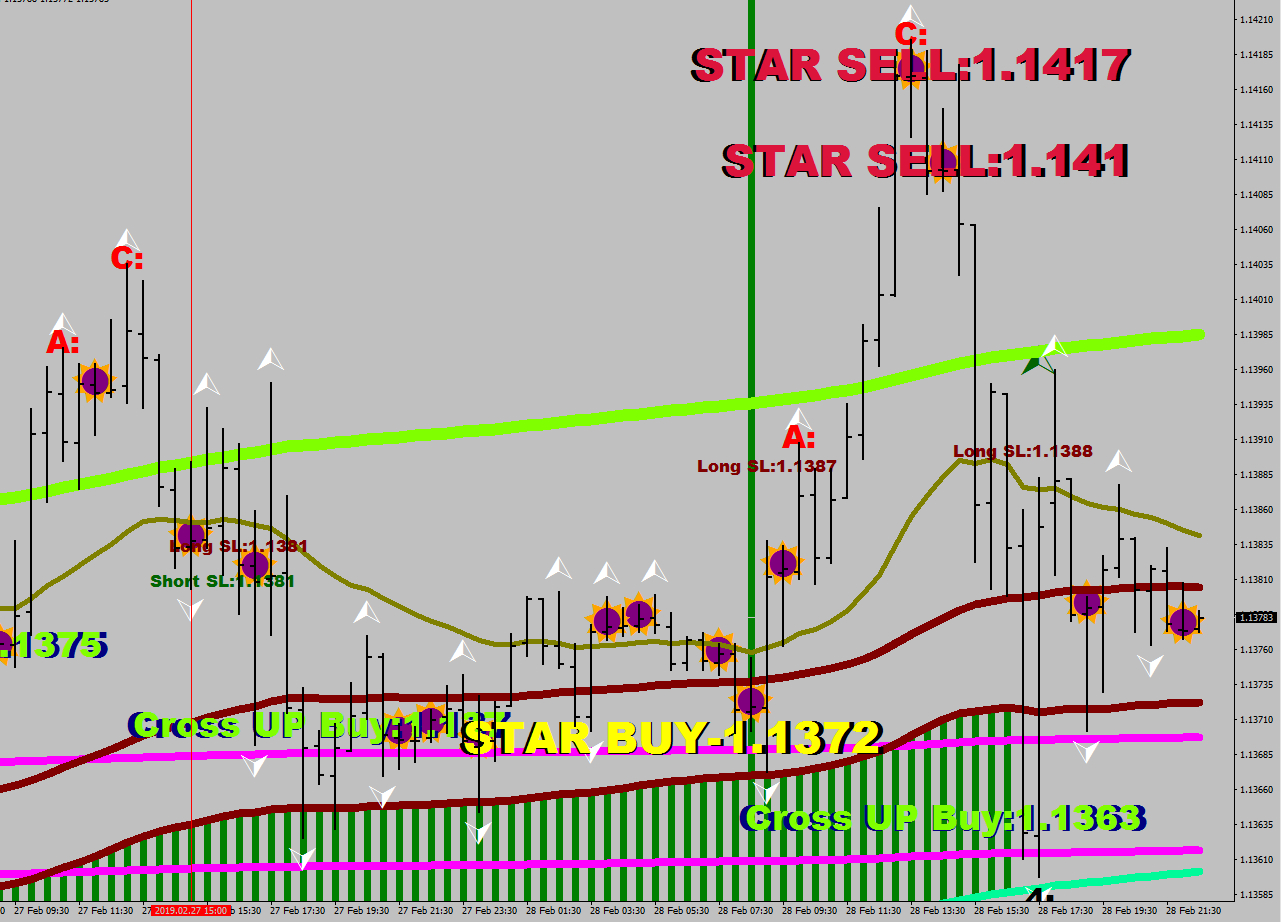
So, why did this consolidation in the Spark Zone (which is between Mr. Maroon and the Green River) played out to the dark side after the area putting on a squeeze?
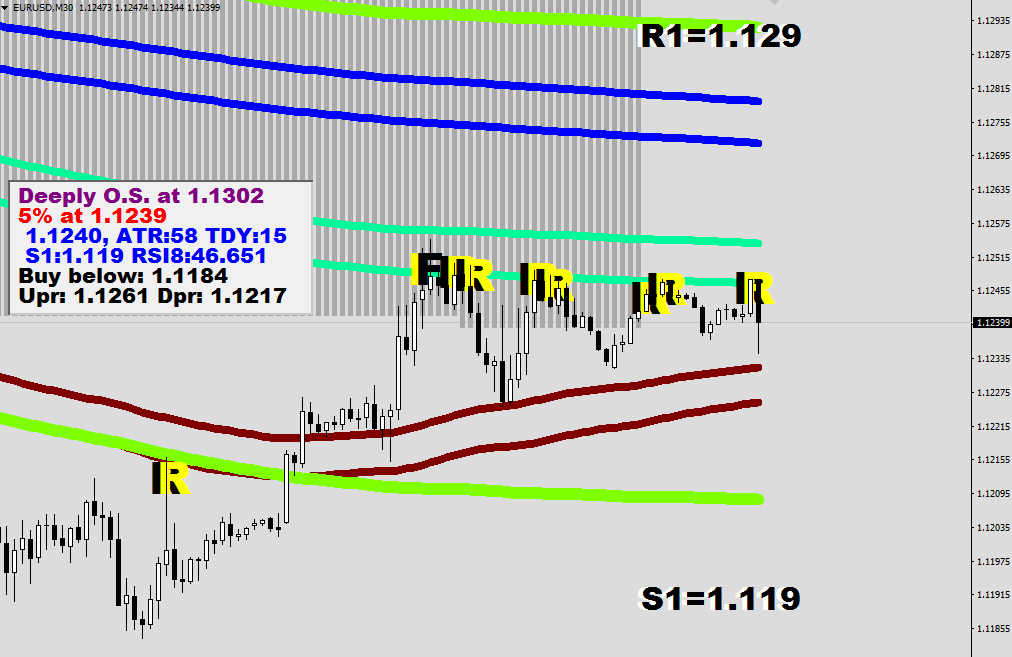
Well, it is one thing eyeing the Blue Pair, and noticing the direction going in and the R1 resistance plotted above along with the Upper Guard Rail.

The answer is in the market type. The market is long term embedded oversold, that you can figure out with my Comfort Levels indicator.

To quote myself, in the Embedded Oversold Market the Longs Fail and the Shorts Prevail.

So now you have the right music on.

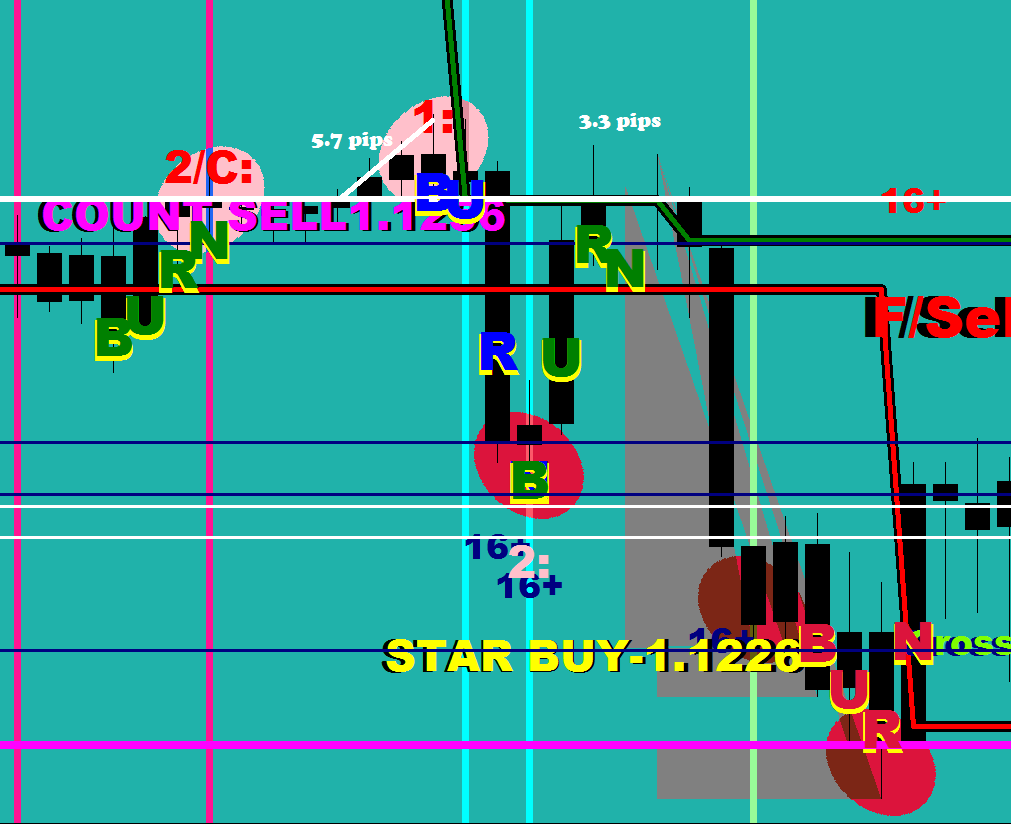
You can see that there was a BUR(N) just printed to keep you to the right side of the market, along with the Blue Ellipses that mean “short” by Wishing on a Star indicator.
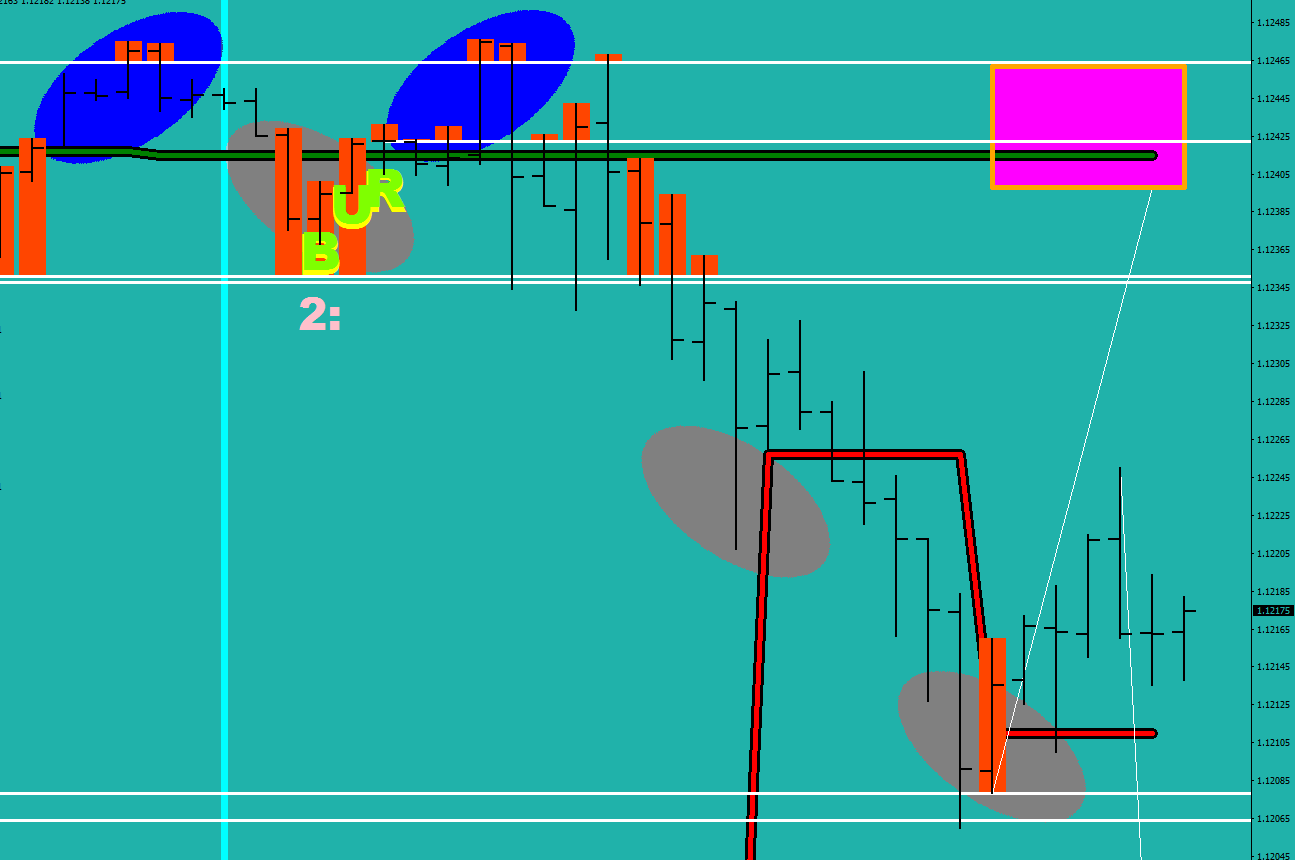

I actually did the very things that would make for a good text book:

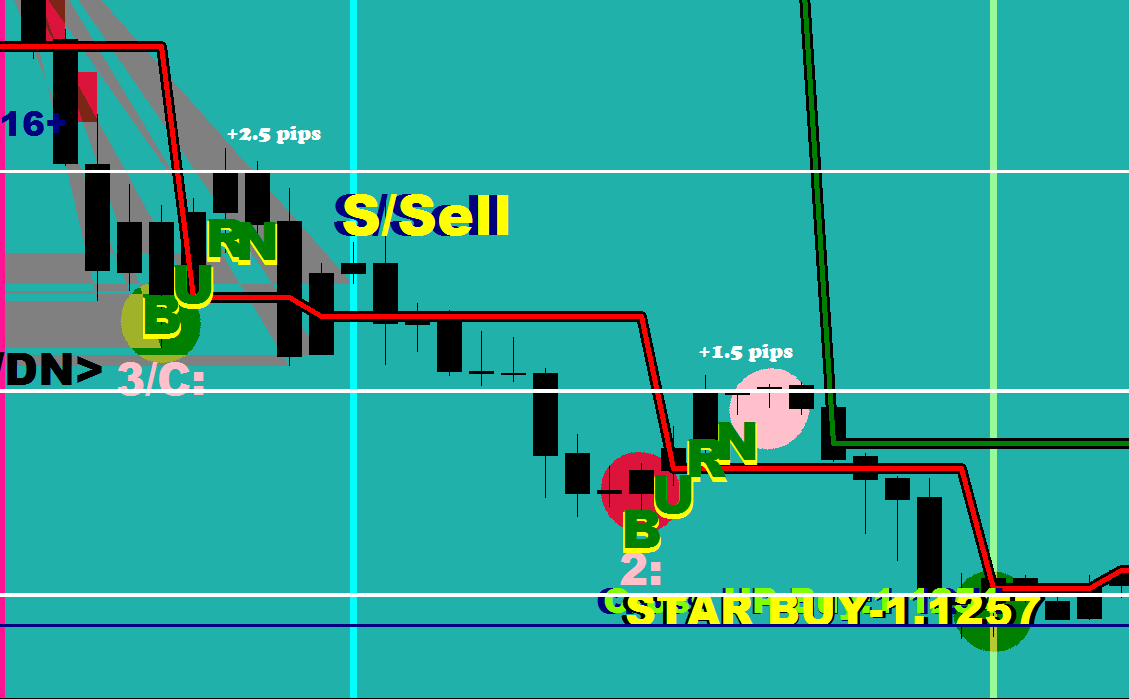
I sold just above the freshly printed white marker 1/2 size and added another 1/2 upon a move above the next white line.

On the first, 30-minute break candle I covered both, one somewhere on route achieving more than $500 (10% relative to base account size), and the other half pretty close to the next white line (almost 20% gains in twenty minutes – I’m trying to teach the thinking here, this is not about bragging.)

There is more in the way of signs to be had in getting the direction right.

If you were to plot the 88 Luftballons in “thrusts only” mode, you would see the thrust boxes.
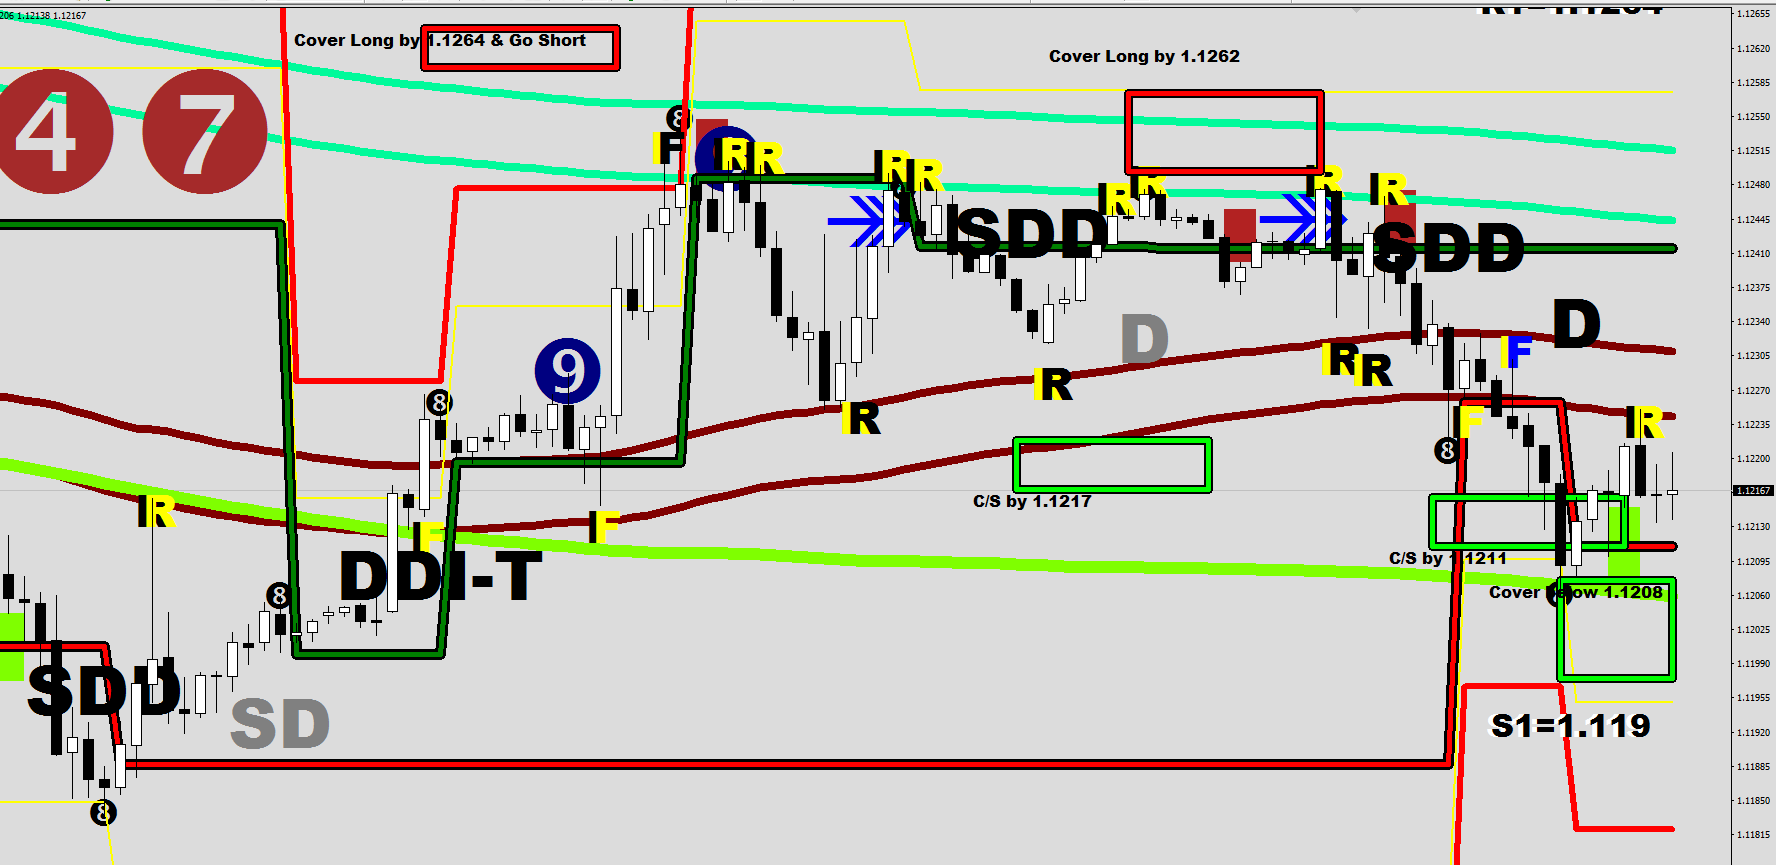
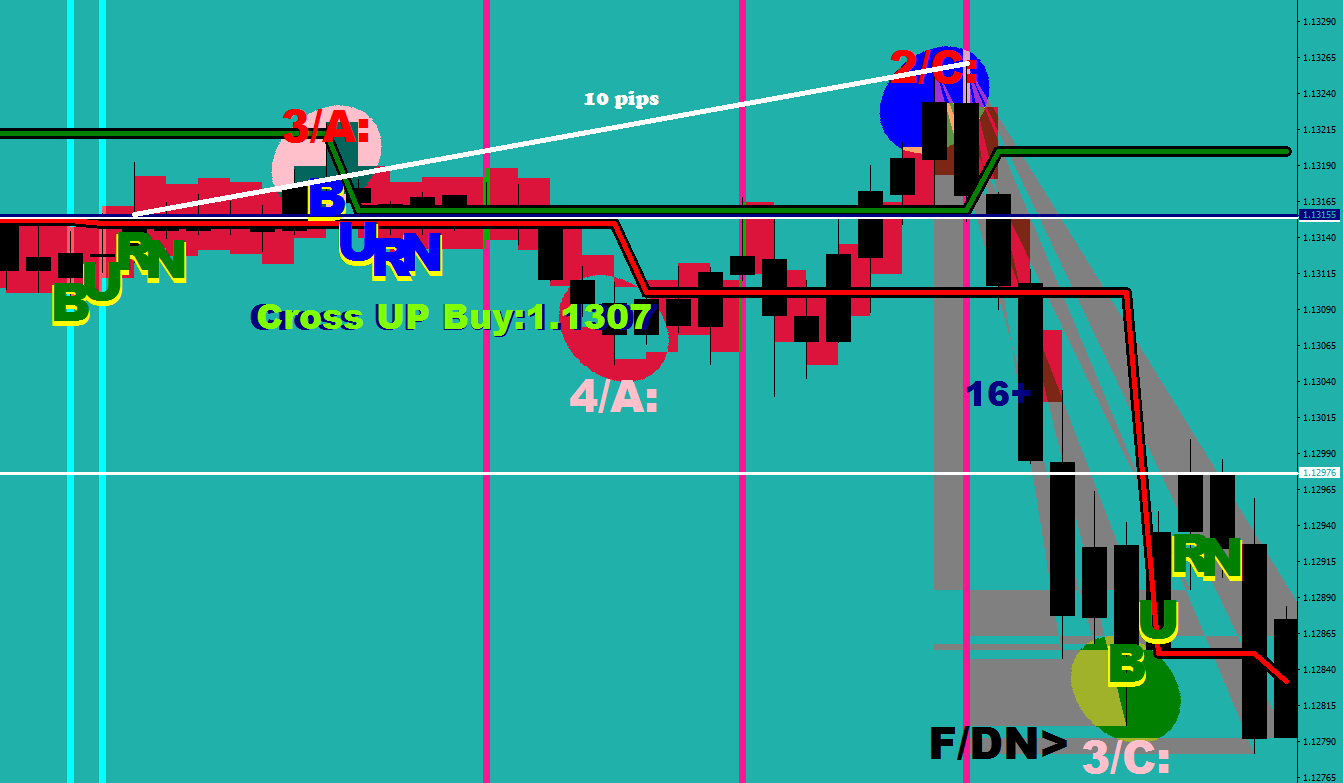
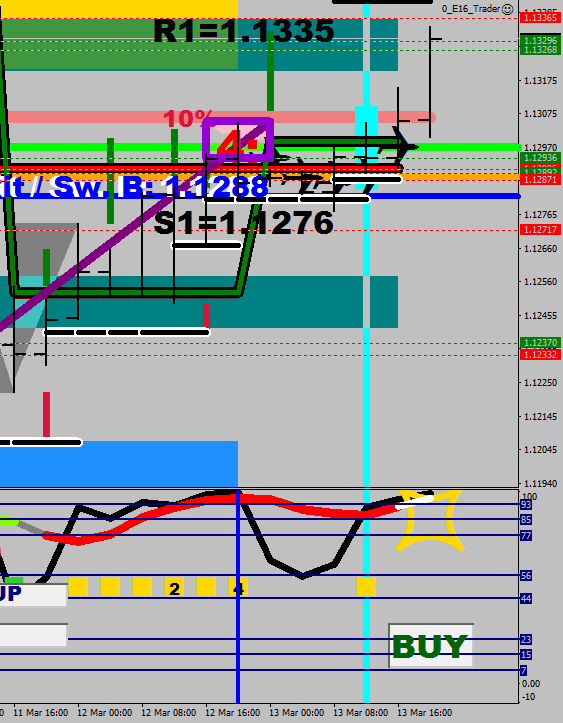
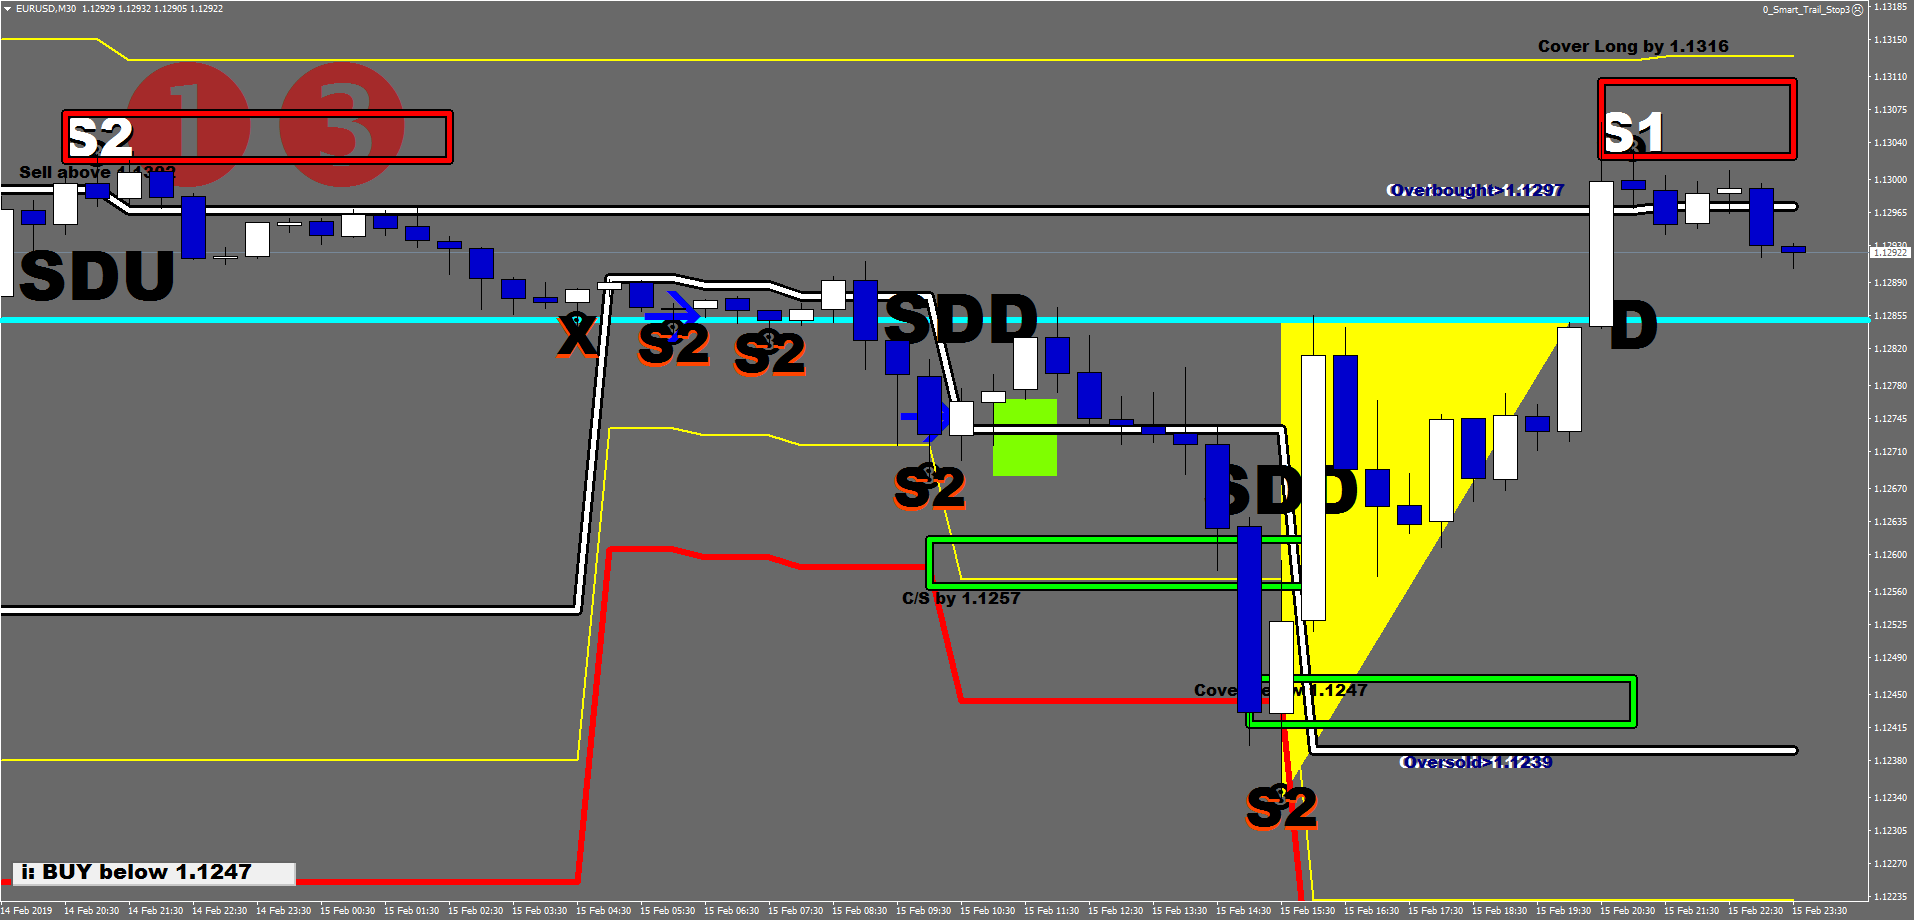
The first, DDI-T prompt’s red target box was called off by the F failure at the Green River high. The SDD (Screw Driver Down) had a projection box as well, but an R, Ricochet at Mr. Maroon put a stop to playing out immediately. There was a D, that was grayed out because of its location, and price never made it to those heights again. On the downside you had another SDD printed, and since price spiked into it (and even exceeded it a little), some of the downside force was taken away.

As you can see, that box has a Cover by 1.1211 print at the low (was plotted real time with the SDD print), and as intelligent that routine is, the next projection box, that was a D (Driven) condition to the downside had an additional Cover Below print with 1.1208, but this time at the top of the projection box. (It was spiked into basically immediately.)

So, where are we at now? In an Embedded Oversold Market. The LEMAs have bearish configuration still. Yet, the short term memory is that the bears covered for now and there was a Ricochet at Mr. Maroon. Price is out of the oversold. It has to adjust the overbought level.

The Maroon Fake out – Fake out pair (with the second F in blue) is the cap of the move for now. A brake above it, and you can be headed towards R1 that is now at 1.1264 – the Blue Lema (the 30-minute one) just started coasting into place.
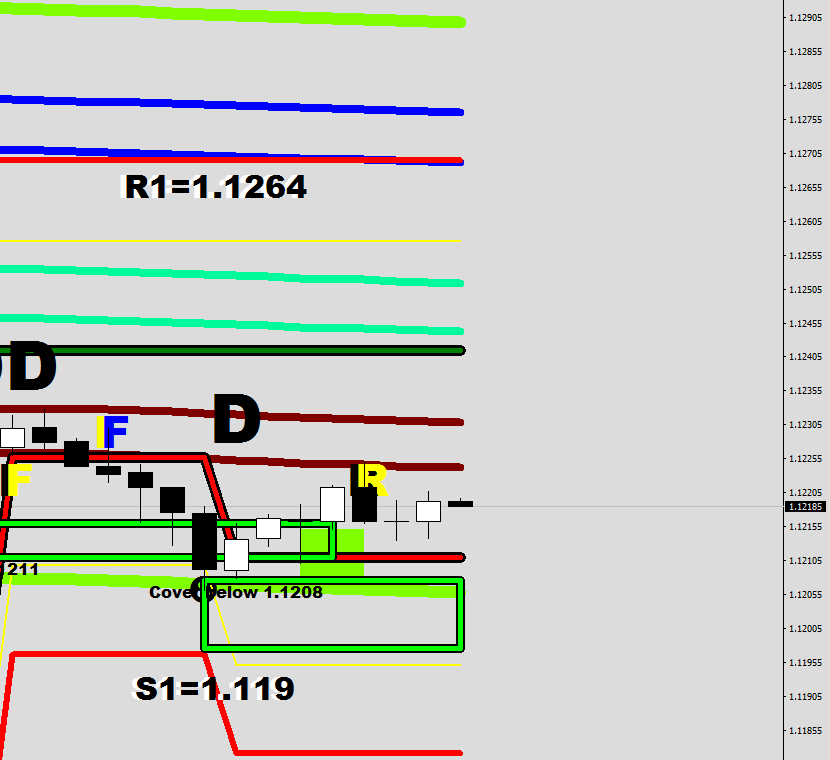
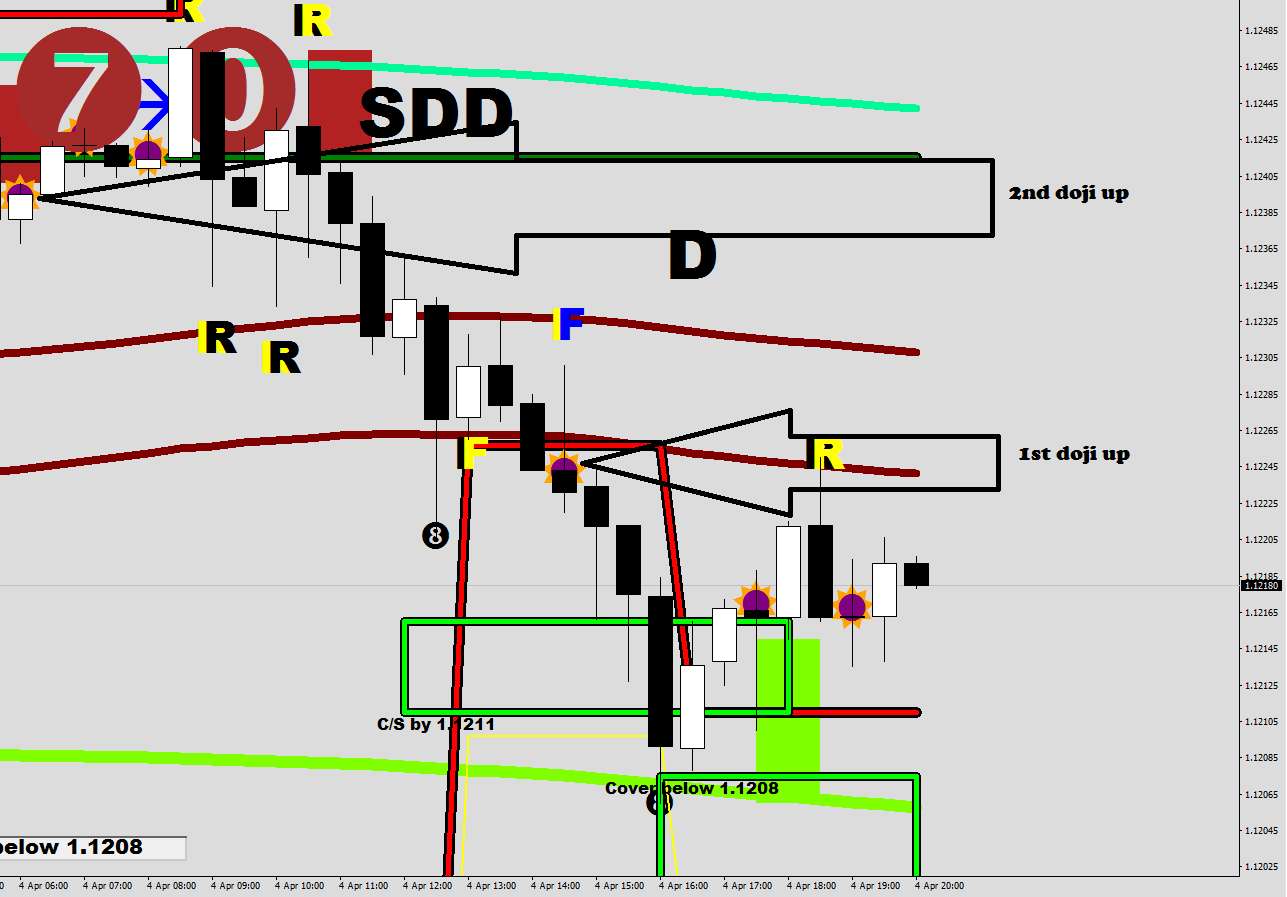
The second doji up is at 1.1239 – right below the current overbought level. This is where I set my long targets to.

Dear Reader,

I would like you to take a journey with me. A journey to the unknown, unexplored, to the unexplained. I can assure you it would be worthwhile.

Liberating would be an understatement.

I have broken every imaginable record before I managed to become profitable. (All the records I have not broken should be re-examined for credibility / authenticity.)

In this world of mine, there is no volunteering for losses. There is no hard work of hand drawing unlimited useless trend lines. There are no moving average crossovers, for there is but one moving average in the classic sense. 

The idea is not to be right all the time, but to make money every day.

This book is about Forex, about retail trading, and is fine-tuned to EUR/USD. I shall show you the 3 genders of hedging and my implementations.

I will teach you about the market models I’m using.

I will help to start making EAs on MT4, to be able to exploit edges and to manage open trades.

About the Author

My trading venture started with opening an ING account back in 2009. I started with buying and holding NASDAQ / technology stocks. I was trading UNG for a period of time (and learnt of contango this way). Soon after I opened a TD Ameritrade account, and qualified for LEVEL2 trading. I was trading S&P futures, and moved on to triple leveraged ETFs of the RUSSELL 2000.

In 2010, my “stock trading” resulted me wanting to lose the burden of the Wash Sale Rule, and switched my accounting method to Mark to Market. I bought and sold $18 million (face value) that year using my own money with the two main accounts.

I had one options account that I used to trade weekly options with.

I only paid for two subscriptions in my life. One was a stock picker service, the other was Options Line Backer (iron condors).

I started developing my own indicators on ThinkOrSwim basically as soon as I had it – in 2009.

I moved to Europe in 2013. I got caught up in the Forex mania almost immediately.

One broker I knew personally started me down the path of developing on MT4. 

One hedge fund had me on their trading floor the next year. I met some people wanting “grey boxes and black boxes”. I tried a few brokers.

I started writing automated routines in the summer of 2016.

About this Book

The objective of this book is to provide the retail person with enough knowledge and examples about the reality of trading and to ultimately encourage them into wanting to find their own path of developing automated routines.

I intend to hand out the keys to the right thinking as well as to the understanding of how to do things.

A different disclaimer

Trading is the hardest thing I have ever encountered. It is a never ending challenge, where you cannot stop standing on your tip toes. It is a love at first sight and a struggle for life.

I am looking for people with similar thinking, similar intentions for a joint venture.

©2019 by Achilles Dent

The Book Is Out!

The book is out, my truth is out.

This is the essence of what 10 years of trading, 6 years of Forex trading, 9 years of indicator making and 3 years of heavy duty automated-trading-routines-development and testing has yielded me.

Plus the core question that has occupied most of my brain capacity all along.

“How much is there to know about trading”?

I was prepared to make changes, to reconsider or even to start from scratch, whatever it would take to find answers.

I found my way, my path. There is simply nothing like I have built out there, and this comes as no surprise knowing my commitment, the sacrifices I have brought.

My life’s work for 18.5 cents a page. A free starter kit of indicators for anyone willing to read from me, to learn from what I have got to teach.

You are gonna love the way you come to, I guarantee it! (Macdulio’s Warehouse)

To make a purchase simply send your payment to one of the following email addresses:

If you wish to pay in US Dollars ($25), Paypal me to macdulio@yahoo.com

If you wish to pay in GBP (£20), Paypal me to gaborszentes28@gmail.com

You shall receive the Word Document file via email along with the starter package of indicators:

BetterVolumeChartBars, Fractals Modified, Comfort Levels 4H, LEMA 30N, ATR Limit CI, 15-min ATR Targets, Projected Distance & Projected Distance Lines Fitted and I would include the Dojis as well in this package plus the Broker Auditor.

Like I promised, this would be the best spent 20 Pound note in your life.

The Embedded Oversold Program

  1. Sell above a burn to the upside
    above white line & target a lower low
  2. Sell failure/ricochet at Mr. Maroon
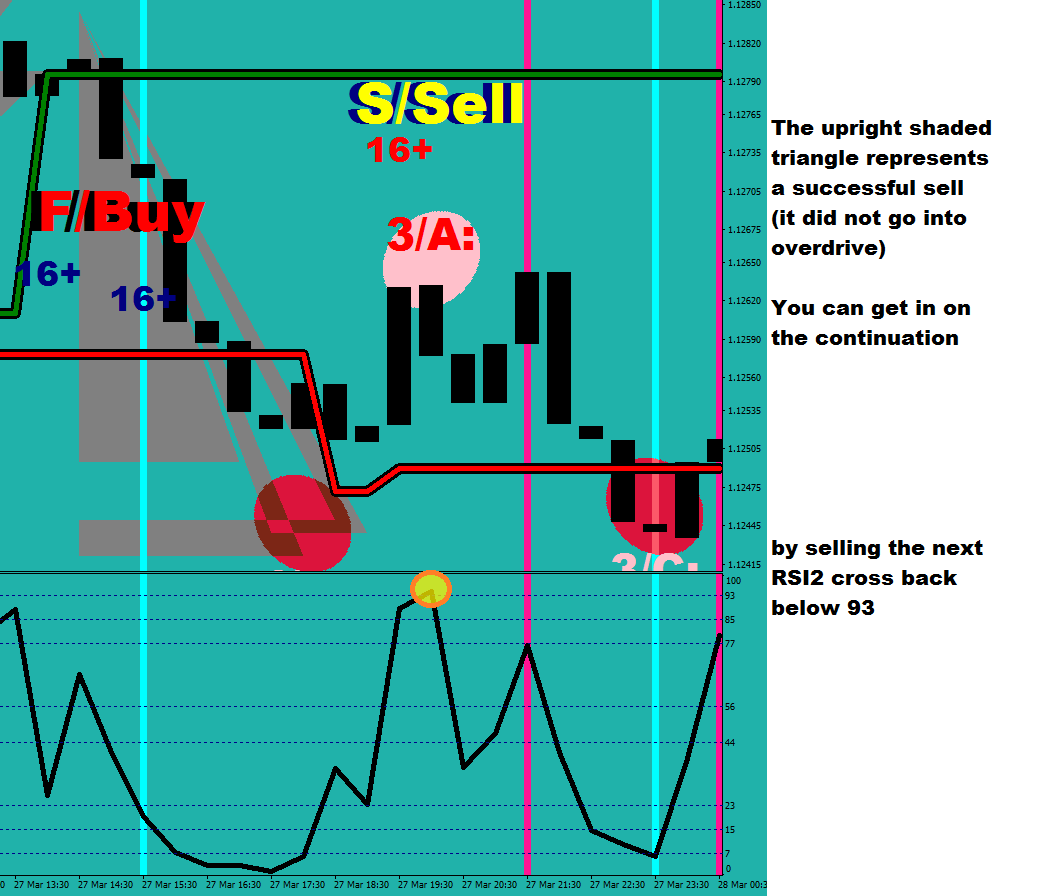
  3. Sell after a successful sell
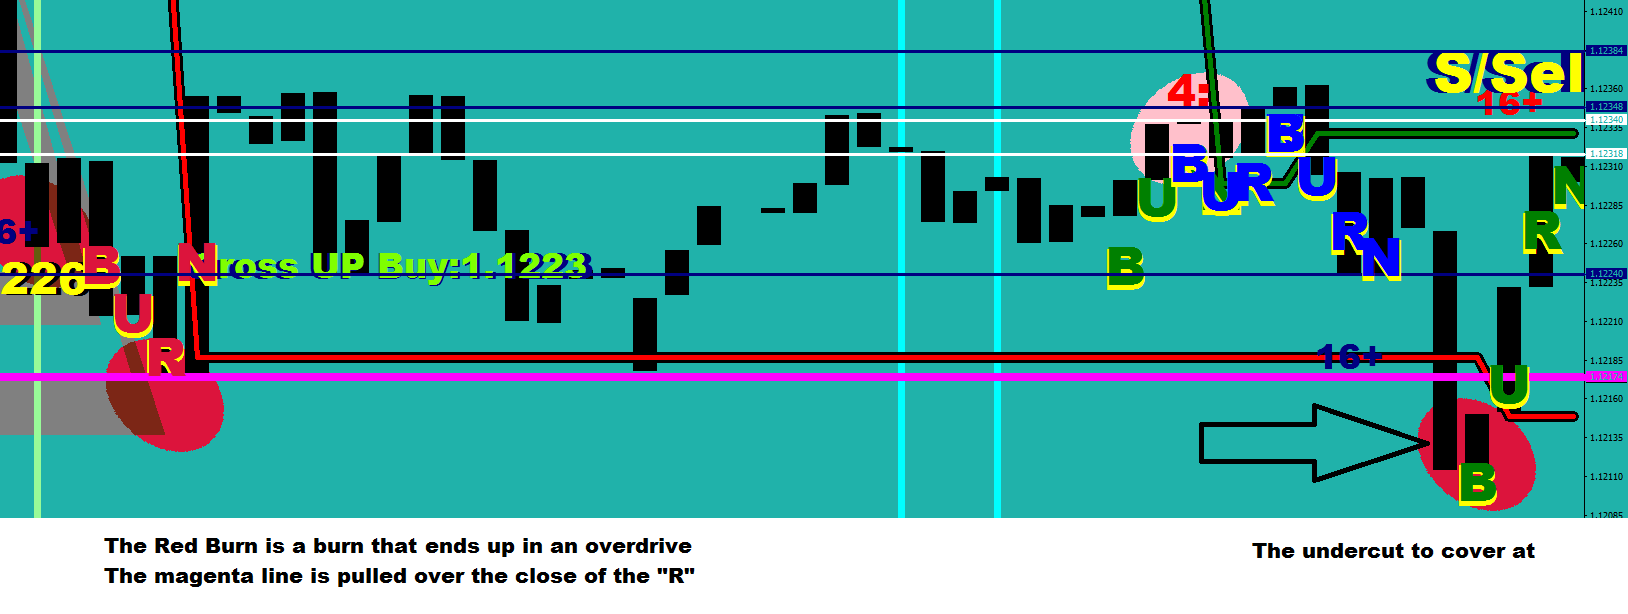
  4. Cover upon undercut of a Red Burn (overdrive)
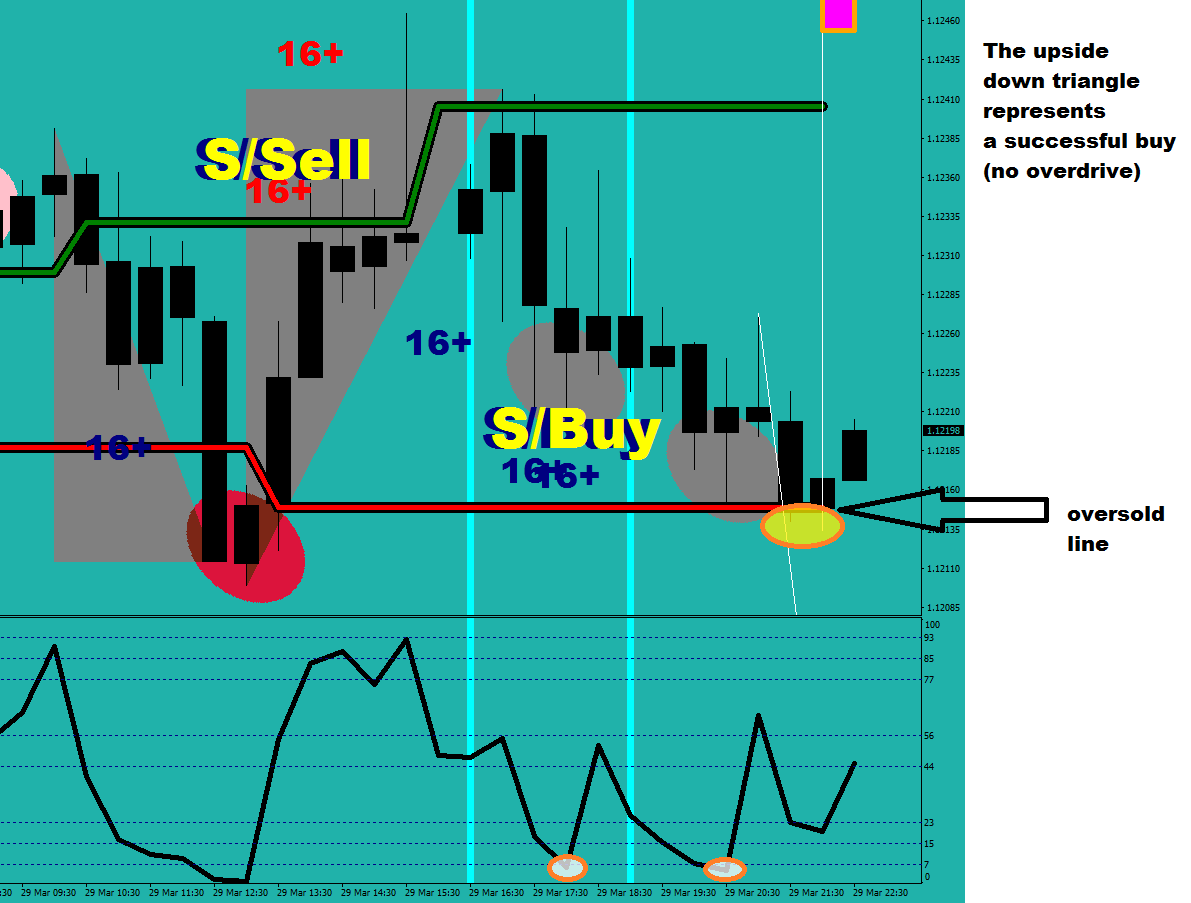
  5. Cover upon successful buy, preferably in the oversold

1)

2)

3)

4)

5)

The Triangles and the corresponding labels, the overbought/oversold lines, the BURN plots (along with the R lines) are all part of Wishing On a Star V1.2 (the indicator) which is available for a price (haven’t figured it yet).

MR. Maroon is included in the LEMA30N – part of the package coming with the purchase of the E-book, “Computer Aided Trading” to be released in the following days.

As an insight, a burn plot goes something like this –

ExtUpFractalsBuffer[i+4]!=EMPTY_VALUE && High[i+4]>iHigh(Symbol(),0,iHighest(Symbol(),0,MODE_HIGH,8,i+5)) && High[i+4]-Low[i+1]>FSize/2*Point && Low[i]>Low[i+1] && Low[i+3]<Low[i+4] && Low[i+2]<Low[i+3]

– but it would not be worth as much if I did not figure a way to start plotting while the 3rd candle is being printed (real time) – and of course, I did.

The oversold/overbought levels are adjusted to my modified fractals idea.

Green Burns were exceeded by – stats

The minimum closest drop was 18.4 pips measured from the R’s entry line.

How To Read The Saucers?

(As opposed to the tea leaves)

Ingredients: 1-6 sense for spotting the excess.

I invented the point and go, figure charts – yes!

…and now for the undercut (the last squirt)…

The length of the final thrust (burn off)? Approximately 1 hour and 45 minutes.


A confluence is when you have more than one reason to take the same action.

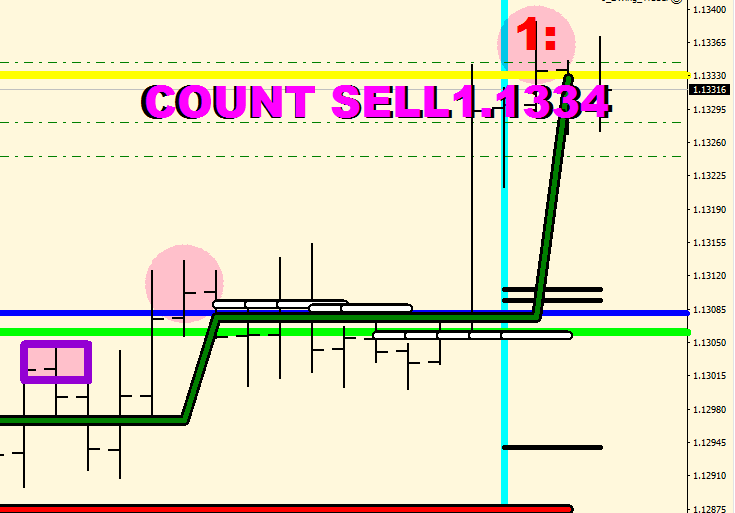
0 was the Count Sell…

Wishing on EVO6

First, yesterdays news.

Yesterday (The first unofficial forward testing day) the EA opened a short at 1.13132 at 1:58 AM server time. I closed it out manually at 6%, but if I did not, it would not have touched it at least till 1.1232, and with the opened size and the 81 pips it would had meant 45% gains for a day. Not bad from an auto trading routine. The best robot I have seen advertised on LinkedIn (on a real account) made 100% in 10 months.
Just to compare.

Little quotes here and there from the song at the end of the page.

One spark among the embers…

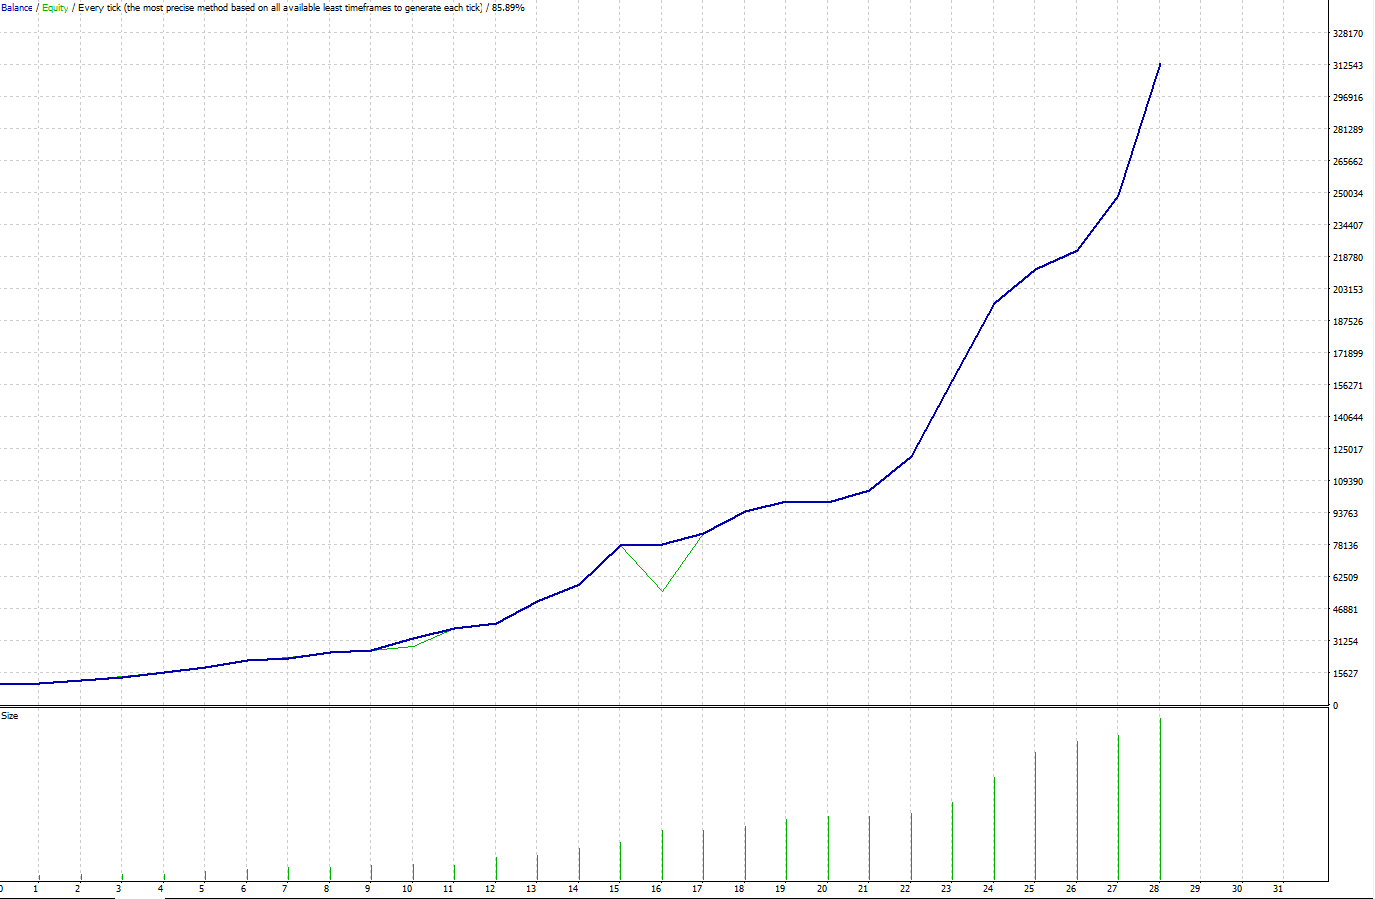
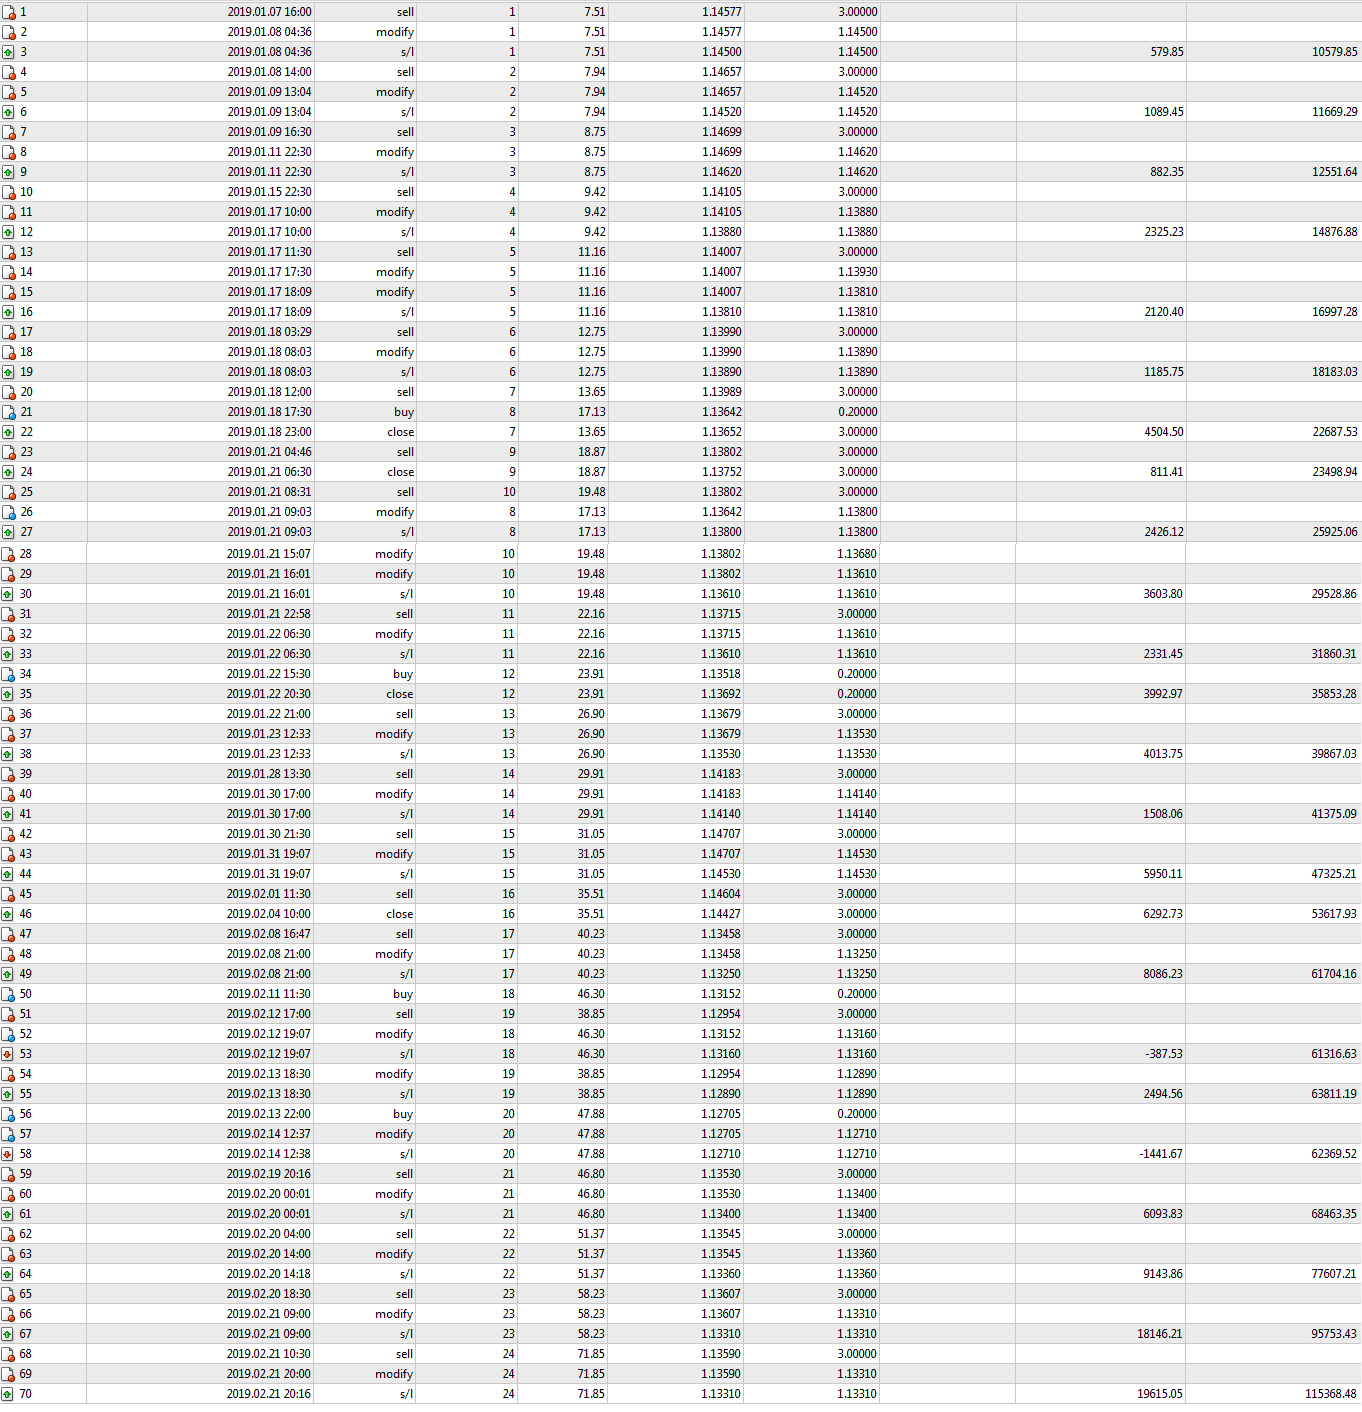
What is wrong with the following back test?


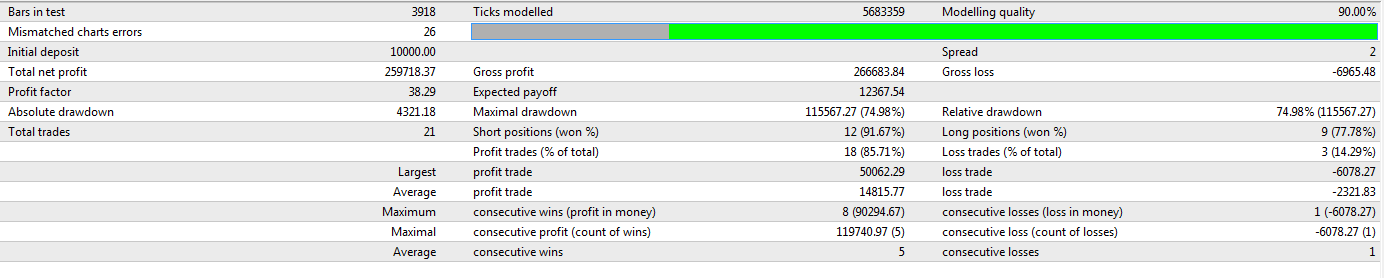
There is an interesting profit factor number coming up on the following image…

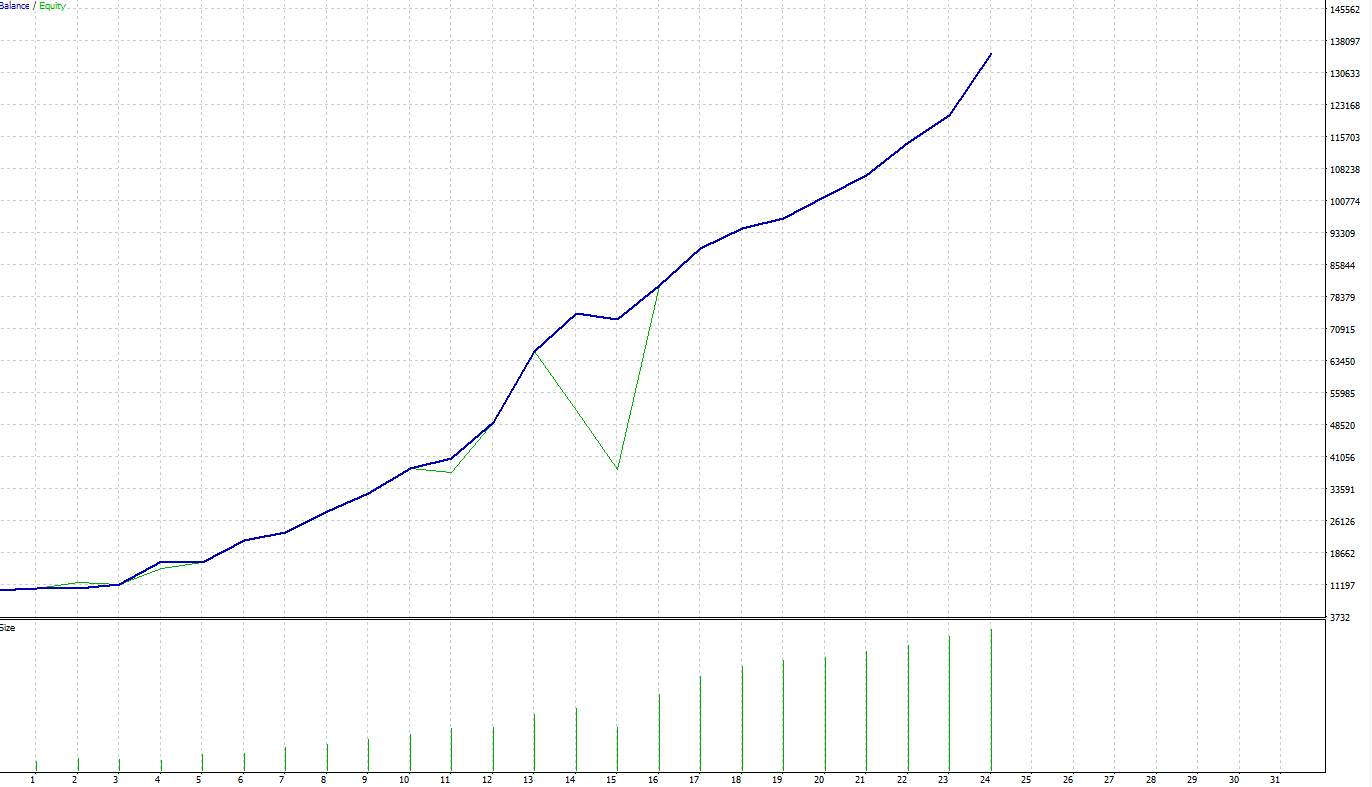
Is the problem that it only made 3,034% gains in 2 months?

That’s right, but why?

One voice against surrender

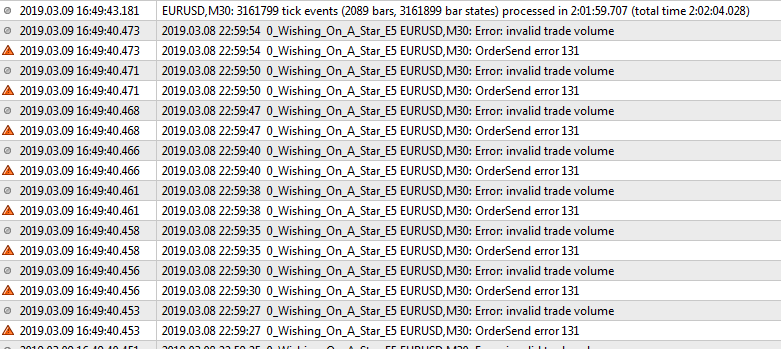
Why could it not open any more trades, what was wrong with the trade volume size?

One dream that’s worth defending…

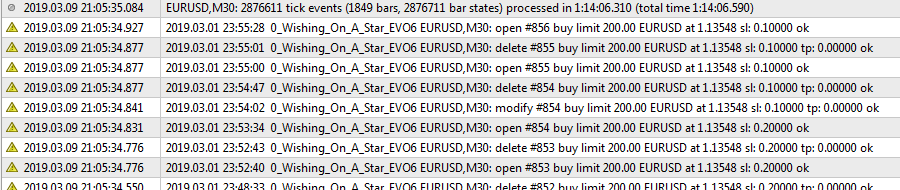
See the entry of the Maximum Lot Size? That is what this broker imposed as a limitation. You can find out in a second what a broker forgets to communicate out of deception.

You could buy my book for instance in a month or so for £19.99 – the best 20 Pound note you will ever spend – and after I have your email I could send you a small indicator package that would include the Broker Auditor routine that I made.

One love that’s never-ending…

So, let’s run that test again!

First Trade: 8th of January, 2019

Last Trade: 1st of March, 2019

Is this much more? 3410%? No, but this was about knowing your working parameters, your limitations correctly. And as a side effect, when the maximum lot side gets reached, the EA would not simply stop working entirely.

Now I can speak of an EA, one EA as “My EA”. It had to go through 6 Evolutionary steps to be a stand alone, all encompassing Automated Trading Mogul with Full Hedging Capabilities, multiple Cropper Routines and Smart Trail stops in one single Program.

One thing I’m extra proud of is the time outs, when there are no positions open give you plenty of opportunities for withdrawal.

30 round trip trades on 40 trading days is very manageable.

This is my only EA that was specifically designed for the extremes, an embedded, trending market and not opportunistic trading, in a nut shell.

Wishing on a Star (the EA)

First, a shout out to all the LinkedIn peeps. If you are one of those, posting easy to forge cell phone statements, chances are, that I already unfollowed you. I suggest others do the same. It is lame, it is unprofessional and you are swimming in the same water as all the scammers – so, stop it!

Back to business.

About the algo development

Let’s get this straight: there is no holy grail, there is not a single EA in the world that can do it all, that can perform well in all the 3 different kind of markets, there is simply no “one size fits all”.

If someone starts a sentence by saying: “My Algorithm”, I can only think that you are an amateur, a green horn, so I’m begging you, please start using the phrase: “This particular algorithm of mine” instead. Better, now I might listen to what you have to say.

There is a reason that I am running 5-30 EAs at once on a single account depending on the type of the market. To be able to claim anything in algo development one should have made hundreds of them, like I did.

One last bit here: an on screen indicator in my opinion does not fall under algorithms, they may be the basis for them, but an algo should perform some kind of an action related to a trading order. I have been making indicators for a decade, but only started making auto trading routines three years ago. These routines seldom ever plot anything on the screen. I don’t call everything that has a plus or a minus somewhere an algorithm, and neither should you.

What is the world’s first EVO-5 EA made of?

It is a 4-in one routine with features used for the very first time.

The whole thing starts with a carefully selected bunch of triggers.

I combined the Wishing on a Star indicators signals with the RSI sharpies, added volume change triggers, invented counters and factored in other failure possibilities.

Evolution 1 & 2

This is my first time to use a volume change trigger in any EA, and you do not need to know all traded volume to find a change. The sheer complexity of the trigger categorization would be hard to follow for a human brain, this is truly an artificial intelligence.

Evolution 3 & 5

The trigger conditions not merely initiate and close positions, but they serve as stop loss adjusters or the basis of in house hedging.

Evolution 5

The EA is equipped with several cropping lines i.e. Golf Cropper and Star Cropper.

So, the question becomes, if this routine can and does it all, is this the holy grail? No. It is only expected to perform well in 2 out of the 3 market types. I would not run it in a no edge market.

Would I say now the sentence “My algorithm”? No. I would still run it with at least 2 other routines simultaneously: a ratio hedger (just in case) and a smart trail stop.

Too much talk? Show the test already?!

Well, here it is…

Remember, you are looking at a routine that does not apply stop losses at the open, and yet it does not get in trouble. With a Ratio Hedger running alongside the maximum relative draw down is expected to be less than 35% at any given day. The maximal draw down is spelled out for you: 26.13%

This program works just as smoothly as transmission of my once favorite Mitshubishi Lancer used to.


A/C – In One Breath

What market are you in?

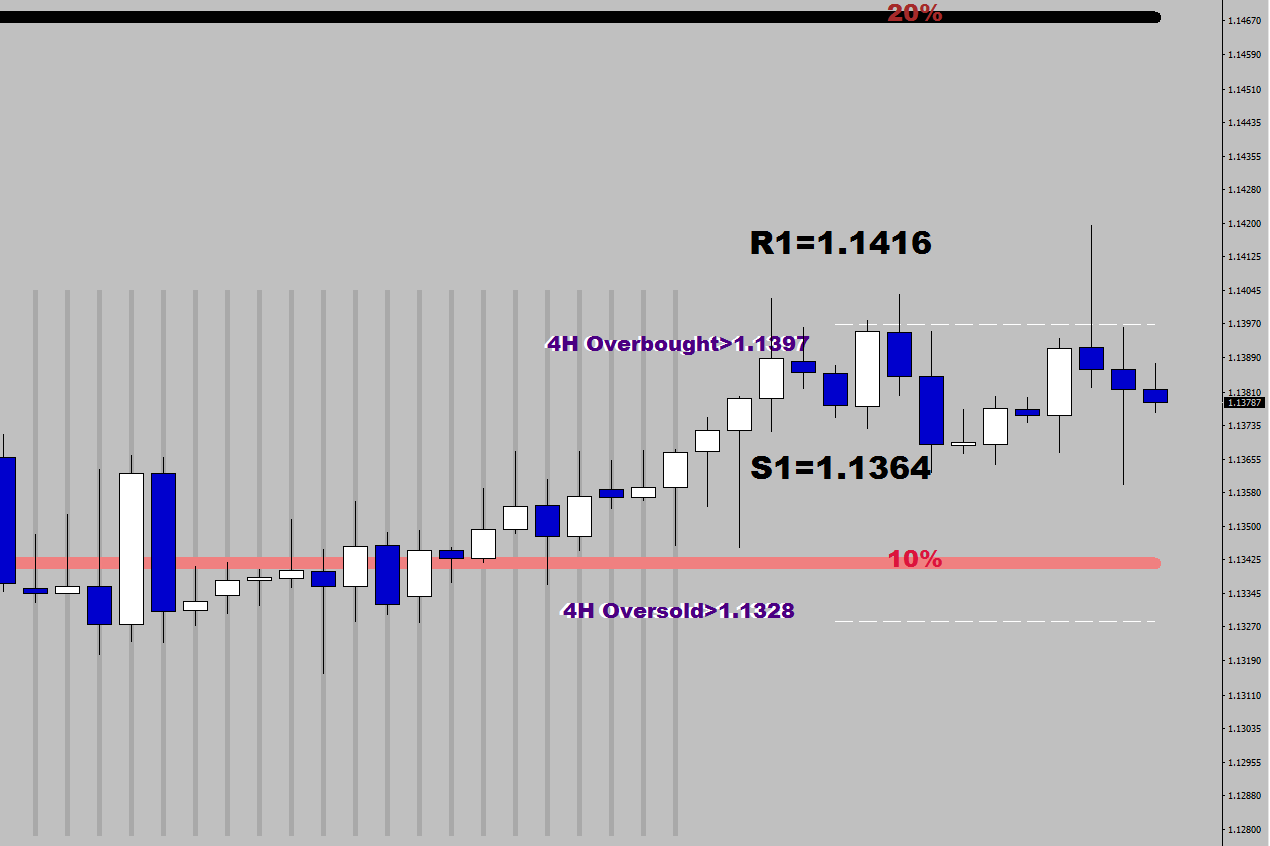
Embedded oversold. Meaning, there has been at least 3 daily closes below the long term oversold neckline (20%) @ 1.1468.

What are the two market types that exist in an embedded market?

  1. Trending
  2. Counter trending

Why do you want to trade embedded markets?

The moves tend to be enlarged / long, for there is plenty of liquidity, lots of participation, you can trade in and out easily, the spread is at its lowest, you can stay in safely until the trending direction does not change.

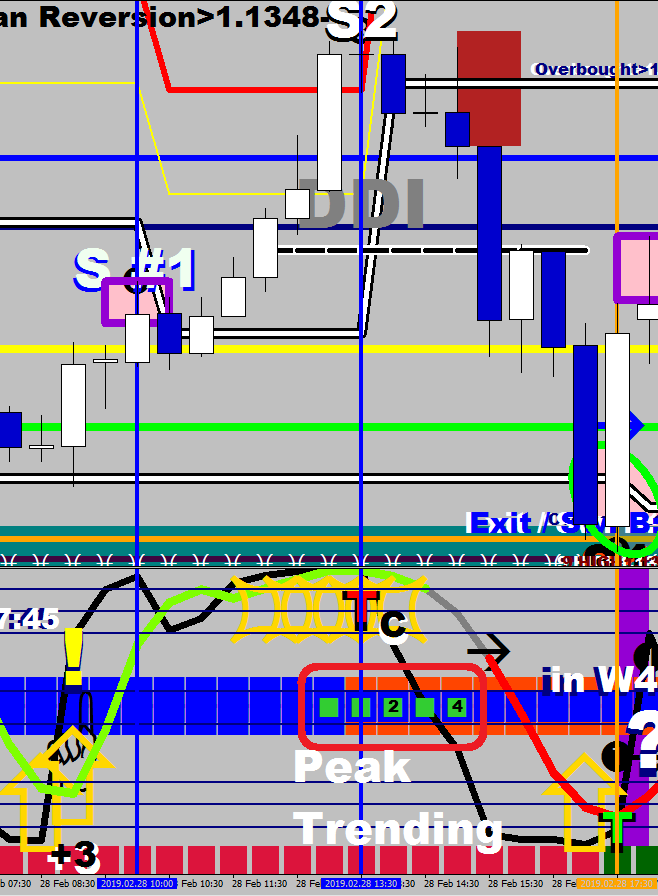
What is required to make the market turn within embedding? Peak trending.

Peak trending is brought on by 1h 30 min – 2h having been spent opening above the local overbought or below the local oversold neckline.

An example of peak trending: 4 30-minute opens above the overbought neckline.

Visual signal for peak trending:

Calculation for the overbought / oversold levels (based on my modified fractals):

if (sdn[i+1]!=0) minus[i]=Low[i+1]-110*Point+FSize/2*10*Point;

if (sup[i+1]!=0) plus[i]=High[i+1]+100*Point-FSize/2*10*Point;

Where sdn and sup are arrays with Sychronized highs and lows

and the Fluctuation Size is 32 pips (EUR/USD)

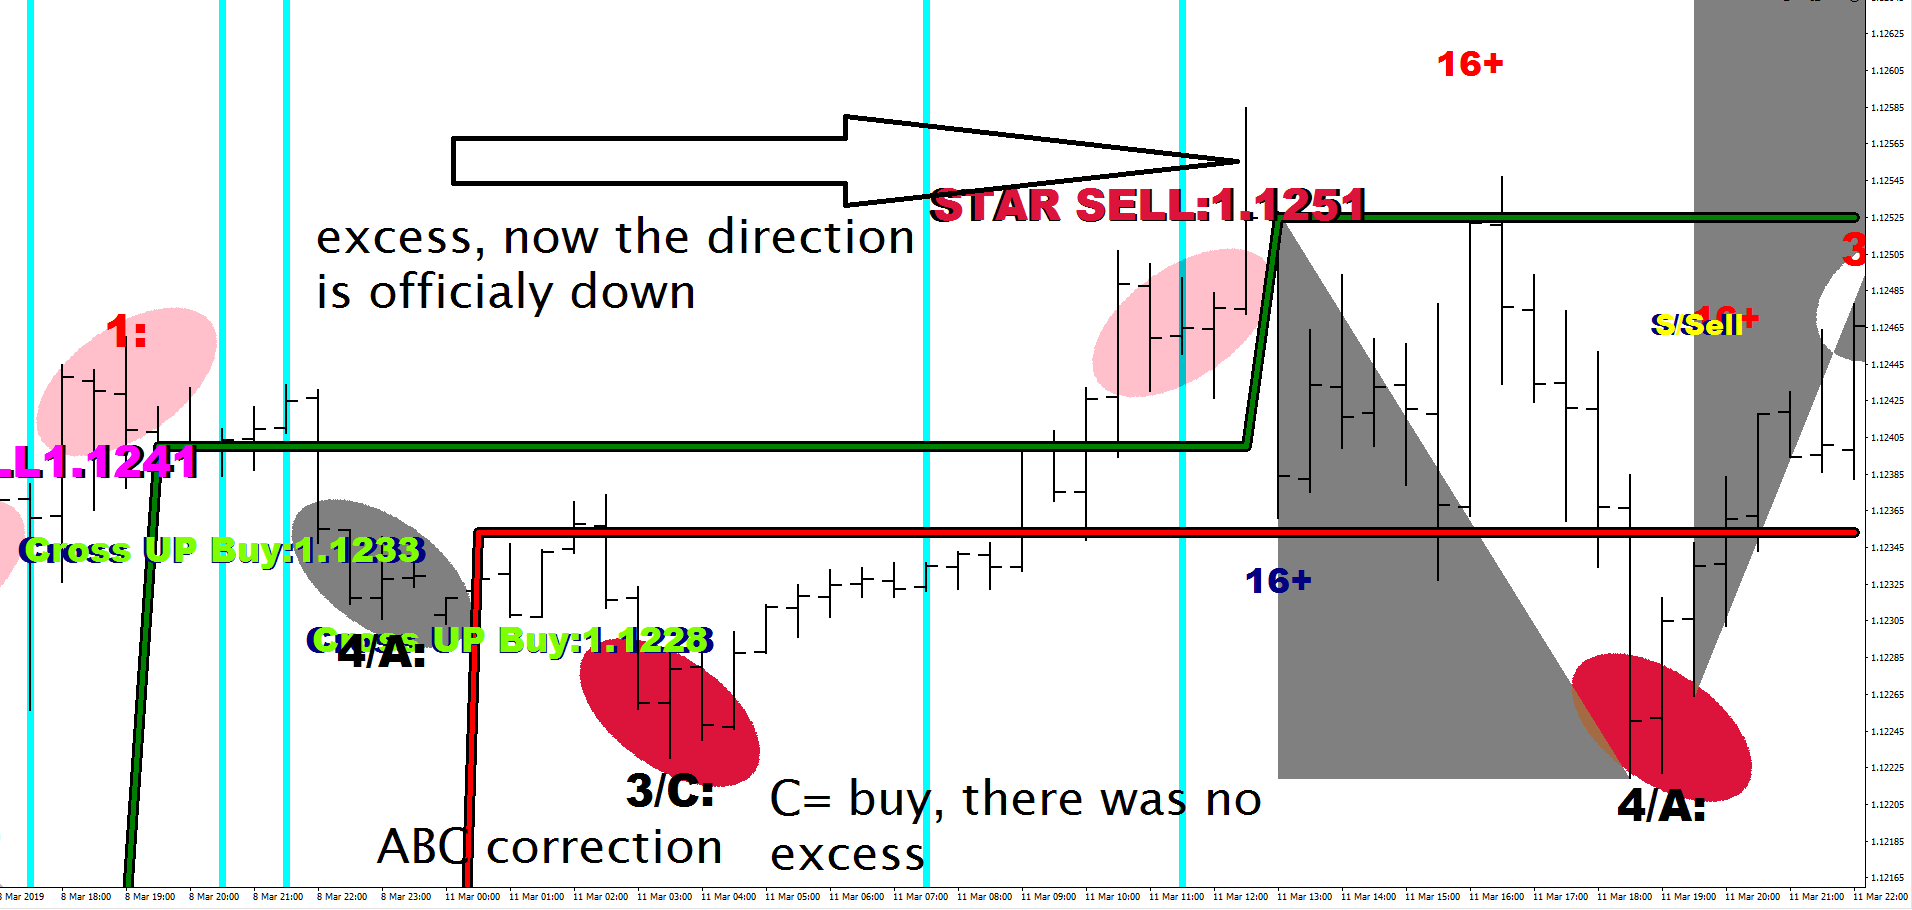
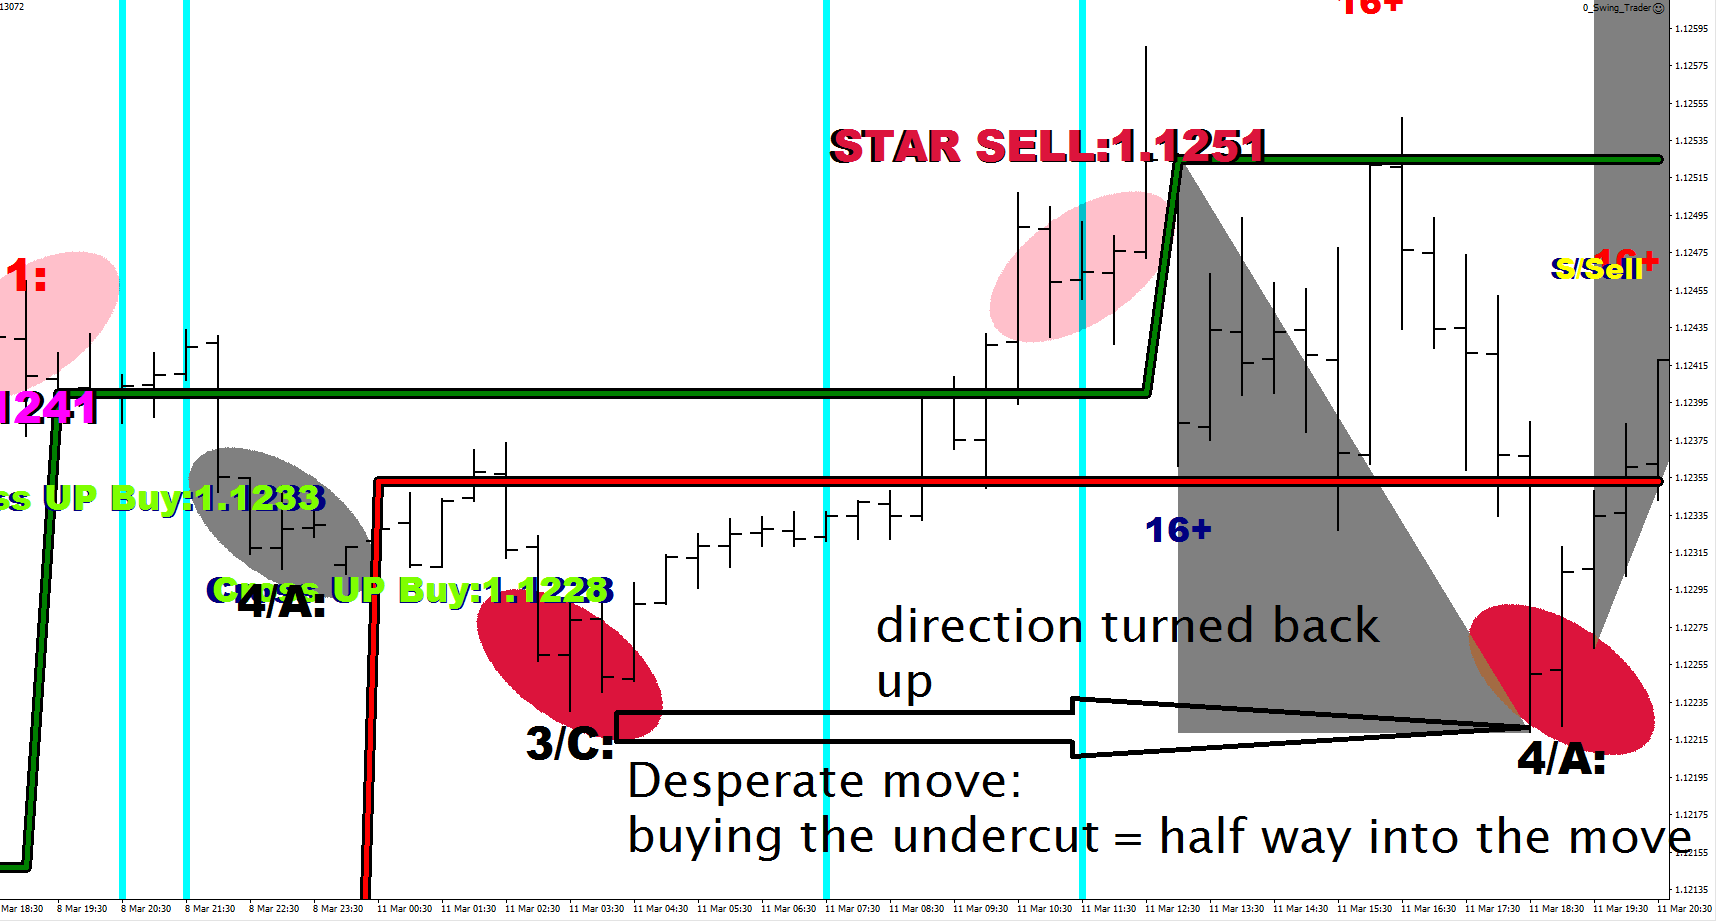
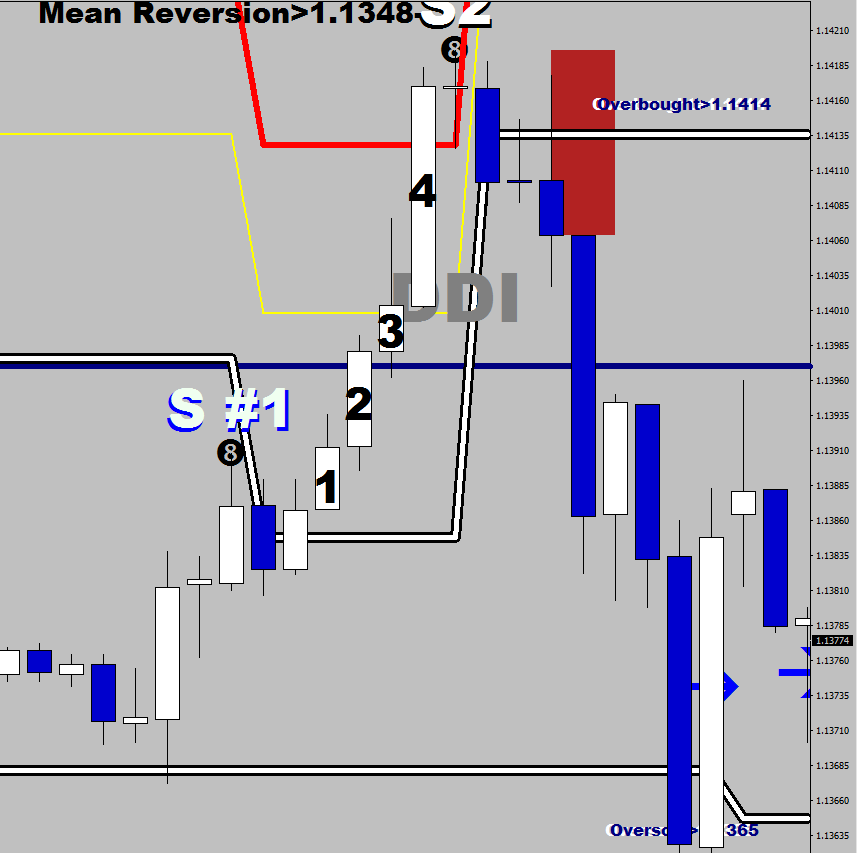
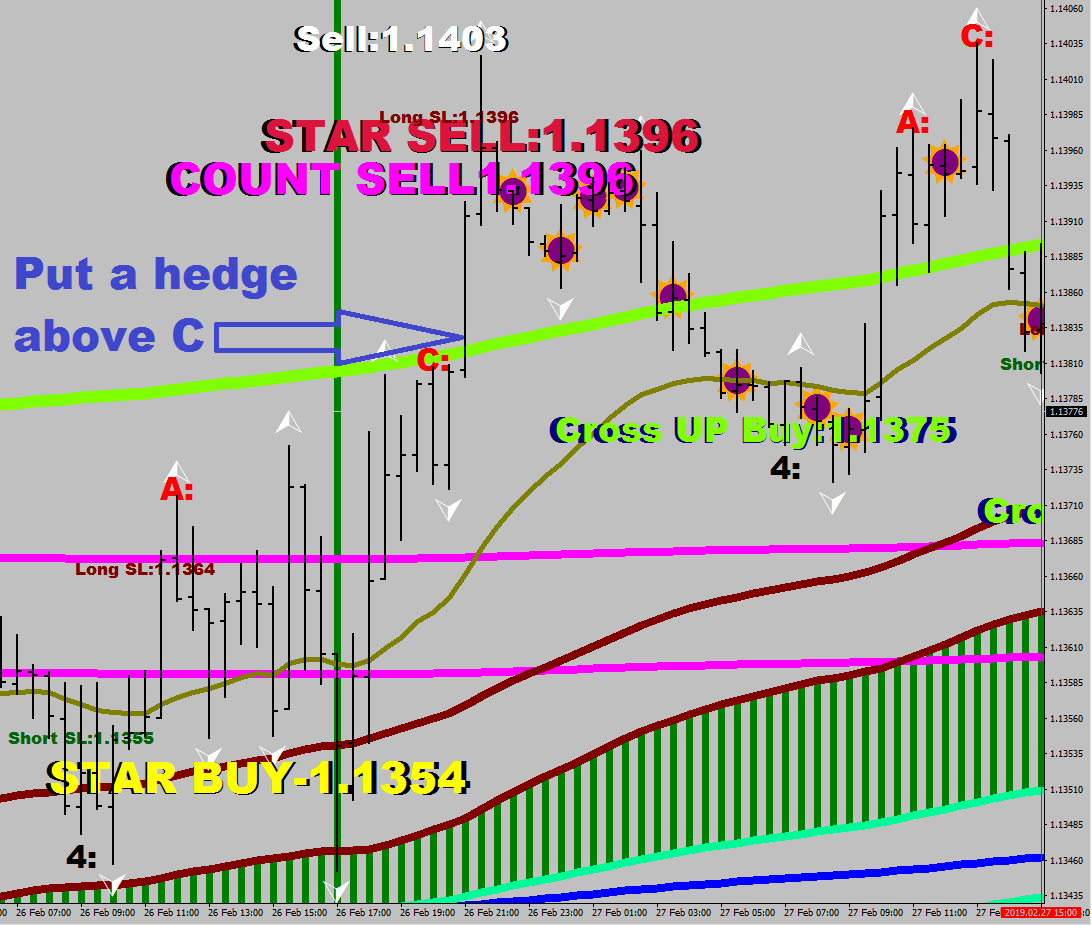
To find a starting point for the oversold trend’s continuation, you would be looking for an ABC correction.

There are a couple at once.

At times you may be wrong, and the high of the C would be taken out unexpectedly, so that is where you would need to initiate a hedge temporarily.

The image below also shows the violation of the upper guard rail coinciding with this move:

Here’s the calculation I use for the A & C count:

int countback=4;
int countup=4;

 for(i = 188; i >= 0; i--){
      if (trianglehigh[i] && ExtMapBuffer3[i]!=85 && ExtMapBuffer3[i+1]!=85 && ExtMapBuffer3[i+2]!=85) countback = 1;  
      if (ExtMapBuffer3[i]==85) countback = 4; 
      if (tup[i]!=EMPTY_VALUE) countback = 4;
      if (trianglelow[i] && ExtMapBuffer2[i]!=15 && ExtMapBuffer2[i+1]!=15 && ExtMapBuffer2[i+2]!=15) countup = 3;  
      if (ExtMapBuffer2[i]==15) countup = 4; 
      if (tdn[i]!=EMPTY_VALUE) countup = 4;
       if (RSI2[i]<92 && RSI2[i+1]>94) {
           if (countup==1) {
                 countup=countup-1;}
      else if (countup==2) {
                 countup=countup-1;}
      else if (countup==3) {
                 countup=countup-1;}             
      else if (countup==4) {
                 countup=countup-1;}        
      else if (countup==5) {
                 countup=countup-1;}    
      }
      if (RSI2[i]>8 && RSI2[i+1]<7) {
           if (countback==1) {
                 countback=countback-1;}
      else if (countback==2) {
                countback=countback-1;}
      else if (countback==3) {
                countback=countback-1;}             
      else if (countback==4) {
                countback=countback-1;}        
      else if (countback==5) {
                countback=countback-1;}                         
   }
}

Where lays the dog buried… The triangle highs and lows.

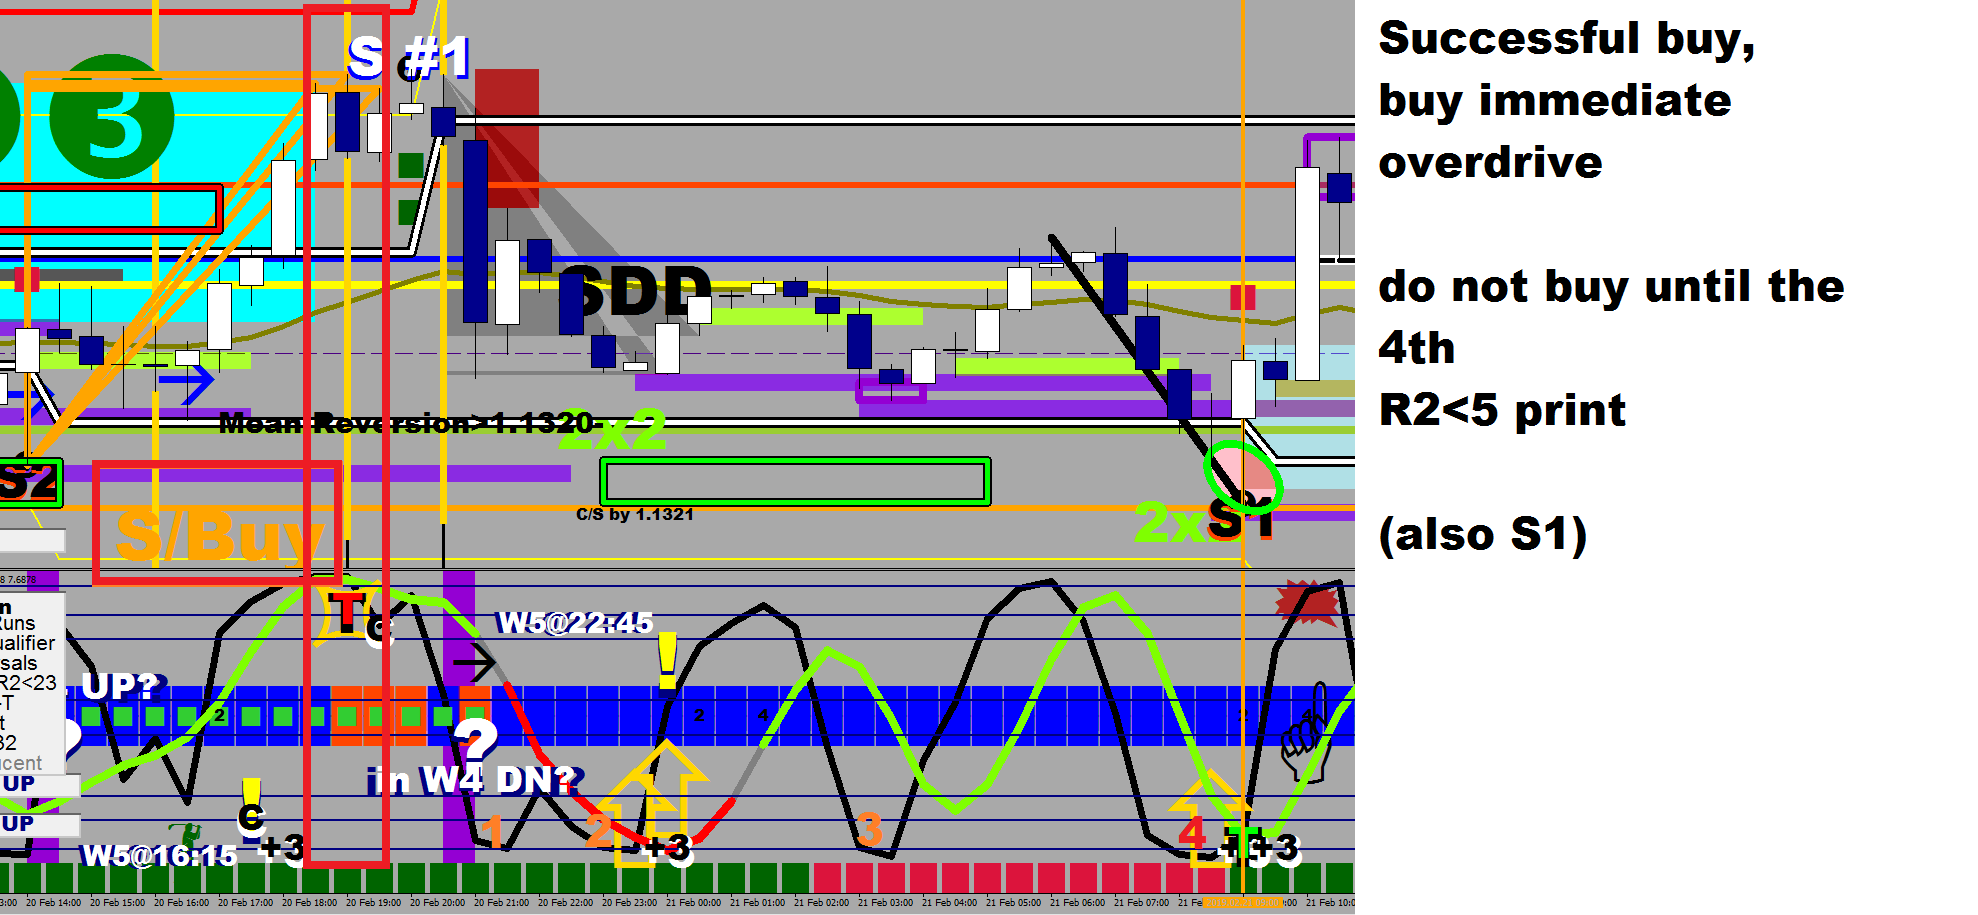
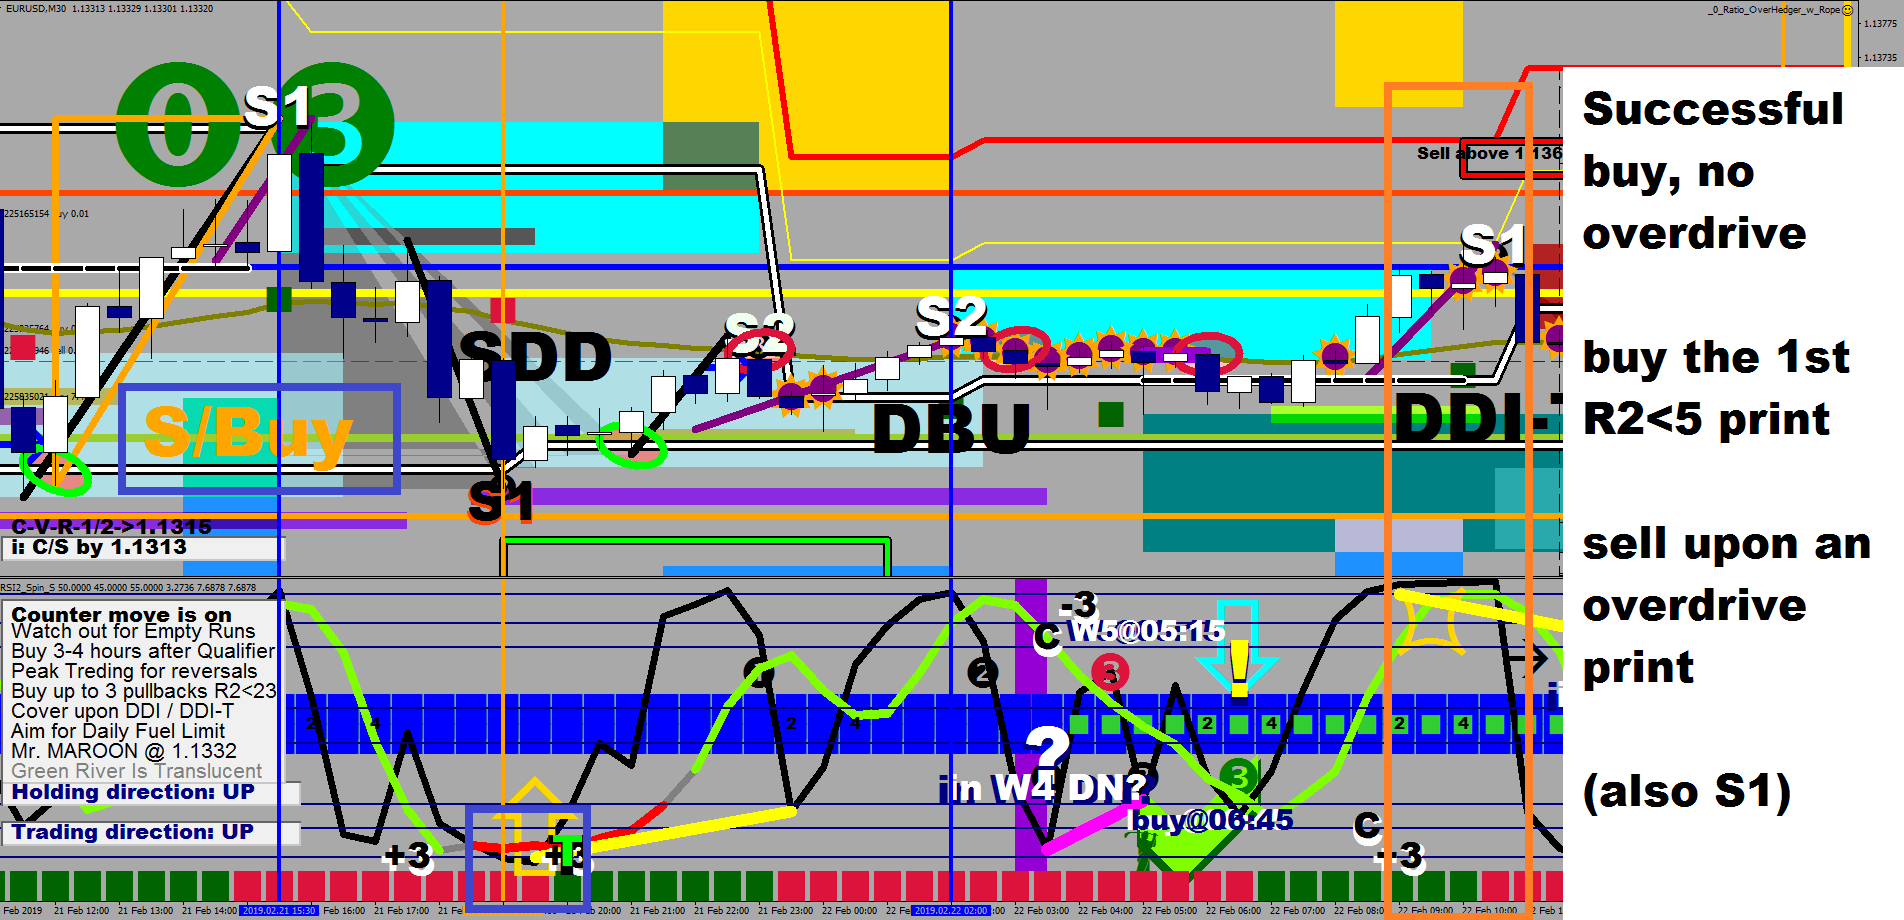
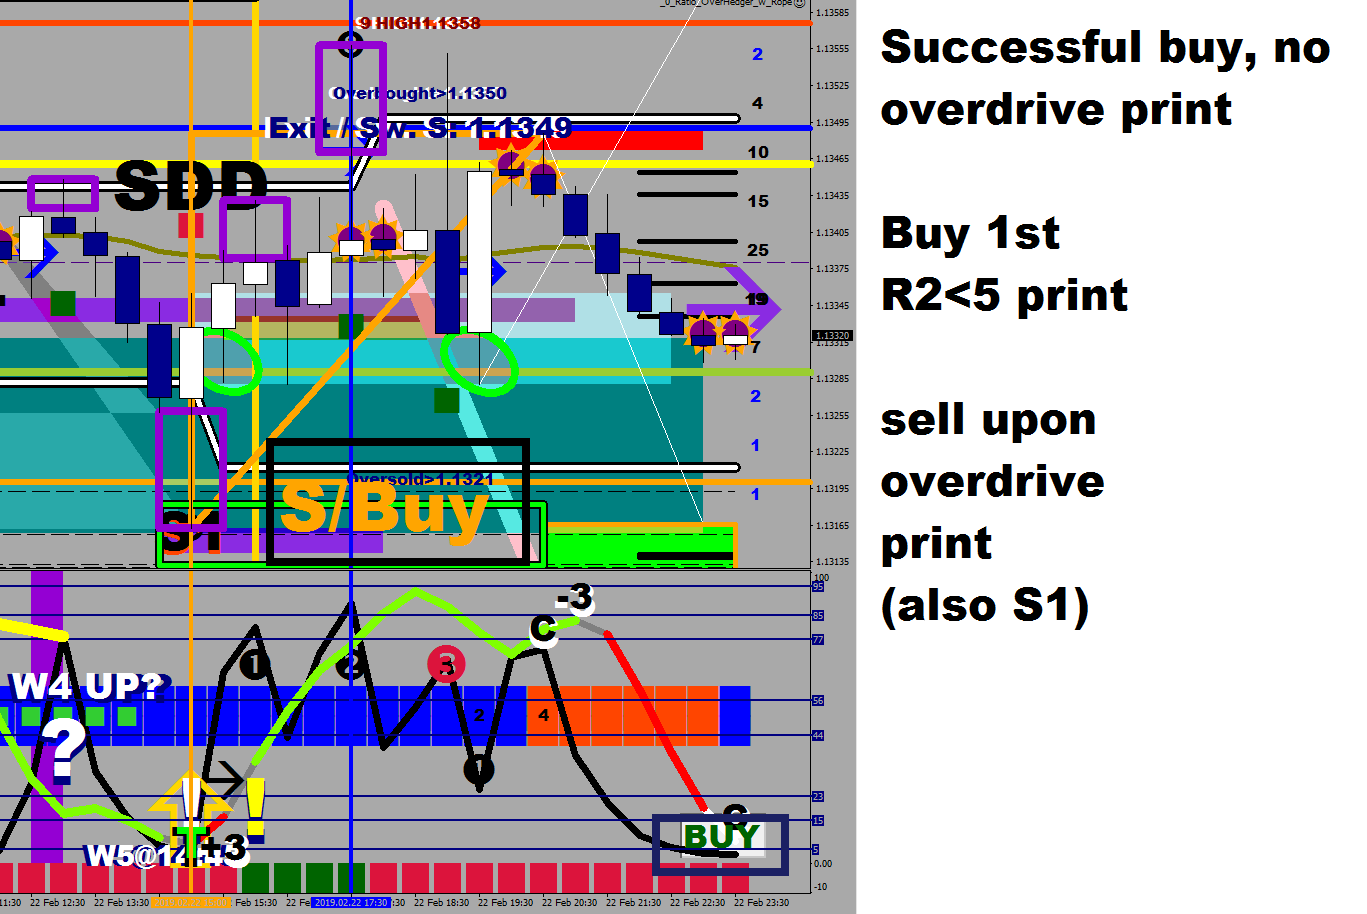
I have been talking about the Slope of Nope and successful buys and successful sells. People tend to put me on ignore for this, oh, well…

    if (stoch2[i]<20 && Period()==30){   
        for (j=i+1; j<=i+11; j++)         
         if ( iHigh(symbol,30,iHighest(symbol,30,MODE_HIGH,j-i,i))-Low[i]<FSize*1.5*10*Point && stoch2[j]>80)
               trianglelow[i]=True;}
    
    if (stoch2[i]>80 && Period()==30){  
    for (j=i+1; j<=i+11; j++)         
         if ( High[i]-iLow(symbol,30,iLowest(symbol,30,MODE_LOW,j-i,i))<FSize*1.5*10*Point && stoch2[j]<20)
                 trianglehigh[i]=True;}
     } 

ExtMapBuffer2 and 3 are the Stochastic Bars Mixed’s High and Low arrays

As for ending, here is some visual practice to draw meaningful conclusions.

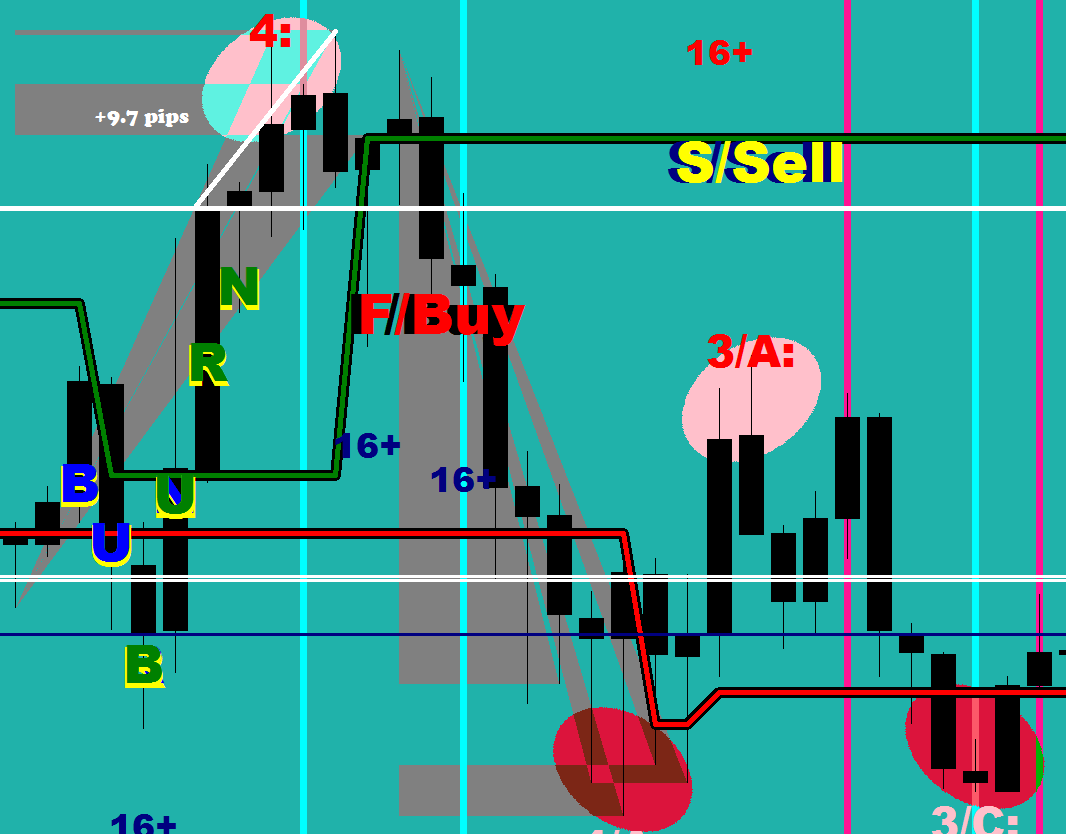
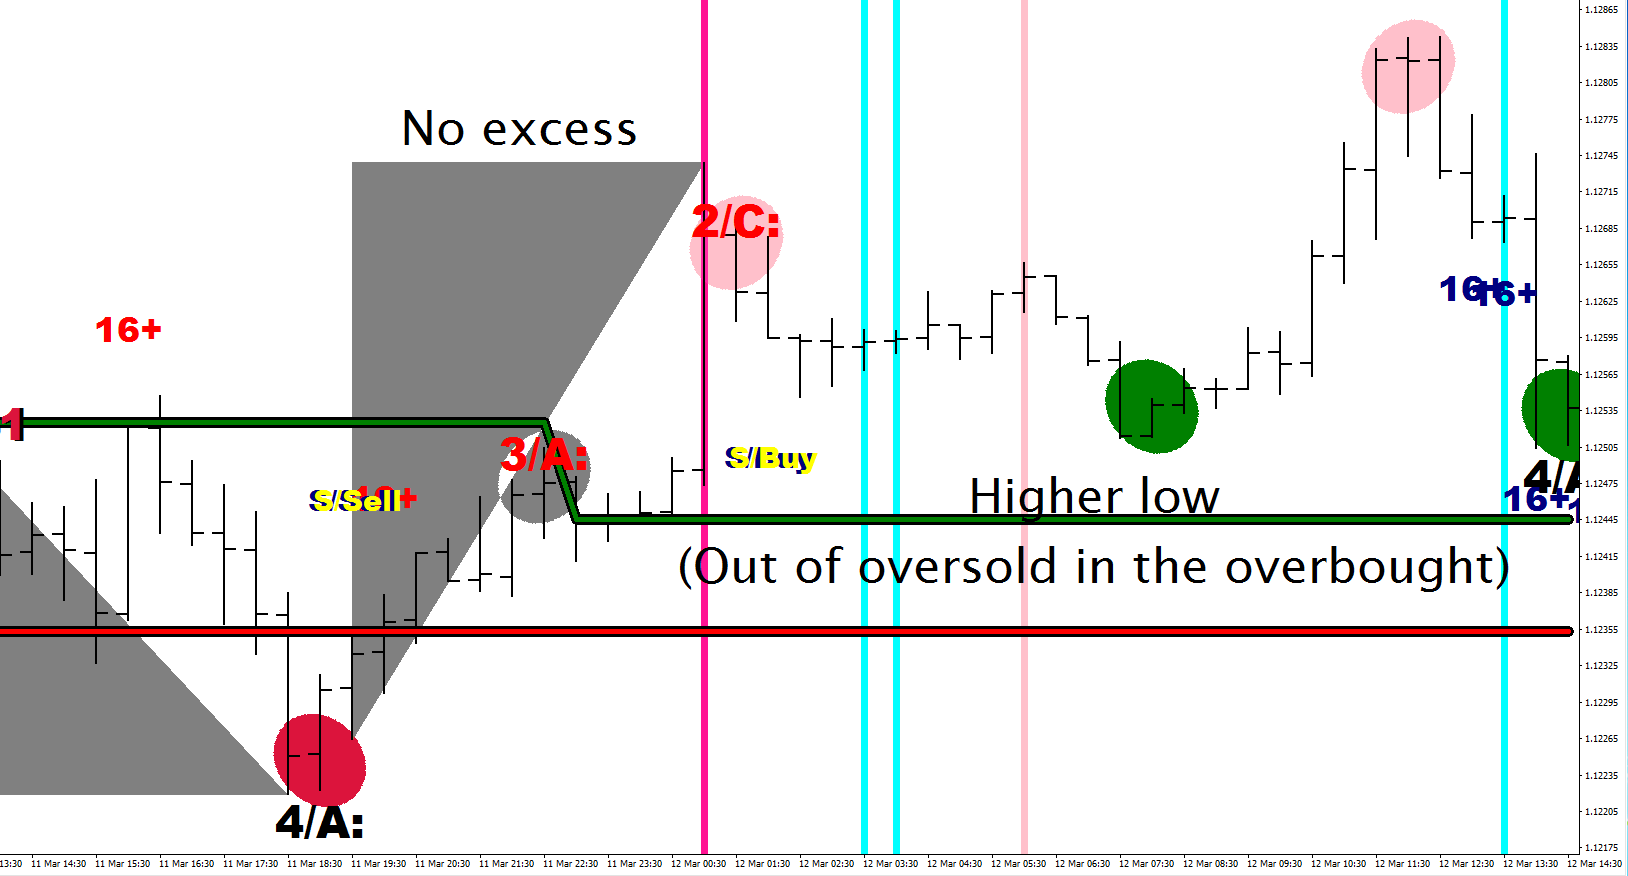
Look at the shaded zone between MR. Maroon and the Green River. That is what I call the Spark Zone, where moves come out from. In our case, it served as the igniter for at least 5 counter moves on the image below.

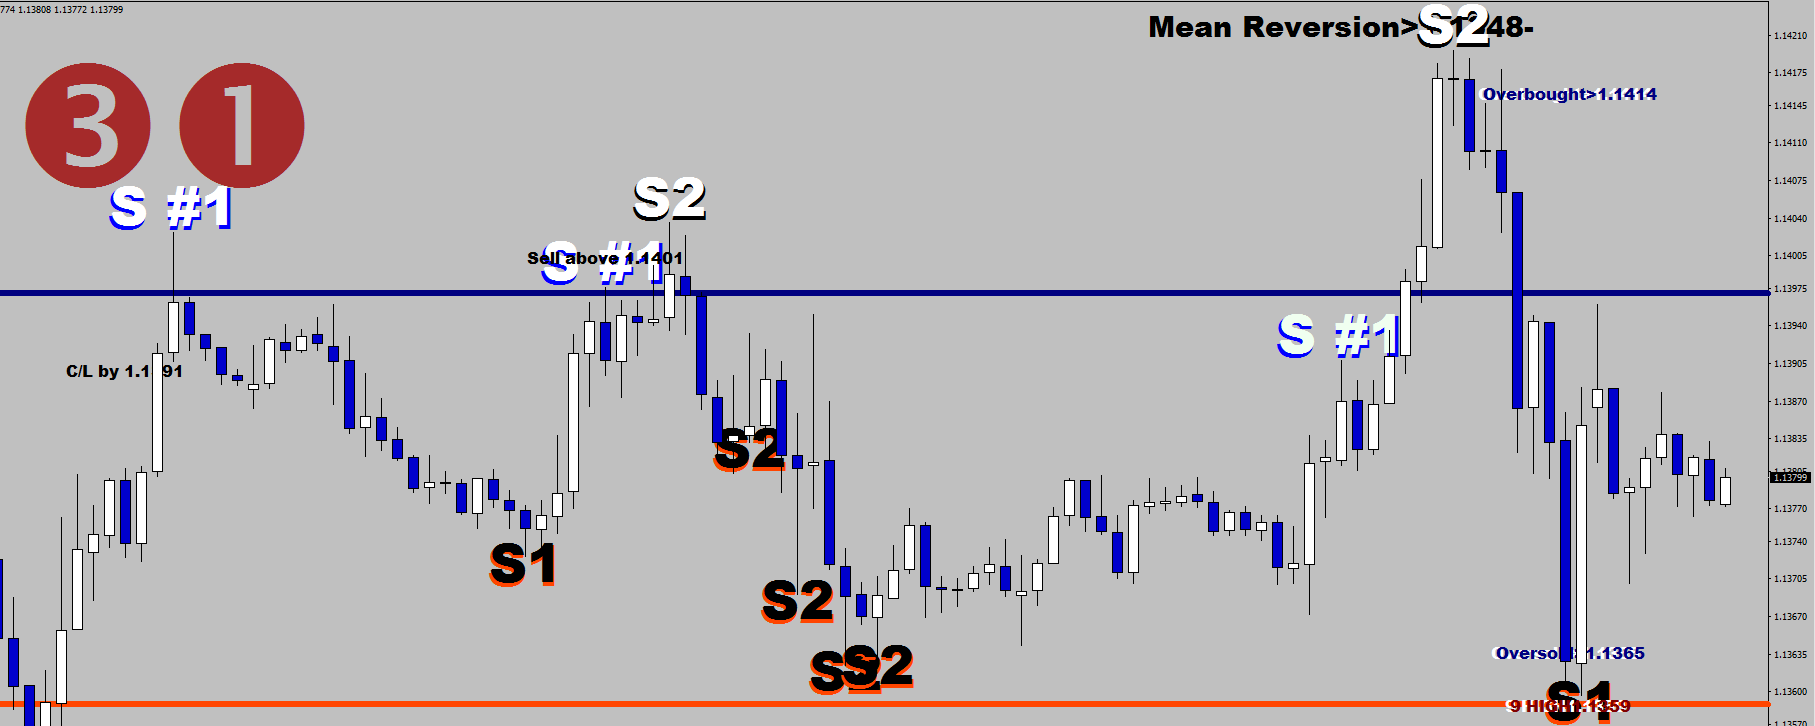
It does not take much the sync up these two images and see, that both A/C prints were S#1-S2 Sync pairs, furthermore they both had their ending points beyond the chartreuse upper guard rail. Ironically, it is the Bull Zone 1 where the bulls fail.

Sorry for the high density, I hope that things are starting to come together in your head.

Homework: knowing what you know now, how should the embedded oversold trading program look like?

  1. initiate a short holding after an ABC correction to the upside.
  2. Exit(s)?!

…another A/C from a little earlier…

Wishing on a Star (the indicator)

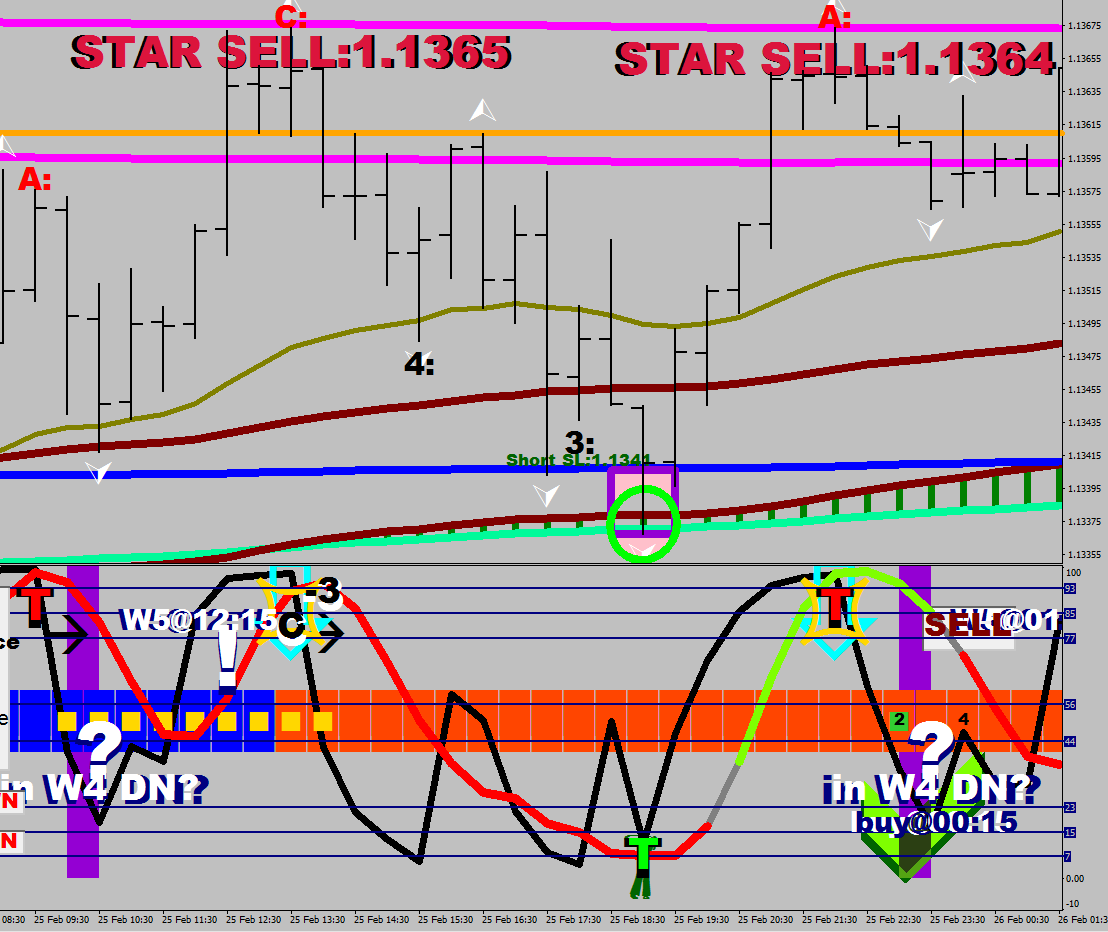
On this unusual Monday afternoon, with the highest ever recorded temperature in the UK for the month, in his grip (hype!) Macdulio was pondering to himself… Hmm… Everybody is talking about Fusion, maybe I should call my Trading Direction Plot on the bottom of the RSI2 indicator Fusion. And he saw, that this was good. And then he thought to himself: I could make an indicator that would be even better than a TradeMate! And then he quickly realized that any indicator on this planet was better than that. So he went on to do his own thing, as per usual.

It started out as an innocent pattern recognition among everything that looked like chaos. I noticed a recurring theme.

& I made a call based on these:

& since I was right, I made an indicator based on these:

& for the hell of it, I am going to make an EA out of it, yes.

RSI2 Spin – Test EA

Somebody asked if RSI2 Spin was an EA, And about why do I call this artificial intelligence. This was the first part of my answer:

I refer to the complexity of figuring a direction, that could be deemed as artificial intelligence; I enter a lot of premises that would exceed the human mind’s capability to make a binary decision about.

You could make EAs out of the logic, but they may be late by 30 minutes, for they need settled values, otherwise you might get false triggers.

The second part was taking the AI as is and turning it into an EA.

I decided that it should close trades if both the Omega and the Omega Master are the same color (in consideration for the direction), and was not the case for the last print, and open a directional trade on the third alike print.

I lifted the target logic as is from my DDI trader that operates with the real swing levels for exits – as mentioned in the previous RSI2 Spin article.

I knew, that my auto trail stop would be running alongside, so I used the new codes, 0.2 and 3 for stop losses, that do not start trailing until 20 pips in gains.

The close out part had to be done by a cropper function, so this became the first ever instance of a 2 in one EA test, where a cropper is part of the EA, not a separate routine.

As for temporary draw downs, I am not at all worried, for I would be making on the opposite direction automatically by my Ratio Hedger initiating counter trades at different levels of draw downs starting from 15% (it would first slow down the equity draw down, then eventually reverse it). In the back test it is not possible to include other EAs.

I even adjusted the cropper part of the Omega trader to be able to close all but one micro lot from 3 out of the 4 kinds of hedges: the rope trade, the half hedge and the over hedge can now be automatically closed out upon a direction change (and leaving 1 micro lot would prevent them from being re-opened), the full hedge can not.

Of course, the sizing is current equity based, as it is on all of my routines.

Here is the first test, that had one weak spot:

Here is the second, optimized one a little larger size:


If you wanted an answer for the life, the universe and everything – here it is.


No clue why, but at times the test does not run for the whole period, it gets cut off like in this case.

Mixed feelings, I know… The world is my oyster, and I don’t even like sea food!

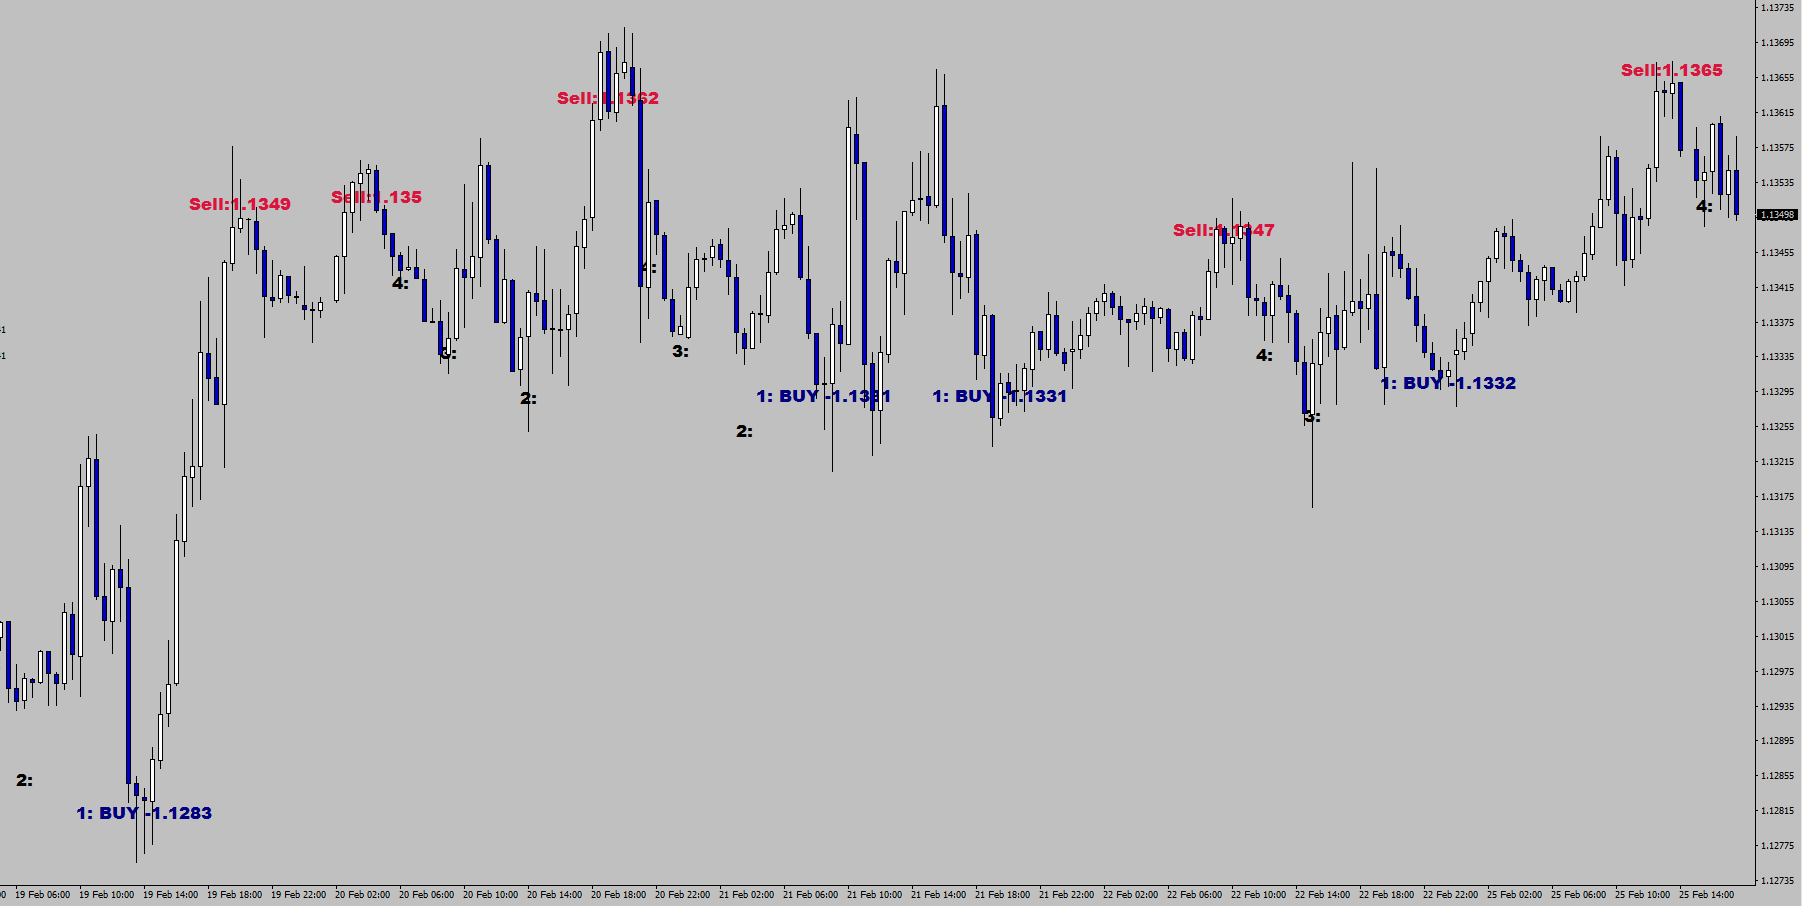
Had to give more credit to the successful buying since the last article.