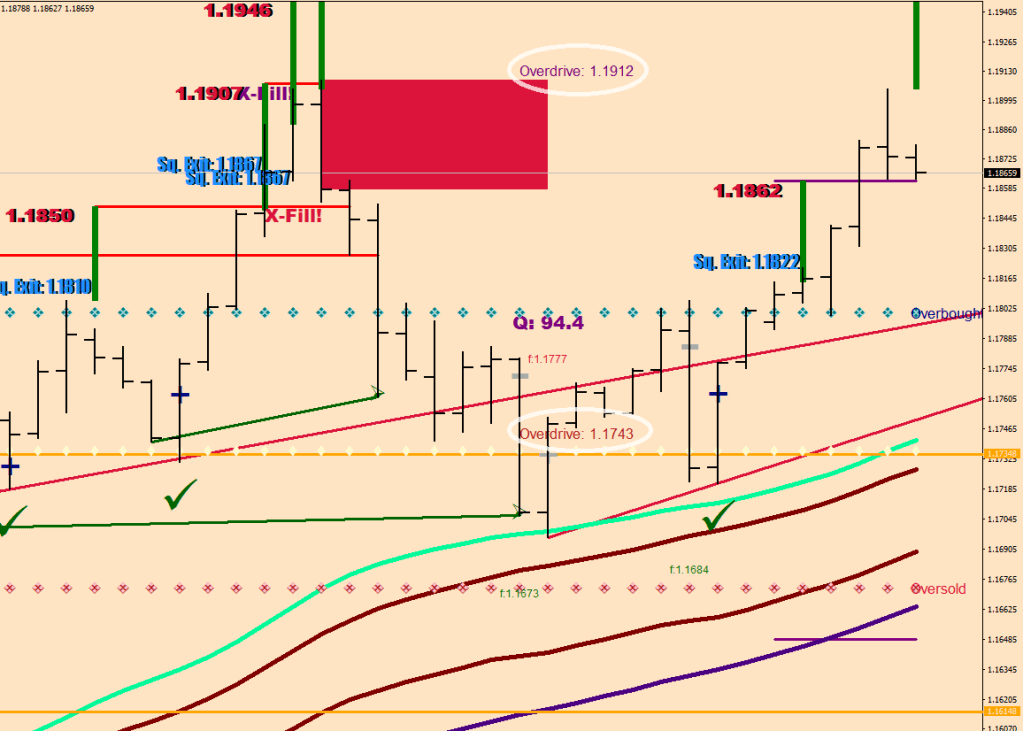
The overdrive lines come with the 2Fractals_15min routine.
They are the red on the top and the dark green on the bottom.
I figure them from the displacements of the hourly E-32: + – 2.2 x fluctuation maximum.
One interesting fact is that the 200-pip pullback from the top fizzled out at such a level (in a still embedded overbought market), and another interesting fact is that the current double top also coincided with the inability to shift buying into overdrive.
I have made an effort to plug in at least the values on the 4H chart. Think of it like a flexible channel.
Notice how the selling never got to an oversold level.
I would consider making plots, but I cannot add them to the existing routines, and they may end up being too coarse anyways because of the large pauses in data flow.
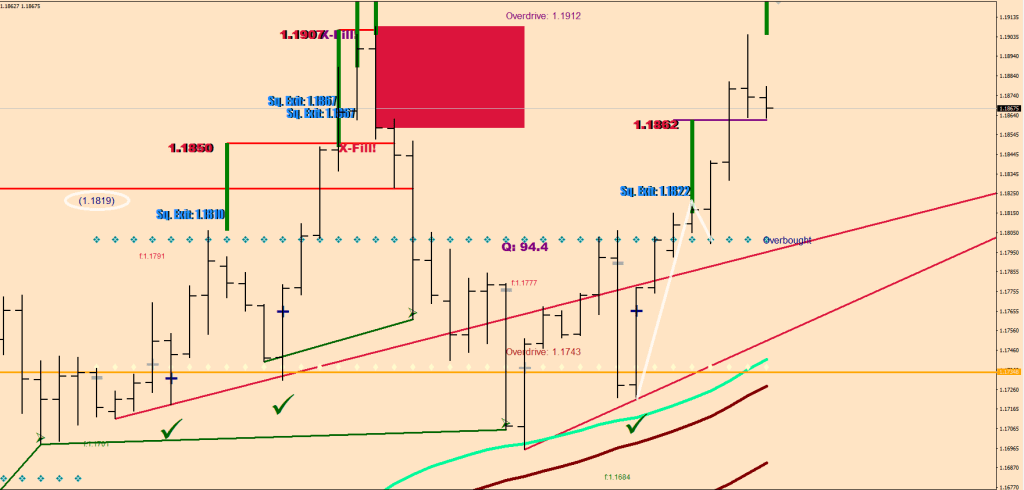
Back to the previous lesson, you can see how the theories worked in real time today, the 1st break above overbought was a sell starting 1.1819 from where the squaring went back to the overbought neckline.
The second move back above was not a sell as I said, and with this article you have a much clearer picture in your had about what the long exit would be: a failure at the overdrive level.
…
I was buying the keel-back, but should had set my mind on the overdrive instead of scaling out by 1.1840 – this is what bias does to you.
…
Picture shows the price bouncing off the Green River twice
Welcome to the Elon Gated Community. We are listening in on the conversation between two residents.
A.D. seems to have blown a fuse upon coming across an announcement.
A.D.: What does AI have to do with arbitrage trading?
B.C.: AI is a broad term and its usage in trading can be in different elements of trading. For e.g. using AI only for execution or using AI for creating strategies etc.
B.C.: Also, the quantum of AI being used by any firm will vary. Some firms might be using just 5% AI contribution in their operations yet they can claim their’s is a AI based solution. Also, we do not know for any firm whether using AI will pay-off over a longer period of time. Having said all this, AI/ML has lots of good stuff which can be used in trading.
(make note how quantum here stands for “degree”, “percentage” but boy, does not it sound 10,000 times more scientific?!)
A.D.: Arbitrage utilizes price difference. There are two variables and a comparison. Nothing artificial to be learnt there. Arbitrage finds speed advantage and or price advantage. In stock market terms this exploits the inefficiencies that may exist among the 13 US exchanges price quoting. They also call arbitrage trading when two supposedly similar securities or commodities go in opposite direction and you make a bet that they would equalize aka pairs trading.
B.C.: Yes, AI can be used for this or in the execution side. you can many methods how ML/AI can be used in arbitrage.
B.C.: Currently I am not focusing on ML in trading. My focus is on NLP (which again uses Deep neural nets) and strategies using technical indicators. At the end of the day to achieve success you need (1) a market expert (2) an ML expert (3) both should trust each other and hopefully get something good out of their efforts …Lol
A.D.: Still not sure why any of this is called AI. There isn’t even a hint of intelligence alien to human thinking, that cannot be comprehended.
A.D.: And what is the machine learning? Does it start to write programs of its own without human interception? I doubt it. Storing things is pure memory. Making things fast and often is high frequency. I don’t get the French attitude of having to invent new terminology for things that already have a name.
B.C.: What is ML? Take for example there are 4 series — 1 dependent series and 3 independent. ML determines which is the appropriate equation that binds dependent series with the 3 independent series.. To do so it makes use of past data ….
B.C.: How is dependent connected to independent… Linear / non-linearuadractic, ploynomial etc.. Different ML algorithms help find this relationship. either through supervised or unsupervised learning.
B.C.: Some ML are useful in finding patterns… (e.g. patterns in stock charts) If ML can do this …why the need for a technical analysts to find head & shoulders, divergence !! Some ML are used to fool market participants in trading.. mostly used to fool retail traders who end up bad execution of traders…
B.C.: Some advance ML type like reinforcement learning… start operating on their own without human intervention are they have learnt sufficient well… Lol Basically, humans will become more and more absolute in coming years.. Good that you are in this century…
A.D.: I am already obsolete
B.C.: You will have to keep yourself updated mate.. you are multi-talented… so take some more effort and stay updated
A.D.: All is needed to put you and your machine learning ai algos out of business for good to change something in the order execution without telling you about it. Automatization in trading is doomed. *
B.C.: yes, that’s what I meant try to dupe retail traders. But in this case, even the manual traders will get duped. Can’t help.. manipulation is everywhere.. you need to choose the right race to run … Lol
B.C.: Hence, my focus is now more on Macros in forex.
B.C.: You need to know all this mate
A.D.: And all you need to know about fundamental trading is this: fundamentally everyone is trying to make money.
Hi you have called Reneissance I mean, Gothic Trading. We are a somewhat automated service. How may I conduct your call?
……
*: how can someone who identifies on his LinkedIn profile as Automated Trading Developer say a comment like that?
Achilles Dent, aka Macdulio automates certain trading elements to decrease / eliminate risk (promotion of free trade) and to optimize the exits of trading positions, but he does not advocate automated naked opens.
Hedging, trail stops, croppers, target adjusters are what he specializes in and uses them as tools to make human trading a little bit more sigh-borg like.
– Sigh –
“Sigh your name across my heart” – Terence Trent Dolby
During overbought safety every lower continuation divergence is a buy.
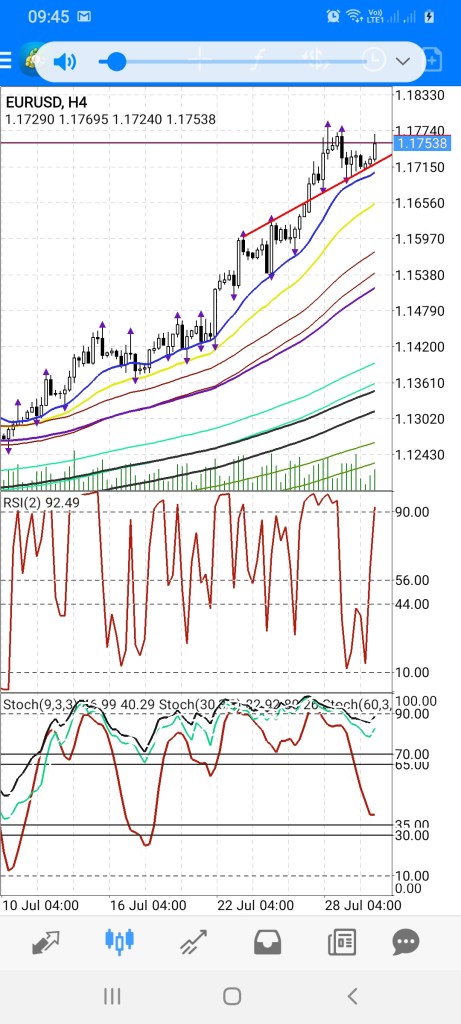
The RSI2 Basic routine can plot for you specific continuation divergences that can tell you below which point you should buy. I also included the RSI2 2 and 98 squares in an extra LG version.
The whole wave structure was built on an RSI2 “2” reading. After that no RSI2 low came this low, so it was free accumulation below the continuation divergences and the RSI2 lows got lower and lower, and here is an RSI2 “2” again. Certainly, it is a buy, but this time not for a holding, only for a trade up, for this is not a root up this high in the air. This RSI2 “2” is a first leg down.
The exits shall remain the Extension fills and /or Mac Counts starting an “8” on the 4-hour chart.
As for the question, how can there be two End of Wave 3 signals and consecutive beat triangles?
The first “3” was the end of wave 3 of Wave 3, followed by wave 4 down.
The second “3” was the end of Wave 3 followed by Wave 4 down.
…
Remember what I said in the previous lesson about Wave 5 achieving similar degree of stretch as wave 3 of Wave 3?
…
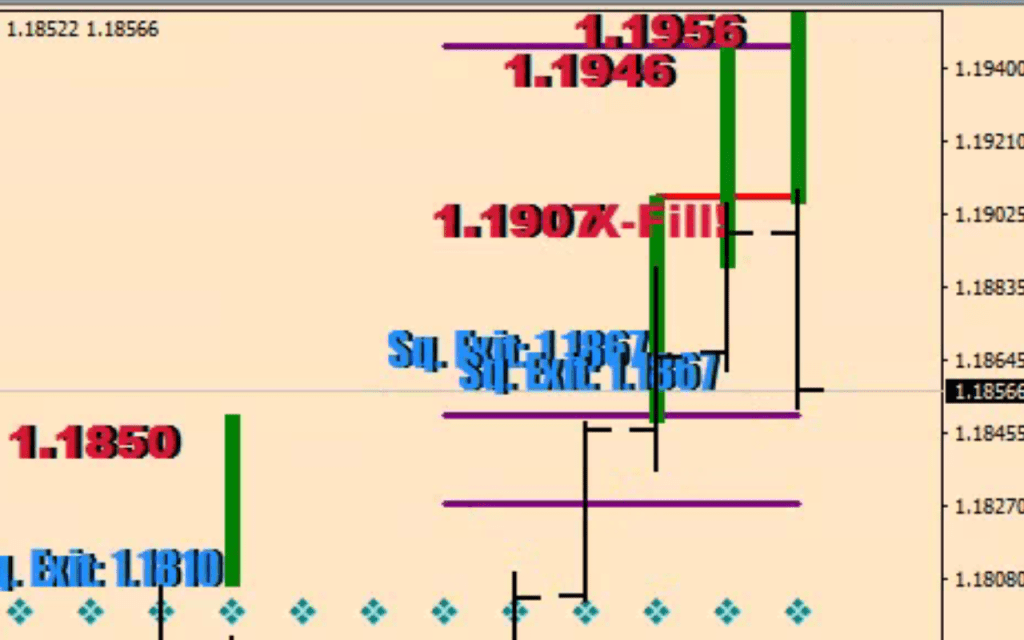
Wave 5 was a rising wedge. 1.1907 was the extension.
A wave structure should be visible on the 4H chart.
A new wave structure starts from the other side of Mr. Maroon – which usually coincides with E96.
Wave 3 starts when Wave 2 ends. Wave 2 makes a visible bend on the 9-sample stochastic, and likely takes it to an oversold level. As you can see, there is a counter move in there somewhere before the last push down (Wave C) which ends with an RSI2 reversal divergence.
You can see the corrective nature of Wave 2 down – an ABC move down.
Wave 3 ends with an extension fill and does it so with an 8 or larger DeMac count. In this current example during the earlier batch all outstanding extensions got their fill by count 12.
The following 8 -batch had no ambitions going after the last extension, and so the high of the 8th got never exceeded. (Choppiness DV shows this high as an exhaustion & a beat.)
As you can see, price is now in a Wave 4 down (tattackhe 2nd attack on the oversold since the New Wave root), yet again with this schizophrenic motion of going in two directions seemingly at once.
Wave 4 would make a shot over the bow: it would likely go more oversold than Wave 2 got to – since Wave to failed at E32 (yellow), Wave 4 is expected to get further, to E-67: a near miss of Mr. Maroon is very likely in the low one-sixteens, before Wave 5 up would kick in.
I managed to suppress the urge to post some Duran-Duran here. Props for me!
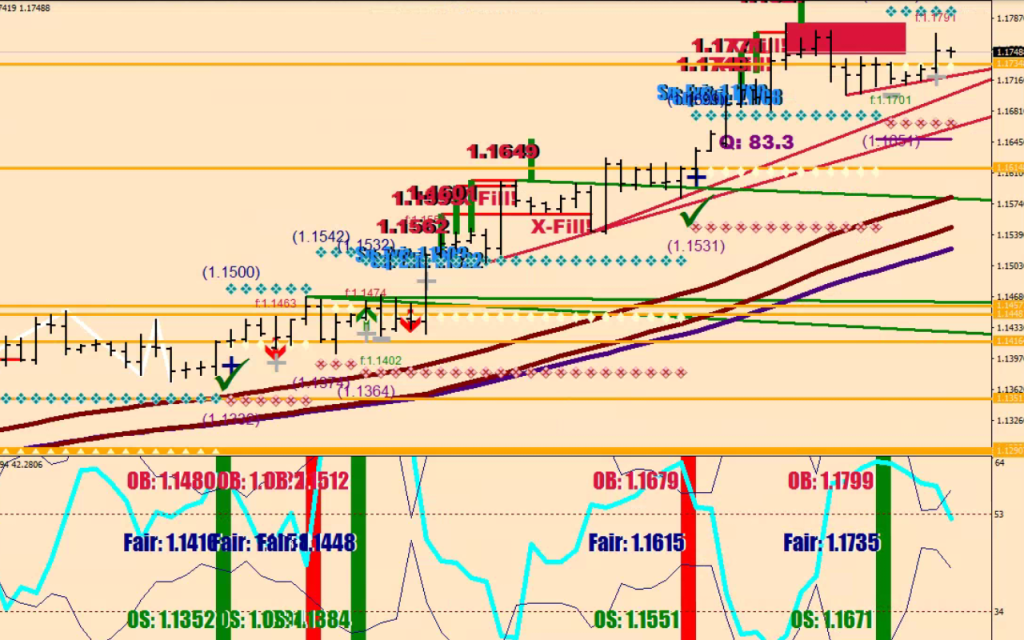
This move, that showed no follow through upon crossing over the consolidation mean at 1.1735 is expected to fail before reaching overbought, possibly around the f. 1.1791 level.
The extension is a stone throw away at 1.1827… I know, this is exciting.
…
The moral of the story is the divergence in price progression and distance from the mean:
…
The take away is that the wave 4 we saw was the wave 4 of Wave 3, not yet “the” Wave 4.
Not being able to reach the extrnsion levrl at 1.1827 is a valuable piece of information about the weakness.
Now there are 3 continuation divergences that can be knocked down like dominos which would provide clearance for the price to get back to the mean.
Wave 5 may go as far as reaching a similar degree stretch from the mean as wave 3 of Wave 3 achieved.
he has small mistakes like calling the 5-year and 10-year note a bond, talking about US second wave when it is still the first, but he makes an attempt at the wave structure and finds relevant news very well
…
This guy charges $7,500 per DVD absolute scammer pretending to have made millions & poor losers don’t even realize that they are the ones buying him the cars
Don’t forget to not learn any of his pseudo scientific crap such as “the stock is panicking”.
Anyone referring to Timothy Skyes as a mentor defines themselves as a scammer. I love the video where they sit next to each other and Skyes claims to have made 3k the other day and Duxi multiplies down with a false claim of 18x that money, putting the iconic scammer to shame.
Skyes also have sat down with Samuel Leach, and they looked terrific together. Scammers, unite!
…
There is stuff to learn here, but what he does not factor in is his cost of maintenance on holding triple leveraged ETF
I want alpha, I diversify, I want some serious gains – says Desmond, the DJ. If you want serious gains, you invest in the right things and don’t diversify. Check out Charlie Munger’s holdings. Berkshire, chinese etf and Costco.
Desmond made 17% gains with his “algorithm” which is a screen plot made out of indicators in the last month. I don’t have any algorithms, I have a market model and inability to hold and currently at 84% gains hoping for 100% by Aug.
Desmond is an amateur and shall always remain so.
…
Got no video for this one (only a short one as part of the article), but decided on adding it anyways
this guy made $28 million with spoofing – and blew it all, never spent time and now does honorary work for the FED
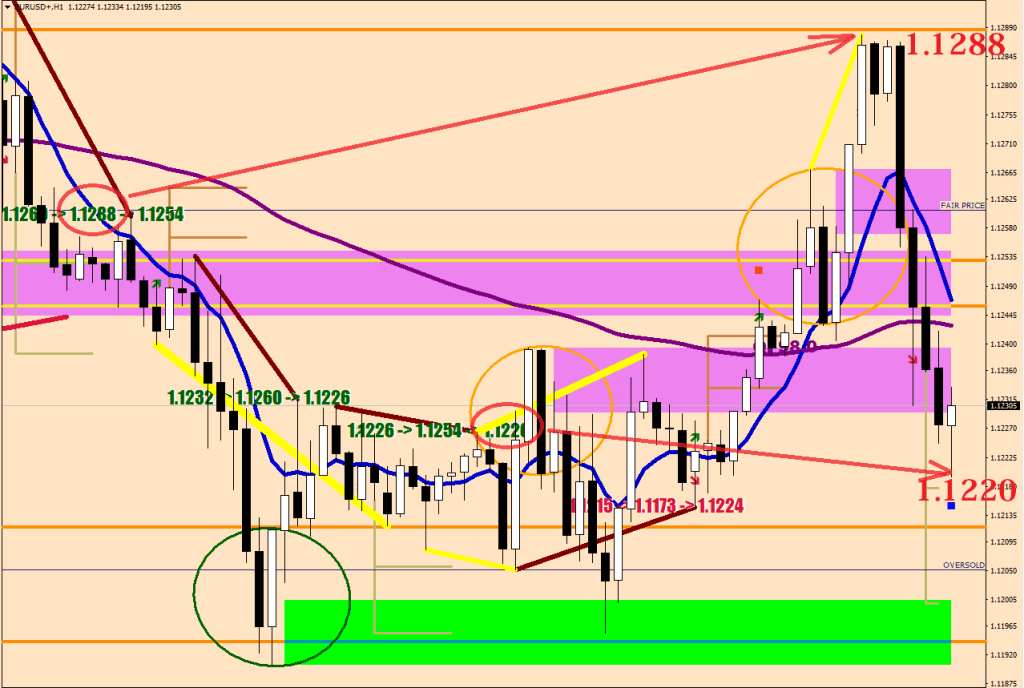
The first overbought / oversold move would fail back to at least the overbought / oversold neckline, this is why the bracketed numbers are on the screen: they tell you to start fading (on the first break into the overbought / oversold) there and add to your position every 10 or so pips knowing that price would retrace to the neckline where you should be squaring.
You should not fade the second breaks.
Lesson 2: the follow though. The letter f & number is the maximum distance the failed move may be able to reach without crossing over a consolidation mean one more time.
Wherever there is a cross over, you will see a “+” or a “-“. The follow through would be ticked if the next 4-hour print achieves 50% extra distance beyond the length of the 4H bar that crossed over the mean.
F would thus stand for conditional failure and is a warning not to hope for any more gains barring a fresh reload at the mean.
I hope this clarifies things a bit. I believe that this market model covers more plausible market types than any other.
…
the best entry signals were hands down the continuation divergences
On the trading floor back in 2014 I remember how puzzled I was over these s1,s2,s3 “statistical” support and resistance plots on my neighbor’s screen. I was always sceptical of the one size fits all solutions.
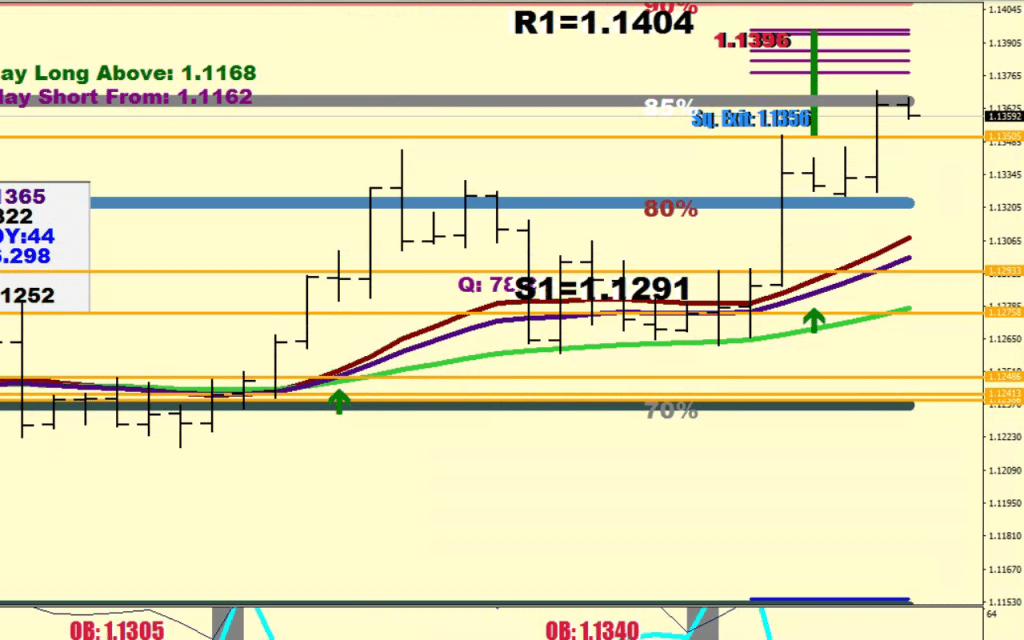
6 years later I feel like I am the only person in the world that can figure an R1 and an S1 accurately.
See, there is no instrument independent calculation. The measuring points for the upside never coincide with the downside’s, they are not opens or closes, they have nothing to do with trading sessions, trading ranges, so not even ATR.
How can you get all of the above wrong and arrive at the right conclusion?
I posted this image the other day.
What followed was a dip to 1.12625 and a rally to 1.1352. How does this relate to my S1 and R1 calculations? You tell me.
Why should it had been obvious to take this long side trade?
You still had a Cat. A buy signal in effect.
Play long above…
And the Cat. B buy was valid till 1.1243
Therefore your entry risk at S1 was low, 20 pips or so, and the probability of hitting R1 was high.
As for R2 and S1 I don’t think that a single line could be defined, so ignore them for now.
As for the measuring points, just remember this: they are the ending fractals of a continuation divergence.
Very impressed with someone in South Africa who went to look up my “Trading In Range” and “Volatility Whips” articles that were written in 2019. He obviously has been reading since, but whats unusual is that he remembered where to come back to for an advice. The term, volatility whip was invented by me, so there is no way anyone would be looking for it not having been to my blog.
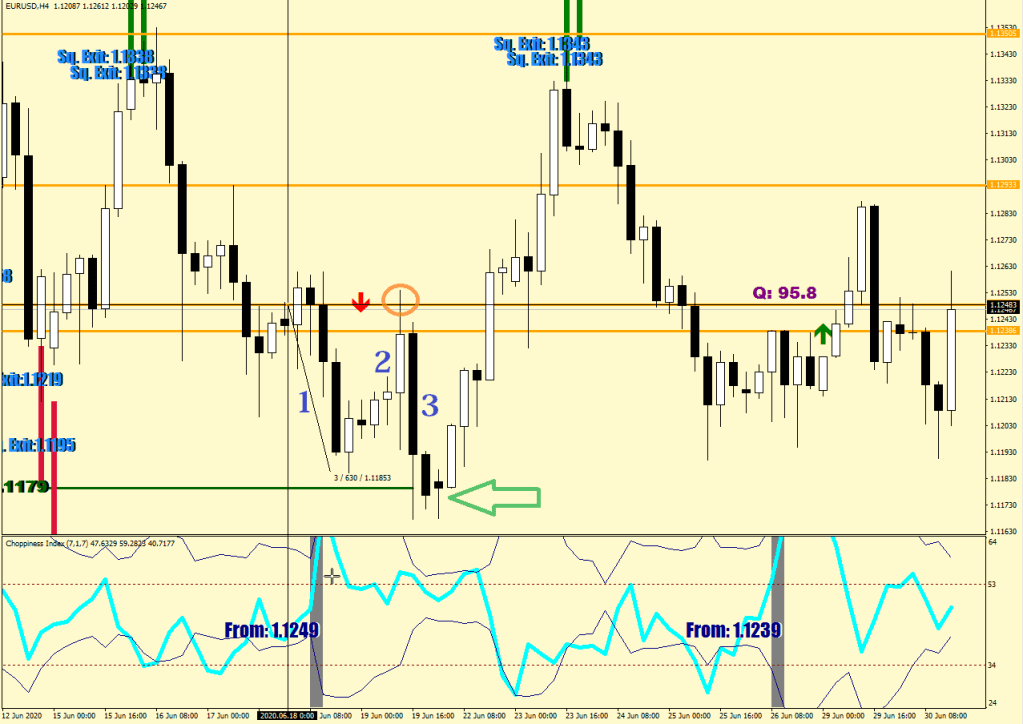
I drew the whip in white, A 9+ pip break in either direction would be a buy and could mean the next Wave 1.
Trading should be about practicing safe trading methods, and making money a side effect.
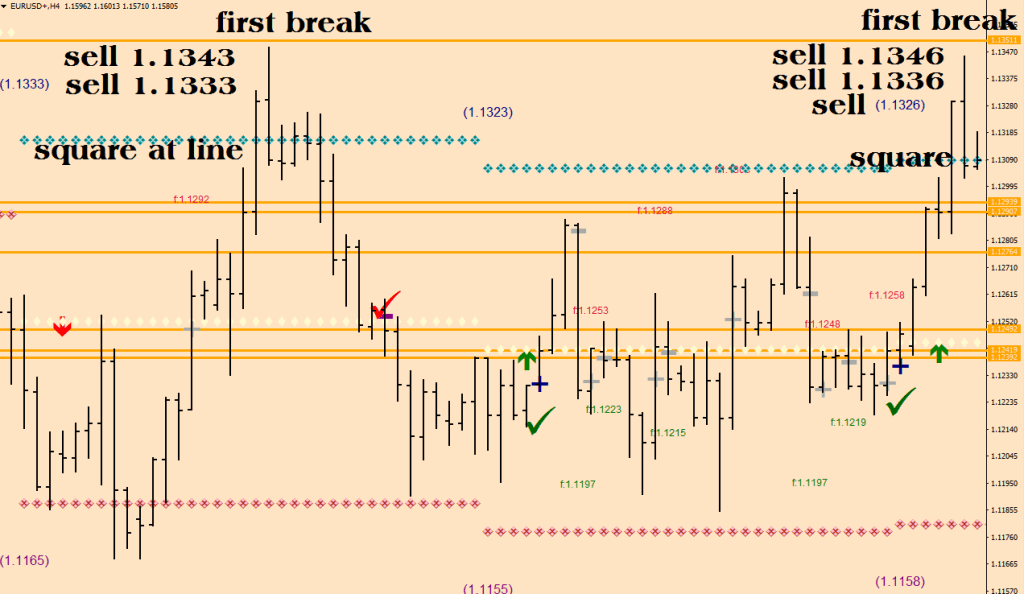
When price made a consolidation level, you would ultimately see a break out.
The break out would be of 2 steps: a pick of a direction and then the break-move that would go undisturbed until reaching an unfinished business level (i.e. an extension).
The important give away here is that the market would show you the direction to proceed in before hand.
In this first example the market upon having reached a high level of consolidation,
makes the opening move
retraces back to the starting point (and a little bit beyond)
makes the break
In this second example the market upon having reached a high level of consolidation,
makes the opening move
retraces back to the starting point (and a little bit beyond)
makes the break
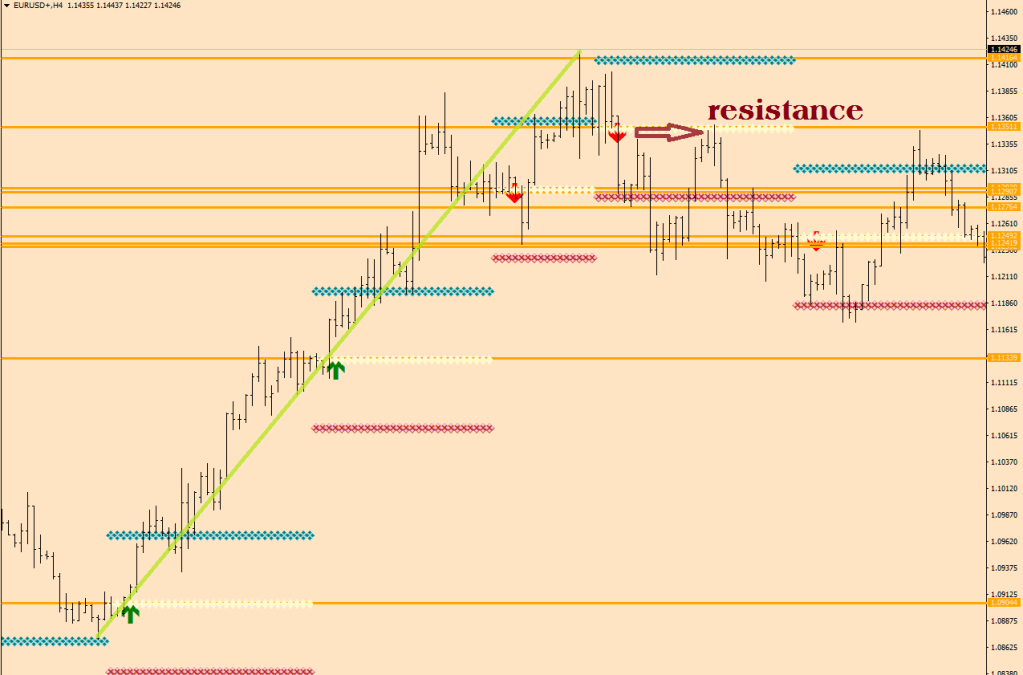
In this third example the market upon having reached a high level of consolidation,
makes a move in the wrong direction
makes a larger move in the opposite direction that also turns out to be the wrong direction upon encountering the extension
returns to the starting point
One thing that can be pointed out immediately is that those first moves that were made in the direction of the future break were larger than 60 pips from the consolidation level, whilst the move in the wrong direction stayed below 60 pips.
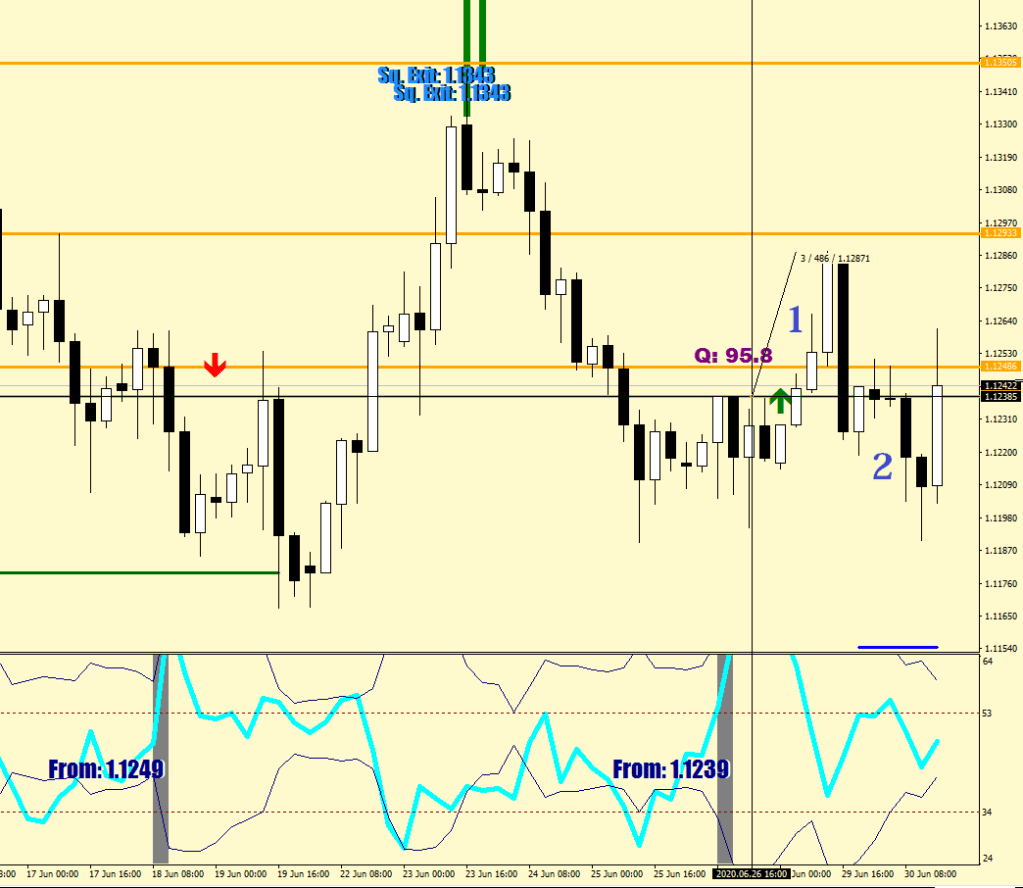
Now we have another high charge, but neither of the first two attempts have reached 60+ pips distance, they got to 49 and 49 pips away from the consolidation level before returning to the consolidation level.
Are there any edges here, how could you have made low risk trades here?
You could have utilized the decision distance on the first push away: fade the first move away from the mean at 45, 55 and 65 pips distance for a move back towards the consolidation level. If the opening move went beyond 60 pips, aim for re-capturing only 70% of the way back.
Now let’s look at the hourly continuation divergence-breaks for a second to see if there is a similar theme to be found about how the market breaks out.
How did this breakout happen (eerily similar looks to the fluctuation maximum whip) – the sequence of the events was
makes the opening move
retraces back to the starting point (and a little bit beyond)
makes the break
Of course in this case the break out only got to the end of the next support, and there were other warning signs such as the RSI2 squares: the first RSI2 reading gets the move going, the second winds it down – and there was a beat for a good measure. Yes, on the upside you are showing a starting RSI2 maximum (buying exhaustion).
The point to be had here is that for a safe entry wait until a continuation divergence break, then put a limit order 10 or so pips beyond the divergence point & get ready for a ride.
How? By utilizing the Free Trade concept. Once you are in gains, you put a protective stop loss (perhaps a trailing one) at 1, 2, 3 pips beyond your entry – now you cannot lose on this trade.
For me, the auto trading on my desktop takes care of it all: I set the stop loss to code “2” for a short, and I would get locked in 1 pip after 4 in gains, 3 pips after 8 in gains and then beyond 20 pips the lock in gets pulled at 16 pips behind (1/2 fluctuation size).
I got stopped out with $20 gains right after I could had taken $90 and soon after there was an opportunity to take $140, yet I am happy with what happened: I haven’t lost anything and have dry powder to play the next pullback after the initial move. I practiced disciplined trading. I should had payed more attention to the limitation around the consolidation level (+- 50 pips) and cut the positions for optimum gain. But this is how I can shape myself up to perfect, low risk trades. By noticing the sequence, by acting on them and factoring in the possible obstacles.
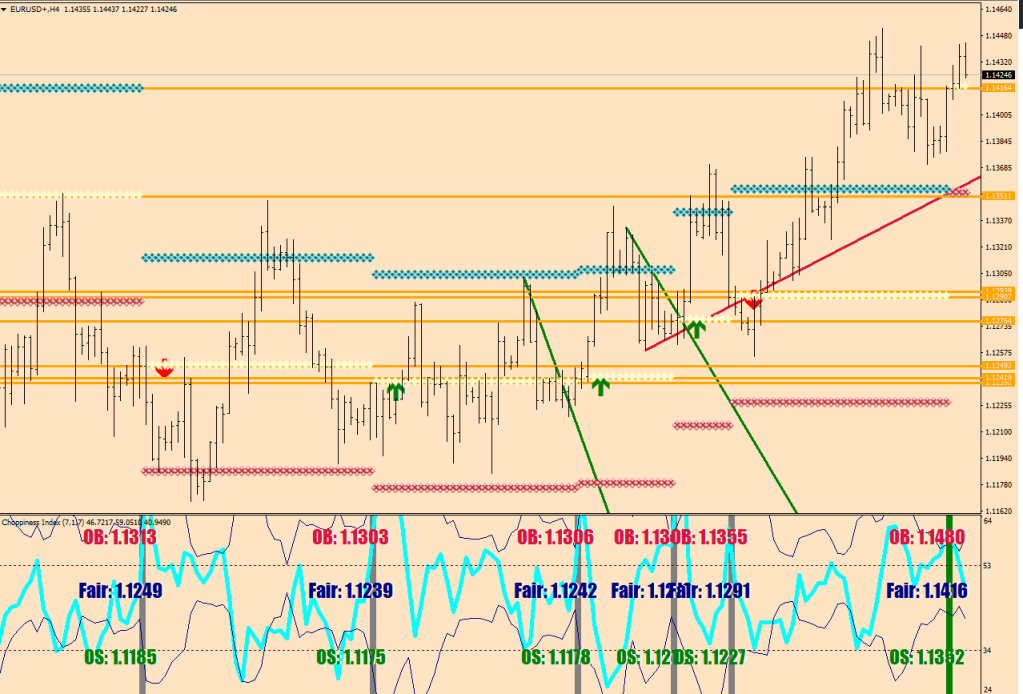
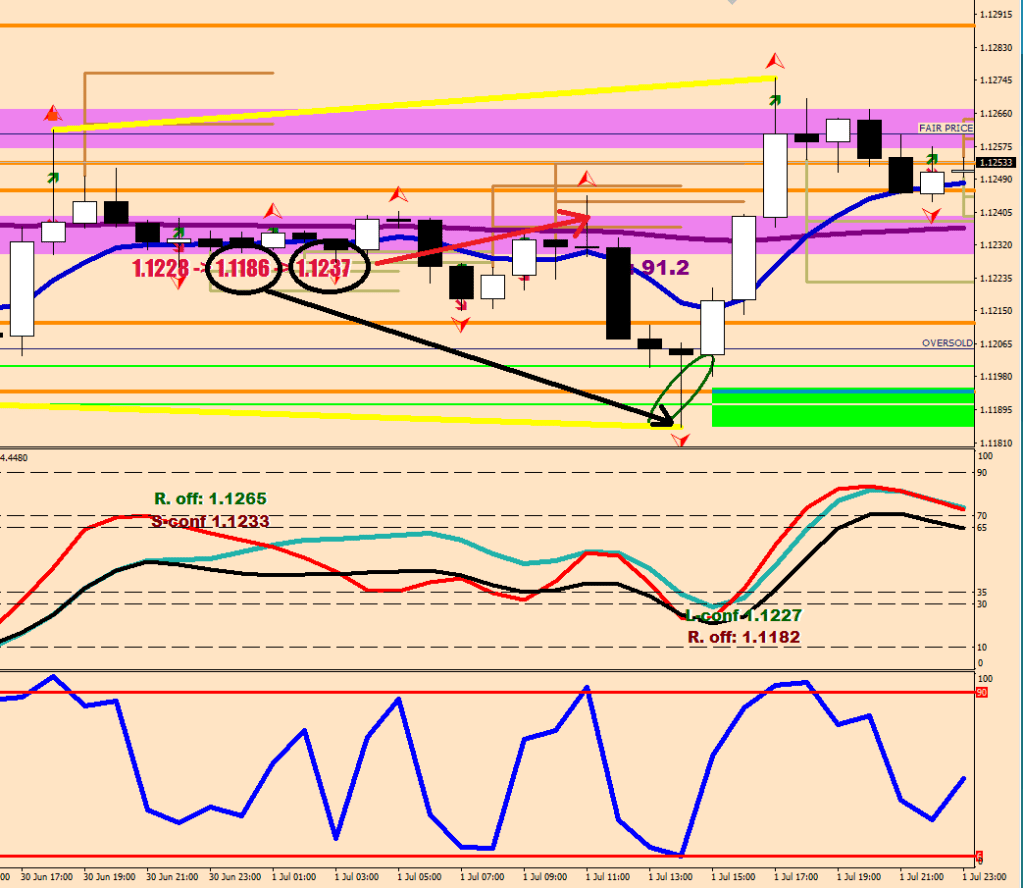
The following image shows how multiple continuation divergences can be broken one by one. In this sequence the price came back by 35 pips beyond the break point, but if you only started buying 10 pips+ beyond, your maximum draw down would had been 25 pips, and there was at least 70 pips to be had.
Those 3 upper brown divergence lines got knocked out one by one.
As for sizing, your total risk should little enough that you could withstand a 60 pips move against you – the explanation was on this page earlier. They know well that most retail traders cannot take a 40-pip move against them, hence the fluctuation maximum is somewhere around 42-45 pips.
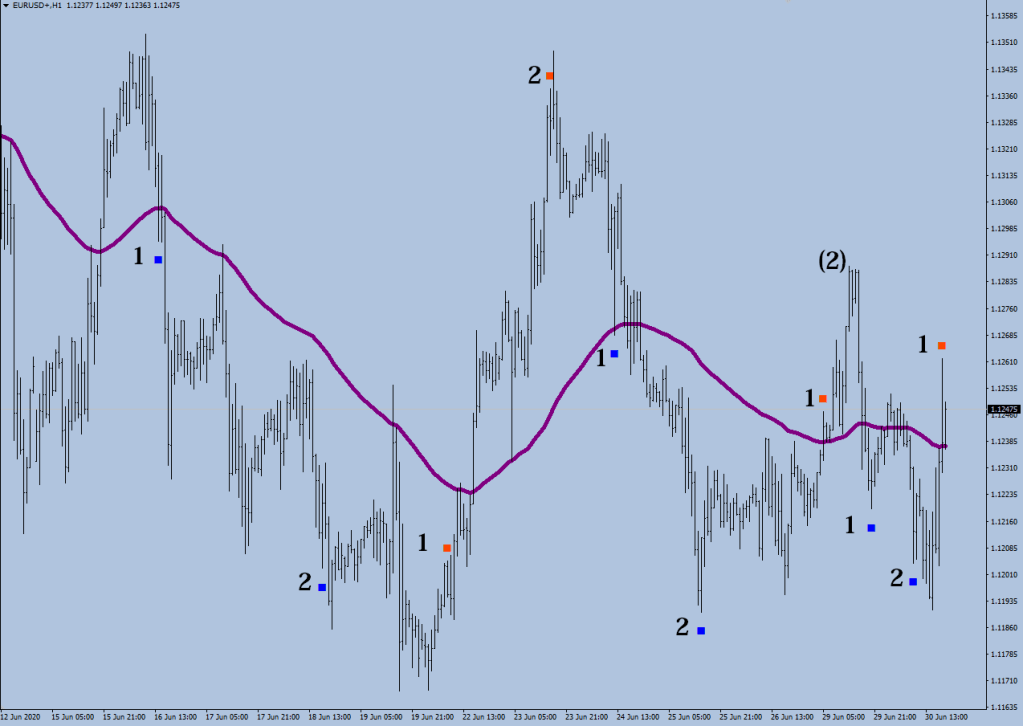
Below: see how you can use RSI2 in exchange for choppiness exhaustion readings. The (2) did not make it to a 98-read, it only reached 96, so that does not show.
…
This continuation divergence break, however minute it was, lived.
Cat A signals: Extension fill (scale in fade) Full Charge = Reset (no direction) 4H Exhaustion Beat + Forest (high base) Aim: 80+ pips
Cat B signals: Cover Longs + overbought Comfort Level (>70) Cover Shorts + oversold Comfort Level (<30) Cover Shorts + spike low Cover Shorts + spike high Beat of 2nd RSI2 square plot in the same leg Beat of 15min stochastic bar + Forest Aim: 60+ pips
Cat C signals: Continuation divergence break (pullback entry, scale in, trail) Aim: 50+ pips