When Does A Day Start?

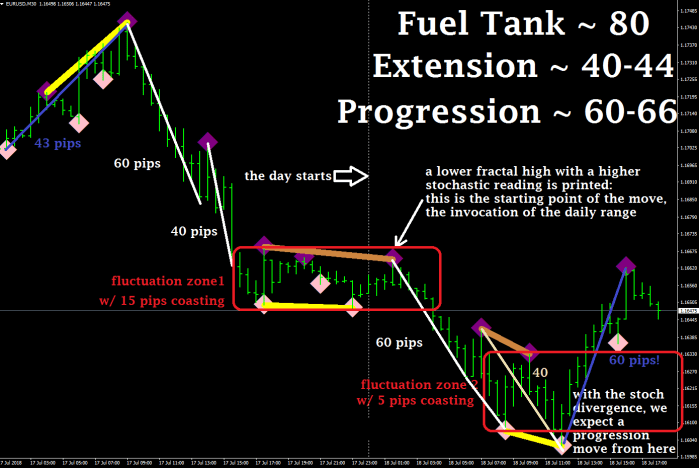
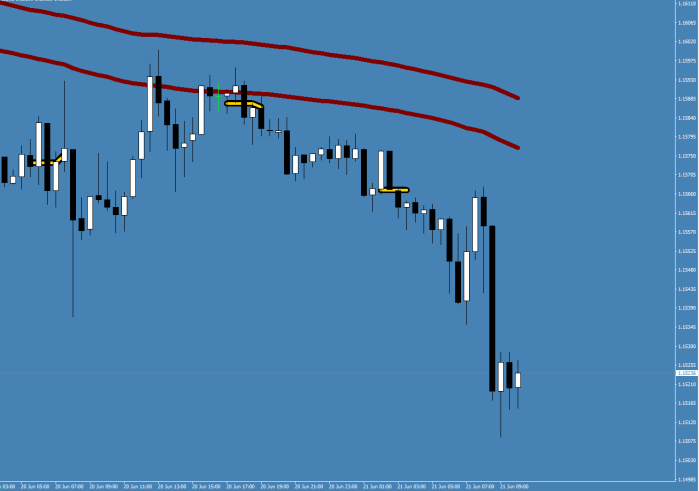
The speed of the market, thus the beginning of a “market day” has no relationship to the regular day cycles or session times.

The market day starts when a foundation is made.

EUR1068

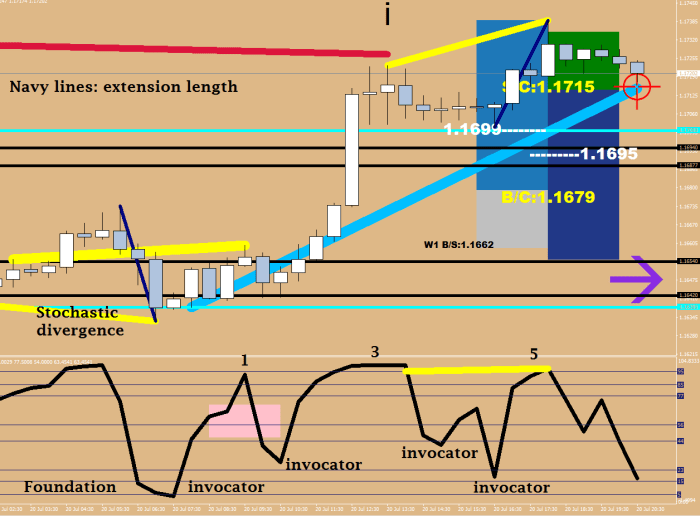
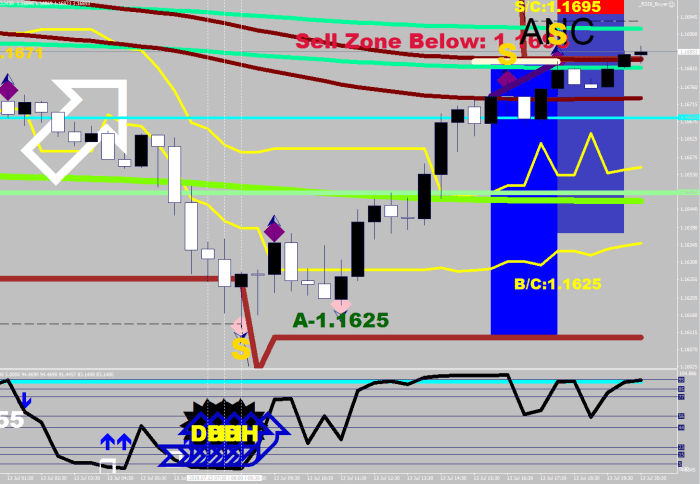
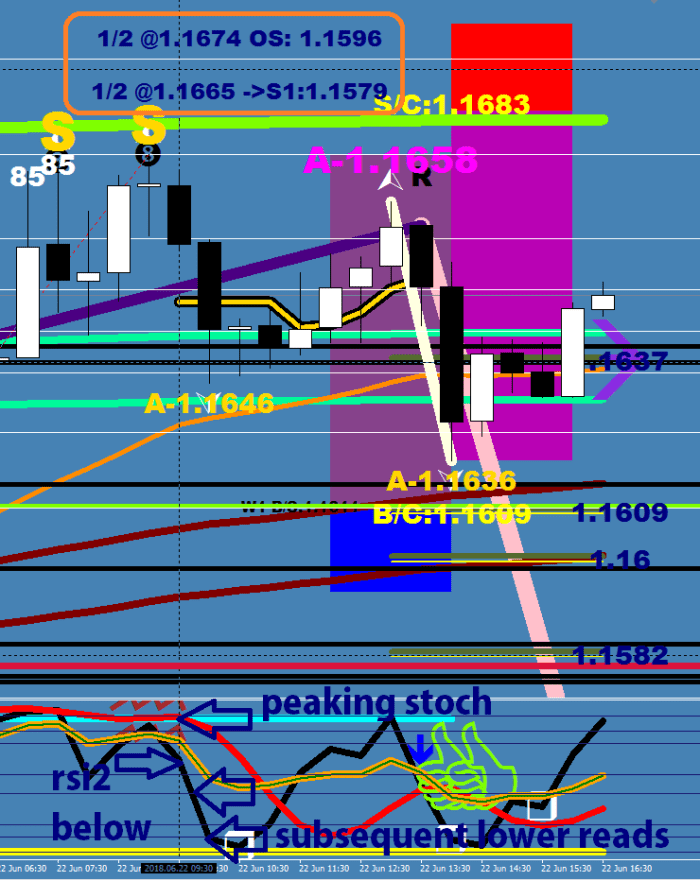
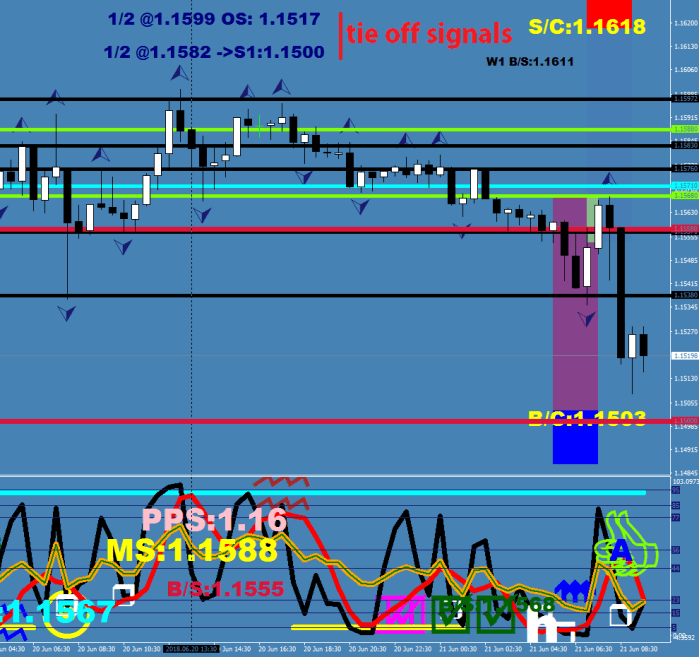
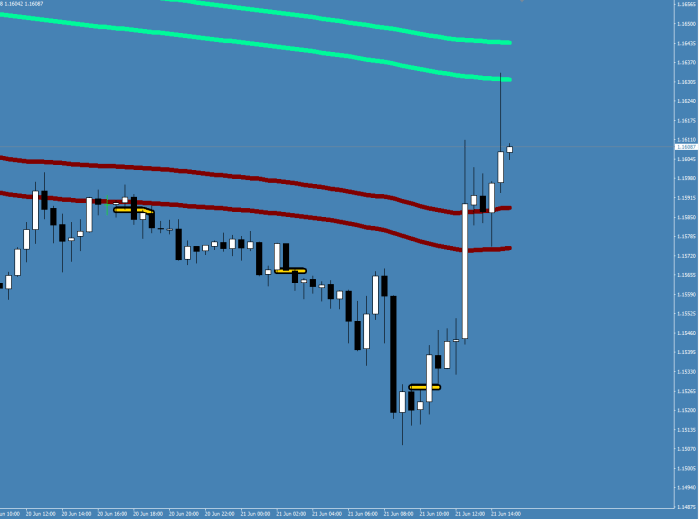
RSI2 on the 30 minute is a handy tool for measuring what I call “local” overbought/oversold. This high speed tool is basically measuring things that are happening in the 7.5 minute world.

When a Foundation is made, which I would put somewhere below an RSI2 “5” reading on the oversold scale, the day starts.

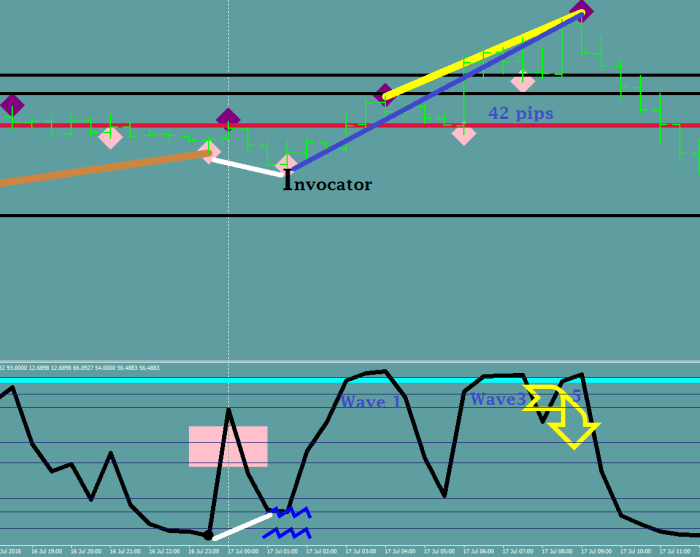
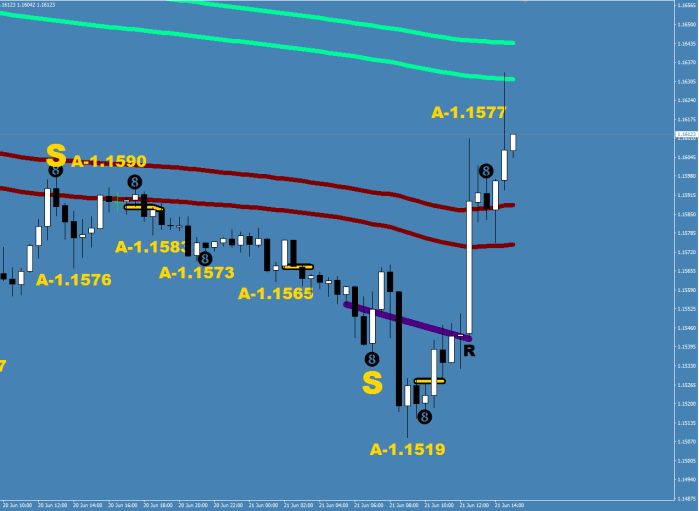
The day start is also an invocator, of course, but later on there may be other invocators showing up, that all have the potential to end the move most likely with a terminal/extension length wave coming out of them.

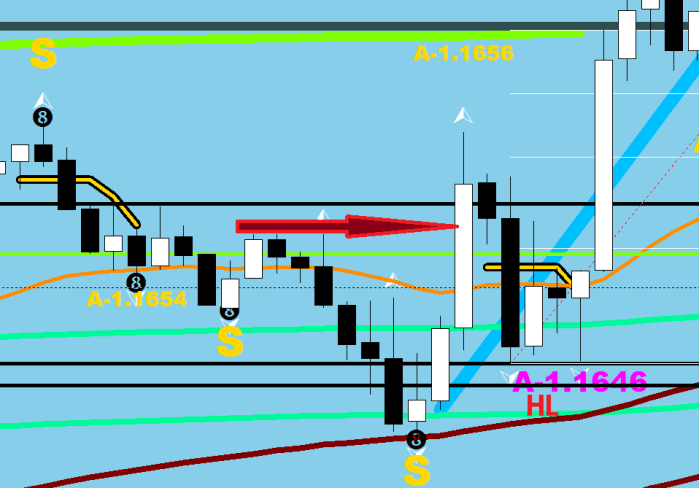
I would consider any RSI2 down pointing triangle an invocator as long as the HL2 RSI2 shows a value below 44 on the long side.

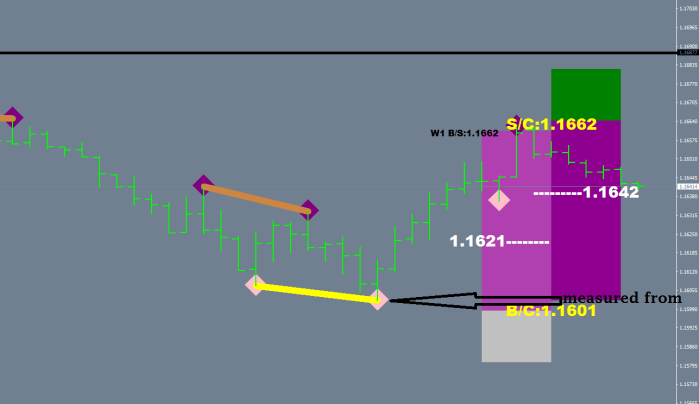
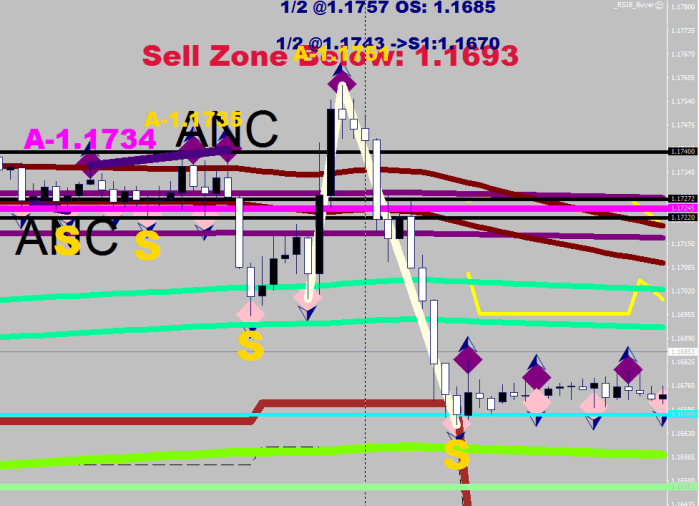
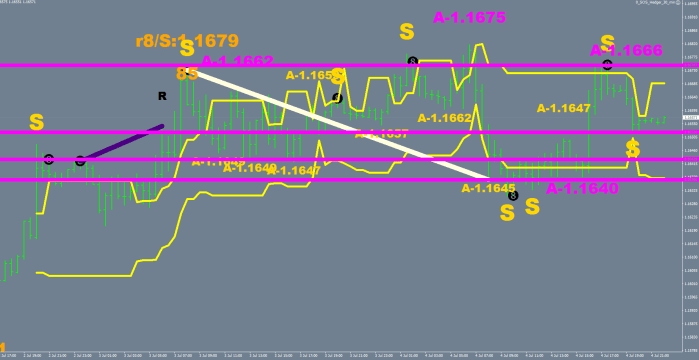
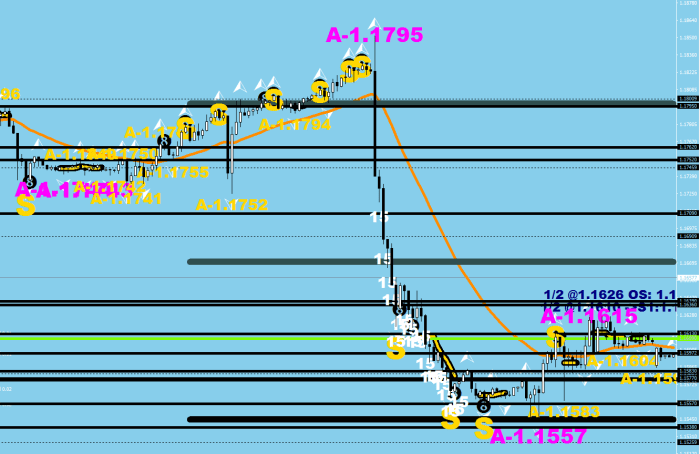
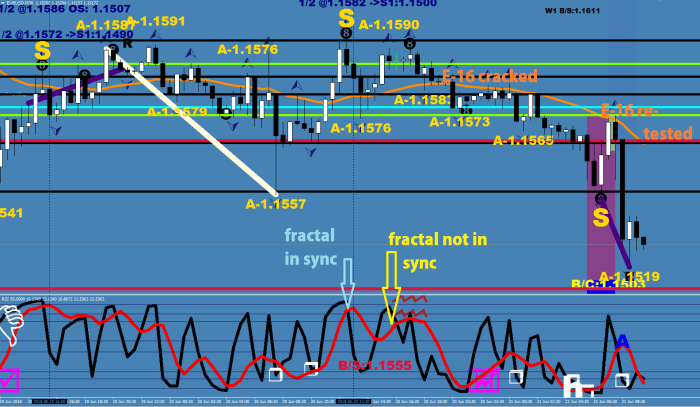
Therefore, I need to make an adjustment to the projection boxes and values.

EUR1069

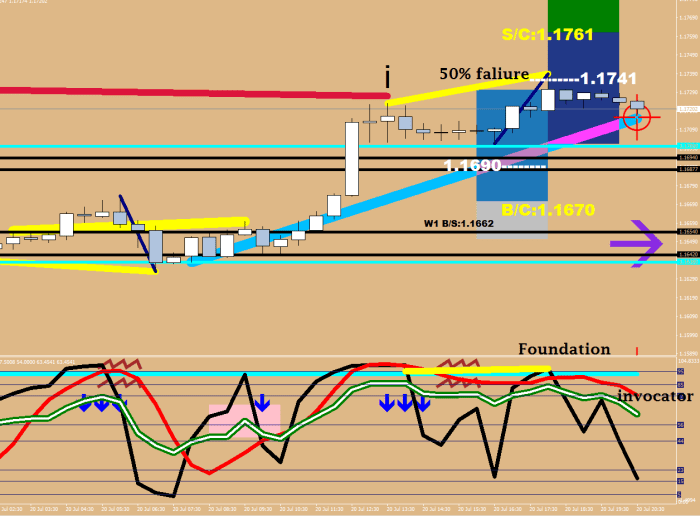
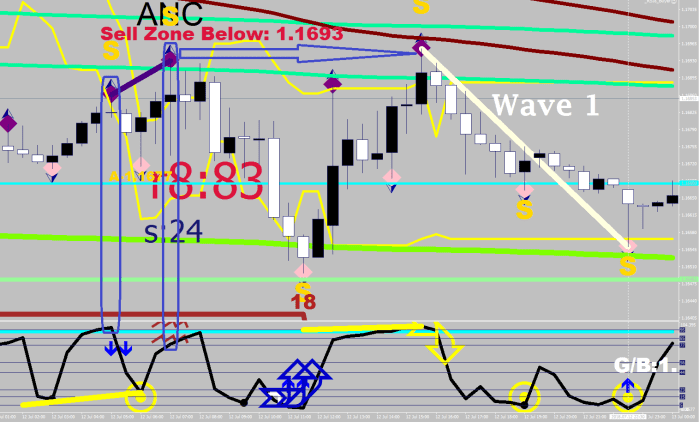
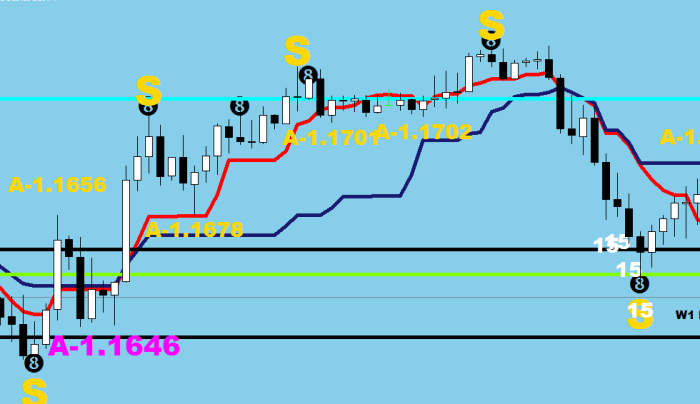
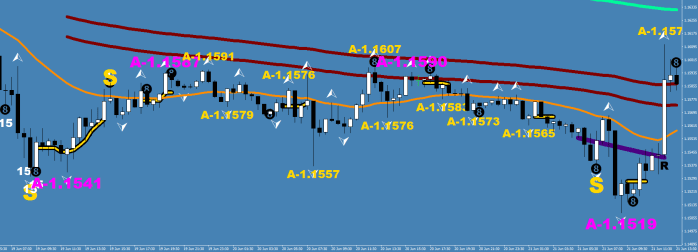
Now, that the boxes are aligned properly, you can see, that there was a 50% failure (white dash & value). Furthermore, you can see that a new day has started to the downside that had a foundation made at that value, and has progressed to make a new invocation that had 1.1730 as its starting point and with the statistical values projected 50% at 1.1690 and ATR oversold starting at 1.1670.

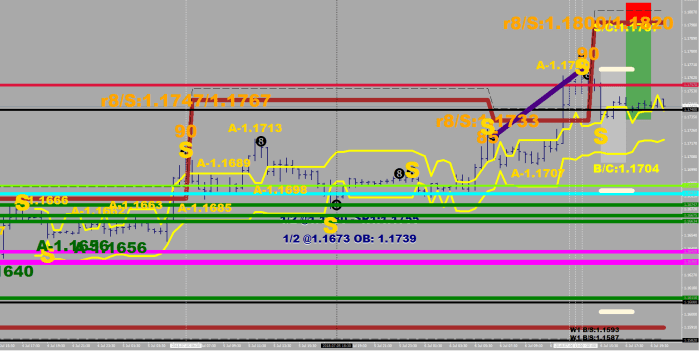
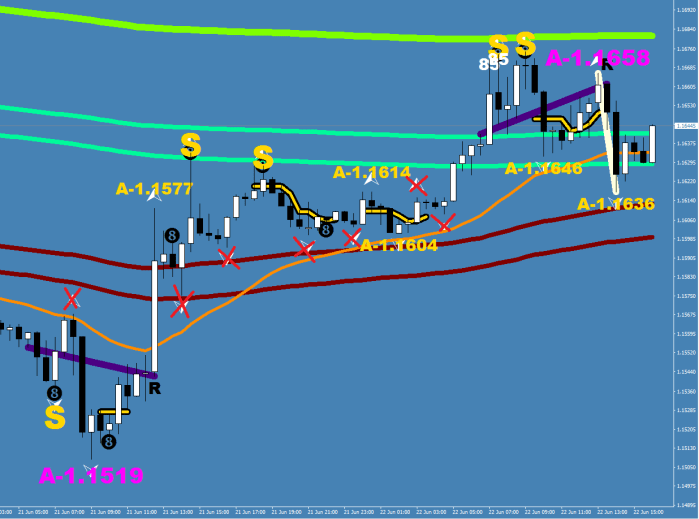
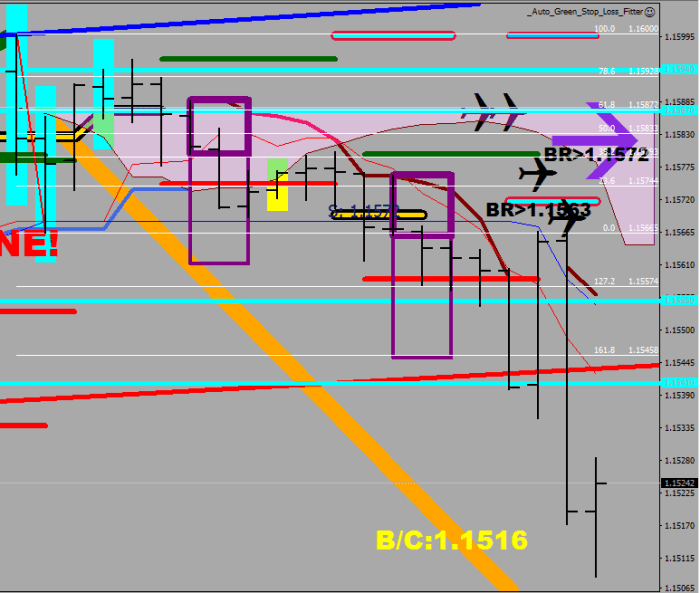
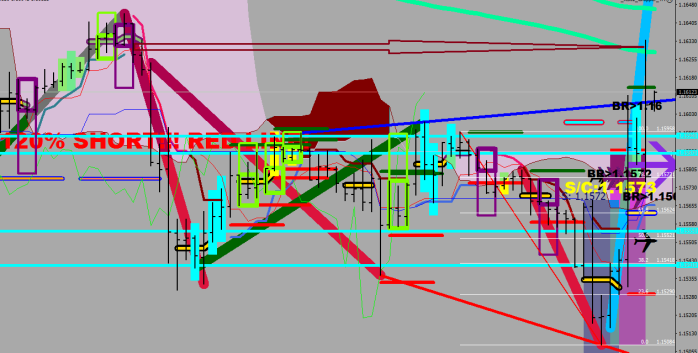
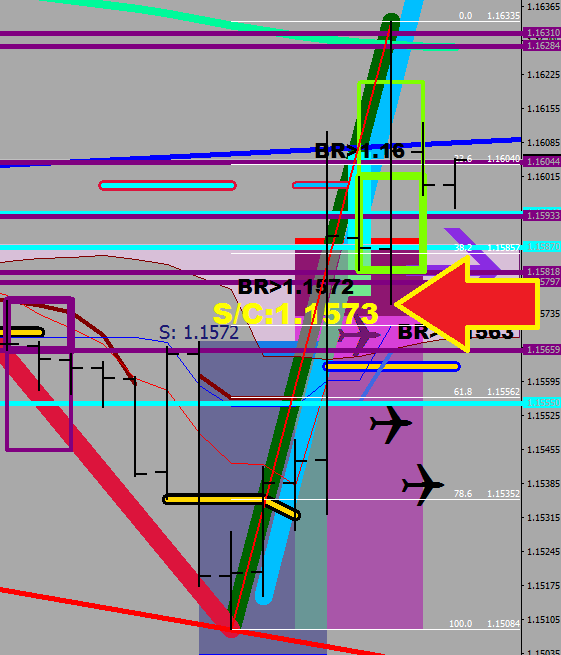
A full tank move downwards would put the price at a back test of the Wave 1 Live / Die area. There would be a bounce or continuation coming from about 10 pips below the printed value, which, as you can see basically would be the end of the last 15-minute consolidation, marked by my 15-min ATR projection arrow in indigo.

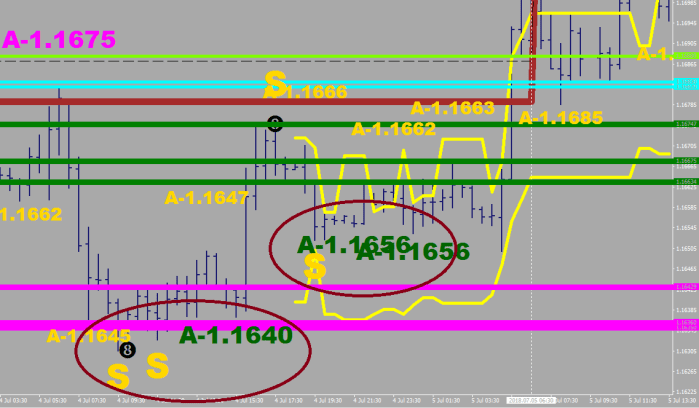
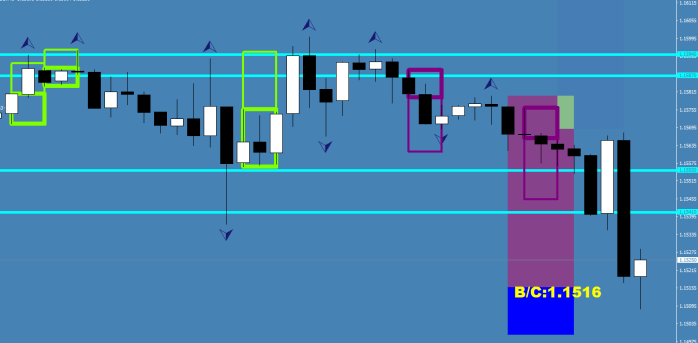
The rectangles in this

_divergencepetr_s6

work with the EUR/USD statistical, 80 pips tank, so don’t use it with any other pair.

How Does The Market Move

This article would be sure to make it to my future book.


How does the market move?

In relation to the pair of EUR/USD (for the sake of an example) the following things apply.

There is a FUEL TANK, also known as Statistical 3-DAY ATR. By statistical, I mean the following: if you keep track of the 3-day average with this pair, you would find that it is almost always around 80 pips. How is this possible, when sometimes there are 130+ pips days are in the sample period?

First, if you have a large range day, the next day would most likely be a tight consolidation range – these two almost cancel each other out when averaged.

There is of course more to this. There are different speeds to the market, and when you have a daily range way above 100 pips, it is most likely because of the speed of progression and the arbitrary, self-imposed day separating marks are not fully compatible. In other words, you just witnessed “2 days’ worth of a move counted as one.” Dividing four days sample with 3 would get you the wrong result.

This is why instead of measuring you should have the statistical figures at hand.

The market has two sizes for a swing.

40-44 pips is a “Small break” = Extension Length = Move May be Terminal, watch for a reversal!

60-66 pips is a “Large break” = Progression Length = 100% retracement is not likely =

EUR1057

The extension move is half gas, a quasi, failed break. It uses up 50% of the statistical fuel, therefore you should encounter resistance / find your reversal taking place at this, statistical extension resistance level.

The progression move is a move that sticks. It starts from the ignition point and uses up 80% of the statistical fuel, therefore at 80% of the tank is where you should encounter the statistical, progression resistance, that should prompt a consolidation, that would be taking place in a shape of a fluctuation range or a flag.

In the case of the EUR/USD, a 30-32 pips range is considered a “fluctuation”. Without going into details, I suggest you to start paying attention to the behaviour around the shadow of the market, the 26-sample pivot, the Kijun-sen. You would find that when it is flat, the market is not likely to separate from its shadow by more than 16 pips on either side – this is the size of the fluctuation range.

People use those statistical support and resistance lines that you must have encountered. The idea is there: different size building blocks – with different meaning associated. I’m not sure about their precision when they are hooked on daily closes?! The ranges are brought about from the invocation points, like I showed you. The least important piece of information is the daily close – a random point in time. It is always the high, the low and the halfway distance that matters, and so you should set all of your oscillators on these values, not the closes.

The following image shows the Invocator, the starting point for the extension move, which means of course the terminal one. Once the invocator point was in place, you could had measured the distance and place your sell limits 40 pips above, right? You can even see that there were 3 pushes up (5 waves and 40 pips progress could give you even more confidence), although the second fractal did not appear on the 30 minute chart: a speed issue.

EUR1058

Now you can finally appreciate my rectangle measurements that are being plotted on my charts.

EUR1060

Anchorage

Basically you are doing two things wrong currently.

The good news is that I can help you with both of them.


One is not getting the exit right.

You need to minimize human interaction to be successful. You may need to leave one side to be handled by the programs entirely.

The following is one of the most advanced piece of software I have.

This cropper has directional logic fitted derived from RSI8 projections and even monitors for the behavior of the Green River and Mr. Maroon. It adjusts the 30-min RSI8 cross-back-crop value based on the direction it figures, and only closes out positions that are in gains by at least 10 pips.

It was of course invented with EUR/USD being the test subject.

_RSI8_Cropper

I would go into details of the code in my book, that may be as far as a year out from this point in time.


The second thing is the entry, the “Anchorage”. Sometimes I think of it as a lift call button: “we want to go down now” – they pressed the button.

It is basically a telltale sign of an initial buy/sell having taken place.

You compare 30-minute fractals on one side to find an RSI2 divergence (i.e. higher high with a lower RSI2 reading).

This condition sets the area beyond the divergence block to be the greatest entry area.

EUR1048

(The yellow and blue ribbon arrows are plots from the directional logic.)

The off white swing line down is the wave1 that comes from outside the Anchorage.

Would I write an automated trading routine based on  the Anchorage? You bet I would.

EUR1049

Overall, I wanted to get your thinking to start down the path of “the condition projects the level” rather than trying to guess a line based on fancy.

EUR1050

“This was a clash…”

The Perforation

To turn my RSI8 system into a truly mechanical one, I now plot the lines and have a perforation margin as well, 8 pips away. The perforation should not be violated or you must reverse your direction.

As part of the system, you can instate rules such as a new high/low read sets a new break out point.

Such a reset happened on Friday, and was overrun the same day – and even back tested later on.

EUR1038

Basically, if you were long already, you simply had to stay long. There are only three things that can reverse the price back down now:

1. Another 82+ reading, that sets the  RSI limit (and the perforation), and later price makes it into this field with an RSI, that is out of overbought (<77).

2. Price makes a run for it, it tags the 1.18-1.1820 current sell field, and RSI does not get overbought (<77).

3. The opposite of the following picture happens: you start getting Sync-Async sequences, but on the upside.

EUR1039

Currently I only call Async highs qualified if they are at least 6, but not more than 10 bars away from the Sync high.

As for perforation in my life, just yesterday I decided on wanting to write a book on computer aided trading.


Computer Aided Trading

Welcome to the ERA of the Hybrid trading, dear reader. There is a never ending quest of finding new edges to boost bottom lines. We, the sole traders are starting to use computers in a more active manner, we entrust more and more of the decisions to programs for we have come to know intimately, that we are very limited in our abilities.

The programs are there when you cannot be, they can interact instead of you, and if they are set right, they can prevent losses or make gains on their own initiative.

There is one more thing that seldom anybody talks about: the advantage of making automated trading routines is that it is an active conversation, where you, the programmer would end up improving in skills, you would be able to find many of your own personality flaws, and your thinking would be stimulated into fining treasure mode.

RSI8

EUR1030

I implemented my ideas of peak and bottom RSI undercuts today in the form of plots, as follows:

for (i = 500 ; i >= 0; i–) {
if(RSI8[i+1]>highrsi && RSI8[i]<highrsi && iFractals(Symbol(),0,MODE_UPPER,i+1) ){
ObjectCreate(“txr 30″+High[i+1], OBJ_TEXT, 0, Time[i+1], High[i+1]+.0003);
ObjectSetText(“txr 30″+High[i+1], “85”, 32, “Arial Black”, Orange);

ObjectCreate(“txr 30″+High[i], OBJ_TEXT, 0, Time[i+1], High[i+1]+.0014);
ObjectSetText(“txr 30″+High[i], “r8/S:”+DoubleToStr(NormalizeDouble(High[i+1]+60*Point,5),4), 32, “Arial Black”, Orange);
}

if(RSI8[i+1]>highrsi+5 && RSI8[i]<highrsi+5 ){
ObjectCreate(“txr 30″+High[i+1], OBJ_TEXT, 0, Time[i+1], High[i+1]+.0023);
ObjectSetText(“txr 30″+High[i+1], “90”, 32, “Arial Black”, Orange);

ObjectCreate(“txr 30″+High[i], OBJ_TEXT, 0, Time[i+1], High[i+1]+.0054);
ObjectSetText(“txr 30″+High[i], “r8/S:”+DoubleToStr(NormalizeDouble(High[i+1]+360*Point,5),4), 32, “Arial Black”, Orange);
}

if(RSI8[i+1]<lowrsi && RSI8[i]>lowrsi && iFractals(Symbol(),0,MODE_LOWER,i+1) ){
ObjectCreate(“txr 30″+Low[i+1], OBJ_TEXT, 0, Time[i+1], Low[i+1]-.0003);
ObjectSetText(“txr 30″+Low[i+1], “15”, 32, “Arial Black”, Orange);

ObjectCreate(“txr 30″+Low[i], OBJ_TEXT, 0, Time[i+1], Low[i+1]-.0014);
ObjectSetText(“txr 30″+Low[i], “r8/B:”+DoubleToStr(NormalizeDouble(Low[i+1]-60*Point,5),4), 32, “Arial Black”, Orange);

}

if(RSI8[i+1]<lowrsi-5 && RSI8[i]>lowrsi-5 ){
ObjectCreate(“txr 30″+Low[i+1], OBJ_TEXT, 0, Time[i+1], Low[i+1]-.0003);
ObjectSetText(“txr 30″+Low[i+1], “10”, 32, “Arial Black”, Orange);

ObjectCreate(“txr 30″+Low[i], OBJ_TEXT, 0, Time[i+1], Low[i+1]-.0014);
ObjectSetText(“txr 30″+Low[i], “r8/B:”+DoubleToStr(NormalizeDouble(Low[i+1]-120*Point,5),4), 32, “Arial Black”, Orange);

}

}

EUR1031

where lowrsi is 15, highrsi is 82

The Kijun-sen Experiment

26 sample… The industry standard.

True Blue = Kijun-sen

Yellow bands – 5 pips away in trending mode, 16 pips away when flat lining – see code below.

Once you find the fake out, it is easy to take a ride with simple set of rules. The most basic one is: until price gets back on the same side again.

EUR1014

The second thing you can do is to count the violations back into the field after price went outside. This can take you closer to maximum gains.

EUR1015

Could we assume that the third touch would come with a crack, and price is in a wave 5 up?

EUR1016

One more thing. People think of head and shoulders patterns as picture perfect things with neckline and all. Totally wrong. The magenta “A-1561” print on the bottom was a right shoulder. The two bottom “S” prints are the left shoulder and the head. If you held shorts and wanted to take profits, the undercut of the first “S”ync candle’s low was the perfect place – the undercut of the last “below 15” RSI8 reading, and the number would had been a guess. 10-12 would had worked this time. Other times there is 15 pips or more. The point is, this would had been done as an anticipation, and sometimes this would mean missing out on a continuation.

Now, closing shorts and going long are two different things. When the “A”sync low was printed, you had – in this instance – 9 hours to build a long position at & below 1.1561.

Good eye, Suthmo for finding the reversal.


for (i = 300 ; i >= 0; i–) {
if ((iHigh(Symbol(),0,iHighest(Symbol(),0,MODE_HIGH,26,i))+iLow(Symbol(),0,iLowest(Symbol(),0,MODE_LOW,26,i)))/2==(iHigh(Symbol(),0,iHighest(Symbol(),0,MODE_HIGH,9,i))+iLow(Symbol(),0,iLowest(Symbol(),0,MODE_LOW,9,i)))/2) {Kijun_Plus[i]=(iHigh(Symbol(),0,iHighest(Symbol(),0,MODE_HIGH,26,i))+iLow(Symbol(),0,iLowest(Symbol(),0,MODE_LOW,26,i)))/2+.0016; Kijun_Minus[i]=(iHigh(Symbol(),0,iHighest(Symbol(),0,MODE_HIGH,26,i))+iLow(Symbol(),0,iLowest(Symbol(),0,MODE_LOW,26,i)))/2-.0016;}
else if ((iHigh(Symbol(),0,iHighest(Symbol(),0,MODE_HIGH,26,i))+iLow(Symbol(),0,iLowest(Symbol(),0,MODE_LOW,26,i)))/2==(iHigh(Symbol(),0,iHighest(Symbol(),0,MODE_HIGH,26,i+2))+iLow(Symbol(),0,iLowest(Symbol(),0,MODE_LOW,26,i+2)))/2) {Kijun_Plus[i]=(iHigh(Symbol(),0,iHighest(Symbol(),0,MODE_HIGH,26,i))+iLow(Symbol(),0,iLowest(Symbol(),0,MODE_LOW,26,i)))/2+.0016; Kijun_Minus[i]=(iHigh(Symbol(),0,iHighest(Symbol(),0,MODE_HIGH,26,i))+iLow(Symbol(),0,iLowest(Symbol(),0,MODE_LOW,26,i)))/2-.0016;}
else if (Close[i]< (iHigh(Symbol(),0,iHighest(Symbol(),0,MODE_HIGH,26,i))+iLow(Symbol(),0,iLowest(Symbol(),0,MODE_LOW,26,i)))/2) {Kijun_Plus[i]=(iHigh(Symbol(),0,iHighest(Symbol(),0,MODE_HIGH,26,i))+iLow(Symbol(),0,iLowest(Symbol(),0,MODE_LOW,26,i)))/2+.0015; Kijun_Minus[i]=(iHigh(Symbol(),0,iHighest(Symbol(),0,MODE_HIGH,26,i))+iLow(Symbol(),0,iLowest(Symbol(),0,MODE_LOW,26,i)))/2-.0005;}
else if (Close[i]> (iHigh(Symbol(),0,iHighest(Symbol(),0,MODE_HIGH,26,i))+iLow(Symbol(),0,iLowest(Symbol(),0,MODE_LOW,26,i)))/2) {Kijun_Plus[i]=(iHigh(Symbol(),0,iHighest(Symbol(),0,MODE_HIGH,26,i))+iLow(Symbol(),0,iLowest(Symbol(),0,MODE_LOW,26,i)))/2+.0005; Kijun_Minus[i]=(iHigh(Symbol(),0,iHighest(Symbol(),0,MODE_HIGH,26,i))+iLow(Symbol(),0,iLowest(Symbol(),0,MODE_LOW,26,i)))/2-.0015;}

}


When Volatility Dries Up

This mostly applies on the upside.

When you see the 3rd “Sync” swing high in a short period, chances are that you are in a wedge. There are 2 different shapes that can make price reverse. A head and shoulders and a wedge.

Fig. 1

EUR1002

3 “S” on the top – check. The red and the blue lines are standard Tenkan-sen and Kijun-sen (Ichimoku indicator).  Of course they lag a bit, but you can get the sense of the volatility just by looking at it. The wedge is over when the Kijun-sen gets volated. You should go short just below it.

Fig. 2

EUR1003

3 “S” check. Break below Kijun-sen, perfect.

Fig. 3

EUR1004

This one shows why you should not try to guess the top, and only go short upon the blue line’s break. (After the 3rd “S” of course).


Lessons in S-A Sequence

Do you have any N-Sync jokes? I can’t think of a single one.

sas

After the second S, the break of the swing low starts the selling with A-Sync appearing as a lower high.

sas01

After the second S, the break of the swing high starts the buying with A-Sync appearing as a higher low.

sas02

Recap

Not every fractal matters.

EUR992

Not every A-sync Fractal would resist, only those following a Sync fractal closely.

EUR994

Async points should not be violated. The weight of the 30 minute candle is where you may be able to get in.

EUR993

A tie off is when price leaving a swing point in a hurry (1H+ drop/rise).

EUR995

To maximize your potential, you must travel. These indications help you finding the turns.

The priority flips when they manage to push the price over the Green River by more than 40 pips (Guard Rail – Chartreuse thick) with opposing configuration (Mr. Maroon on the other side.)

EUR997

I am a traveller.
My harbors are the Sync-Async sequences not exceeding 10(U)/12(D) candles in between them.

I am looking for
– a short entry above the E16
– a long entry below the E16

1001 Ways of Finding The Trade

There are actually countless ways to get to the same conclusion.

Here I would show a few to help you out.

Since you know the configuration, which is bearish (Green River above Mr. Maroon – see Lema 30), you are looking for a short trade.

The secon piece of information is where your target would be.

This can be derived from the daily ATR.

80% of the ATR would put price at an ATR oversold level from a swing high.

EUR980

The shaded rectangle shows such measurement. The swing high is the fractal cap right before the fall. The oversold neckline is where the blue line starts – and is accented with a B/C yellow value (B/C = buy to cover). An undercut of this would be your Target 1.

The third piece you need is finding an entry signal.

The above image has show hollow rectangles to show possible entry levels based on 1h inside bars. The break of the inside low (say by 1 pip) could be utilized as an entry. Or, when price back tests these break-down points.

If you were trying to get by my provided signals, you could have entered 1/2 position based off the tie off signal and/or could had opened a short based on the Maroon Sell signal (MS).

EUR981

We are on my favorite 30 minute chart now.

On the action movie chart below, the following things apply:

EUR982

The Sync fractal high (where RSI2 and Stoch10 were both in the overbought), everything was legit. The following fractal high was Async: the RSI2 went deeply overbought while the stoch stayed out of the overbought field. The “A-” plot comes with the weight of the prompting candle.

The Sync / Async sequence took place above E16 (in orange). When the crack happened, you had a verified break down.

E16 could had been utilized for a secondary entry after price was below it for 10 samples and re-approcahed it in a rapid manner.

Keep in mind, the Exit1 of the short position barely changed. If you look at the tie-off prompt on the left, Exit1 was as low as 1.1509 and it only moved to 1.1503 with the last fractal high.

Other signals that could had been utilized:

  • the white, wave 1 movement down clarified the direction after crossing the root point.
  • price was stalling out at MR. Maroon
  • price crossed below the 1H cloud
  • there were a number of cyan shaded professional volume activity 1H candles around the 1.16 level

EUR979

What signals were in line that you follow?

EUR983

…and the extra lesson after the press release…

EUR984

  1. Always evaluate a Sync-Async sequence

EUR985

As soon as you have the Async weight purchased, target the Green River or… Look up the breakdown that may be the resistance on the way up.

EUR986

Also, please pay attention on the pullback staying in the overbought field:

EUR987