One Way Ticket to Ride

I know, people call all kinds of things Support and Resistance.

But there is one thing that matters above all: the Green River Monster.

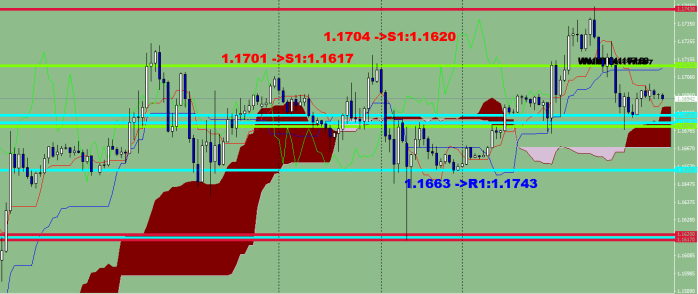
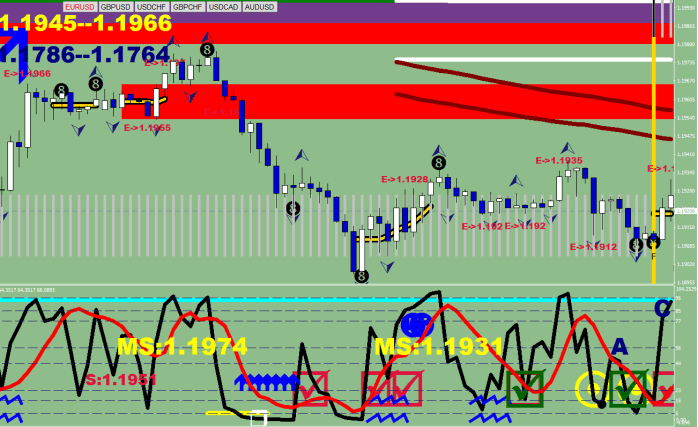
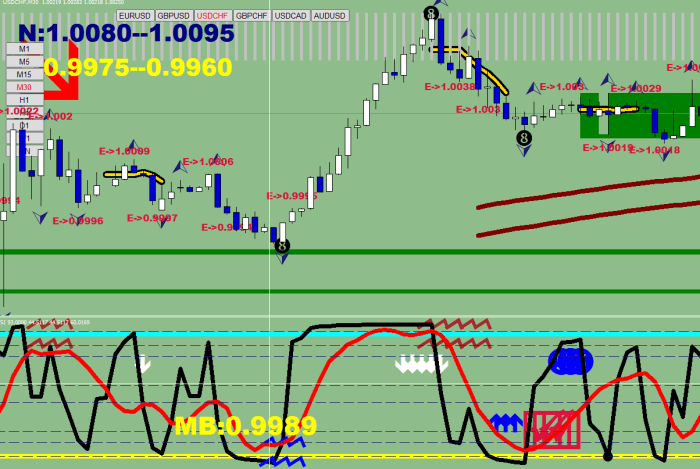
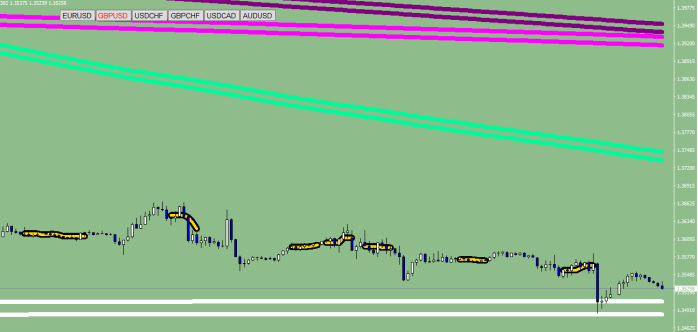
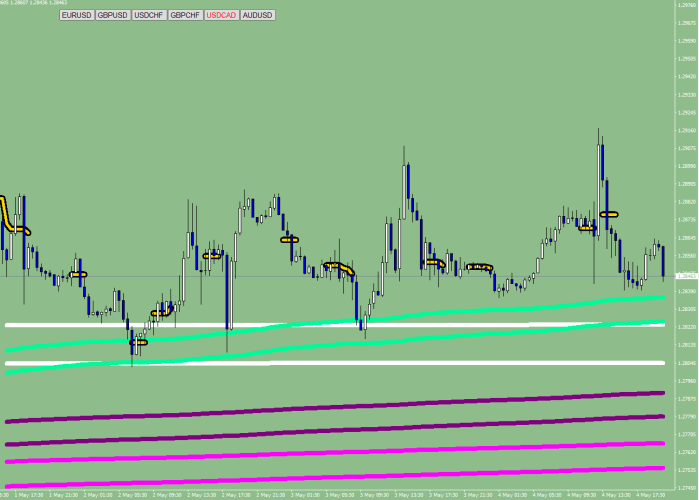
Here is the systematic destruction of the support: there is one level below the lower line of the River and there is another one 30 pips lower. Velocity took care of the latter one.

EUR961

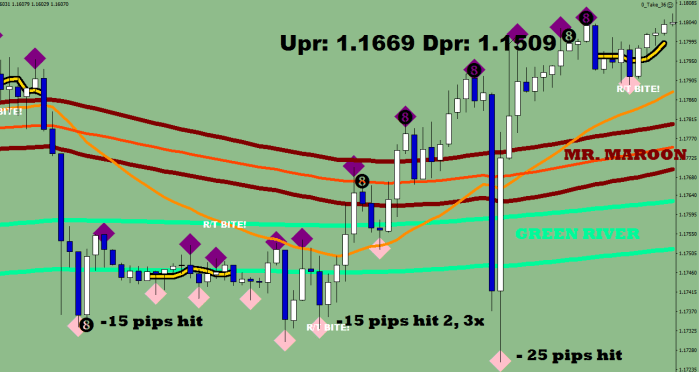
MR. MAROON and the GREEN RIVER are part of my LEMA 30 package. So is the 1H LEMA.

EUR964

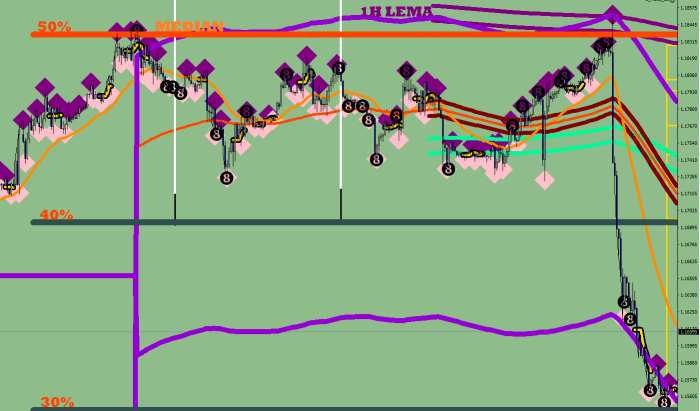
As for the MEDIAN, that the 20% single day sell-off started from can be displayed by my 4H Comfort levels.

That’s two different tools for spotting the obstacle.

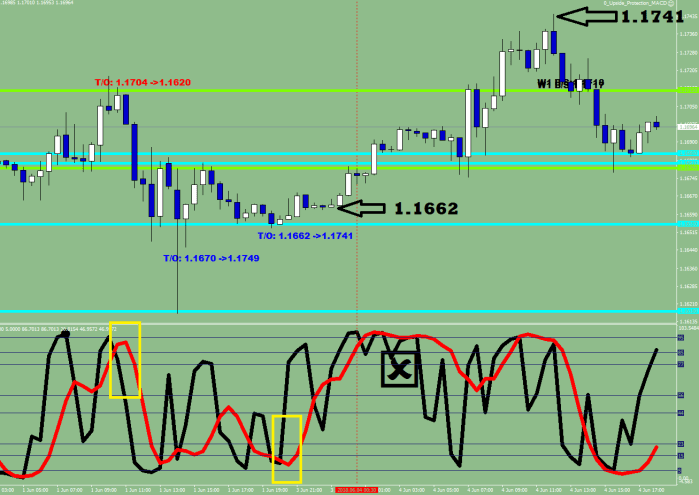
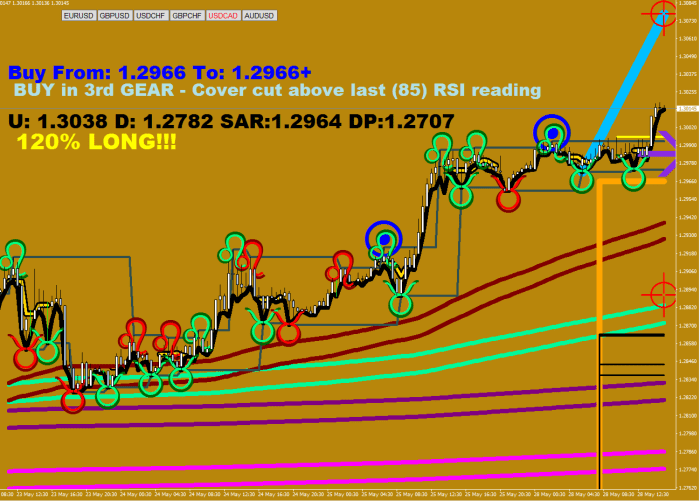
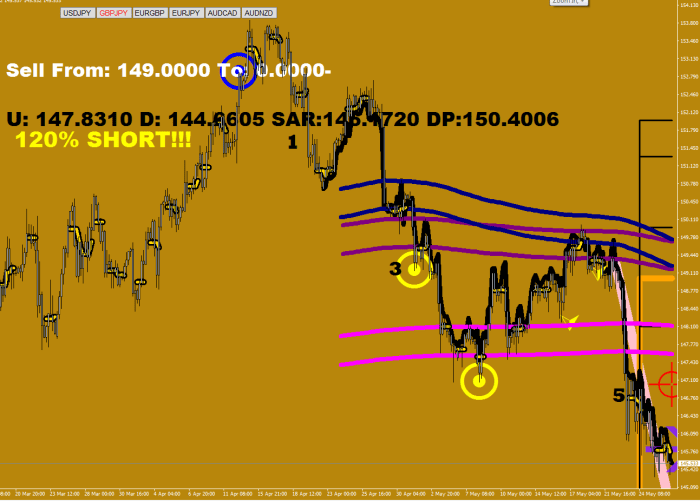
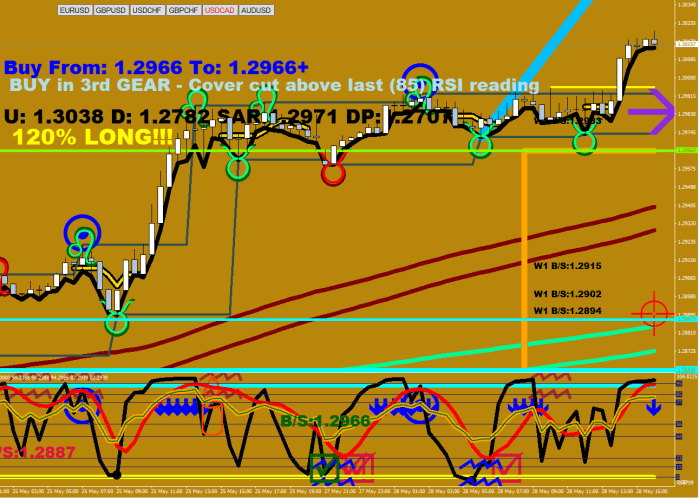
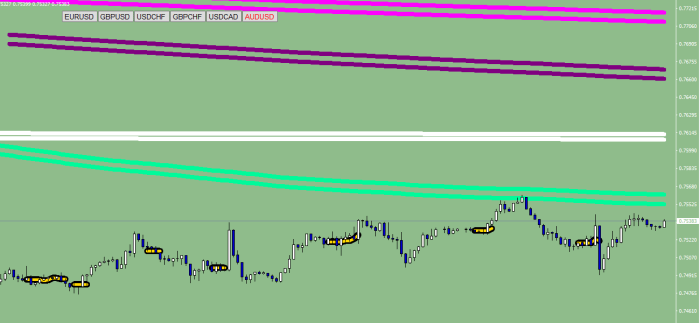
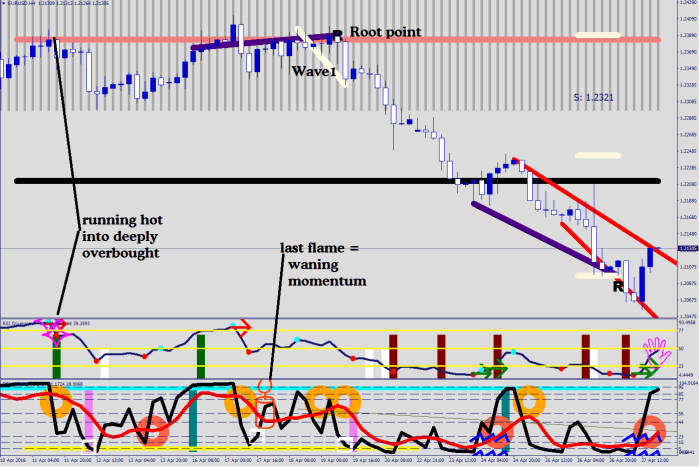
Now, how can you be prepared for such a move, how could you have seen it coming from a 110% bullish configuration?

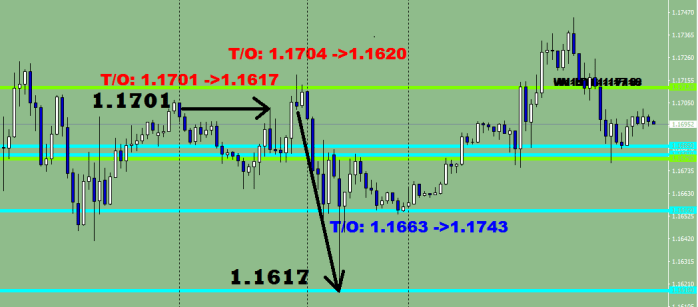
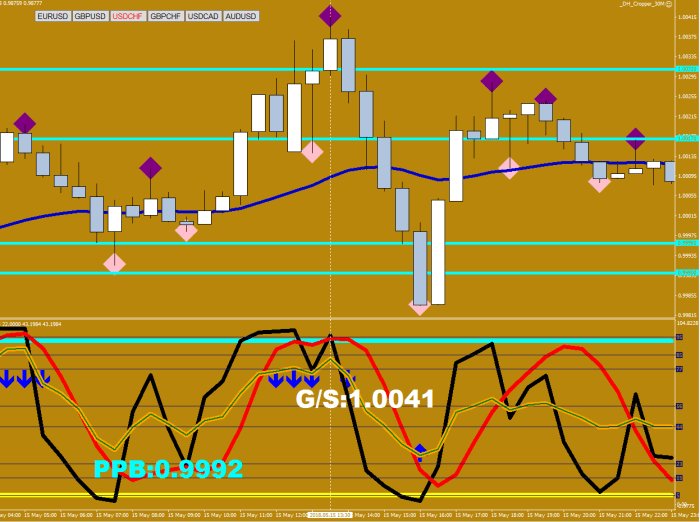
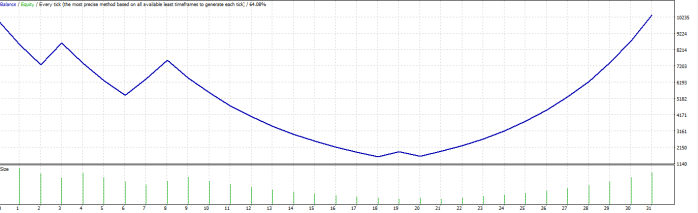
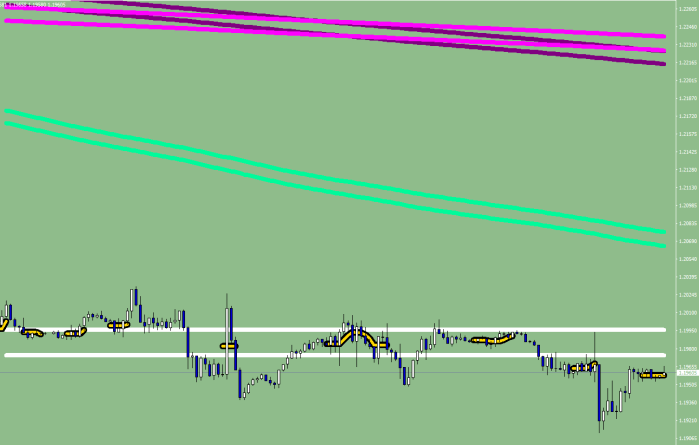
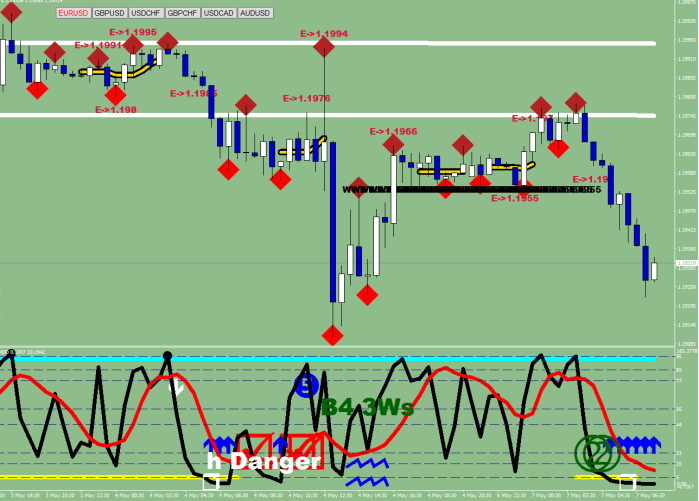
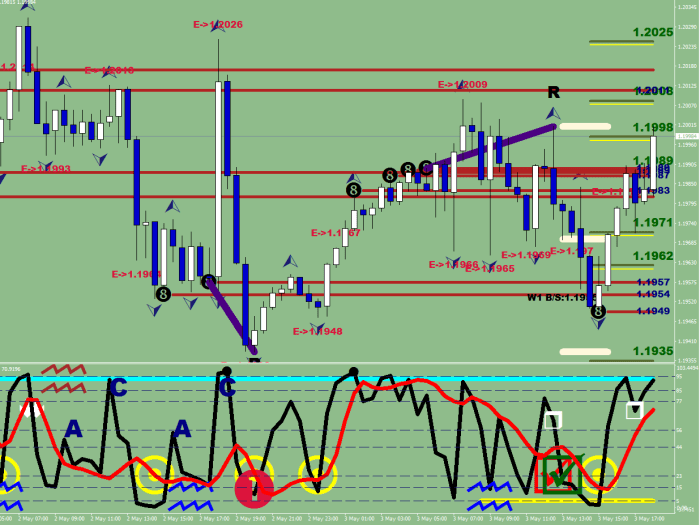
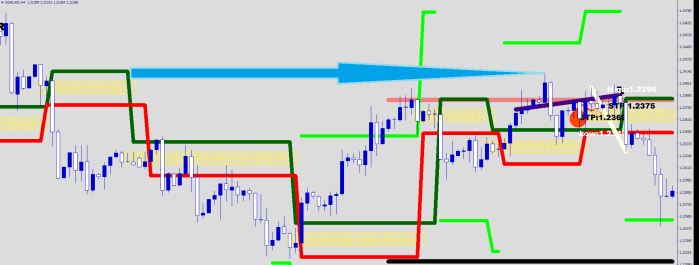
Go back to image 1, and see how the buy stops were cleared away below the Green River with the multiple visits.

EUR962

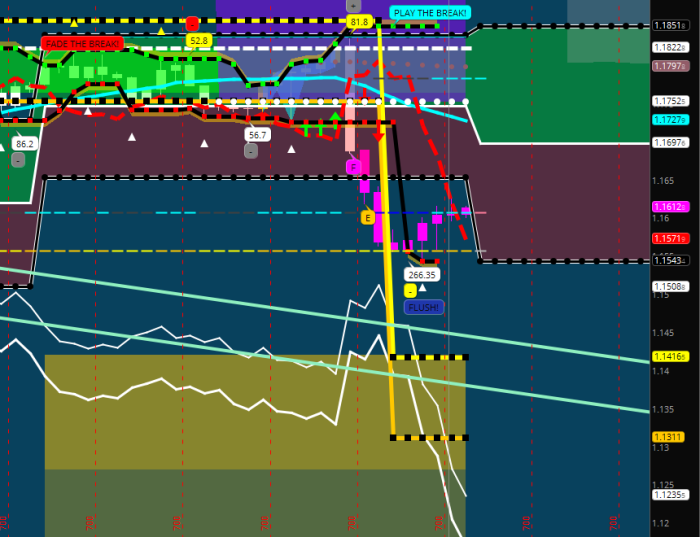
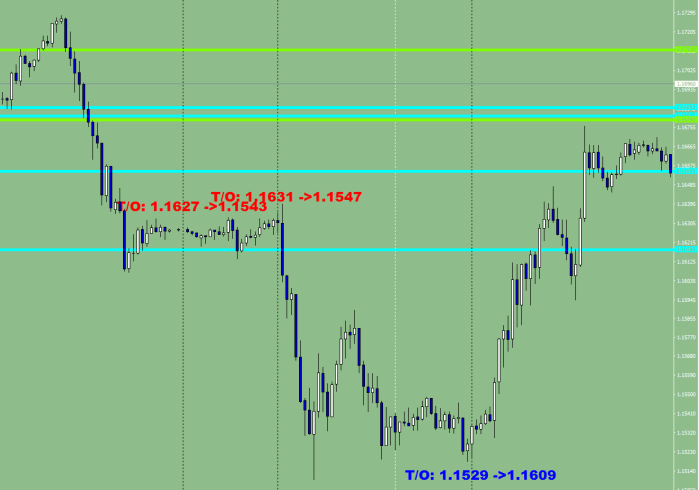
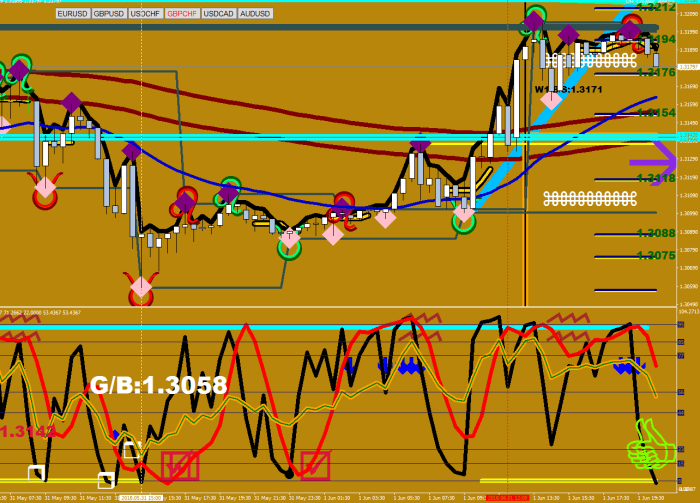
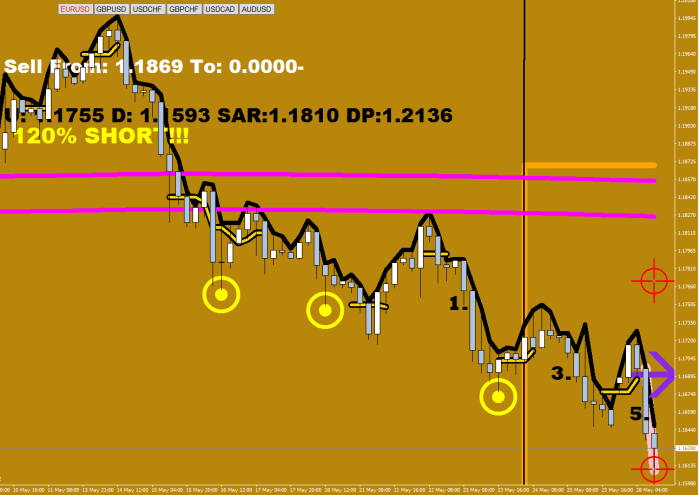
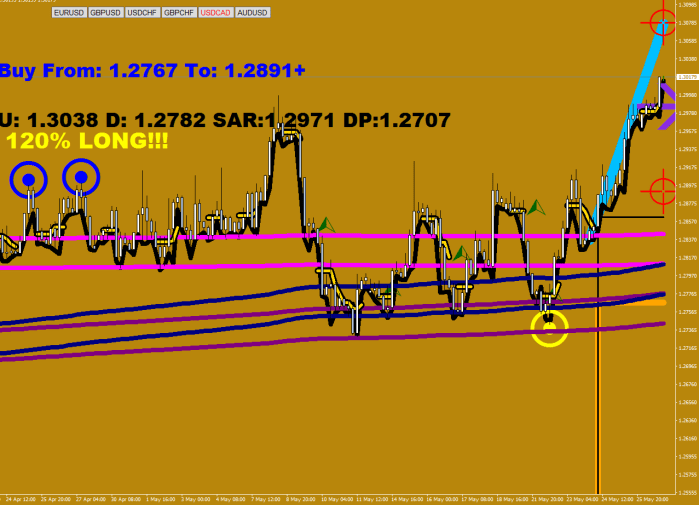
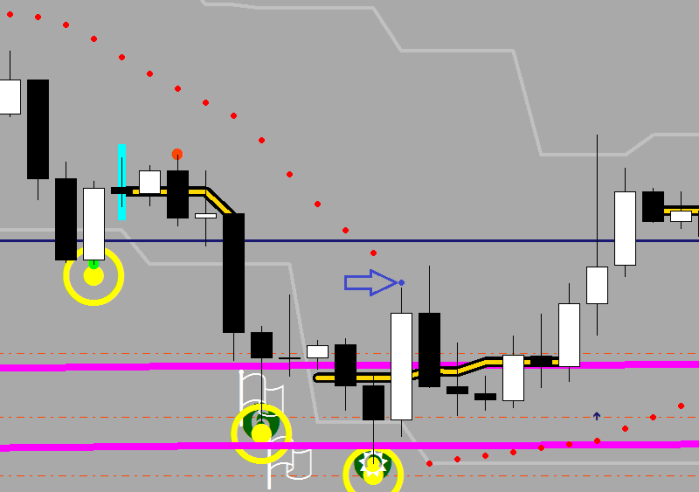
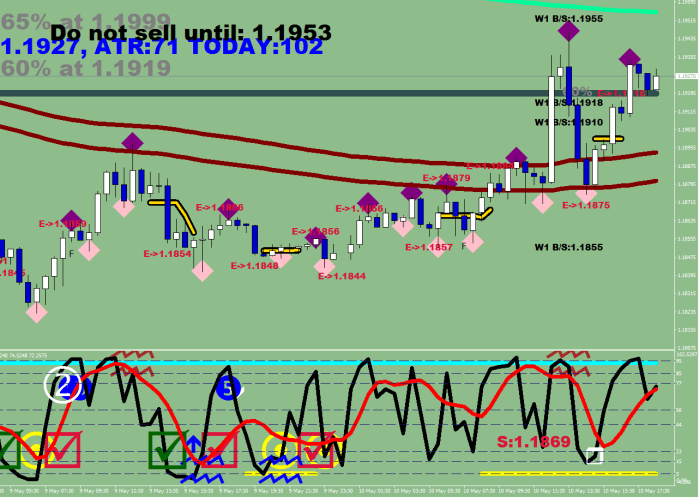
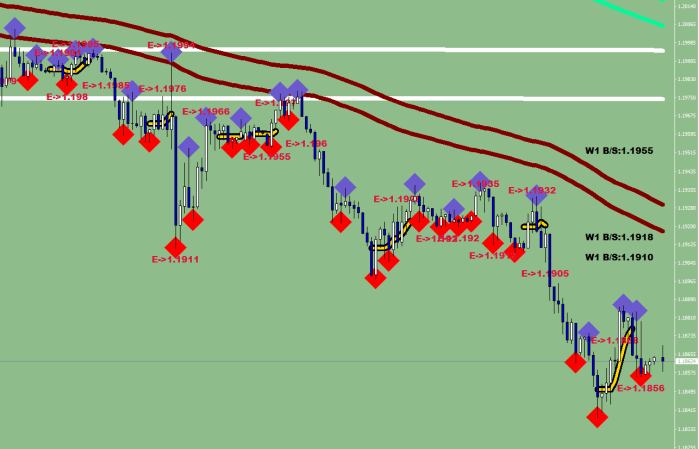
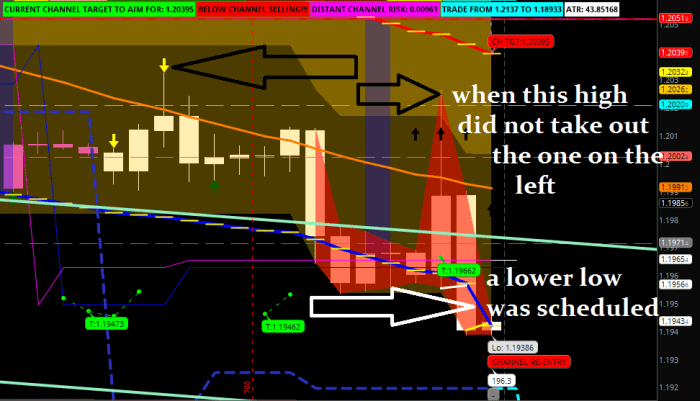
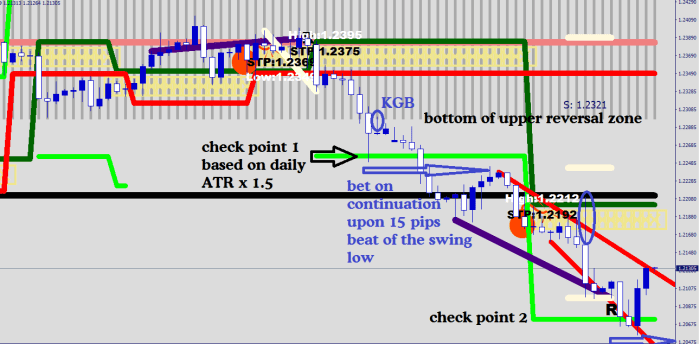
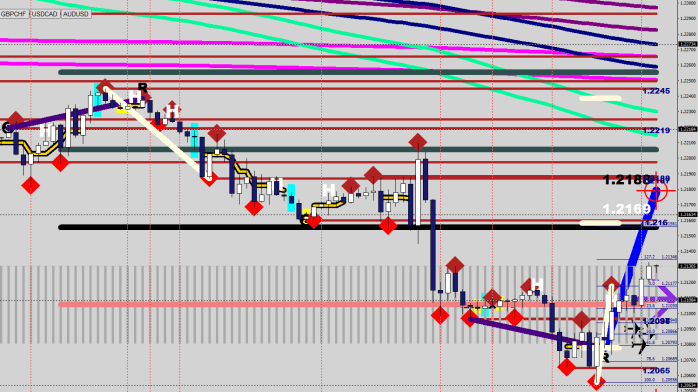
The add on point was 40 pips below the GREEN RIVER, which was at about 1.1710 at the time. The above image shows the taxi lines, the total discharge of the daily energy could carry the price to, and the two shaded rectangles below are the oversold (20%) and the deeply oversold (10%) comfort levels. Interesting fact that the taxi line was hit at 1.1851 right before the sell off. The white dots are the cycle support level, the yellow dash is a Market Maker support and the blue dash is Market Maker resistance. The light green channel is something the price have been playing catch up with.

How could you have known where to catch a falling knife? I know you did not know and I know you tried.

EUR963

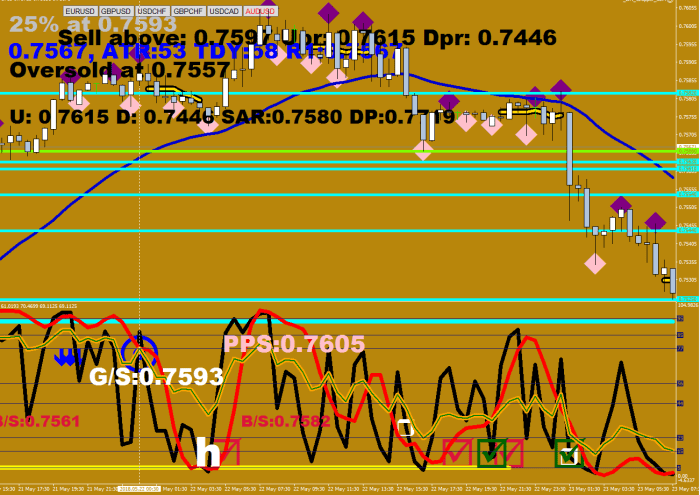
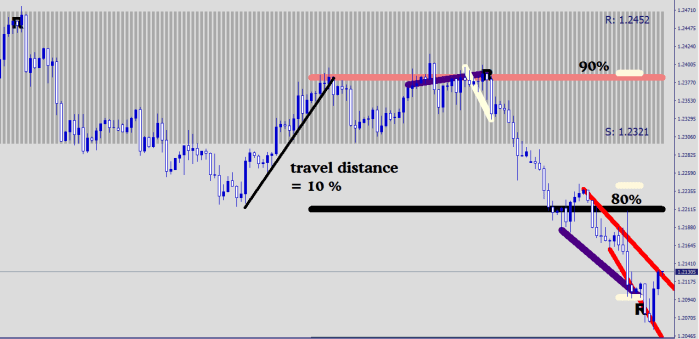
The yellow zigzag line is the Projected Lines UFO: the initial swing plus 50%. It put the price exactly at the Fund Manager 30% level, or 1.1555.

I know, it went a smidge lower. Price is currently teeter-tottering at the 1H deeply oversold neckline, and it should fall back despite of the UFO white line pointing at the 1.1650 extension.

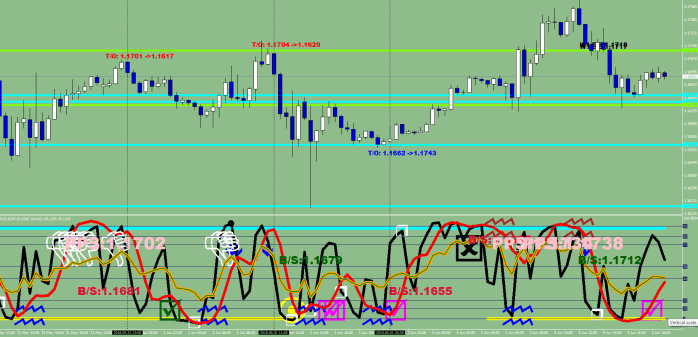
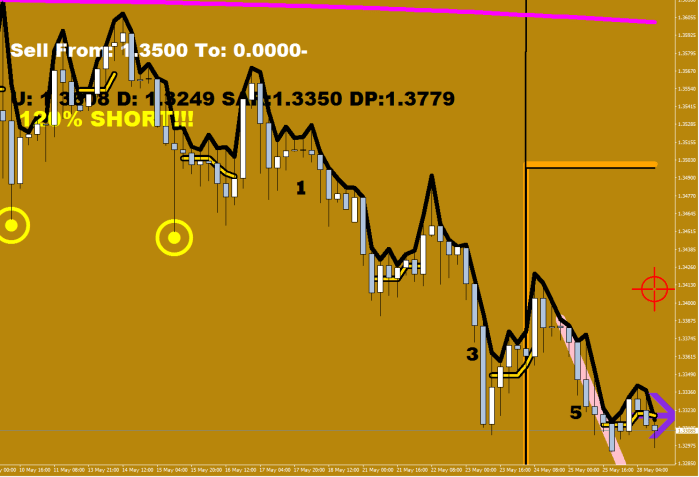
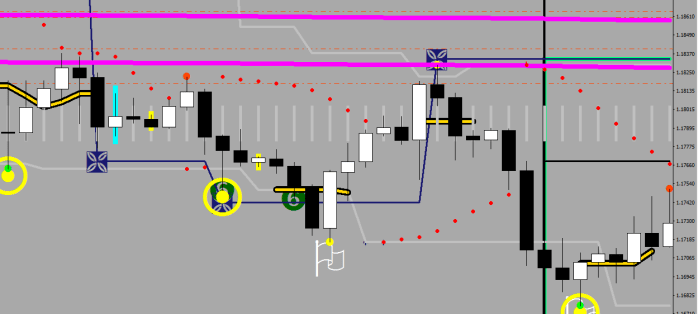
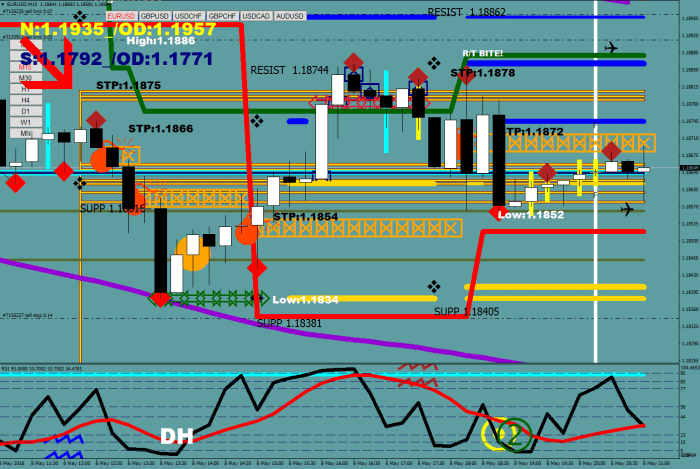
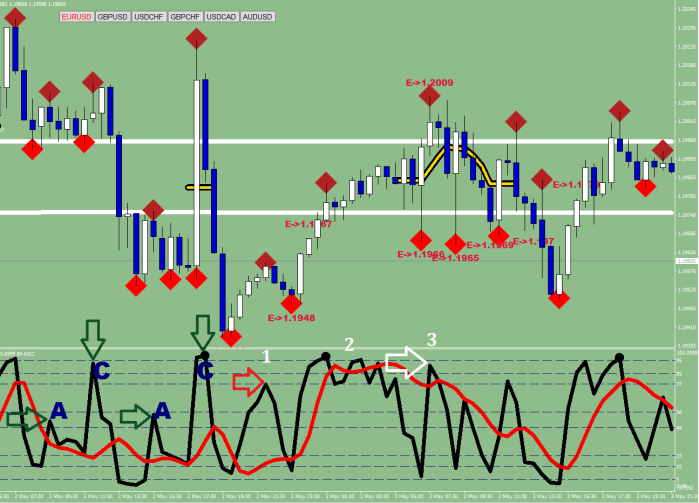
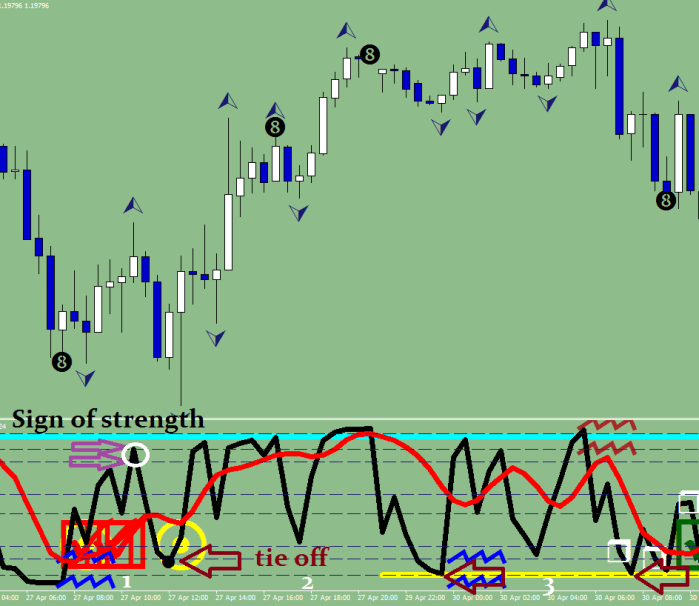
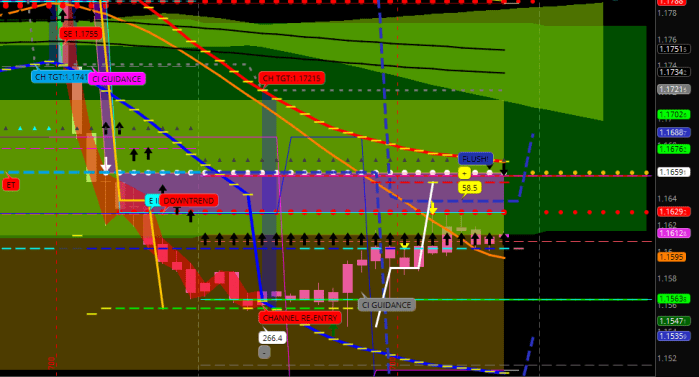
This is not all of course. So, when the support was broken (the GREEN RIVER monster got exceeded) the to do list was this:

EUR965

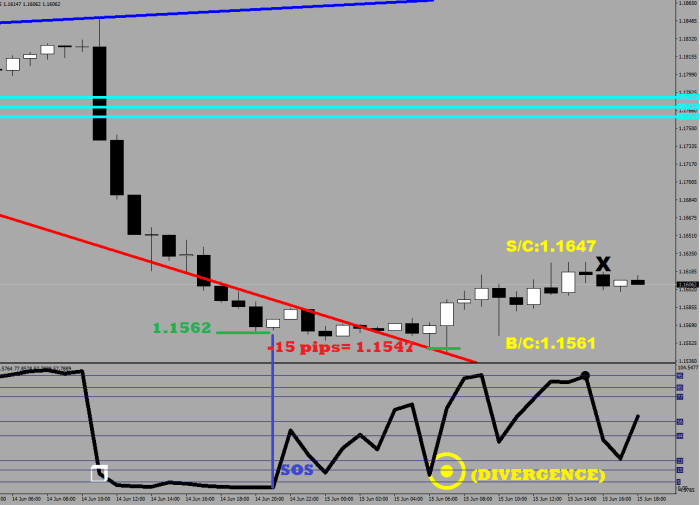
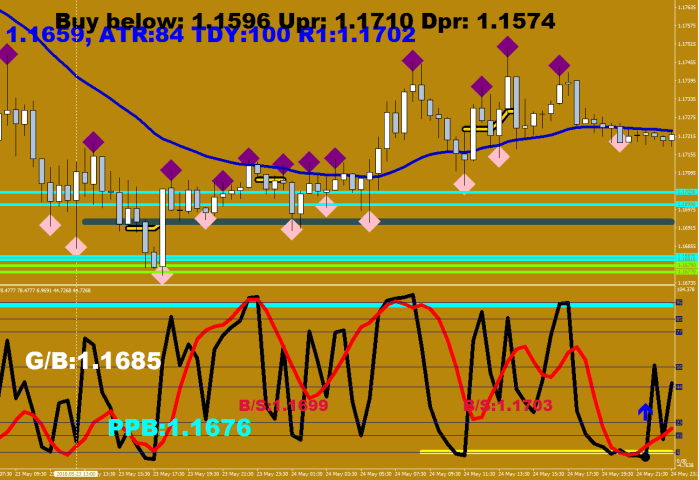
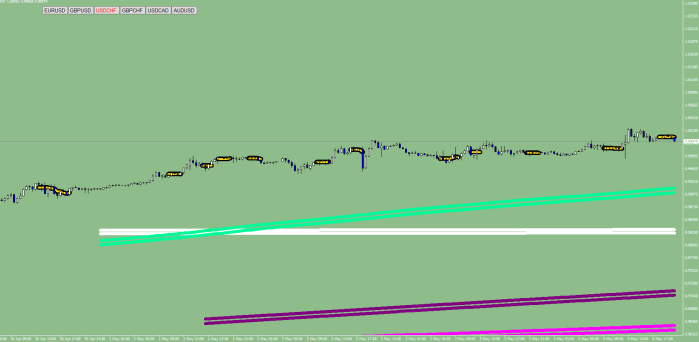
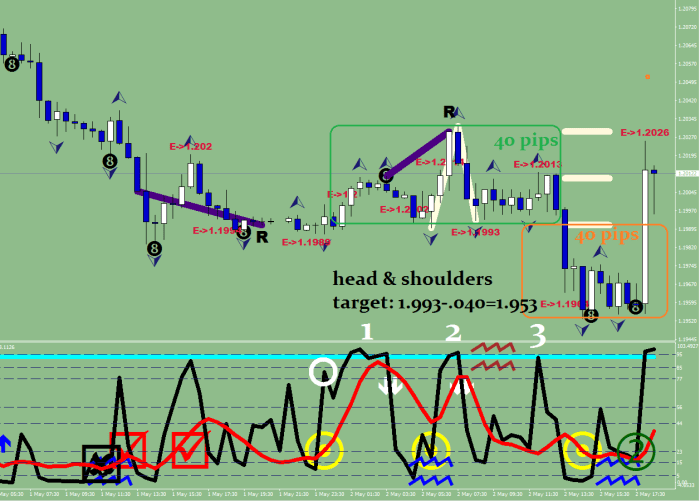
#1: switch to a 1H chart. Display an RSI2 (HL2).

#2: Wait until a Sign of Strength signal shows up (initial buying). Buy the 15-pip undercut below.

#3: Target? RSI2 95 reading plus the cut above. 11 pips was eeked out.

And you thought oscillators were useless things! You just need to know what to look for.


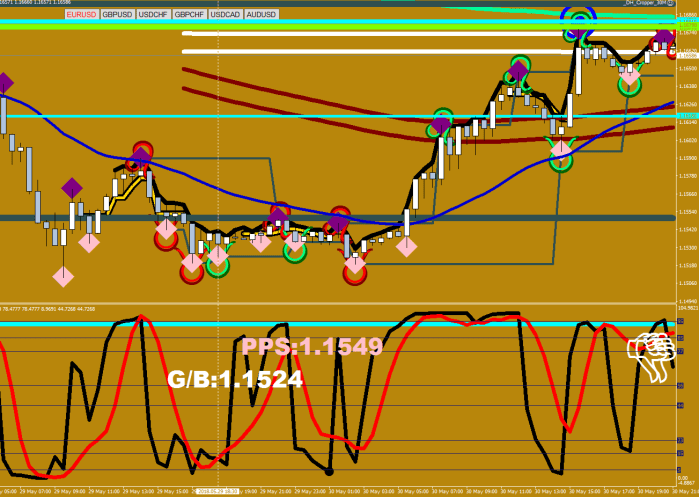
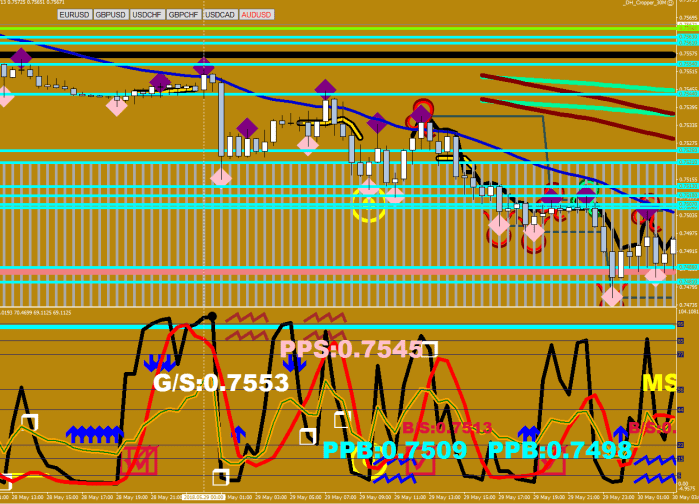
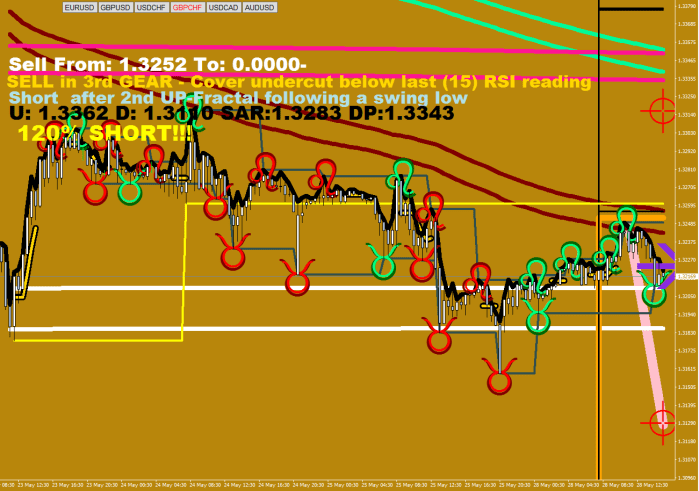
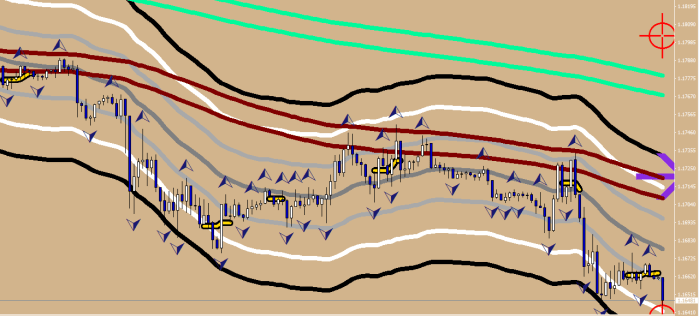
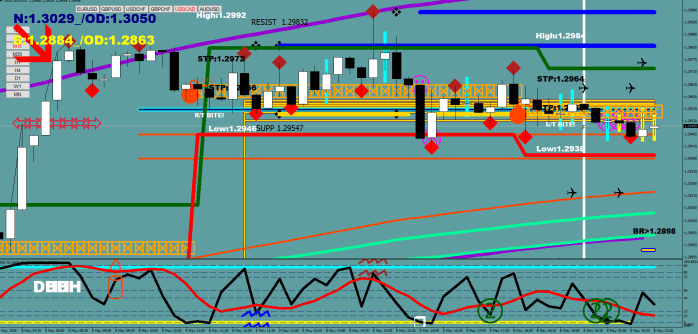
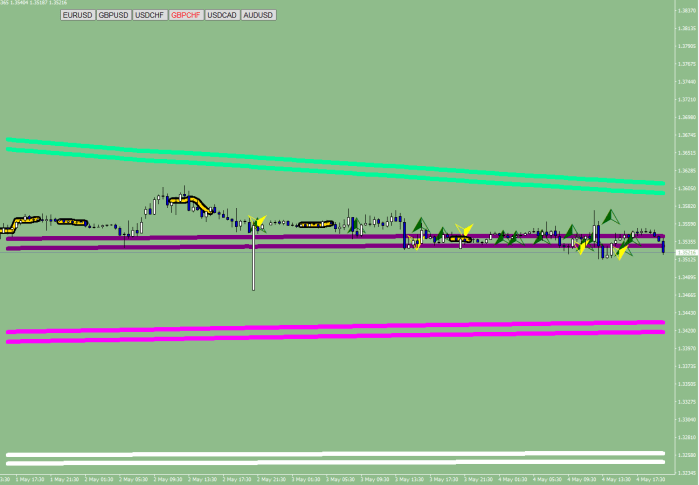
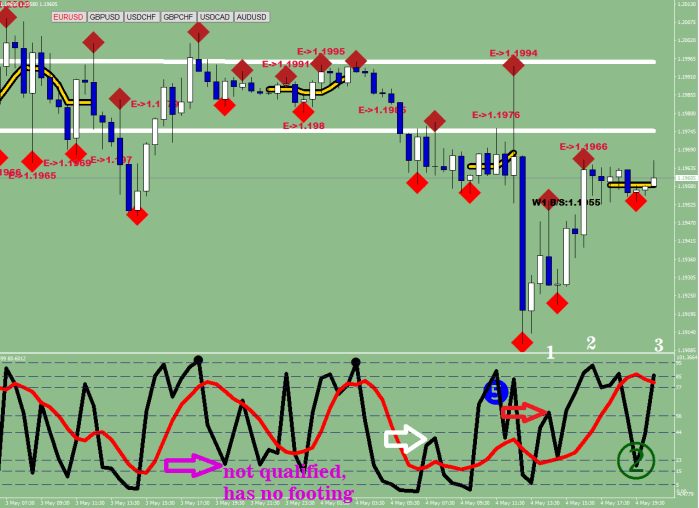
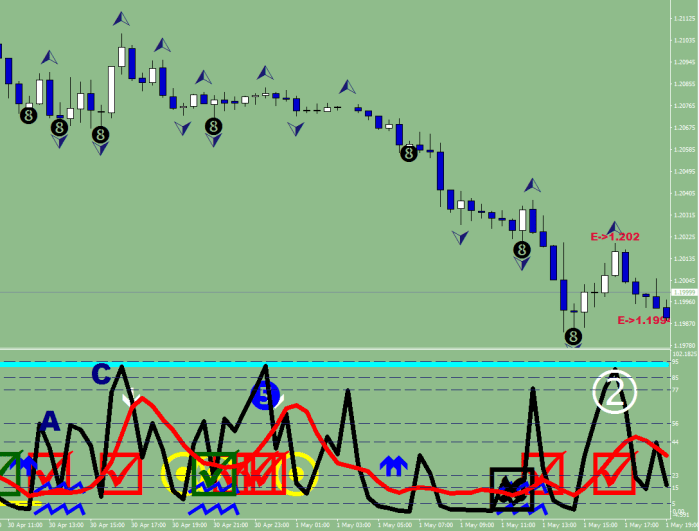
Currently you have a 120% bearish configuration.

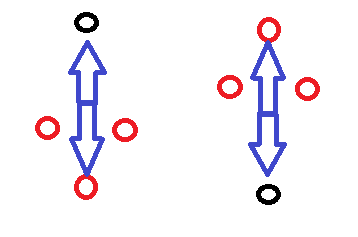
What does this mean? This means that you can sell the second fractal up and aim for a lower low. Cover on an undercut of a Low of a candle with a settled, deeply oversold RSI8 (HL2) reading.

EUR960

Yes, as you can see, there are tie-off prompts – the “1/2” starting lines, and I’m playing them. 1.1509 would be the next downside-projected reading.


Tie Off!

If only there was a way to know what the market is going to do today…

Let’s do some strip-search!

How could you have known what was gonna happen today?

EUR941

The 3rd of June opened with a slight gap-up. The bias was neutral within the hourly cloud with slight upside bias for the long wick earlier and for those who had been trapped with shorts around the low 1.15-s.

What you should be looking for is the tie-off of a move!

TOFF

Tie off already!

121

i.e.

stoch[i+1]>stoch[i+2] && stoch[i+2]<23 && stoch[i+3]>stoch[i+2] && RSI2[i+2]>stoch[i+2] && RSI2[i+2]<RSI2[i+1] && stoch[i+1]>15

ATR

The distance (for R1 or S1) is always ATR, but to be elegant, you would need to know where to measure it from.


Oh yes, about the entry: it is the HL2 value of the peak causing candle currently. When selling is in 3rd gear, you would have to opt for the undercut.


EUR942

EUR943

EUR944

Auto crimson ATR projection lines (last 100 sample)

EUR945


C.A.T.

Computer Aided Trading?

Yes.  That would be my answer.

C.A.T. is you and your EA-s trading the same account.

  • It consists of flexible, equity based algorithmic trade initiators that factor in your current open positions regardless of who opened the trade.
  • It has croppers to trim positions based on overheated conditions.
  • All positions must have stop losses.


So, my package currently has

Psar Trader

Genuine Trader

and E16-Trader

enlisted, and perhaps I shall add more later. They all open both longs and shorts. All orders are limit orders.


example for figuring size if there is already an open position in the direction:

if (nlongs==0) longsize = MathAbs(NormalizeDouble(MaxLots/2,2));
else longsize = MathAbs(NormalizeDouble(MaxLots/2-nlongs,2));

my maxsize calculation

extern double Leverage = 1.5;
extern double AF=1.3;
extern double LT=333;

double account = AccountEquity();
double MaxLots = NormalizeDouble(LT/3000000*account*AF*Leverage/StopLoss*260/2,2);


The targets and the stop losses are ATR based, so they change around, with Psar Trader being the exception with its static settings.

For croppers, I have an RSI2 cropper and a Darkest Hour Cropper. They both close out positions that are in gains by at least 15 pips. RSI2 is a 4h extreme and DH cropper utilizes the Darkest Hour condition from my DivergenceInterpreter plotter.

As you can guess, in order to have the margin percent under control, you would need to trade a single pair on this account.


I shall dedicate an account for this kind of mixed trading. I’ll keep you posted.


About the Genuine conditions – please try to figure what I spotted in these lows.

EUR936

EUR937

It has to do with the oscillator lines, and the way the price leaves the swing low. It is not a single comparison of values, but rather a sequence.

You may practice some more with the following examples:

USDCHF19

GBPCHF45

AUDUSD003

AUDUSD004


Clean Slate

Market classification

According to me, there are 5 types of markets.

120% buy is when the Maroon channel is above the Green River and price makes swing lows that reach below the Maroon Channel by 20 pips at most.

110% buy is when the Maroon Channel is above the Green River and price makes swing lows that reach below the Green River by 20 pips at most.

110% sell is when the Green River is above the Maroon Channel and price makes swing highs that reach above the Green River by 20 pips at most.

120% sell is when the Green River is above the Maroon Channel and price makes swing highs that reach above the Maroon Channel by 20 pips at most.

In all other markets there is no trend-edge.

I call the 110% markets as “Second Gear” and the 120% ones as “Third Gear”.


The percentages mean position size – in case you are invested in the wrong direction, it is the hedge size, but if you want numbers, with 200% leverage 10% overdrive would mean 5 mini lots per $1000 equity, and 20% overdrive is 6 mini lots.


Step 1> find the market to trade

Currently (28th of May, 2018)

120% short:

USD/JPY, GBP/JPY, EUR/USD, GBP/USD, GBP/CHF, EUR/JPY

110% short:

USD/CHF

110% long:

AUD/USD

120% long:

USD/CAD, AUD/CAD

USDCAD020

GBPCHF121

The spacier the separation of the Maroon and the Green, the stronger the trend. Extra points can be gained by good alignment vs the 4H Lema – lately I call it the Deep Pink.

Class A’s:

long:

USD/CAD – where the deep pink is below – at 1.2707

short:

EUR/USD – deep pink above at 1.2136

GBP/USD – D.P. 1.3779

GBP/JPY – D.P. 150.40

EUR/JPY – D.P 131.3399

GBP/CHF – D.P. 1.3343


Now you have 6 pairs. Check their wave structure on 4H. You do not want to try to get in right after a terminal move.

I would disqualify the EUR/USD for it seems to have 5 waves down.

EUR923

GBP/USD in a similar shoe.

GBPUSD068

GBPJPY – long in the tooth as well

GBPJPY3

EUR/JPY This kind of looks like an ABC, and this might reverse the hardest.

EURJPY2

GBP/CHF – this might be putting in a head & shoulders, by all means it seems too late.

GBPCHF44

So, USD/CAD is the only viable candidate on a pullback.

USDCAD21

Buy it after 2 Swing Low prints on the 30-min & cover your long upon a cut appearing above a settled RSI 85 reading.

USDCAD22

Optimal entry would be seeing the second swing low (counted from a swing high print) that gets printed in the Maroon Channel or up to 20 pips below. That would be a 120% buy.


Black and White Computing

Computers are dumb, we are dumb and our programs are even dumber.

There are a limited number of things we can do.

In trading, no matter who you are, you would end up using more or less the same ideas, the same variables.

The if then statements turn everything black and white.

I have tried to show you at times already the issue with using closing prices as a basis of an oscillator versus the weights, the actual road traveled – weighted.

One problem with closing prices as part of your examination is that the arbitrary point of time, the top of the hour/ 30 min or whatever the denomination may be, is just that. Arbitrary.

You may end up losing information. How?

Here is an example of a fractal marker.

An upper fractal is a peak that has its two left neighbors and two right neighbors fall short from. Look at the two long white candles that have no fractal marking at the high point.

EUR906

Why? because the next candle exceeded the high. Perhaps merely by seconds after the forming of the white candle was done. Black and white, disqualified. The blue candle likewise wasn’t a fractal, for it had no two neighbors falling short of its peak to the right.

Yet, I would argue that we saw a fractal.

Anything that would include taking into account the fractals, i.e. counting the number of upper fractals from a swing low, would be at times inaccurate.


If you engage in algorithmic trading, you would find yourself looking for means – lines that define where the price should be. With such a search, you may end up stumbling upon the hourly E16(HL2), like I did. Since I am plotting mostly on 30 mins, I had to opt for its brother, E32.

If you want to find, quick, high probability trades, you can – and most likely would – start monitoring the separation from the mean, and you would pick a sample size. The longer the separation was on for, the farther price got pulled away from your line, the more likely it is to find resistance on the re-visit. Longs get out, shorts get in kind of thing.

The thick gray line is the E16. The regression channel looking is simply a set of lines 18 pips apart. As you can see, price spends a great deal of time being in the gray zone.

EUR907

The red distance is in excess of 36 pips (18+18), and it occurred during your sample size leading up to the next upper fractal that discharges on E16.

This is your first algorithm. How much can you hope for? 36 pips (to the white line). What stop should you use? 18 would do.

Please take into account the configuration of EMA 135 vs EMA 424 when deciding on the preferred side.

The above entry can be basis of a hedging routine, such as my E16 hedger. When the separation does not occur, the price could walk through the E16 without resistance. I’m sure you have seen this a million times.

This is what algorithmic trading is. Picking up on a feature that seems to repeat itself and exploiting it for it has high probability of working out.

Let’s talk about thinking ahead. Is there another 40 pips guaranteed somewhere?

Look at the 4H PSAR.

Similar idea, mean reversion…

EUR908

What if you knew / predicted the location of that blue dot before it occurred, and placed a short order 5 pips shy from it? 44 pips with – say 18 stop again? Not bad. But what can you actually aim for?

There are two of such encounters on the following picture. Can you find them?

One resulted in 116 pips to the swing low, the other was only good for 30. Could not you decrease the stop to 15? You certainly could.

EUR909

A side effect of this is that you can become aware of things about to happen.

Like the sell off on EUR on Friday.

EUR910

Can you find where it fell short by 5 pips from the standard PSAR settings?

…and from now on I have the prediction printed on the screen, so that I can stay on my beloved 30.

EUR911

double para;

if (iSAR(Symbol(),240,0.02,0.2,1)<iSAR(Symbol(),240,0.02,0.2,3)) para = iSAR(Symbol(),240,0.02,0.2,1)-(iSAR(Symbol(),240,0.02,0.2,2)-iSAR(Symbol(),240,0.02,0.2,1));
else if (iSAR(Symbol(),240,0.02,0.2,1)>iSAR(Symbol(),240,0.02,0.2,3)) para = iSAR(Symbol(),240,0.02,0.2,1)+(iSAR(Symbol(),240,0.02,0.2,1)-iSAR(Symbol(),240,0.02,0.2,2));

EUR912

_E16_Channel


After finishing the above post, I thought, Why not make a PSAR trader?

PSARTrader01

I don’t recall ever seeing such a nice parabolic bow upwards right off the bat with any idea, so I went on to exploring more.

PSARTrader02

Added more filters, doubled sizing…

PSARTrader03

…and when I stuck with shorts only, utilized the 4H LEMA, changed the stop loss to 30 pips and kept target at 40, see the result for yourself:

PSARTrader04

PSARTrader05

Friday’s trade it would had opened at 1.1730 – as you can see…

PSARTrader06

I could change the Normalization of the Doubles to 4 digits’ length – but apparently, there’s no need for it.

Things like this, the finding, the thinking from start to finish, the ability to implement like a one man army makes me believe that I am possession of the finest quality of brain. Imagine the frustration that derives from it  when I seem to be unable to sell myself, unable to come across / succeed in life.

2-minute Warning 2018

Knowing myself I probably have used “2-minute Warning” as a title at least once already.

Martin Lee Gore subconsciously has been writing Forex trading theories disguised as songs; at least as far as Little 15 or the 2-minute Warning goes.

Mike Maroon is a pair of 135 EMAs (highs & lows).

EUR871


_LEMA_30

Displaying it can help you understanding the gear the market is in.

If it does go back to Mr. Maroon, then it is in second gear; and if it does not even reach to the 3-minute LEMA, then you have a 2-minute Warning: selling in 3rd gear.

As far as 3rd gear goes, it is commonly known that it is darkest before the dawn.

I call this the Darkest Hour.  DH. Not DM.

EUR872

_divergencepetr_s6

It only shows up on 15 minute. It would be beaten briefly. Likely.

USDCAD019

…and it goes a little something like this:

for (j=0; j<=1000; j++){

if ( RSI2[j]<5 && RSI8[j]<15 && stoch[j]<15 ) {
summup=0;
for (i = j; i < 1000; i++) summup += ufcount[i];

if (summup>2) {

ObjectCreate(“txt 6″+j, OBJ_TEXT, 1, Time[j], 40);
ObjectSetText(“txt 6″+j, “DH”, 32, “Arial Black”, White);}}

if ( RSI2[j]>92 && RSI8[j]>92 && stoch[j]>88 ) {
summdn=0;
for (i = j; i < 1000; i++) summdn += dfcount[i];

if (summdn>2) {

ObjectCreate(“txt 6″+j, OBJ_TEXT, 1, Time[j], 80);
ObjectSetText(“txt 6″+j, “DH”, 32, “Arial Black”, White);}}

}}

I know, I could have used while loops to save some run time, but currently I don’t feel hard pressed.

One Variable Less


To simplify things, you need to consider what can be eliminated without having much significant effect on the end result.

Since 30 min is needed for measuring the strength of individual moves, yet the 1H is best for the Green River and the 2H LEMA, there is a possibility of making a Hybrid “30” minute chart.

The first thing to do is to eliminate the 30 Minute LEMA itself.

_LEMA_30

Lema 30 is strictly for a 30 minute chart.

The price location VS the LEMA channels can determine among three kinds of markets.

1. Above the 3 LEMA channels. Trending market. Buy dip – either an ABC or 3 pushes lower based on the strength of the qualifying push down.

2. Tangled: price is between two LEMAs. Here reversals are abound, things are range bound and it is hard to see clearly.

3. Below the 3 LEMA channels. Trending market. Sell rip – either an ABC or 3 pushes higher based on the strength of the qualifying push up.

For obvious reasons you should be looking for a pair in trending mode.

The white streaks are the Daily LEMA. Helps with getting a further idea of price location on the big picture. To anticipate a reversal, price has to get on the other side of the Green River (which is the 15-min LEMA here).

I have left the maggots in, if you don’t want them displayed, simply set the blacks and the yellows to clrNONE.

EUR861

GBPUSD on the same gauge:

GBPUSD067

This would mean that GBP is somewhat stronger than EUR, yes.

USDCHF is also trending, but in the opposite direction.

USDCHF14

This means that CHF is weaker (white lines) than the EUR and the GBP.

GBPCHF is tangled, it is not clear if the GREEN river or the 2H LEMA is gonna get touched first. A reaction from either of these would be likely though.

GBPCHF119

USDCAD is making weak bounces off the Green River.

USDCAD017

It is trending higher, but not with much conviction, and too many touches means that eventually it would crack below it.

I shall let you do the analysis on AUD/USD.

AUDUSD01

The current divergence interpreter that I use can be downloaded from the previous post. It is calibrated mainly for the EUR/USD, but may work well on other USD pairs too.

Again, you can set the things you don’t want displayed to No Color.

Below there are some examples for timing your entry based on the qualifying move’s strength.

When there is a halfway spike for the first move (green horizontal arrows), you can sell the second move up, or the C in the deeply overbought field – and aim for a lower low (green vertical arrows).

EUR862

When the qualifying move goes too strong, you end up with two more waves following it up, so your sell would be a Wave 5, and your aim cannot be a lower low either.

There are other nuances, such as the qualifying push cannot come from too high (merely oversold or worse.

Below some exceptions:

EUR863

The one I marked as not qualified resulted in 3 pushes up, that went nowhere, so it is close to a regular red marker.

The one with the white mark is merely a reaction, not qualified either. It is a double pump (that results in an “h”) and cannot be broken for a while unless a short covering, quick run follows (which by the way would result in a new, lower low).

The current, red push up is just a little stronger than it should be for an ABC, and there was a moment (30 min) of hesitation before the thrust, either way, the bulls’ three little wishes are either already over with or would be very soon.

Homework: should you be expecting a lower low?

h danger & Buy 4 3 Waves

EUR864


Little 30

Now all that she wants
Is three little wishes

…She wants a nice surprise
Every once in a while

These are general ideas. Not for every instrument, not for every time.

I have never seen someone with an RSI2 HL2 and a Stochastic 10 put together as an indicator. This is my invention. I find it perfect for finding strength, weakness and! figuring out which wave you are in.

I call overbought above 77, deeply overbought above 85, oversold below 23, deeply oversold below 15 and extra deep oversold below 5.

Understanding #1

You do not need to cover your short or take a long until a sign of strength. An RSI2 peak (I call it local overbought) that is just right, to start the first move up. It should not fall short of overbought or beyond deeply overbought. In this case, the line’s thickness make it look like it went further than it actually did. The reading was 84.8769 – trust me.

EU08

Understanding #2

When a sign of strength was made, the bulls get three little wishes.

Making money is as easy A -> short C.

EU09

EU10

EU11

“A” comes from below 23 lands between 44 and 56, it prints a peak, and 4-5 bars later you should see something deeply overbought… your sell – for a lower low at a very minimum. Cover in the deeply oversold section.

How does this work with other instruments? Don’t know.

_divergencepetr_s6

(I forgot to mention that you should put this indicator as the first one below the chart to have the letters plotted.)

Practice chart: find the sign of strength and the three tie-offs of the bull run.

EUR854

I was watching when this – not so nice – surprise developed. I knew that it was a bonafide bull run, and that we were in wave 3, I knew that upto 15 pips penetration into wave 1 was a buy, and then I saw no buying whatsoever for the 3rd wish of the bulls. Those E-s mean Entry points. I did the calculation in head before the break of the lower fractal even happened. I came up with 1.1954 or so at a glance.

The surprise accordingly is a head and shoulders in a bull/bear section.


EUR855

Read It Like I Would

Analysis, my way.

Think of potential = distance to go uninterrupted.

1. comfort levels – location & the road traveled

EU00

The reason you would be looking for a lower high is the fact, that price first traveled from the top of the upper reversal zone (shading) to the overbought neckline (thick black), and then you had a long retracement into the deeply overbought line (thick coral).

2a. the conditions to be right

EU01

The distance traveled back up to the deeply overbought line is in excess of a normal, single discharge of the 4H energy, which is about 165 pips. That’s a strike. RSI 8 above 85, that’s red hot, ideal to sell into. As time progresses, a root point gets justified by a higher high with a lower strength divergence.

2b. support-resistance readings highlighted by Skid Rock

EU02

In order to take a trade, the probability of the next move is only half of the story. You need to have little to no obstacles to ensure uninterrupted progression & length.

3. consolidations

Travel fuel can be ensured by sufficient consolidation. The following image shows where the 4H price movement has reached high levels of consolidation (>51 on a 14-sample CI).

EU03

I put the same black line up to remind you of the 160+ pips that started with a high energy, consolidated state, and was forced to make another consolidation after it got thoroughly exhausted by the distance / steepness.

Your best entry is upon leaving the consolidation zone. For a full reversal, you should have the divergence made first (Root point). You could had taken a short anywhere after price went below the root point, but to define your risk, and to keep it low, the perfect entry would had been a short stop at 1.2349 with a stop at 1.2369. 1.2349 is a little over 20 pips away from the middle of the consolidation – and you should not be expecting a fall back after the strength was proven by reaching this distance from it.

As for the potential, you should see the first move reaching 1.5x daily ATR, which is around 100 pips (add an extra 15 pips for extra surprise), given the 3-days average of EUR/USD movement.

EU04

The lime lines are the milestones. A reaction is likely, so it is a good idea to cover around them, and then either go with the same direction if price surpasses the swing-point by 12-15 pips.

There were a number of good entry points, i.e.

the pull back towards the swing low – with low risk, 20 pips again,

and when the consolidation was printed, the upper border and the presence of the overbought neckline was sufficient for another low risk entry.

The opportunistic long – upon having traveled 2 milestones in one direction, was the beat of the low set primarily by the mile stone. Symmerty is something you should be thinking aboutof and looking for; the fist move got the sell started, the second ended it.

You are currently above the root point, a reversal had taken place. Wait for another consolidation to form to take a new position – or re-utilize a previous one.

This certainly looks like a re-utilized consolidation high:

EUR843

I should mention that it improves your odds to trade in a direction if you are far away from the LEMA quad (colorful lines above).


The current move up would qualify for a Wave 1 up (as soon as Fractal is printed). A pullback would be a buy (a drop to 1.2095 perhaps or to the 1H root point at 1.2080, for sure). I would expect a reaction coming from around the 1.2156-1.1269 area (1H oversold neckline / half way mark between the roots and is the lower end of the previous consolidation and a 161.8 extension). You could play this counter move down for 50-55 pips, for the current Wave 1 (or Wave A) likely would be utilized for a buy when penetrated. The continuation move down I would expect to come from the green river that would have dropped to/below 1.22 by the time of the rendezvous.

EUR845


//the logic for the consolidation, the outer limits & the label placement

// line 1 is the weight of the last consolidation

//line6 is the high of the last consolidation (weight + 18 pips)

//line7 is the low of the last consolidation (weight – 18 pips)

for (i=300; i>=0; i–){
line1[i]=line1[i+1];
if (ChoppinessIndex(14,i+1)<51 && ChoppinessIndex(14,i)>51) line1[i]= (iHigh(NULL,0,i)+iLow(NULL,0,i))/2;
if (Close[i]<line1[i]) line6[i]=line1[i]+.0018;
if (Close[i]>line1[i]) line7[i]=line1[i]-.0018;
if (line6[i]==EMPTY_VALUE && i<200) line6[i]=line6[i+1];
if (line7[i]==EMPTY_VALUE && i<200) line7[i]=line7[i+1];
}


deletetxt1(“txr 11”);
deletetxt1(“txr 12”);
deletetxt1(“txr 13”);
deletetxt1(“txr 14”);

for (k=0; k<=50; k++){

if (line7[k+3] != line7[k+4]){
ObjectCreate(“txr 11″+line7[k], OBJ_TEXT, 0, Time[k], line7[k]+.0005);
ObjectSetText(“txr 11″+line7[k], “Low:”+NormalizeDouble(line7[k],4), 16, “Arial Black”, White);

ObjectCreate(“txr 12″+line7[k]+”S”, OBJ_TEXT, 0, Time[k], line7[k]+.0022);
ObjectSetText(“txr 12″+line7[k]+”S”, “STP:”+NormalizeDouble(line7[k]+.002,4), 16, “Arial Black”, Black);}

if (line6[k+1] != line6[k+2]){
ObjectCreate(“txr 13″+line6[k], OBJ_TEXT, 0, Time[k], line6[k]+.0016);
ObjectSetText(“txr 13″+line6[k], “High:”+NormalizeDouble(line6[k]+.001,4), 16, “Arial Black”, White);

ObjectCreate(“txr 14″+line6[k]+”S”, OBJ_TEXT, 0, Time[k], line6[k]-.0002);
ObjectSetText(“txr 14″+line6[k]+”S”, “STP:”+NormalizeDouble(line6[k]-.001,4), 16, “Arial Black”, Black);}

}