Executor.exe

A smart man knows when to be dumb.

High flying ego will get you squat. No more Mr. Trader.

You need to write a program for your self. You would be running the program as a platform. No more surplus overthinking.

I have written mine.


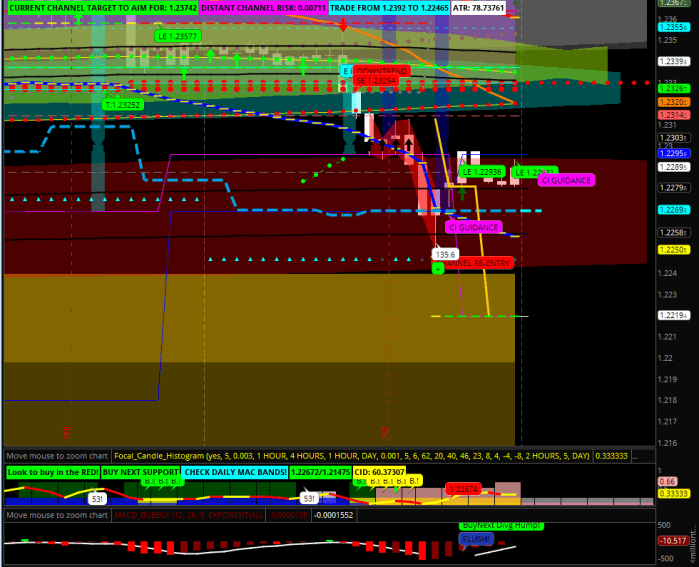
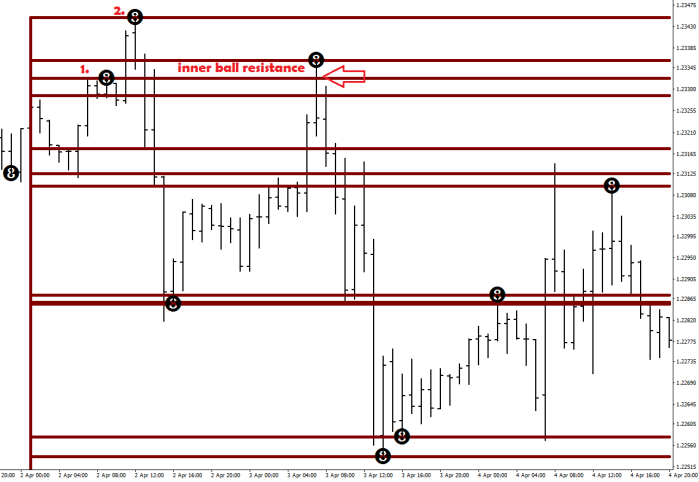
I am taking directional trades upon exiting consolidation or exceeding the 1.5xDATR+15 pips limit from the last 4h consolidation, preferably away from the 1H LEMA quad.

I may take a reversal trade upon a turn around the 1.5xDATR+15 pips limit, if there are other obstacles present, such as 5% marks or roots.

I may take a reversal upon a re-test of the consolidation range limit if there are other obstacles present, such as 4h overbought/oversold neckline.

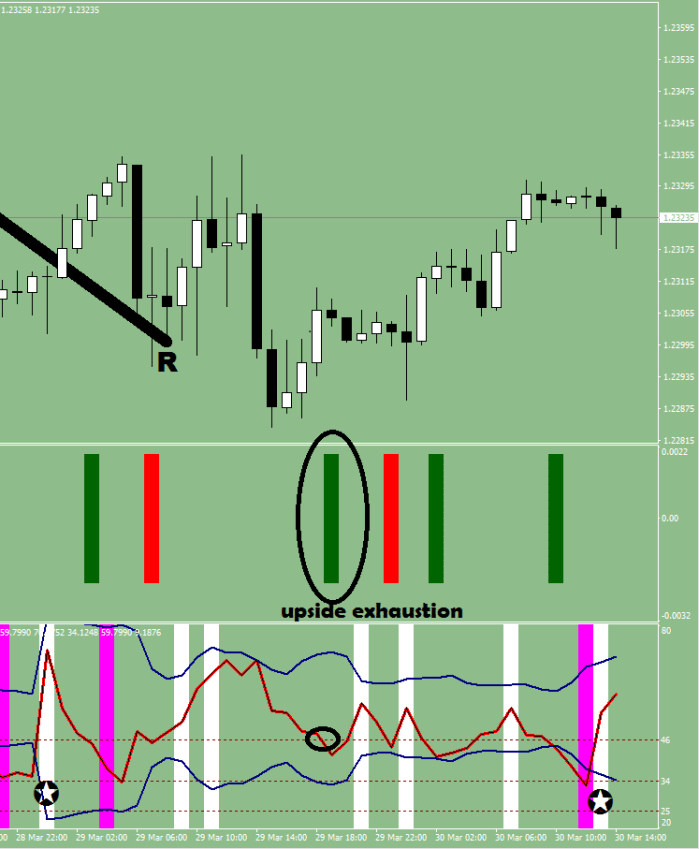
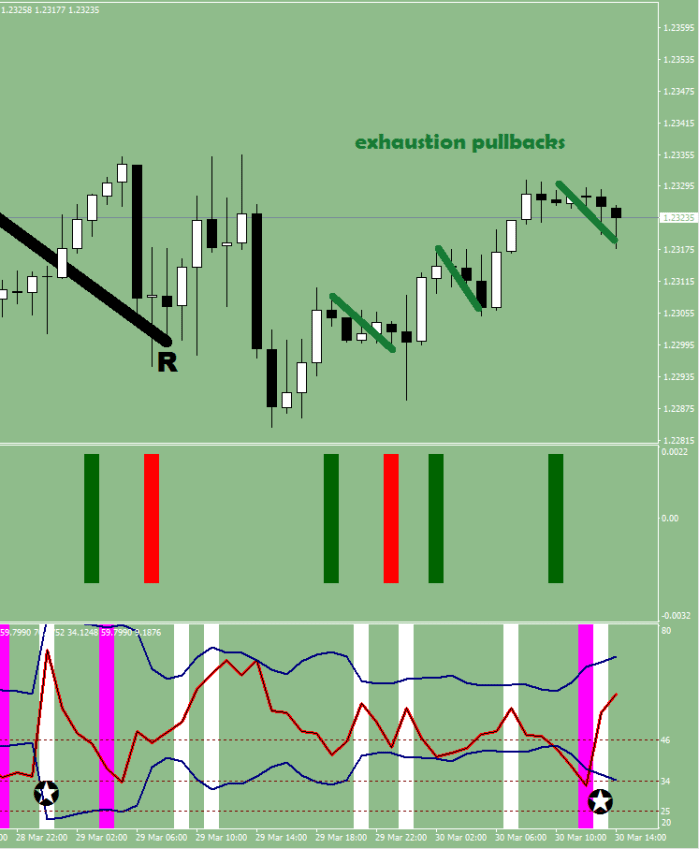
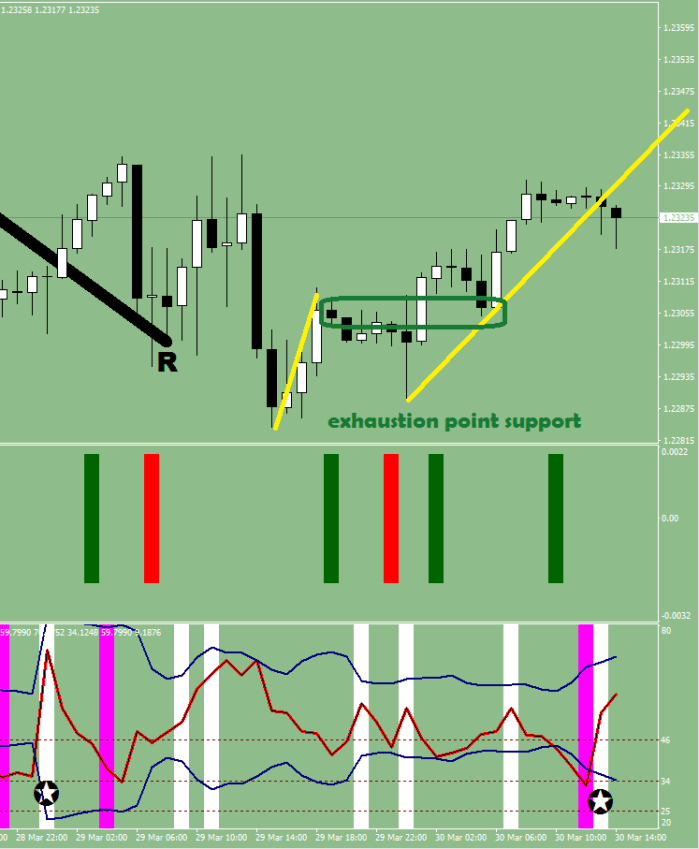
I must be conscious about the 4h comfort levels, the state of embedding and the root points.

I exit upon price hitting the 1.5xDATR+15 pips limit –
and may re-enter in the direction upon exceeding the swing materianized by the limit + 10 pips.


Long Program
Long entry: 20 pips above 4H consolidation
Add to long: 30 min local deeply OS
Stop loss: middle of consolidation (-20 pips)
Long exit: in consolidation, in gains, 30 min local deeply OB


Short Program
Short entry: 20 pips below 4H consolidation
Add to short: 30 min local deeply OB
Stop loss: middle of consolidation (+20 pips)
short exit: in consolidation, in gains, 30 min local deeply OS


Cover line is 1.5xDATR+15 pips from open


Both Programs:
Consider lightening after the 2nd break of 4H 22-bracket


Stage 2 buy / sell – after the 2nd break of 4H 22-bracket

Long Program 2
Long entry: 1H local deeply OS, 1/2 size
Stop loss: -40 pips
Long exit: new higher high


Short Program 2
Short entry: 1H local deeply OB, 1/2 size
Stop loss: +40 pips
Short exit: new lower low

There is one more thing: do not sell embedded overbought / do not buy embedded oversold.


Air Lift #1

This piece was originally posted on the Current read page.

I am giving people indicators, but they can only learn the practical usage and the thinking from this blog. This is an all time lesson as such.


A wave 1 comes from beyond a root point.

See how the wind (MACD) remained down all the way during the move back up.

The 3 thick horizontal lines are the two root lines + the halfway mark between them.

The bounce back into the end of Wave 1 (Wave 4) coincided with the pro volume candle’s low (green line)

EUR819

After plotting the qualifying moves (thick red & green) – since the last move is a red down (happens to be the Wave 3), it is clear that you are looking at a retracement only in the up move, that would be the starting point of a wave 5 down – which could either stall out at the 55 pips black dash and storno the whole move or take it down much closer to 1.23097 – which would likely yield a consolidation at some point effectively moving the consolidation weight lower.

EUR820

If I also plot the 88 lines, you would see a double pump at the end, that would increase the chance that Wave 5 would be a short one: if they decide to buy the inner brown, at 1.2336 and put a stop beyond the lower brown, the move would be cut short.

EUR821

Also take note of the white spinning top. As soon as its bottom is crossed back up from below, the bear time would be over with.

EUR822

In terms of deflectors, price is currently tucked below the green river monster (15-min LEMA), and is having a second go at the 30-min LEMA and the 1H LEMA is right here as well. On regular days, the price tends to play ping pong between the green river and the 2H LEMA – starting at 1.22763.

We seem to be witnessing a letter “h”, a formation that price cannot get out of lower for a while. (It came back down for a re-test after a significant bounce (>23%) too quickly.)

Check how the Root point has just migrated higher.

EUR823

….

End of the air lifted part.

The outcome was a drop to the 2H LEMA (in magenta) and there was an extension made (to the end of its cloud – not displayed here, but a 1.272 extension),  1.2260 by the way was last week’s low, and it got superseded to exchange positions through the revolving door. The sell off starter from the Green River, and the new wave kicked in upon beating the fractal on the left (revolving door again).

EUR826

Current move up to the root does not qualify for a Wave 1. You are still below the root point, and the back test of the bottom is highly likely.

By the way, the bounce happened off the 4H lower root. (Bottom left “R”). (You can also find the last flame signal on my Stochastic/RSI2 oscillator.)

EUR828

In the current setup, the three components are the following (more in the Principles article): the wind is negative, the position is above/at the 2H LEMA, which is neutral  and price is below the Root point which is also negative.

EUR827

The above image displays the cloud around the LEMA. Since this was a flush move, the next, lower low would come with a divergence and would be a buy. The projected distance lines put this value at around 1.2219, which as you can see would be in the oversold section of the comfort levels.

Escaping Speed

Scott Barkley would tell you that the 55 pips is coming from the feasibility for the institutions to make a move.

My thinking is more along the lines of physics. Escaping speed yields the distance -> progression made.

EUR813

Speed Minimum 55 pips / 7 hour… 🙂

I made the line plots part of the 15-min ATR Target Pro, and here are the plotting lines:

extern bool plot_grid_55=true;
extern double pacing=55;


deletetxt1(“HLN”);

if (plot_grid_55) {

ObjectCreate( “HLN”+IntegerToString(0), OBJ_HLINE, 0, Time[0], w[0] );
ObjectSet(“HLN”+IntegerToString(0), OBJPROP_COLOR, clrBlack );
ObjectSet(“HLN”+IntegerToString(0), OBJPROP_STYLE, 2 );

for (i=1; i<=3; i++) {

ObjectCreate( “HLN”+IntegerToString(i), OBJ_HLINE, 0, Time[0], NormalizeDouble(w[0]+(pacing/10000)*i,5) );
ObjectSet(“HLN”+IntegerToString(i), OBJPROP_COLOR, clrBlack );
ObjectSet(“HLN”+IntegerToString(i), OBJPROP_STYLE, 2 );
}

for (i=-1; i>=-3; i–) {

ObjectCreate( “HLN”+IntegerToString(i), OBJ_HLINE, 0, Time[0], NormalizeDouble(w[0]+(pacing/10000)*i,5) );
ObjectSet(“HLN”+IntegerToString(i), OBJPROP_COLOR, clrBlack );
ObjectSet(“HLN”+IntegerToString(i), OBJPROP_STYLE, 2 );
}

}


void deletetxt1(string what){
for(int iObj=ObjectsTotal()-1; iObj >= 0; iObj–){
string on = ObjectName(iObj);
if(StringFind(on, what) == 0) ObjectDelete(on);

} }


EUR814


+1, new feature:

qualifying moves (impulsive ones, in excess of 55 pips) in red and green

EUR815

If the last one is red, that makes the current move up a mere retracement.


Now that you have come all the way, a bonus image for you… 8+8 =88

EUR817

Principles by Day Ralio

True or not, who knows… These are merely principles. Current ones.


There are three components to price progression:

1. The wind – currently iMACD(NULL,30,48,104,9,PRICE_CLOSE,MODE_SIGNAL,0) </> iMACD(NULL,30,48,104,9,PRICE_CLOSE,MODE_MAIN,0)
2. Relationship to obstacles (deflectors (maggots / H4 Deflector lines) & wind tunnels (LEMA Quad))
3. The Wave Structure


Any 2 out of 3 determines the overall direction

!
The maggots / deflector lines can prompt a reaction that can become a full turn (let it be 3-point or change of wind)
So can the Market Maker levels

Increased chance for a turn taking place at a camping site or inside a reversal zone (see comfort levels)

Maggots are the levels utilized for continuation in the opposite direction, for they are pivots


Directional exhaustions happen in pairs – see my articles about the Shape for an image


A Wave 1 goes OB/OS once
A Wave 2 goes OB/OS twice.
A Wave 3 goes OB/OS twice.
A Wave 4 goes OB/OS twice.
A Wave 5 goes OB/OS once.

1+2+2+2+1 = 8


Wave A goes OB/OS three times.
Wave B goes OS/OB twice.
Wave C goes OB/OS three times.

3+2+3 = 8


I am a STRUCTURE trader.


Short term trading live with Macdulio


My long entry conditions are:

– after price has come back through the ROOT: Wave 3, 1H Local deeply oversold (<15) + level
– wave 2 or wave 3 or wave 4: price pulls back to a previous upside exhaustion level

– price finding support at the 1H green river
– price finding support at 2H LEMA
– price pulls back into the river after a flip over

My long exit conditions are:

– price is in a wave 5 to the upside && price is local overbought
– price just finished wave 1 with a buying exhaustion


My short entry conditions are:

– after price has come back through the ROOT : Wave 3, 1H Local deeply overbought (>85) + level
– wave 2 or wave 3 or wave 4: price pulls back to a previous downside exhaustion level
– price finding resistance at the 1H green river
– price finding resistance at 2H LEMA
– price pulls back into the river after a flip over

My short exit conditions are:

– price just finished wave 1 with a selling exhaustion
– price is in a wave 5 to the downside && price is local oversold


Trend riding is done as follows (portfolio management):

Oversold/Overbought embedded market (3 days spent beyond the neckline)
Enter on a local oversold / overbought condition as close as possible to the neckline, with a stop beyond – at maximum 5% distance

Exit after the violation of the neckline (multiple closes below), while price is making an effort to get back into the overbought/oversold field

The most violent, sudden moves come from the inverse setup, so it would make perfect sense to reverse your stance and take a ride at least to the 50% line, but very possibly to the other extreme


15-min ATR Target Pro

Deal of the century!

$15 for a 15-min ATR Target Pro.

Email me for it to macdulio@yahoo.com

It has a MACD sensitive directional line plotted.

This is a rope for people who can’t seem to learn how to stay in a trade.

On occasions you may have both axles plotted, for the criteria is that either the last or the current MACD main / signal relationship has changed from negative / positive to the other.

The plotted lines are from the last qualifying low/high; you get to set the RSI2 values, the default is 15 and 85.

I’m suggesting plotting it on the hourly chart.

As you will find out, the target circles are more like the vertical line’s top to its bottom, and of course they shall be exceeded at times.

Reaching the target does not mean having to bet on the opposite direction heavily. It merely means that it would be a good idea to lighten up on your holdings.

New target shall be plotted upon a completed 15 min consolidation.

Plotting the starting point – the very thing you are trading away from – is the cheese on the cake.

EUR806

GBPUSD055

USDCHF12

GBPCHF044

USDCAD016

AUD045


Simultaneous plots: MACD is changing

EUR807


Ain’t Got a Lot

Ain’t got a lot to improve on.

When I saw that this Wave 1 line (in off white) wasn’t getting plotted, I immediately knew what the problem was: there was no exhaustion within my current sample, so I had to move the examination out 1 bar furter, to the sixth…

|| uex[j-6]

& voilá:

EUR798

I was to write something bashing about what a mistake it is to set your oscillators on Close prices… They are an arbitrary point in time with no particular meaning, and advise you to start using weight values instead.

I wanted to point out for you the obvious, that a Wave 1 to the downside was made and the best entry points are (in the direction of the Wave 1)

  1. the pullback to/beyond the Root point (when applies)
  2. the pullback after the Wave 1 Terminal Swing Point was made

EUR799

The likelihood is high that price is going to go into the monthly Wave 1 (image 1.), from where the the monthly Wave 3 to the upside is to continue.

I hope you learnt from me something about moving averages, learnt the importance of finding the wave structure, keep an eye out for double pumps (8+8) that cut the waves short, play the direction of the wind & the relationship to the green river (up to a Wave 5), and never ever disregard what the comfort levels tell you.

On the 1H I had to change the back dating to forward facing to get proper results.

EUR800


88 Luftballons

Just started working on this. It would be a very valuable tool, for you would not need to stare out and try to figure if both the stochastic was oversold/overbought and the RSI 2 on which bar exactly, that had the high/low where exactly to place my line at… finger magic…


Pump my ride…

If this was Morse code, Wave C would be two dots. Period.

One feature becomes immediately visible: the double pump. Price stops dead in its tracks, effectively choking a Wave 3 and turning it into a Wave C. On a back-test, the inner 8-ball is going step up to prohibit from touching the outer eighter by proving to be hard ball for a Wave 2… Very low risk entry with stop beyond the outlier for a Wave 3 or a Wave C.

Two examples>

EUR768

EUR769

Although many of these lines are fractal lines as well, as you can see, they are much more aligned with the price movement; there are no surplus lines.

Why would be a program like this be worth $88 for you? Because of all the future relief that if would give you as well as all the mind expansion & useful indicators you have been receiving here for free.


This is gonna be awesome!

EUR770


Fractal Lines combined with 88 Luftballons and My Root Lines on top for good measure>

EUR771


(Un)Wavering Faith

Determined to get the ultimate understanding of the structure?

There just might be a way. Listen carefully. 9 years of research yielded me this.

  • What is a Wave 1? A Wave 1 starts beyond a root point and crosses back above it.

S01

  • Was this a Wave 1? It could had been, but did not make it to exhaustion. Nor was it surpassed later.

S02.png

  • How many exhaustions does a Wave 1 come with? Normally 1.

S03

  • What happens upon an exhaustion? A pullback. Sometimes there is a beat as well.

S04.png

  • The structure builds on these exhaustion points. They are not impenetrable, but with good odds would be utilized for a continuation opportunity.

S05.png

  • Wave 3 becomes a wave 3 upon exceeding the Wave 1. Now, here is where it gets a little blurry. The first exhaustion starts the wave, the second is ending it. Should not this be called Wave 1 then?

S06

  • No, this is a terminal point of a Wave completed. A Wave without number. Wave 3 would likely be presenting you with 3 (directional) exhaustion points, for every Complete Wave would have two different exhaustion points. It is a matter of grouping things. What is missing from this current Wave 3 then?

S07.png

That’s right, the 2nd buying exhaustion point. What about Wave 5? How many exhaustions does that one come with? None. Their purpose is a beat and/or recharging the energy for the counter move to get started.

So, should you be expecting a gap down before you had the second buying exhaustion?


Somebody was asking about the previous wave structure down. Here it is:

EUR753


The below routine is for sale, $99

EUR755

It is under the name of Cumulative RSI + Exhaustion Plots.

In combination with my Market Maker Lines DC – which is aslo at $99 >

EUR756

Could give you a break for the package, of course. How would $169 for the two sound?


Other: Introducing the Wave1 finding intelligence:

EUR757

EUR759

EUR760

R.F.I.U. #2 – Ratio Hedger, MACD Cropper

Routines For Industrial Use #2

Two Routines again,

First, your Second Line of Defense.

This is your catastrophic hedge, when all else seemed to fail and your Equity/Account balance ratio managed to drop below your setting.

_0_Ratio_Hedger

Keep in mind, that your Broker’s Market Makers would push up the spread during after hours, at the weekend open, at the US close and at turning points, which would have an effect on your Equity number and this would result in a very different E/A ratio, that may trigger you into a hedge.

I have seen 440+ points spread on occasions from Squared Financial, that provides 0.2 pips on average during trading hours for the EUR/USD pair.


The second thing to give you is the Limit Order deleter, aka

_MACD_Cropper_New

This routine clears out of the way all limit orders, that are not in line with last, 30-minute wind direction reading.

It does not touch the stop orders out of consideration for the Upside/Downside protection routines.

Like so:

MACD_Cropper


R.F.I.U. #1 – Upside & Downside Break

Routines For Industrial Use

Upside / Downside hedgers

The two routines below are two different EAs.

They were made to be the first line of defense. They are made with the intention of “catching a fall”.

Sophisticated usage would include:

– closing out the positions partially to avoid re-hedge i.e. leaving a micro lot open (if you want to avoid being re-hedged for some reason)

– working towards the last 16 (or your setting) sample low/high: closing out the hedge / position towards the last low/high knowing, that 4 pips (or your setting) later the hedge would be re-instated automatically

– remembering that there is no reason to close out the hedge before the wind changes

They work on the current time frame; you would need two separate windows, both with the pair you are trading on and in the chosen time frame. You can define hot keys for them or peg ’em from the navigator window. (Place the extracted files in the active Experts folder, where you can pull them from. For indexing, you may need to restart your MT4 first.)

They are set by default to be monitoring for 16 sample highs/lows and put out a full hedge / a half hedge (based on MACD wind) at 40 points / 4 pips displacement, constantly monitoring for your current position size difference.

They are deleting and replacing the orders every 1800 seconds or when your discrepancy between the longs and shorts changes.

Intended use 1h or 30 min. Remember, 16 sample of 30 minutes equals 8 sample of the 1h.

0_Downside_Protection_MACD

0_Upside_Protection_MACD

For further nuances, the MACD is a 30-minute one and has, 48, 104, 9 settings. We monitor for the difference based on the previous, not the current 30 minute’s readings.

The reason for 1/2 hedge is that you are trying to pee against the wind. Might work for a bit and yield you something before becoming a liability.

You can also see on the pending order list if the hedging size changes – for the wind just turned.

The above two routines are posting orders only when price is within 50 pips of their sell/buy stop.


Don’t forget to allow for the Comment fields to show on the order list. Makes for easier reading.


comment


.