Root Canal

A freebie,

_My_Root_LinesV1_1

Roots are targets, so if they get broken… go with that direction. But, they are also Roots, so things can grow out from them being the ground for it.

EUR735

I think it works ๐Ÿ™‚

The original idea was to write an article over the weekend that would expand your mind, but that’s a bigger bite, and I needed this tool for it in order to show you what went down on Friday, whenย  a rally that came out of the lower root, pulled back to the green river monster, made an upper root and then broke it… Yet it settled back below.

EUR737

Weekly roots below…

EUR736

Monthly…

EUR741

Look at the rally that grew out of this root:

GBPCHF117

Oil… I mean USD/CAD is back testing the root right now.

USDCAD17

GBPUSD054

As for TNTsunrise’s GBPJPY recommendation, let’s see…

GBPJPY2

j2=0;
while (j2<300){
j=j2+4;
while (j<j2+16){
if (RDN[j2]!=EMPTY_VALUE && ODD[j] !=EMPTY_VALUE) break;
j++;}
if (Low[j2]<Low[j]-.001 && ODD[j] !=EMPTY_VALUE) break;
j2++;}

i2=0;
while (i2<300){
i=i2+4;
while (i<i2+16){
if (RUP[i2]!=EMPTY_VALUE && ODU[i] !=EMPTY_VALUE) break;
i++;}
if (High[i2]>High[i]+.001 && ODU[i] !=EMPTY_VALUE) break;
i2++;}


where ODU is overdrive upper (RSI2>80, stoch>80)

ODD is overdrive lower (RSI2<20, stoch<20)

RUP is upper root suspect (RSI2>80, stoch<80)

RDN is lower root suspect (RSI2<20, stoch>20)

The Law of Deception

You are going to be seeing trading in a different streak after this article, guaranteed.

The ultimate reason for engaging in a trade should be that the risk could be defined very low. Meaning a reversal should take place right there or very close to it. Or perhaps a clean break.

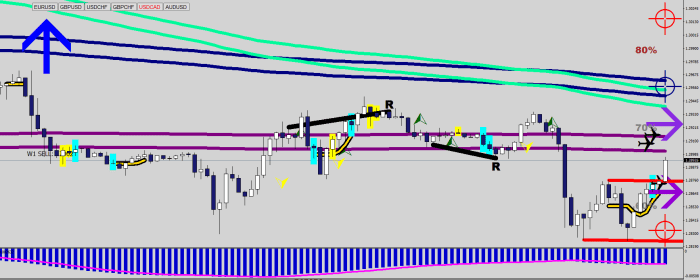
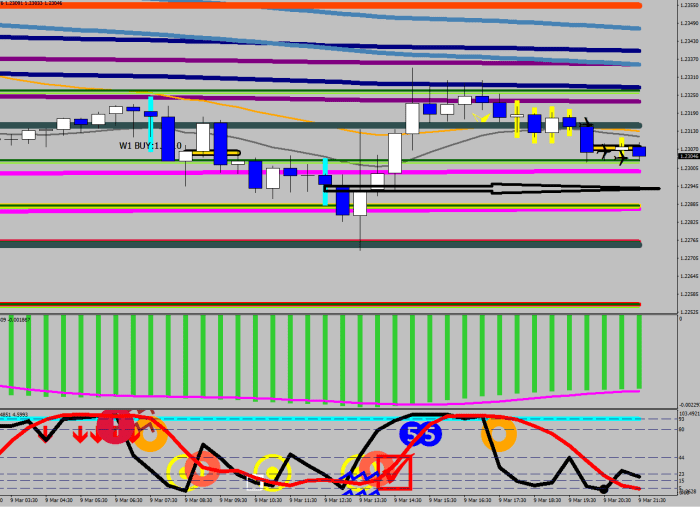
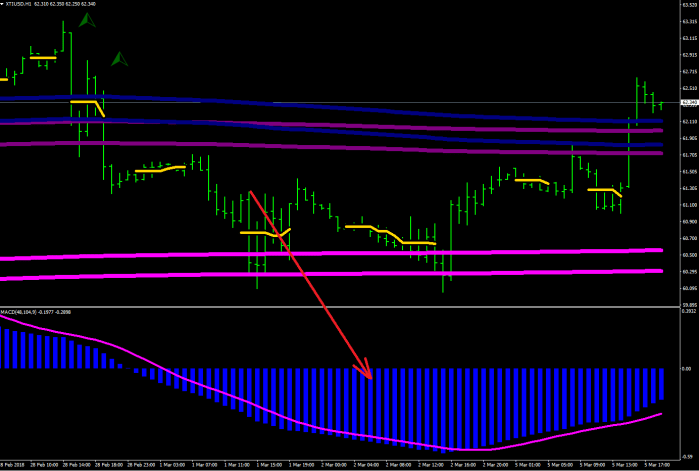
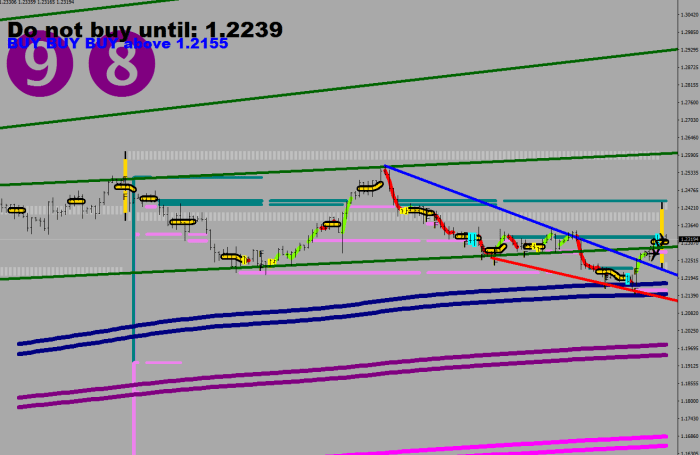
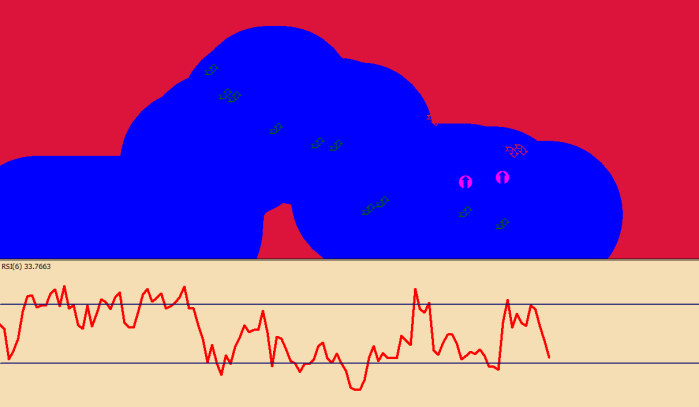
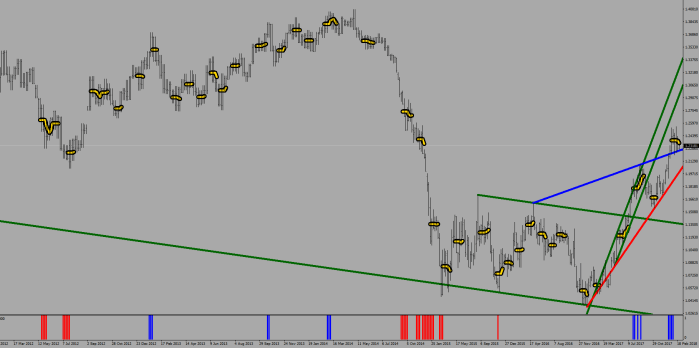
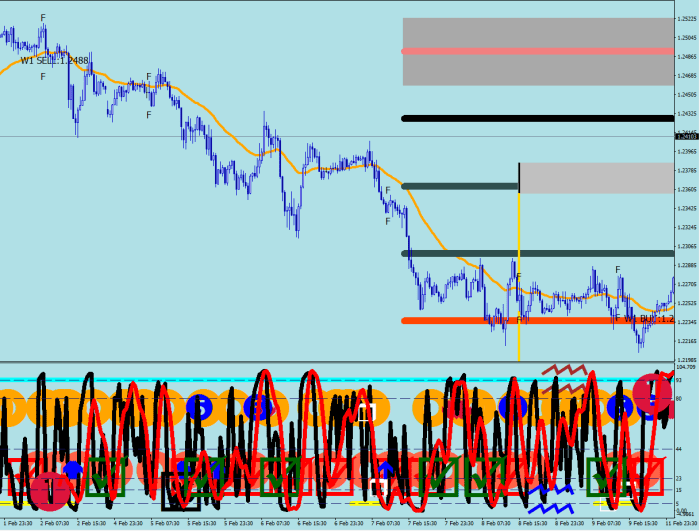
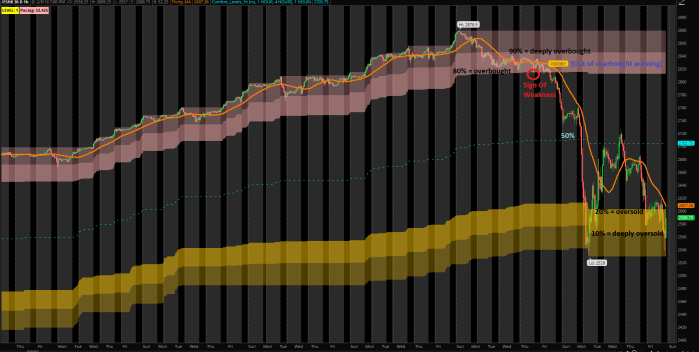
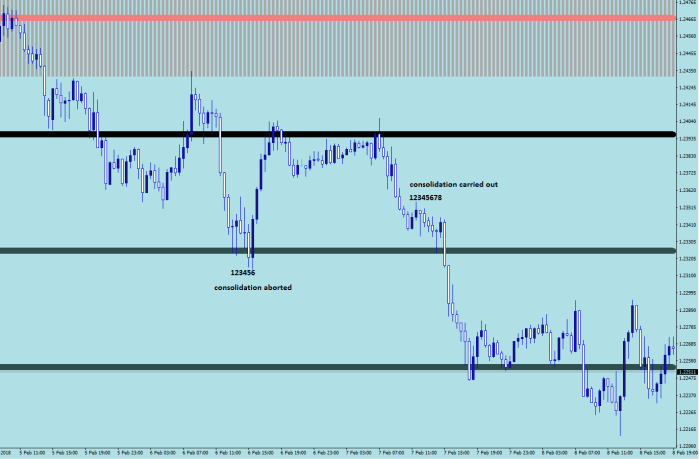
What would happen if I was to high-lite every 4 hour range that does not exceed say 15 pips?

The chart would look like this:

EUR715

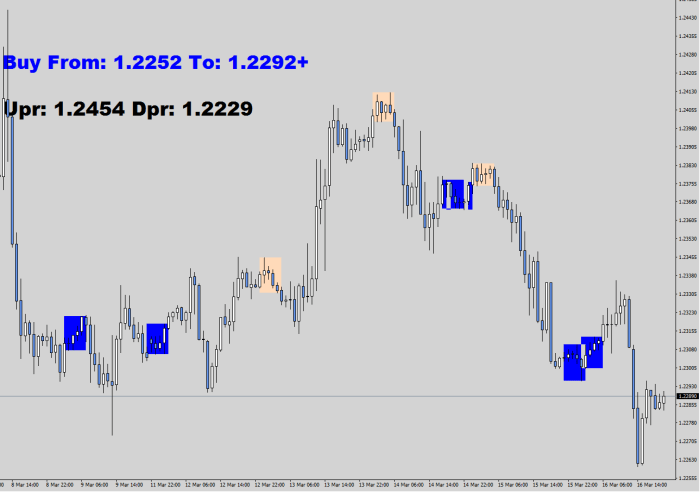
The coloring has a basic MACD and RSI filter { iRSI(NULL,0,2,PRICE_MEDIAN,i)<20 || iRSI(NULL,0,2,PRICE_MEDIAN,i)>80) ; iMACD(NULL,0,48,104,9,PRICE_CLOSE,MODE_SIGNAL,i)<iMACD(NULL,0,48,104,9,PRICE_CLOSE,MODE_MAIN,i) }

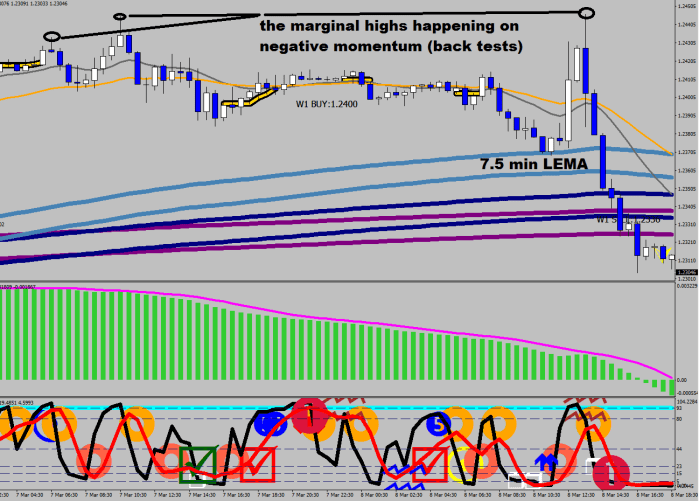
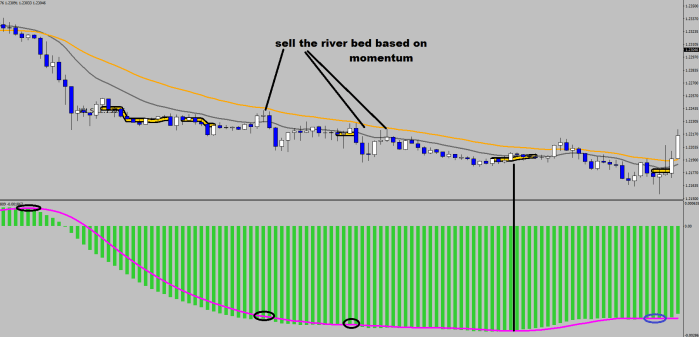
The deception is the following: everything is happening when nothing seems to be happening.

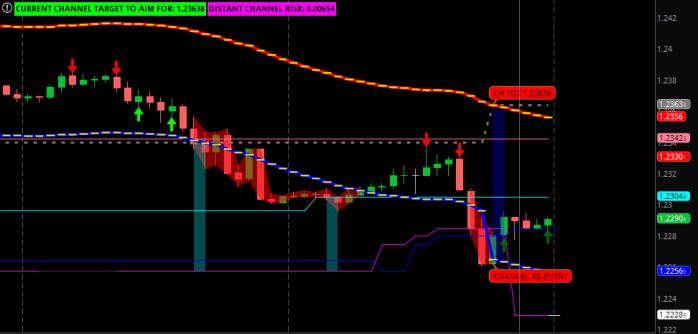
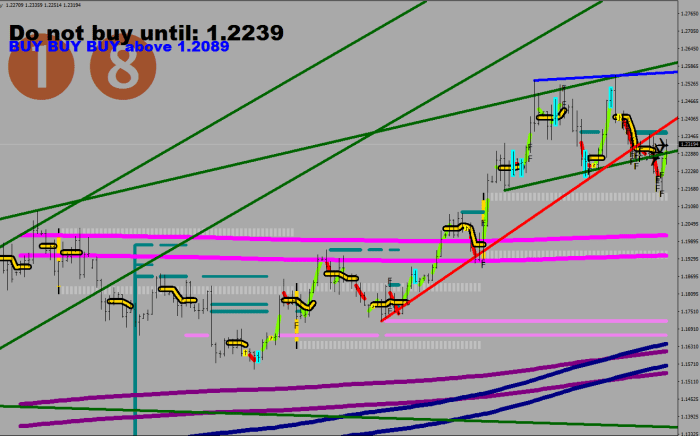
What you need to see here is that whenever price breaks the plotted box, usually there is not much – if any – kick back at all. Meaning: you could have your stop loss within 15 pips and there would not be much pressure on them, you’ll likely get 50 pips of gains even if you are shooting from the hips. Why 50? Because you lose a few pips from the starting point, and 55 pips… I’ll let Scott Barkley talk for his loaf of bread on this one.

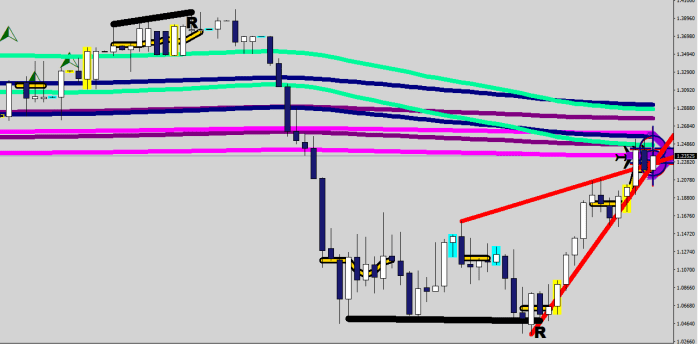
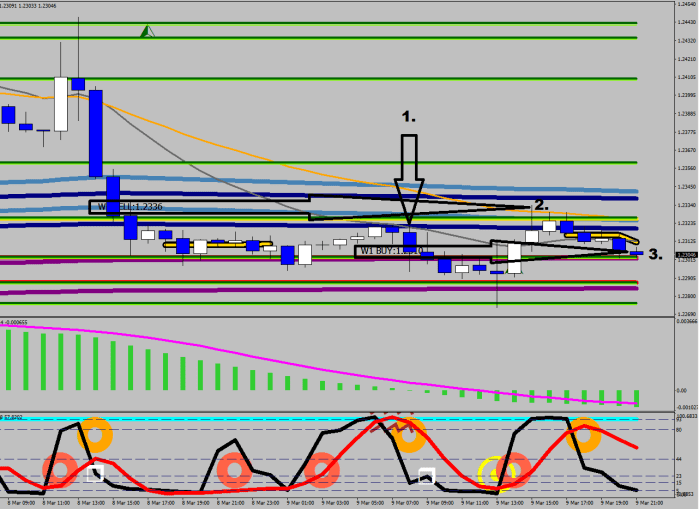
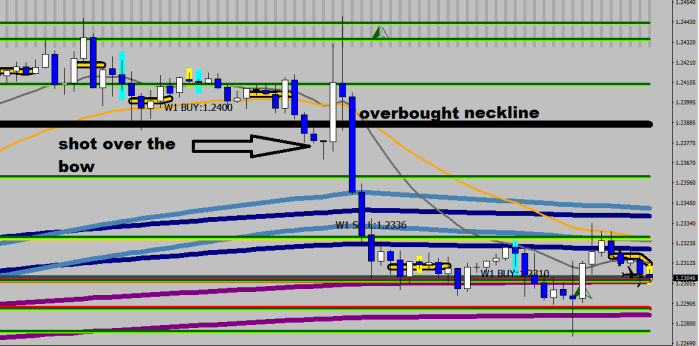
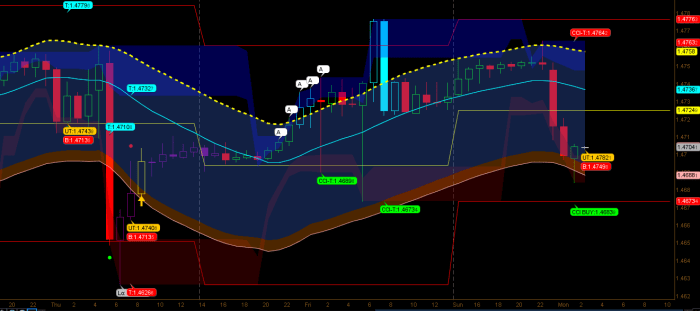
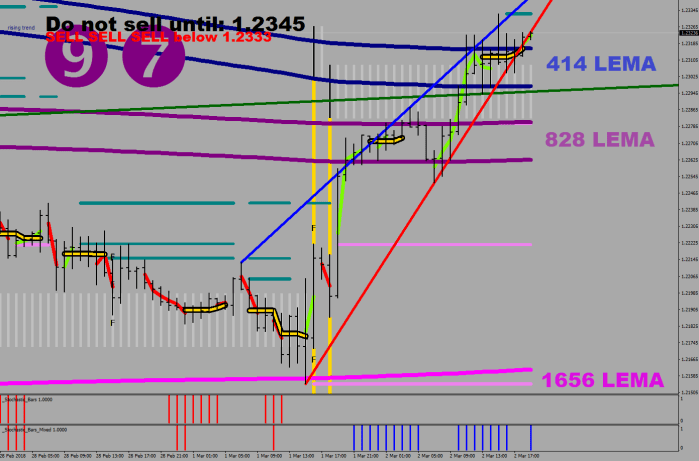
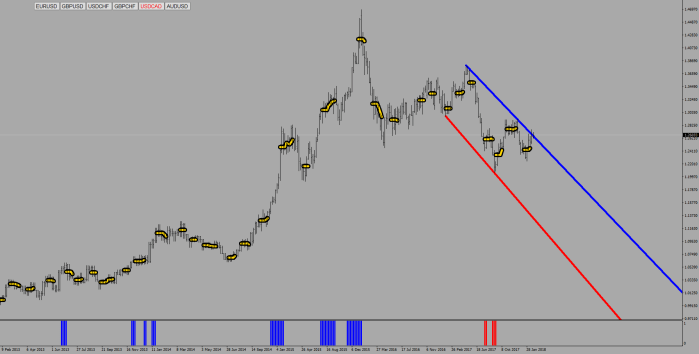
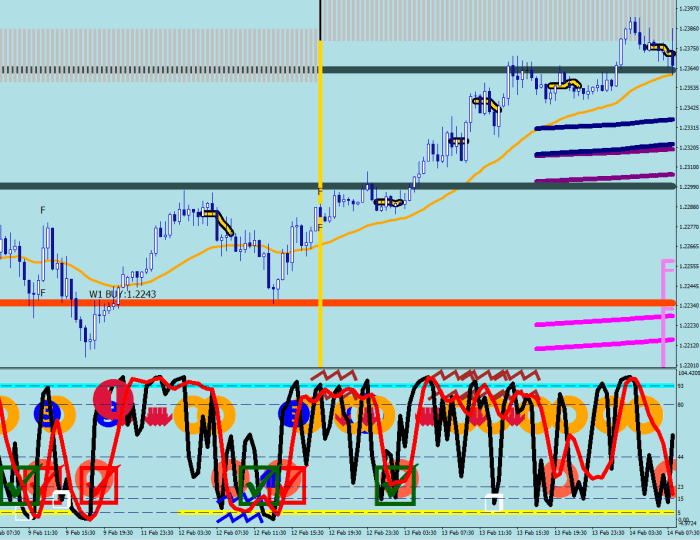
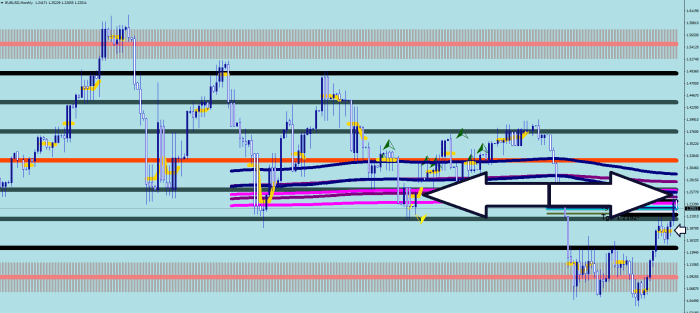
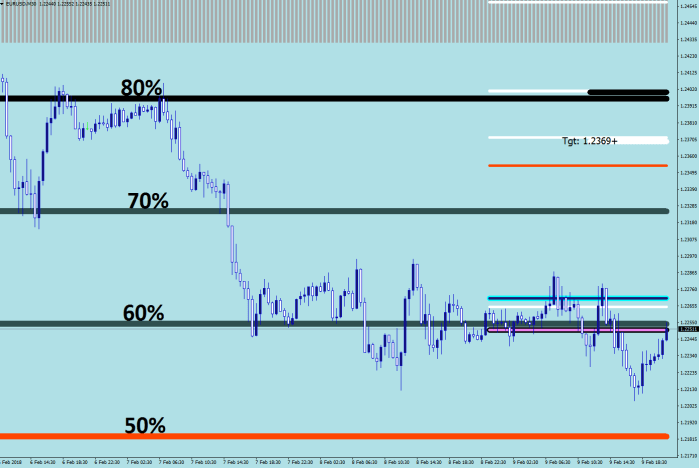
The next logical step is to bring the history out to the right margin, as such:

EUR716

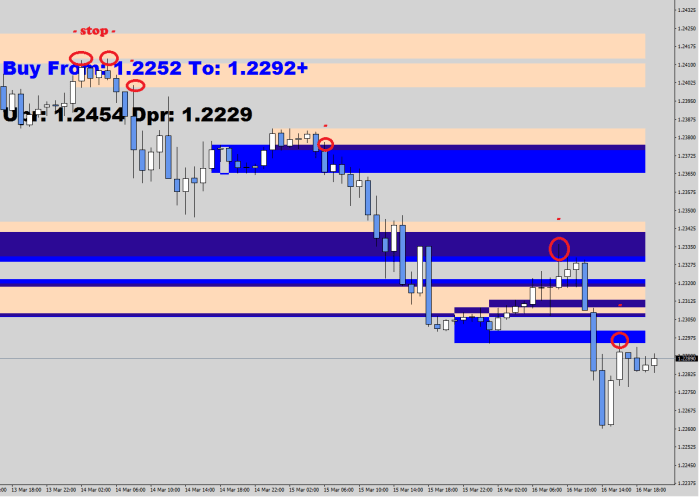
All of a sudden there is a 15-pip stop reality in front of you, that you have never seen so clearly before…

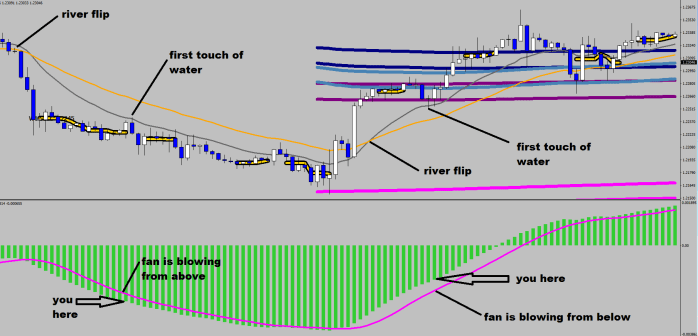
Yes, you had a bounce from the revolving door showed by the arrow…

EUR717

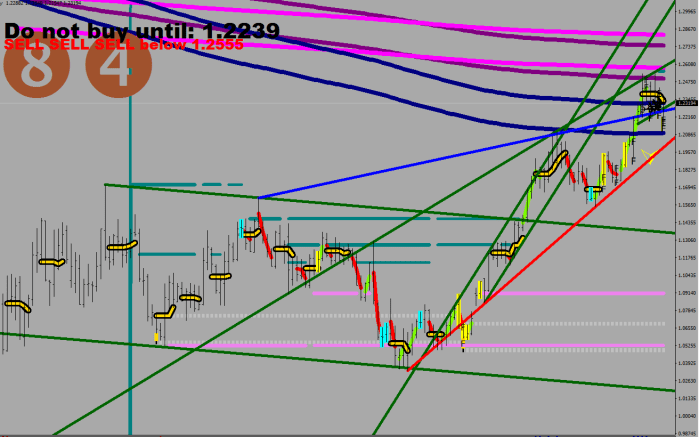
Can you see the problem? There is no 4h, 15 pips minus doji in sight. There is no foundation to launch back from. The exhaustion prompted resistance caused the bounce.

EUR714

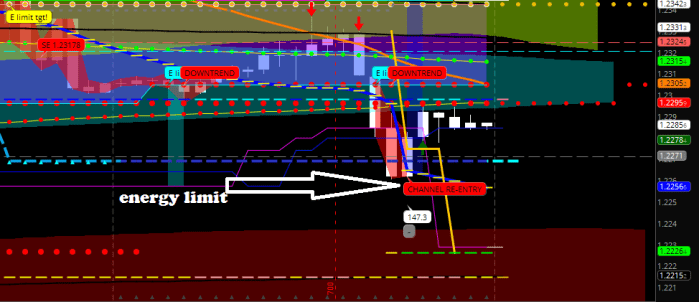
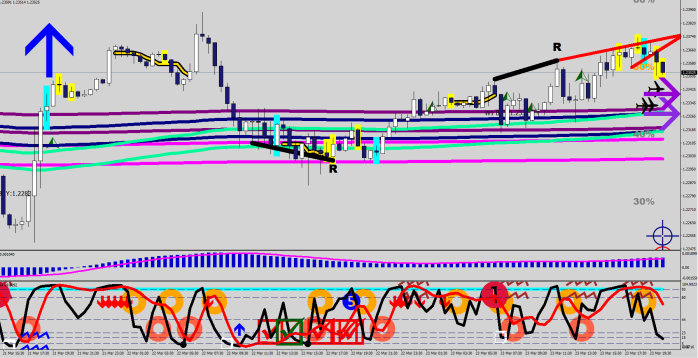
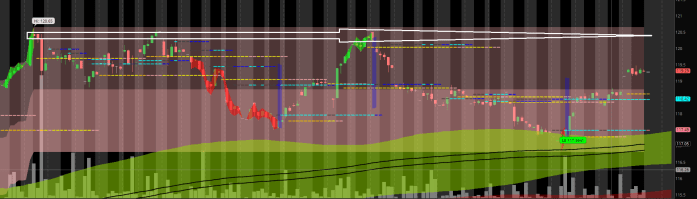
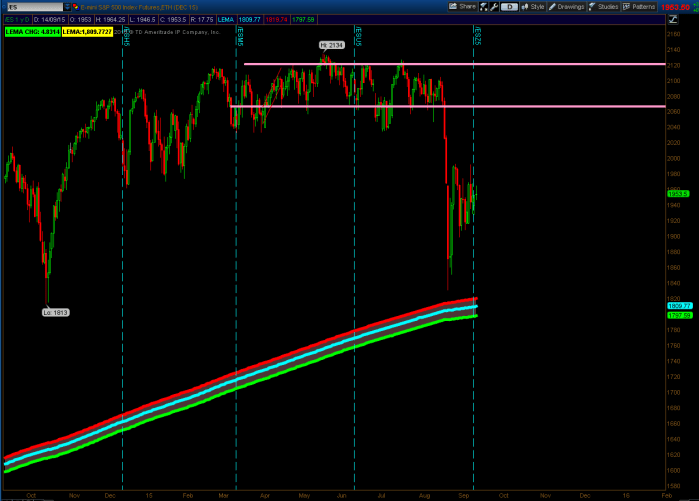
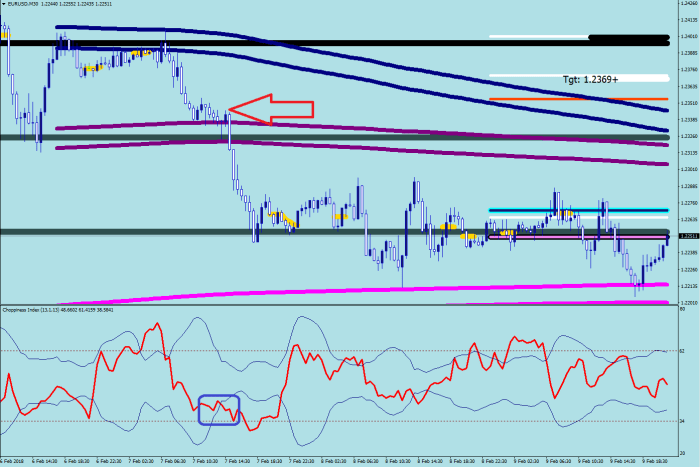
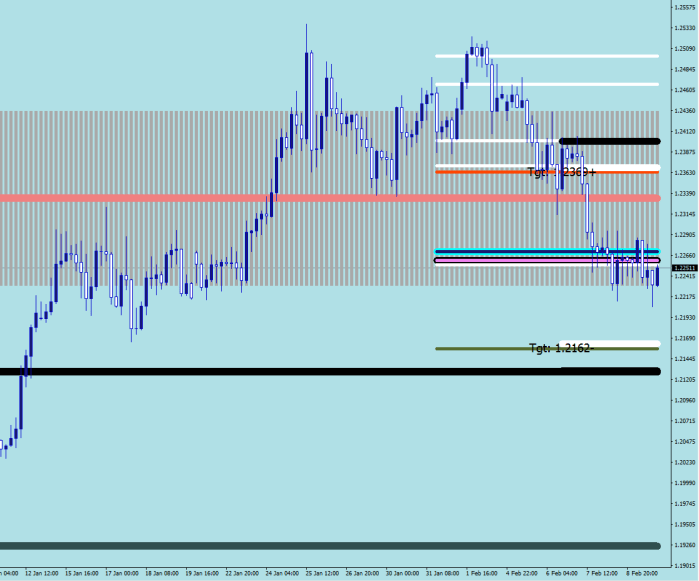
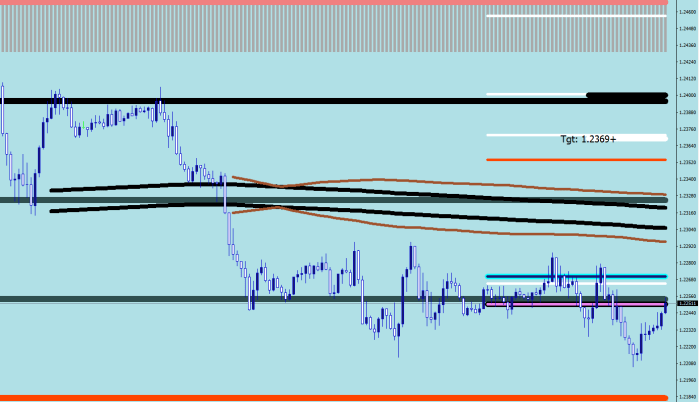
Energy limit beam shows what a single push (single discharge) could do from that high charge consolidation level-point that could be made in one direction. I wrote the routine in 2013. As you can see, nothing really ever changes in Forex.

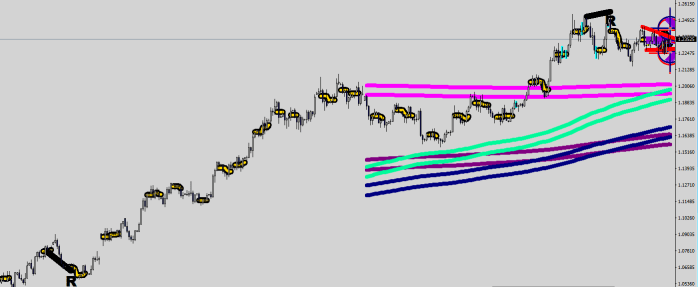
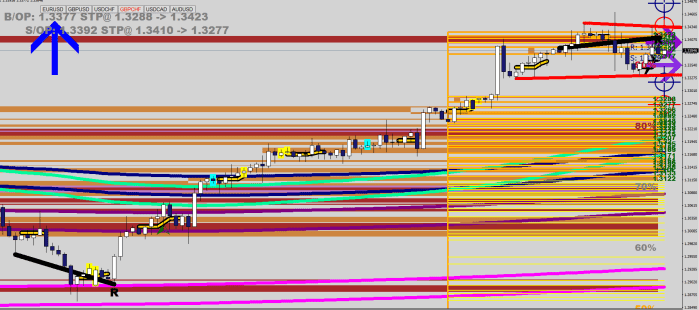
Scott Barkley is talking about 1.1953 and 1.1783 referring to somebody by the name of Fibon Acchi ๐Ÿ™‚

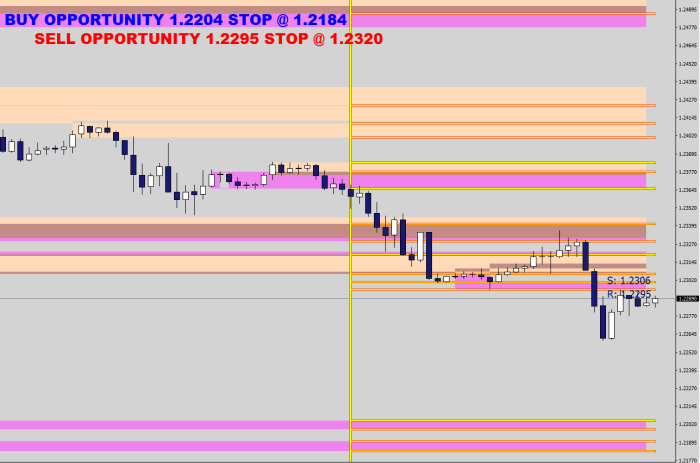
I see a projected distance target at 1.2226-29 and two layers of foundations at 1.2204 and 1.21295. I can’t say anything else, I’m not a target trader for crying out loud!

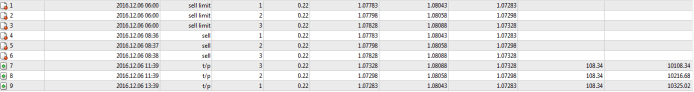
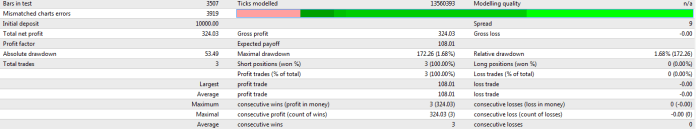
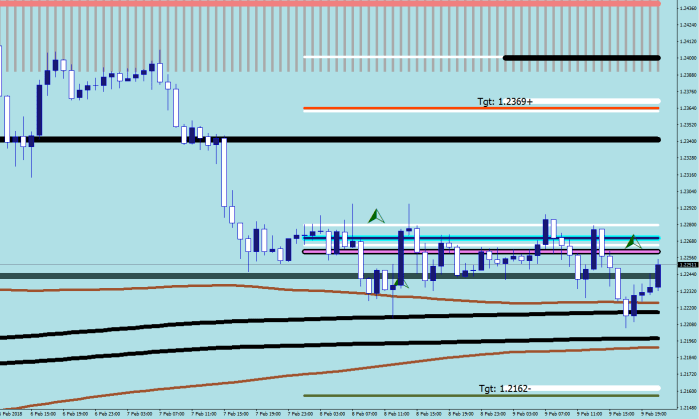
And if you excuse me, I would spend the next 3 minutes writing an algorithm that can act around the foundation levels with the 15 pips stop loss and start back testing soon afterwards.

Cherio!

EUR720

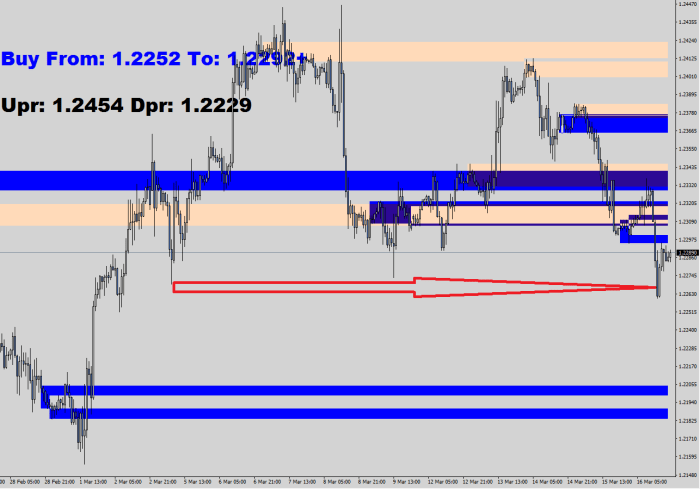
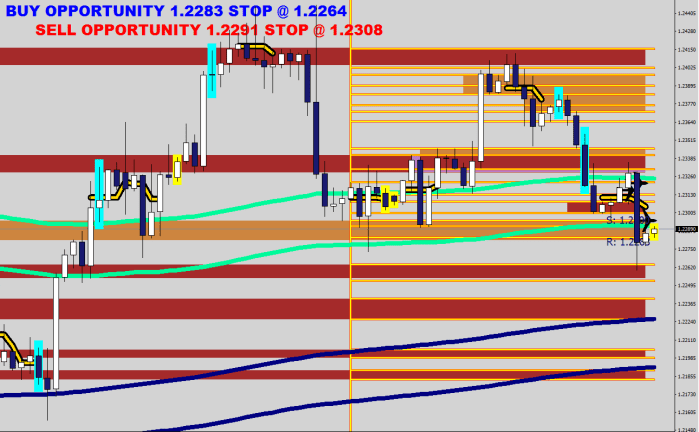
…after the press hours…

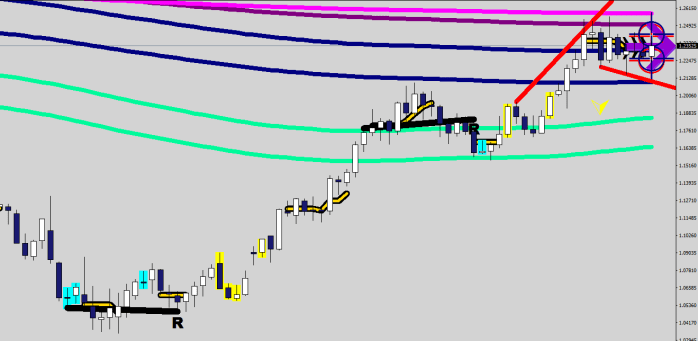
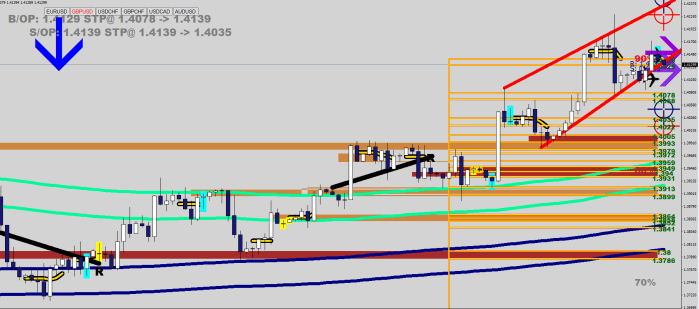
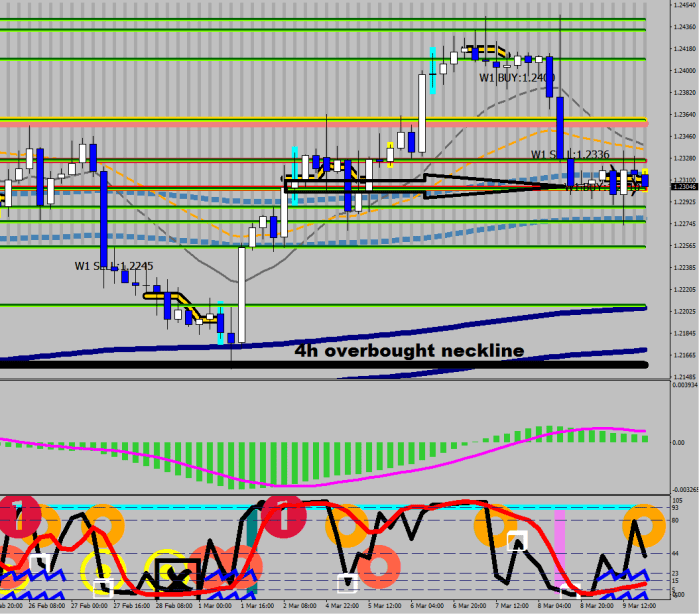
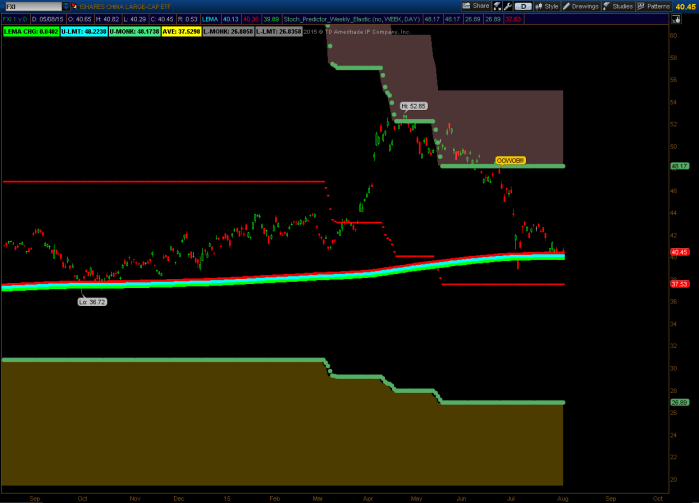
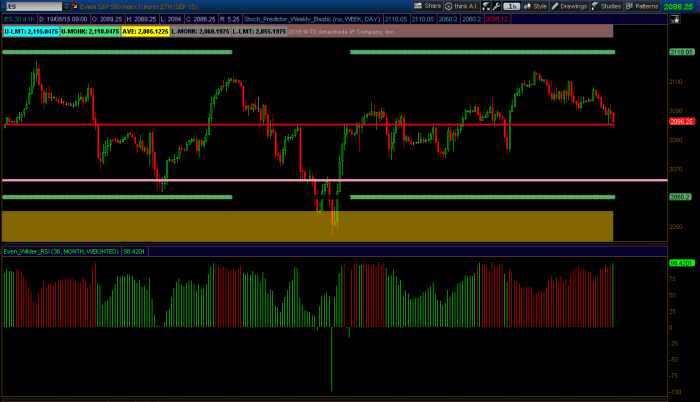
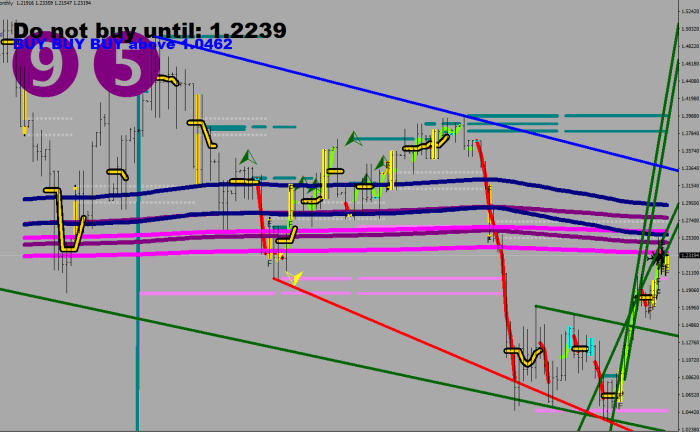
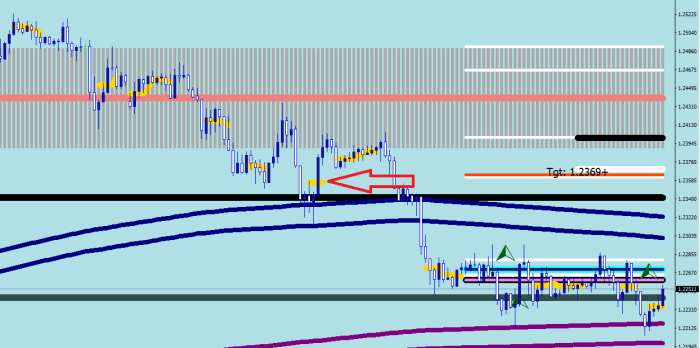
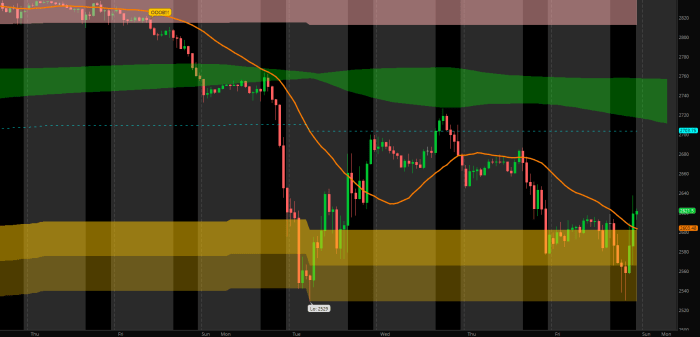
I was curious of the 4h version of the same thing (4×1 hour can be grouped arbitrarily, and would not necessarily yield the same results). It turned out that there actually was a support in the 1200 sample 4h History at 1.2264. See?

EUR722

Appendix:

# Buy Toย  – Sell To by Macdulio in 2013 for ThinkOrSwim

# Zigzag EMA Channel Targets included

input length = 36;
input price = close;
input reversalAmount = 0.6;
input showonlytoday = yes;
input displace = .9;

def ZZG = reference ZigZagHighLow(price, price, reversalAmount, 0, 1, 0);


def ZZG2 = if showonlytoday and !IsNaN(close(period = “DAY”)[-12]) then Double.NaN else reference ZigZagHighLow(price, price, reversalAmount, 0, 1, 0);

def zzSave = if !IsNaN(ZZG) then price else GetValue(zzSave, 1);
def chg = (price / GetValue(zzSave, 1) – 1) * 100;
def isUp = chg >= 0;

def flipu = if isUp == yes and isUp[1] == no then 1 else 0;
def flipd = if isUp == no and isUp[1] == yes then 1 else 0;

def EMA = ExpAverage(price, length);

def upval = if flipd then high[1] – EMA[1] else if flipu[22] != 1 and Sum(flipu, 22) < 2 then upval[1] else upval[1] * .8;

def upval2 = if flipd then high[1] – EMA[1] else upval2[1];

def dval = if flipu then EMA[1] – low[1] else if flipd[22] != 1 and Sum(flipd, 22) < 2 then dval[1] else dval[1] * .8;
def dval2 = if flipu then EMA[1] – low[1] else dval2[1];

def EMAP = if upval > 0 then EMA + upval * displace else EMAP[1] ;
def EMAP2 = if upval2 > 0 then EMA + upval2 * displace else EMAP2[1] ;
def EMAD = if dval > 0 then EMA – dval * displace else EMAD[1];
def EMAD2 = if dval2 > 0 then EMA – dval2 * displace else EMAD2[1];

def ema2 = if EMAP > .02 then EMAP else Double.NaN;

def ema3 = if EMAD > .02 then EMAD else Double.NaN;

plot ema44 = if EMAP2 > .02 then EMAP2 else Double.NaN;
ema44.SetLineWeight(4);
ema44.SetDefaultColor(Color.RED);

plot ema4 = if EMAP2 > .02 then EMAP2 else Double.NaN;
ema4.SetLineWeight(2);
ema4.SetPaintingStrategy(PaintingStrategy.DASHES);
ema4.SetDefaultColor(Color.YELLOW);

plot ema55 = if EMAD2 > .02 then EMAD2 else Double.NaN;
ema55.SetLineWeight(4);
ema55.SetDefaultColor(Color.BLUE);

plot ema5 = if EMAD2 > .02 then EMAD2 else Double.NaN;
ema5.SetLineWeight(2);
ema5.SetPaintingStrategy(PaintingStrategy.DASHES);
ema5.SetDefaultColor(Color.YELLOW);

input TF = {default “1 HOUR”, “78 MIN”, “4 HOURS”, “DAY”, “WEEK”, “MONTH”};
def CI = ( ( Log(Sum(TrueRange(high(period = TF), close(period = TF), low(period = TF)), 14) / (Highest(if high(period = TF) >= close(period = TF)[1] then high(period = TF) else close(period = TF)[1], 14) – Lowest( if low(period = TF) <= close(period = TF)[1] then low(period = TF) else close(period = TF)[1], 14))) / Log(10)) / (Log(14) / Log(10))) * 100;
input TFS = {default “DAY”, “WEEK”, “MONTH”};

def slkf = reference StochasticFull(77, 22, 9, 0, high, low, close, 1, “SMA”).FullK;
def diff = 100 – (75 – (slkf – (88 – CI))) * .8;

def dhi14 = Highest(high(period = “DAY”), 14);

def dlo14 = Lowest(low(period = “DAY”), 14);

def dei80 = dhi14 – ((dhi14 – dlo14) / 100 * 19);

def dos20 = dhi14 – ((dhi14 – dlo14) / 100 * 79);

def top = (dei80[2] – dos20[1]) * .7 + dos20;

def bot = (dei80[2] – dos20[1]) * .3 + dos20;

def ave = (top + bot) / 2;

plot dcr = if Crosses(if showonlytoday and !IsNaN(close(period = “DAY”)[-12]) then Double.NaN else diff, 62, CrossingDirection.BELOW) and CI > 34 and high < ema4 then high else Double.NaN;
dcr.SetPaintingStrategy(PaintingStrategy.ARROW_DOWN);
dcr.SetLineWeight(4);
dcr.AssignValueColor(if close > ave then Color.Red else Color.Yellow);

plot ucr = if Crosses(if showonlytoday and !IsNaN(close(period = “DAY”)[-12]) then Double.NaN else diff, 34, CrossingDirection.ABOVE) and low > ema5 then low else Double.NaN;
ucr.SetPaintingStrategy(PaintingStrategy.ARROW_UP);
ucr.SetLineWeight(4);
ucr.AssignValueColor(if close < ave then Color.DARK_GREEN else Color.GREEN);

AddChartBubble(if showonlytoday and !IsNaN(close(period = “DAY”)[-8]) then Double.NaN else flipd, high, “CHANNEL RE-ENTRY”, CreateColor(0, 162, 232), yes);
AddChartBubble(if showonlytoday and !IsNaN(close(period = “DAY”)[-8]) then Double.NaN else flipd, ema5, Concat(“CH TGT:”, ema5), CreateColor(0, 162, 232), no);

AddCloud(if high[1] > ema44[1] and close < ema44 then ema44 else Double.NaN, ema5, Color.BLUE, Color.BLUE);

AddChartBubble(if showonlytoday and !IsNaN(close(period = “DAY”)[-8]) then Double.NaN else flipu, low, “CHANNEL RE-ENTRY”, Color.RED, no);
AddChartBubble(if showonlytoday and !IsNaN(close(period = “DAY”)[-8]) then Double.NaN else flipu, ema4, Concat(“CH TGT:”, ema4), Color.RED, yes);

AddCloud(if low[1] < ema5[1] and close > ema5 then ema4 else Double.NaN, ema5, Color.BLUE, Color.BLUE);

def aim = if flipd then ema5 else if flipu then ema4 else aim[1];

def cmem = if flipu or flipd then 0 else if Crosses(aim, close, CrossingDirection.ANY) then 1 else Double.NaN;
def cmemh = if cmem != cmem[1] then cmem else cmemh[1];

plot chaim = if aim > .02 then aim else Double.NaN;
chaim.SetStyle(Curve.SHORT_DASH);
chaim.AssignValueColor(if cmemh > 0 then Color.BLACK else Color.YELLOW);
chaim.SetLineWeight(3);

AddLabel(aim > .02, Concat(“CURRENT CHANNEL TARGET TO AIM FOR: “, aim), if aim < close then Color.RED else Color.GREEN);

def distance = (ema2 + ema4) / 2 – (ema3 + ema5) / 2;

def dc = Crosses(high[1], ema2[1], CrossingDirection.BELOW) or Crosses(high[1], ema4[1], CrossingDirection.BELOW);
def uc = Crosses(low[1], ema3[1], CrossingDirection.ABOVE) or Crosses(low[1], ema5[1], CrossingDirection.ABOVE);

def stup = if dc then high[1] + distance / 2 else stup[1];

plot stupper = if showonlytoday and !IsNaN(close(period = “DAY”)[-20]) then Double.NaN else if stup > .02 then stup else Double.NaN;
stupper.AssignValueColor(if close > EMA then Color.RED else Color.DARK_RED);

def LEMAU = ExpAverage(high, 36 * 23);
def LEMAL = ExpAverage(low, 36 * 23);

def prevdmove = (high(period = “Day”)[1] – low(period = “Day”)[1]) / ((high(period = “Day”)[1] + low(period = “Day”)[1] + close(period = “Day”)[1]) / 3) * 100;

AddChartBubble(if showonlytoday and !IsNaN(close(period = “DAY”)[-8]) then Double.NaN else stupper[1] != stupper[2] and stupper < LEMAU, stupper[1], Concat(“SELL TO:”, stupper), if prevdmove < 1 then Color.RED else Color.GRAY, yes);

def stdn = if uc then low[1] – distance / 2 else stdn[1];

plot stlower = if showonlytoday and !IsNaN(close(period = “DAY”)[-20]) then Double.NaN else if stdn > .02 then stdn else Double.NaN;
stlower.AssignValueColor(if close < EMA then Color.MAGENTA else Color.PLUM);

AddChartBubble(if showonlytoday and !IsNaN(close(period = “DAY”)[-8]) then Double.NaN else stlower[1] != stlower[2] and stlower > LEMAL, stlower[1], Concat(“BUY TO:”, stlower), if prevdmove < 1 then Color.MAGENTA else Color.GRAY, no);

AddChartBubble(if showonlytoday and !IsNaN(close(period = “DAY”)[-8]) then Double.NaN else CI[2] < 34 and CI[3] > 34, close[2], “CI GUIDANCE”, if prevdmove < 1 then Color.MAGENTA else Color.GRAY, no);

def stdn2 = if uc then stdn[1] else stdn2[1];

plot stlower2 = if showonlytoday and !IsNaN(close(period = “DAY”)[-20]) then Double.NaN else if stdn2 > .02 then stdn2 else Double.NaN;
stlower2.SetDefaultColor(Color.BLUE);

AddCloud(if high > ema4 then high else Double.NaN, low, Color.GREEN, Color.BLACK);
AddCloud(if low < ema5 then high else Double.NaN, low, Color.RED, Color.BLACK);
AddCloud(if high > ema4 then high else Double.NaN, low, Color.GREEN, Color.BLACK);
AddCloud(if low < ema5 then high else Double.NaN, low, Color.RED, Color.BLACK);

AddLabel(high > ema4, “ABOVE CHANNEL BUYING!!!”, Color.GREEN);
AddLabel(low < ema5, “BELOW CHANNEL SELLING!!!”, Color.RED);

AddLabel(yes, Concat(“DISTANT CHANNEL RISK: “, if AbsValue(close – ema4) > AbsValue(close – ema5) then AbsValue(close – ema4) else AbsValue(close – ema5)), Color.MAGENTA);

input TF2 = {default “4 HOURS”, “DAY”, “WEEK”};
def price2 = hl2(period = TF);
input length2 = 88;

def realPart = fold indexR = 0 to length2 with accuR = 0 do accuR + GetValue(price2, indexR, length2 – 1) * Cos(2 * Double.Pi * indexR / length2);
def imagPart = fold indexI = 0 to length2 with accuI = 0 do accuI + GetValue(price2, indexI, length2 – 1) * Sin(2 * Double.Pi * indexI / length2);
def phase1 = if AbsValue(realPart) > 0.001 then ATan(imagPart / realPart) else (Double.Pi / 2 * Sign(imagPart));
def phase2 = if realPart < 0 then phase1 + Double.Pi else phase1;
def phase = if phase2 < 0 then phase2 + 2 * Double.Pi else if phase2 > 2 * Double.Pi then phase2 – 2 * Double.Pi else phase2;

def “Sine Wave” = Cos(phase);
def “Lead Wave” = Cos(phase + Double.Pi / 4);
def ZeroLine = 0;


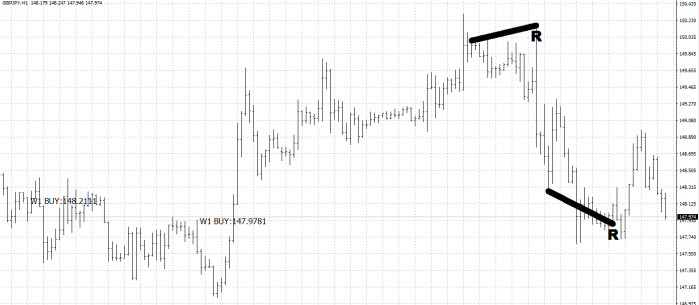
def support = if “Lead Wave” crosses above “Sine Wave” then low else support[1];
def resistance = if “Lead Wave” crosses below “Sine Wave” then high else resistance[1];
plot s = support;
plot r = resistance;

AddCloud(if low < r and close > r then stupper else Double.NaN, r, Color.CYAN, Color.CYAN);
AddCloud(if high>s and close < s then s else Double.NaN, stlower, Color.CYAN, Color.CYAN);

AddCloud(if low < s and close > s then stupper else Double.NaN, s, Color.CYAN, Color.CYAN);
AddCloud(if high>r and close < r then r else Double.NaN, stlower, Color.CYAN, Color.CYAN);

EUR718


The Week In Trades 10/ 2018

The soft rains of April are over. Hard work starts now. Dissecting the trades of the week to gain practice on what to look for, how to think.

As a lead up to this article, I suggest you read the post I made prior to this, the Moving Averages – Water & Mud line.

Sunday Night started with an exhaustion gap up, and came an immediate pullback afterwards. The gap up was your clue to a wave 3, and you had a shorting opportunity back to the 1h LEMA. The 1h LEMA was a buy on the 2nd touch, when the stochastics were out of oversold, and with the first move up you printed the first wave up of Wave 5. This upon penetration would provide the launching pad for the continued move up.

All this was playable based on the 1h readings.

EUR686

Reminder of the gap’s quaility:

Gaps

After this, the right time frame was the 30 minute, you were looking for the end of W5, which was possible to do by watching the MACD.

EUR687

Following that, there was First Blood, that came down to the 7.5 minute LEMA. Since normally I do not have this displayed, here’s the

_LEMA_Quadย (infested with maggots)

that would plot this on the 30 minute time frame. I’m trying to spare you having to go down to 15 min you see.

EUR690

The 30 minute momentum was on hold your shorts all along the spike happening back up to knock out some stops above the high. Remember that this is a possibility.

I no longer call Lemas defletors, I refer to them as wind tunnels. Here are the 4h lines:

_Deflectors_Neon

From the latest peak, the correction would have to bring the hourly Stoch to oversold at least twice,ย  for even an ABC would do that but 5 waves definitely.

As for practice, answer the following questions for me on the chart below:

EUR691

1. Why was this a sell

2. Why was this a sell

3. Is this a buy?


The 3rd is a little bit of a trick question, it is locally oversold (black RSI2 on the oscillator) but if you go down to the 30 min, you have oversold stochastics, you are at the 1h LEMA with the fan blowing from below. It is a premature buy at least – in case a lower low would show up to set a divergence. The middle of the spinning top, the 1h LEMA and the pro volume should provide you with enough support (throw in 1.23 and the 70% hourly comfort line for good measure). Yes, you would need to flip the hourly river, but it can be done: the mud line was already violated.

EUR693


One more thing, the FXE has proper volume, that can help with determining the seriousness of a peak or a bottom.

FXE

sign of weakness reprise…

EUR694

EUR695


Moving On – Water Line & Mud Line

This is not the complete article, it is just something I wanted to post before I forget. I shall continue with this page later on.

The following image & comment was my inspiration for this 2-part series:

USOIL Completd 0

I was absolutely certain that this OIL short was not gonna work out. Was considering posting it to my blog, but… there is not much audience here, and paricularly not in the Crude gender.

XTI

He did not have the crucial deflector (2H Lema) displayed on his “price action” chart.

Frankly, on my cell screen this was not plotting either – yet another difference from the desktop version.


Water & Mud are The River, the two moving averages that I use. MACD signal line: the location of the fan blowing.

Water line is a 16 EMA HL2.

Mud line: 36 EMA.

MACD: 48,104,9

Best time frame for these averages is 1h, second best is 15 min and the third is 30 min.

EUR688

EUR689

I know, I used have the beautifully shaded High Tide Low Tide TOS charts (still there on my old blog). Keeping it simple came with the different platform. I miss those deep blue, semi transparent, colluding shades though.

gbp96

All this does not mean that for instance the SSO SDS strategy of Craig does not work. Not at all. If you want to buy an hourly pullback beyond the 8 EMA and put your stop beyond the 21, feel free to do so.


Moving On With The Averages: The LEMA

I was never really a moving average guy… But then came the bear of 2011.

It was crucial for me to figure out the sudden transition, the 2 weeks of relentless selling and the 6 months of hopeless recovery. I could not proceed until I had done this. I lost 150k on 3x leveraged TNA etfs, and an additional 60k on trying to play weekly call options on SPY on three different occasions. Little did I know about the bear lasting 6 months.

Ultimately I found that the LEMA was responsible for giving support, and although an EMA does not seem to make sense when it comes to large numbers such as 23×36, it served me well since and I kept it. I often refer to it as a Reset; the market makes a run for it every time to correct out of an oversold/overbought condition and go neutral. While it is at it, on a second touch most likely a reversal would take place.

To make it more visible, I had 3 colors based on the highs, the closes and the lows.

FXI3

As you can see on the image below, ES pulled the breaks towards the LEMA, if I displayed some cloud around it, this was the first touch on it, and the second would be somewhere in the middle of the LEMA for a complete reversal.

ES067

The next image shows a H&S turn at an oversold Comfort level – and has my Even Wilder RSI indicator on the bottom.

ES060

At times I would display simply a cloud for eliminating many of the unwanted lines.

828 is the number it all started with, and on the daily time frame. But this thing seems to be present everywhere, on every time frame.

If the current time time frame is 1h, the 828 is the associated LEMA. Yet, you can display the 30 minute LEMA at once, which would come out to 414, and the 2-hour LEMA that would be 1656. As you can see, on MT4 I’m only displaying the highs and the lows. Rememer, there is a cloud around them.

EUR668

You can see that the LEMA configuration is bullish.

If your base is 4h, the following LEMA’s are the 2-hour, 4-hour and the 8-hour. And yet again, bullish config.

EUR671

The daily has a semi-bearish configuration with a cross over having taken place recently.

EUR672

While the weekly looks like a mess with a potential turn taking place, it is also in a neutral zone, and if the LEMA congestion gets cleared, little would be in the way of the progress. Not much other than the edges of the imaginary clouds.

EUR673

…and perhaps the upper trend line…

EUR674

Do you seeย  anything strange on the monthly LEMA configuration?

Invasion of the Worms

You knew this was coming… My completely new approach of defining what a consolidation meant. Enjoy!

Art10


EUR5656

_Wormin

EUR659

Above: if GBP/CHF has a wedge and is stalling out… That is bullish for EUR/USD.

USDCAD16

USD/CAD has great downside prospect, so, Oil has great upside prospect? Oil upside potential = dollar inflation…

The crossroads>

EUR660

60 – X – reversal

A semi automated trading routine

semi_auto

_60_X_Reversal_3x 26-50

#property copyright “Copyright ยฉ 2017, Macdulio”
#property description “V1.0”
#property description “60 -X- reversal by Macdulio”
#property description “puts out 3, limit orders exipring in 3 hours”
#property description “with 26 pips stops and 50 pips targets”
#property description “with equity adjusted size, 1.5 then 3 pips apart”
#property description “program it on ALT + X”
#property description “don’t forget to remove the EA”
#property description “once the orders are placed”
#property link “http://forexfore.blog&#8221;

#include <stdlib.mqh>
#include <WinUser32.mqh>

extern int magic_number = 47;
int counter = 0;
extern double Leverage = 3.0;
extern int OrdersNow = 5;
extern int Slippage = 3;
extern int Stop_Loss = 26;
extern int Take_Profit = 50;
extern double AF=1.3;
extern double LT=17;
double pivot[];
double PriceL ;
double PriceH;
extern int maxlines = 15;
extern int displaylength = 55;
double lines[];
double mid[];
extern int pipApart2 = 1;
int i,pos,c_b=Bars;
int init()
{
ArrayResize(lines, maxlines);
ArrayResize(mid, c_b);

ArrayInitialize(lines, 0);
ArrayInitialize(mid, EMPTY_VALUE);
return(0);
}

int start()
{
int expiration;
double Price = WindowPriceOnDropped();
int slippage;

mid[0]=EMPTY_VALUE;

pos=0;
for (i=0; i<=c_b-1; i++)
{

if (iATR(NULL,60,3,i)>iATR(NULL,60,3,i-1) && iATR(NULL,60,3,i)> iATR(NULL,60,3,i+1) && iATR(NULL,60,3,i)>0.0010 && iATR(NULL,60,3,i)>(iATR(NULL,60,3,i+1)+iATR(NULL,60,3,i+2)+iATR(NULL,60,3,i+3))/3*1.25) mid[pos]=iHigh(NULL,60,i)-(iHigh(NULL,60,i)-iLow(NULL,60,i))/2;
if (iATR(NULL,60,3,i)> iATR(NULL,60,3,i+1) && iATR(NULL,60,3,i)>0.0010 && iATR(NULL,60,3,i+1)>iATR(NULL,60,3,i+2) && iATR(NULL,60,3,i+2)>iATR(NULL,60,3,i+3) && iATR(NULL,60,3,i+3)>0.0010) mid[pos]=iHigh(NULL,60,i)-(iHigh(NULL,60,i)-iLow(NULL,60,i))/2;
if (High[i+2]<High[i+1] && Low[i+2]>Low[i+1] && High[i+1]-Low[i+1]>(High[i+2]-Low[i+2])*2 && iATR(NULL,60,3,i+2)>0.0010) mid[pos]=iHigh(NULL,60,i)-(iHigh(NULL,60,i)-iLow(NULL,60,i))/2;

if (mid[pos]!=EMPTY_VALUE) pos=pos+1;

}


i=0;
while(i<2 && pos>0)
{
if (i==pos) break;
if (mid[i]!=EMPTY_VALUE) lines[i]=NormalizeDouble(mid[i],5);
i++;
}

double account = AccountEquity();
double Lots = NormalizeDouble(LT/3000000*account*AF*Leverage,4);

double price12,price2;

int ticket1,ticket12,ticket2,error;
int NrOfDigits = MarketInfo(Symbol(),MODE_DIGITS);
int PipAdjust;
if(NrOfDigits == 5 || NrOfDigits == 3)
PipAdjust = 10;
else
if(NrOfDigits == 4 || NrOfDigits == 2)
PipAdjust = 1;
expiration=CurTime()+10800;

slippage = Slippage * PipAdjust;


PriceL = lines[0]+10*Point;
PriceH = lines[0]-10*Point;

price12 = NormalizeDouble(PriceH+pipApart2*Point*PipAdjust,Digits);
price2 = NormalizeDouble(PriceL-pipApart2*Point*PipAdjust,Digits);

PriceH = PriceH+3*Point;
PriceL = PriceL-3*Point;


for (i=OrdersTotal()-1; i>=0 ; i–)
{

if(OrderSelect(i,SELECT_BY_POS,MODE_TRADES)==false)
{
Print(“Access to orders list failed with error (“,GetLastError(),”)”);
break;
}
if (OrderMagicNumber()==magic_number )
counter = counter +1;

}

double increment = NormalizeDouble(15 * Point * counter, 5);

if(Bid<price12 && counter<4 )
{

ticket12=OrderSend(Symbol(),OP_SELLLIMIT,Lots,price12+increment,slippage,price12+increment+Stop_Loss*Point*PipAdjust,price12+increment-Take_Profit*Point*PipAdjust,”BEE 60 SELL LMT 3H 260/500″,magic_number,expiration,Black);
if(ticket1<1)
{
error=GetLastError();
Print(“Error = “,ErrorDescription(error));
return(0);
}

}

if(Ask>price2 && counter<4 )
{

ticket2=OrderSend(Symbol(),OP_BUYLIMIT,Lots,price2-increment,slippage,price2-increment-Stop_Loss*Point*PipAdjust,price2-increment+Take_Profit*Point*PipAdjust,”BEE 60 BUY LMT 3H 260/500”,magic_number,expiration,Black);
if(ticket1<1)
{
error=GetLastError();
Print(“Error = “,ErrorDescription(error));
return(0);
}

}

Sleep(490000000000000);
return(0);
}

semi_auto2


There Can Be Only One

A lot of ideas can be derived from the lingo, if you tune your own interpreting abilities.

– How is your defense?

What if this question does not refer to stop losses, but rather it is a reference to the ultimate low risk trade?

Wave 1 – smart money buys. Wave 3 – institutions buy. Wave 5 – retail buys. – Heard this one?

What do I think? I think: – Penetrating re-test of Wave 1: Smart money buys. Wave 5: smart money sells out. And that is all there is you need to know.

Now, all you need to do is:

1. become a Wave 1 defender.

2. figure out how to spot a Wave 1.

3. place your pending order with a stop loss of 15 pips

4. get the exit condition right (2. rejection at a deflector)


Wave 1 is usually miniscule compared to the full move.

EUR644

I do not pretend that I have the accurate, always working automatized code for finding a wave 1.

EUR645

What I’ve got so far is three lines that would find the last 3 crucial ones and would include some other, unwanted ones as well.


And a quick remark about where you would be looking for these waves to start from: from the deflectors.

EUR648

Deflectors are:

– LEMAs (414, 828, 1556)

– Recent outlying values = fresh new highs / lows

– Higher time frame consolidation weights – I started plotting these and calling them maggots


If you consider these you would suddenly start to understand the “path of least resistance” expression a whole lot more intimately.


EUR647


KGB Correctional Facility

The title is merely a reference for a connection to the previous post.

As it turns out, if I want to be precise and come up with a mathematical formula for what really a consolidation is, I cannot call the following thing a consolidation:

EUR635

That thing is burning time, which sounds like a consolidation, but if I define a consolidation by quick zig zag moves, that change the level of consolidation by at 5 percent in every 3 bars and reach a high charge towards the end, that flat thingy just does not qualify. What should it be called then? Pause? Partial recharge? Temporary exhaustion? It is basically a cobra lifting its head up a little for a second strike.

Life is funnier still. The thing on the left that I initially called an aborted consolidation, did in fact consolidate the price when it broke the high of the range it printed. So, our cobra bumped its lifting head into this golden bar, and price cracked it before the pause took place. Maybe one should not use time frames below 1h for consolidation values.

EUR637

On the monthly, we re-tested and got rejected from the consolidation level with the giant arrows. It would make sense to come down for a re-test of the previous base, or at least build another base. Did I say 1.1750? Make that 1.18 for now. The 4h Lema is at 1.2065.

EUR636

Are You Working With the KGB?

I said on these columns before, that the largest moves come from losing the overbought/oversold condition. Here is a most recent example.

SNP

Could anyone have known where the bottom would be before hand? I certainly did, thanks to my comfort levels. (Imagine how easy it could be to pick strikes for options!) Did anyone know where the bounce would come up to? Sure, 50% is was a great bet, but in reality, it was the Lema’s cloud.

SNP2

That candle with the wick back testing the cloud, is a Kiss Good Bye, or a KGB.


EUR629

KGB examples. The first circle was a french kiss. You can also see the gap down touching down at the bottom of the upper reversal zone (shaded). Gaps are signs of being in a wave 3.

Now, if you want to manage funds, you need to start using fund manager tools and apply fund manager thinking.

The sample size for the comfort levels – on TOS was set to 14 * 5.5 * 24 for Forex pairs and 14 * 5 * 23 – 20 for other. These numbers were as close as you can get to the maximum feed provided by the broker. The above images were 1H samples.

On MT4 the sample size had to be different, you get less data here. And this number is different per time frame. On a 4h you can have 1590 sample, on daily, 1025 is scratching it.

I’m not going to go into embedding, saving again. Instead I can elaborate a little on the tracking/mapping part.

On the above example you can see circled when the price, after a long rally finally violated the 80% line giving you a pullback exceeding 20%. This Sing Of Weakness defined the point when the market stopped mapping and started tracking. In other words, it settled the working range.

So, now you have one tool, a large sample high and low, the 10% lines in between and the proper, fund managing thinking that is based on percentages.

These, 10% lines (and the 5% ones at times) are the dividers between you having to act or not act.

There is also the understanding the consolidations based on their location and length that would help you out. Consolidations are for alleviating an exhaustion condition, with enough time given, the level of consolidation gets worked up to high enough for continuing with a move (by setting a new weight point at the current location).

To recharge the 1h energy you need at least 4 hours, which is 8 candles on the 30 minute.

EUR630

Now, if you are in Forex, you should be paying most attention to the 4h charts and the little brother, the 30m.

Now, what about the 5%’s? You need to keep an open mind and look up. Meaning, there may be an obstacle appearing on a higher time frame. Your evaluation points accordingly would be at the 5% strikes.

EUR631

I.e. this wrapping around the 60% line is probably due to the 4h hitting the bottom of the upper reversal zone (from 95% to 85%, shaded).

EUR632

As for why the 30 minute basis, your 3rd tool, the 3-daily ATR can answer that. 81 pips currently would allow for a 10% move carried out on a single day, the rungs on this frame are currently 71 pips apart.


Bonus image 1: Current Location of 1h LEMA+Cloud

EUR633

Bonus image 2:ย  Location of 30m LEMA+Cloud (check where the 30 min consolidation was taking place…)

EUR634

_LEMA_Triplet