Fractal Lines

An outcome of my recent, “condition + level” thinking.

GBP545

EUR626

It’s basically all Fractal levels plotted on the current time frame ruling out only a few, from right to left, those, that are within 5.5 pips of another one that was already registered.

EUR624

As for the line suggestions, consider the current trend, the prevailing trend line, and then think of the red lines. I made the calculations based on noticed behaviour of the 30 minute readings.

EUR625

_Fractal_Lines

Skid Rock Stoch

Just a little upgrade to the label part of the Skid Rock.

1h readings are that I am most curious about, but this one works with local values.

Why the numbers so big? To be able to see them from the other side of the room.

Now there is also a discrepancy between the phone/tablet MT4 app iStochastic calculation and that of the desktop version. Somebody altered the code, for sure. Cannot correct this. On the phone I use the High-Low based calculation, on the desktop I went with the Closes.

EUR608

The numbers should turn red (above 92) or green (below 5), like so:

EUR609

Only in a wave 3 would you be able to sustain these numbers.

I had to convert the tens and the ones part of the double iStochastic reading and turn them into winding strings based on the integers received. There is a bit of rounding here of course.


int twodigits = NormalizeDouble(iStochastic(NULL,0,10,3,3,MODE_SMA,1,MODE_SIGNAL,0),0);

int tens = round(twodigits/10);

int ones = twodigits-tens*10;

string stens, sones;


switch(tens)
{
case 1: stens=CharToStr(140);
break;
case 2: stens=CharToStr(141);
break;
case 3: stens=CharToStr(142);
break;
case 4: stens=CharToStr(143);
break;
case 5: stens=CharToStr(144);
break;
case 6: stens=CharToStr(145);
break;
case 7: stens=CharToStr(146);
break;
case 8: stens=CharToStr(147);
break;
case 9: stens=CharToStr(148);
break;
default: stens=CharToStr(139);
break;
}

switch(ones)
{
case 1: sones=CharToStr(140);
break;
case 2: sones=CharToStr(141);
break;
case 3: sones=CharToStr(142);
break;
case 4: sones=CharToStr(143);
break;
case 5: sones=CharToStr(144);
break;
case 6: sones=CharToStr(145);
break;
case 7: sones=CharToStr(146);
break;
case 8: sones=CharToStr(147);
break;
case 9: sones=CharToStr(148);
break;
default: sones=CharToStr(139);
break;
}

_Skid_Rock_v1_2


The Hewlett Letter

Below: I don’t know how this looks to you with the 3 attacks on the skid rock support, but to me it looks like an accumulation. EOD may has printed the “root”.

EUR559

Last Weekly Pro volume was just above 1.16, and nothing since. If this is an ABC correction up, it would imply A=C, and this would put price 1580 pips higher by the end, which is 1.32, the pivot/median weekly level on the comfort levels.

EUR562

The daily is particularly interesting, for it was too early to print another fractal on Friday. One of my next topics would be the letter “h”, when I get around to it. Basically you cannot successfully take out the fresh, terminal high/low within 5 samples.

The daily shows the need for more consolidation. 5 waves were spent. If you look at the triple low in line with the blue skid mark, it is a very similar low to what we just printed on the 30 min with the check marks. So, you are not going to get an immediate new high, but a lift off and a don’t look back. Check the cyan shaded pro volume locations: it looks like the root of the 3rd set of the triple waves.

EUR563

1H comes back with an interesting result: there is a pro volume doji, that they may be protecting on every fall back, which may result in a gap up on Sunday.

EUR564

If not, they still have 2 more entries lower, one at the overbought comfort level (black), and one just below it, as shown on the 30 min. Check the guidance numbers on the next one as well:

EUR565

The momentum is heavily negative as well, which means a buy in an uptrend. Above 1.2250 you will have the 4h pivot taken out, and do not fight this. It would want up.

Since the pullback was larger than 25% and smaller than 40%, you would have to have 2 more days pass buy below the high of 1.2323 before you can decisively take it out. A try before that would fail back down. (With a deep pullback, you can rush things, and clear the obstacle on the 4th sample.)

EUR566

I use the Fib as a percentage tool. I am looking for 25, 40 percent, just as I said. I do not believe in the notion of the “big boys have Fibonacci built in their tools”, for the big boys have 1 tool: a dial button on the phone.

One suicid way of taking out the high in 2 days would be to undercut the low of 1.2163, reverse the same day, and rally through the high on the next.  I am not suggesting that this would happen, and currently am positioned against it. Can you, with the knowledge just gained, tell me why the break of 1.2163 would be doomed to a failure?


EUR572


EUR560

EUR568

Three reds pushing on the previous week’s high.

Everyone can see this:

EUR570

Who can see this?

EUR571


EUR574


Anyway The Wave Counts

No, not trying to be an E.W. analyst here. There some ideas that were admittedly first found/acknowledged by them.

This is RSI2 and the thinking it prompts.

A Wave has to go overbought/ oversold at its peak to be called a wave (in general, >75 or <28), and the end of wave is closing the distance (80->44 or 23->54)  (Froot Loops)

SOB = Shot over the Bow – Warning of a direction change

EUR552

On the 4h, get an idea of the wave you are in. Think ahead, i.e. in a Wave 2 scale in to the direction of wave 1 to be present at Wave 3 – and you do not need to sell until an SOB shows up (normally a wave 4).

Wave 5 normally would exceed Wave 3 if the overall direction is

The 30 min, 15 min can give you further details about a consolidation, the direction of the break, etc.

On higher time frames the odds are low that an SOB would register.

I do not count the Waves on 1H, but it is good time frame for finding RSI(2) divergences.

EUR553

I put the hand and sleeve markers in (sleeve buy / sleeve sell).

_RSI2_Shaded

Enjoy!

EUR554


EUR555


The Measuring Leg

The concept of a Measuring leg in the World of 4H is simple. It is a 12-sample Low or High RSI2 read, that does not fit the pattern.

Once the measuring leg is printed, you should have ample time (3-10x 4hours on avg) to set up your low risk entry.

If you have downloaded my Skid Rock, you would have the low risk levels themselves plotted already. I synced up the strips with Skid Rock’s Teal and Violet plots to further ease the thinking. There is only one more thing to be taken into consideration, and that is the single most crucial piece of information that can aid anyone’s trading. This is of course the answer to “Which Wave the price is in currently”?

To get good at this there are 2 images at the bottom for starters.

EUR544

if (Period()==240 && RSI2[i]8){ LowBuffer[i]=8; HighBuffer[i]=92; }
if (Period()==240 && RSI2[i]>92 && RSI2[ArrayMaximum(RSI2,12,i+1)]<92){ LowBuffer2[i]=8; HighBuffer2[i]=92; }

_divergencepetr_s6

I have the oval plots (end of wave signals) now good enough do make proper counts with, at least on the long side. A Wave 4 can be a Shot over the bow, thus that particular measuring leg is not part of the count, merely part of the reversal. capeesh?

EUR542

EUR543

Skid Rock

The last goodie I can give you for 2017. Happy New Year!

EUR526

#property description “Skid Rock – break outs that matter”
#property description “to keep you on the right side…”
#property description “play the break, every time”
#property description “they are skid marks/divergences”
#property description “showing participants trapped”
#property description “stops beyond the lines!”
#property description “suggested use: 30 Min”

Skid Rock V1.1 in the downloads

USDCHF11

USDCAD015

EUR527

RSI2 Wave-Reading Expressions

What I would not be getting into is talking about the possibility of re-arranging the time line by grouping up all happenings to a wave close regardless of the duration it took to develop, for this would require clean, real time data feed that does not come cheap and a whole lot of programming say in Python. But the idea is given, the partially digitalized readings dictate a rhythm that totally disrespective of the clock.

EUR501

I have promised some definitions and so here they are. They are current as of today.

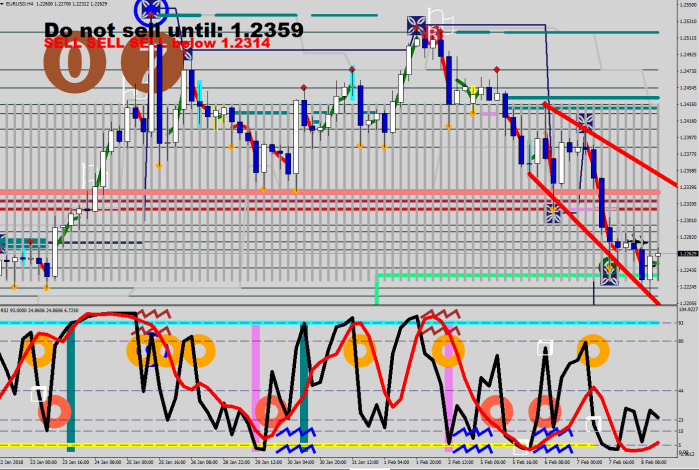
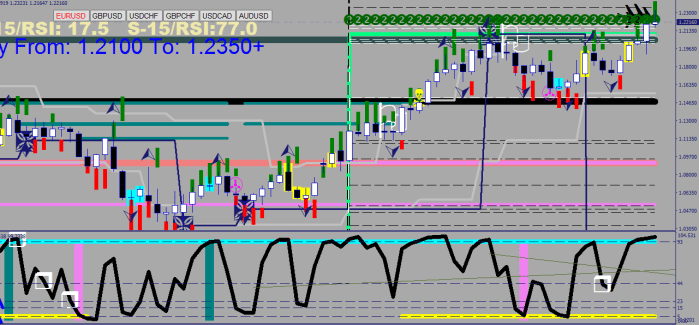
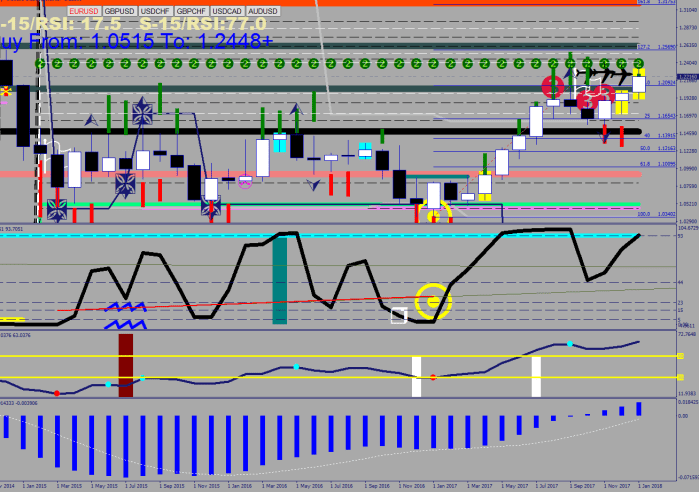
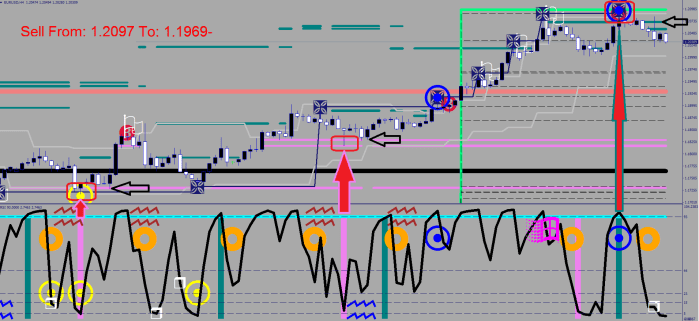
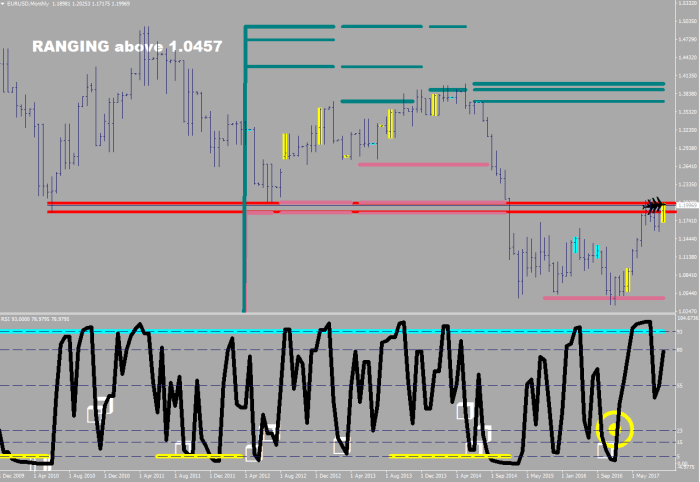
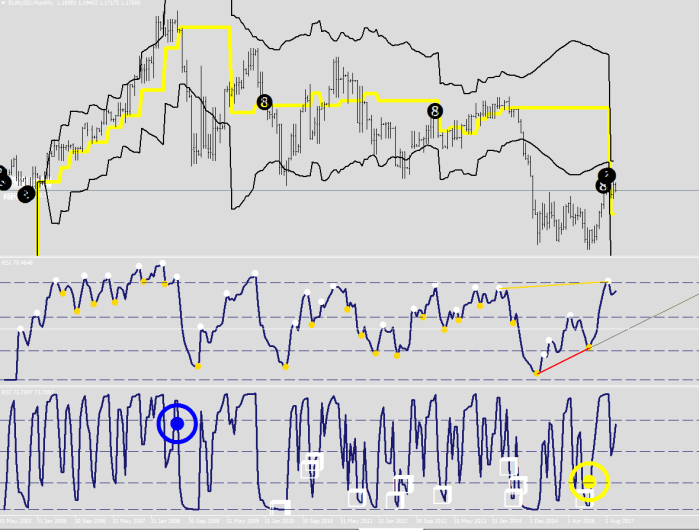
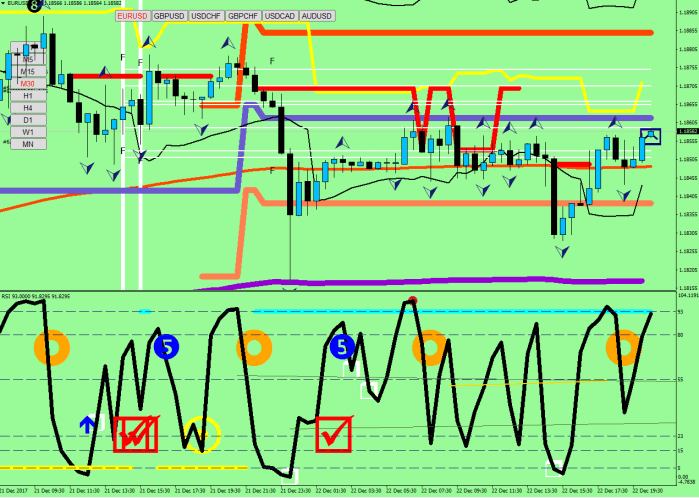
If you start scrolling back on the posted RSI2 indicator, you must know this: the readings before the 4h divergence would not had been plotted before the divergence was set, for I use the last direction as a filter for the plots.

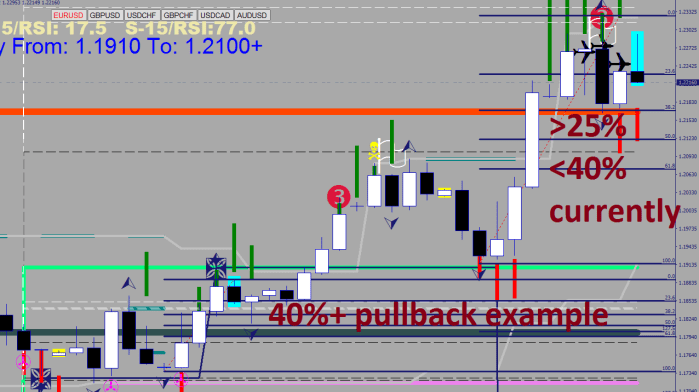
I am currently discussing the upside here with the 4h direction showing positive.


RSI2:

I have already posted the

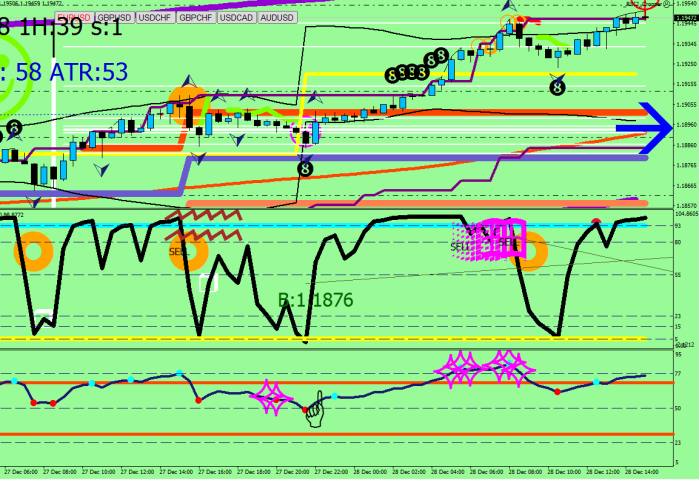
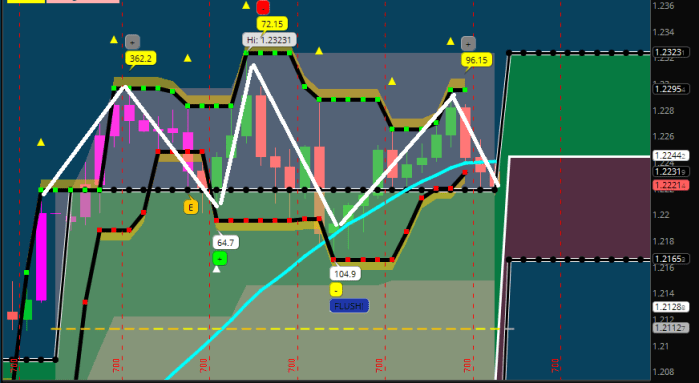
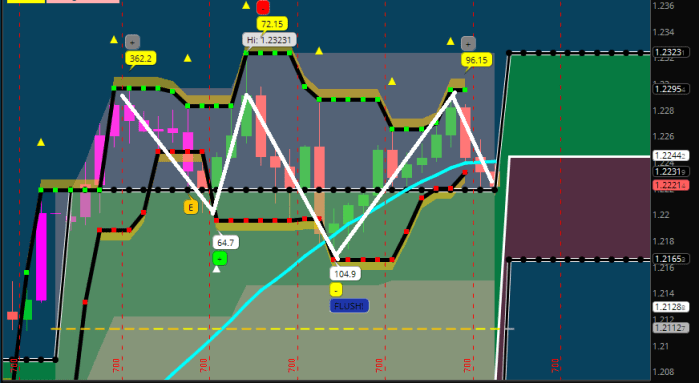
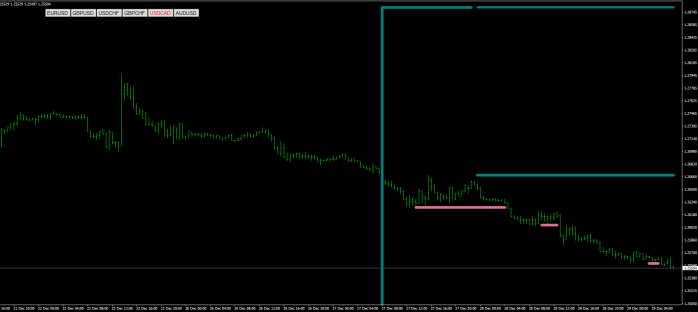
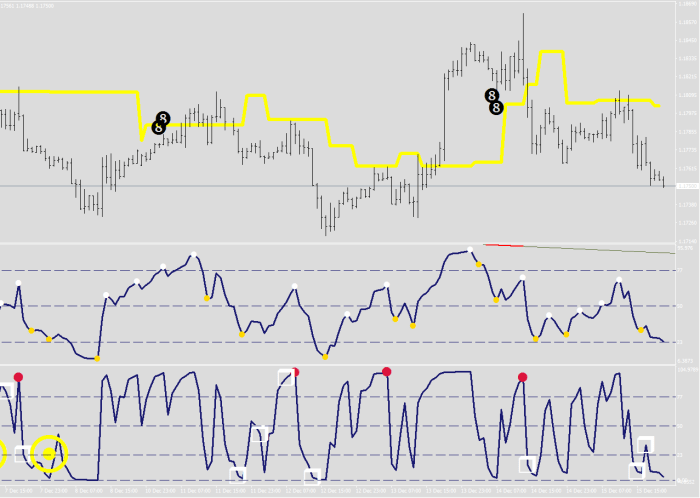
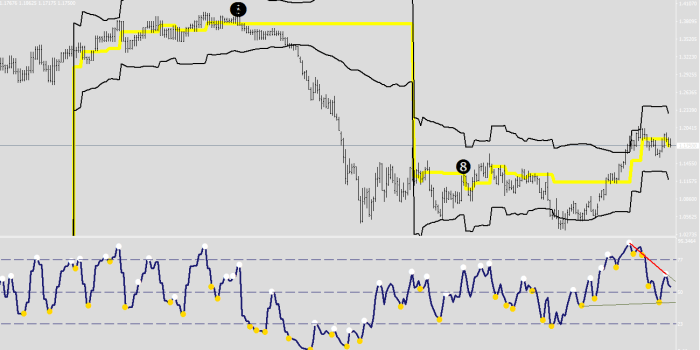
8-Ball conditions, but here they are again. For plotting the #8-s I use 10 pips displacement, but when calculating with the values (such as for the CIA label, I have the displacement decreased to 5 pips.

if (iRSI(NULL,0,2,PRICE_MEDIAN,i)>96.5 && Close[i]70) marker2[i]=High[i]+.001;

if (iRSI(NULL,0,2,PRICE_MEDIAN,i)LowBuffer3[i+1] ) marker2[i]=Low[i]-.001;


Sign of Stength:

RSI2[i+1]>50 && RSI2[ArrayMaximum(RSI2,8,i+1)]==RSI2[i+1] && RSI2[ArrayMinimum(RSI2,10,i+1)]<12 && RSI2[ArrayMaximum(RSI2,9,i+1)]direction ) strength[i]=23;


Too Fast Buying / Failure or #5 condition

((strength[i+1]==23 || strength[i+2]==23 ) && (RSI2[i]>85 || RSI2[i+3]>80 ) || (RSI2[i]80 && RSI2[i+3]<40 && strength[i+4]==23)  ) fail[i]=73;


End of Wave signal = Down Cross

(((RSI2[i]<44 && RSI2[i+1]>93) || (RSI2[i]<44 && RSI2[i+2]>93) || (RSI2[i]<44 && RSI2[i+3]>93)) && !DX[i+1] && !DX[i+2])

DX[i]=True; oval[i]=72;


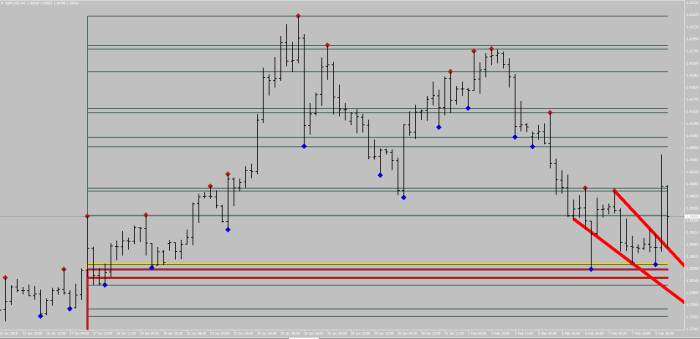
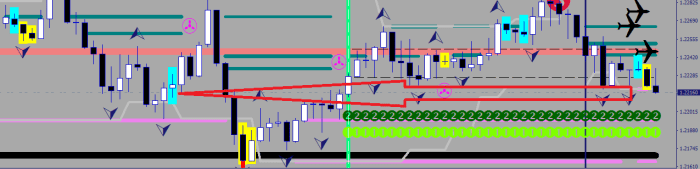
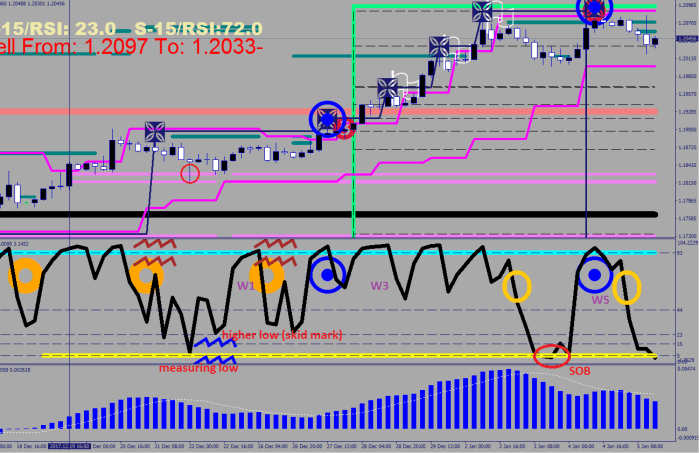
Sliders aka skid marks (oiling up the road to a break out by trapping some people)

RSI2max[i]=RSI2[ArrayMaximum(RSI2,5,i)];
RSI2min[i]=RSI2[ArrayMinimum(RSI2,5,i)];
if ( Period()==30 && ufractal[i]==1 && i92 && RSI2[i]<92) slider[i]=93;
if ( Period()==30 && lfractal[i]==1 && i<200 && RSI2min[i]8) slider2[i]=8;

EUR518


candle flame burning out

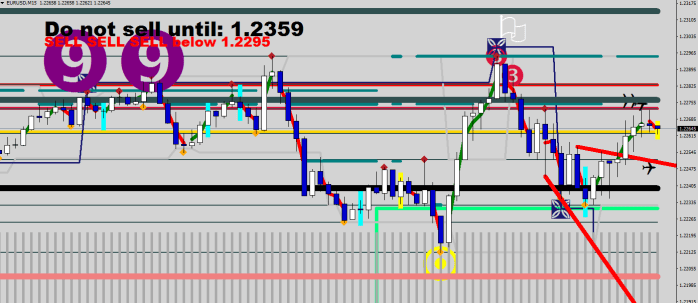
Period()==15 && RSI2[i]65 && RSI2[i+1]97 && RSI2[i+5]>97 && RSI2[i+6]>97 && RSI2[i+7]>97  fifteenout[i]=73;

EUR535


As per bonus, here are the

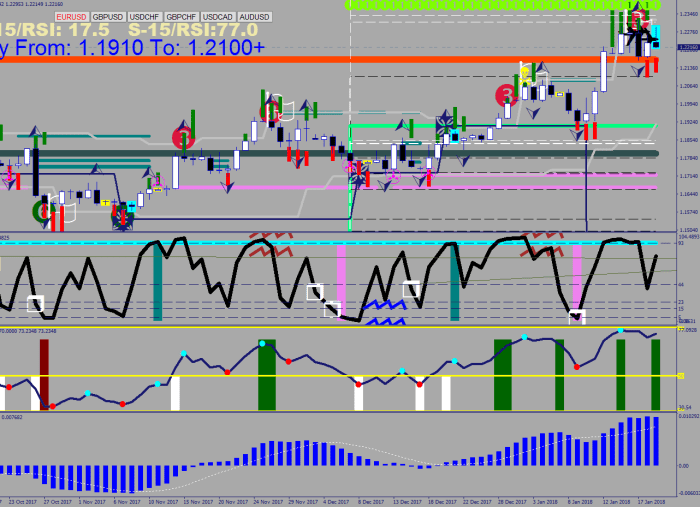
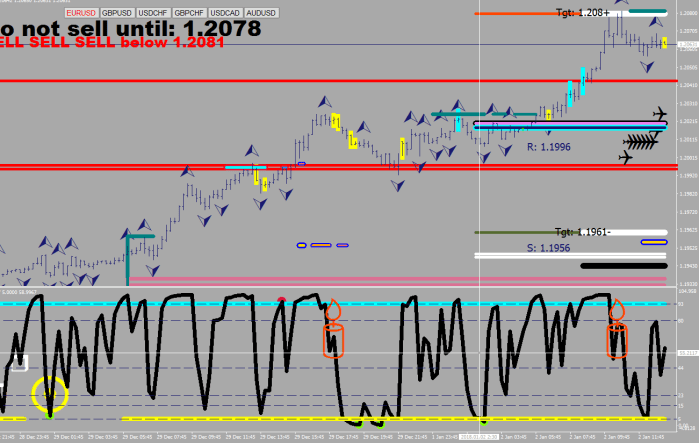
4h momentum divergence expressions:

if (iLow(NULL,240,i)>=iLow(NULL,240,j) && exit4[j-1]==EMPTY_VALUE && MACD4[i]<MACD4[j] && MACD4[i]<0 && MACD4[j]0 && iFractals(NULL,240,MODE_LOWER,j)>0 && RSI4[j]<35 && RSI4[i]j && iRSI(NULL,240,2,PRICE_MEDIAN,j)>.5 ) exit4[i]=iLow(NULL,240,j)-.0002;
if (iHigh(NULL,240,i)MACD4[j] && MACD4[i]>0 && MACD4[j]>0 && iFractals(NULL,240,MODE_UPPER,i)>0 && iFractals(NULL,240,MODE_UPPER,j)>0 && RSI4[j]>75 && RSI4[i]>RSI4[j] && ArrayMaximum(MACD4,50,j)>j && iRSI(NULL,240,2,PRICE_MEDIAN,j)<99.9) exit4[i]=iHigh(NULL,240,j)+.0002;
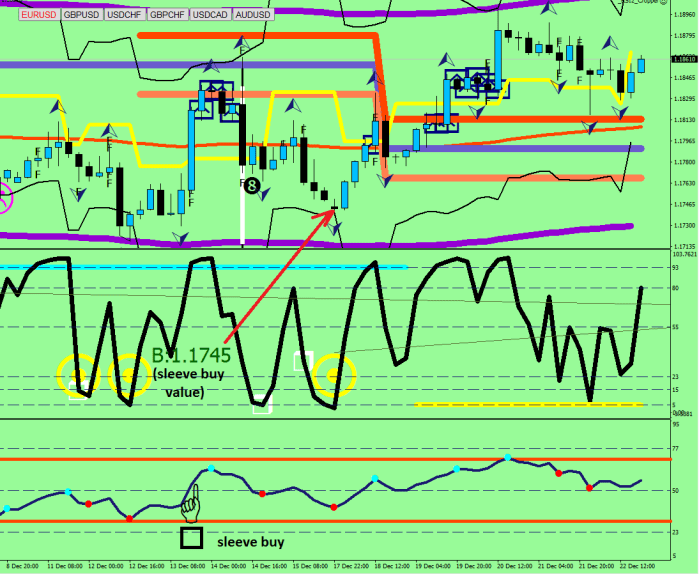
 

Hands

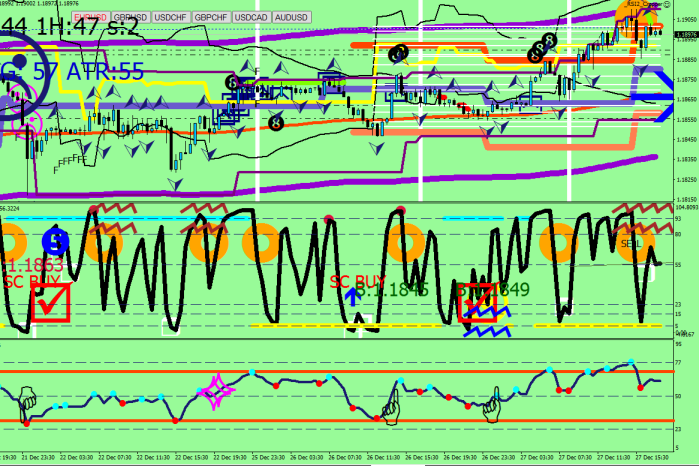
Derived from RSI 8 readings, mainly for 15 min+ (t3_Oscil is the array for the RSI readings), (ultra fast moves) – buy / sell the sleeve = 10 pips away bewyond the secure point is a low risk area to make a bet on the direction of the sudden move :

Hand up:

if (t3_Oscil[i]<t3_Oscil[i+1]*.6 && t3_Oscil[i+1]t3_Oscil[i+1]*1.4 && t3_Oscil[i+1]>32 ) hdn[i]=t3_Oscil[i+1];

EUR506

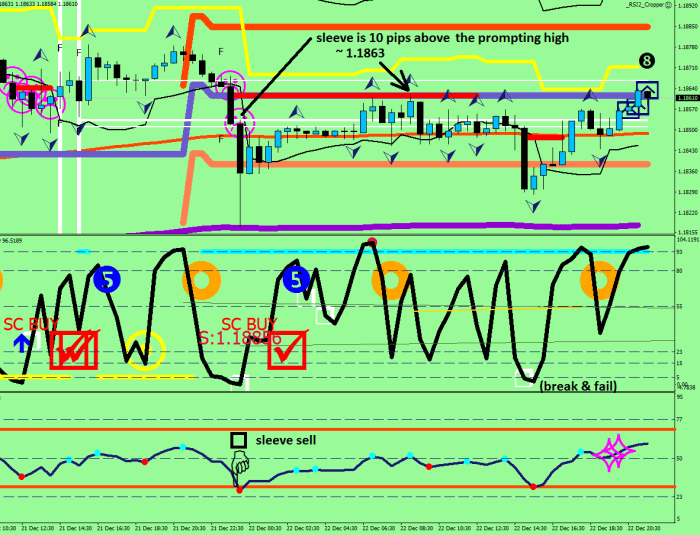
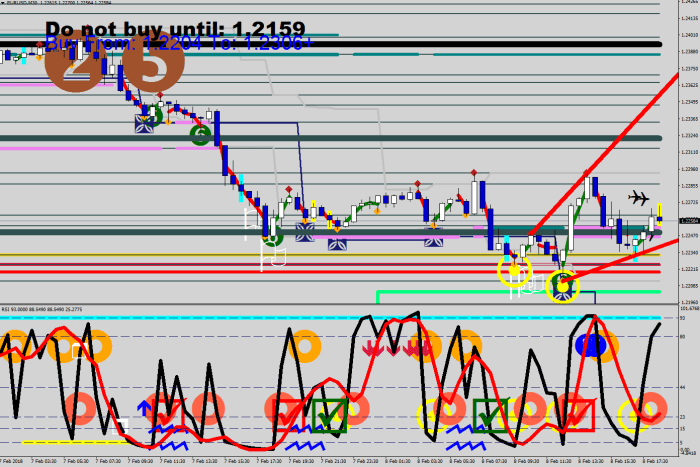
At or below 15 minutes I had to reach after a different trick finding the base value – the 6 period high / low :

PriceL[i]= NormalizeDouble(iLow(NULL,0,iLowest(NULL,0,MODE_LOW,6,i))-100*Point,6);
PriceH[i]= NormalizeDouble(iHigh(NULL,0,iHighest(NULL,0,MODE_HIGH,6,i))+100*Point,6);


Still RSI 8,

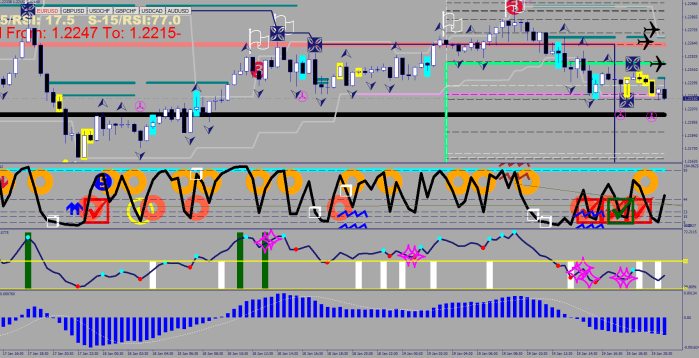
Scurry readings are fast moves to alleviate much too oversold/overbought conditions – measured on a 5 sample span. You need to disregard these if a hand recently was prompted in the opposite direction. Since a Scurry Buy is happening against the real direction, it is in effect a sell into rally.

Scurry buy:

t3_Oscil[i+1]t3_Oscil[i+1]+40

Scurry sell:

t3_Oscil[i+1]>75 && t3_Oscil[i+6]<t3_Oscil[i+1]-40


EUR507


Too Strong (better sell) – the window of selling into strength opportunity:

RSI2[i+1]92 && iRSI(NULL,0,16,PRICE_MEDIAN,i)>80 toostrong[i]=80;

EUR521

Boot Camp #5 – Timing is Money

A few things here first for I cannot remain without comments any longer.

I read this response tweet today by A.K. who is famous for bragging about his 90% fundamental, 10% technical trading method.

It was referred to Bitcoin, but overall was on an attack on T.A. itself.

“err no if you think something is goin down 100% or up 20,000% ,WTF does a candlestick or a moving average or an rsi or a doji or a wave have to do with anything? It is total BS.”

I personally think that any data in charted format can help with gaining more grasp on what is happening, and a technical indicator can help you with determining optimal entry and exit levels, hence they are providing you with an edge in the market.

I do understand the conviction part, I get it.

I have the following conclusion to draw from this: Raj must be trading options with your firm on A “fundamental basis”. Apple fundamentally is a pure straddle… Or was it a saddle?

Craig Severson is famous for his Iron Condor trades, which are non-directional plays. Yet, as supplementing income he would not pass on an good RSI2 trade, where ANY instrument closes with a below 2 RSI2 reading and play the long side immediately i.e. spy via the 2x leveraged SSO until the RSI2 gets back above 70 to get out and book profits (not that different from the Trin trade). Why would you pass out on the aid of the RSI?


Tell me, why not utilize something like my Channel Target indicator?

EUR484

Is it a disadvantage to know a day ahead until when it is worth to hold your short/long for after a re-entry into the channel? What is wrong with making money easily? Of course, you may have X-Ray vision that can time travel into the future, and so you would be in possession of all these levels otherwise, on a 90% fundamental basis (a Singapore driver license definitely a good qualifier for this).

While we are at the topic, it is worth mentioning that the quoted person is selling education (the oldest scam in the book) with promo movies about vacation travels to kick off the pricey tuition period. Live it up, people!

Anybody who show you cars, vacations, wealth, watches, brags about money are scammers and so they should be avoided. If you hear anybody mentioning “price action”, run away immediately! As Simple Ton put it, “What happened to people’s brains? Did they turn into Mash?”

(Don’t even get me started on that low life Greg Secker…) John Carter? A seasoned sales man who can provide for his gambling habits in creative ways.

What about me? I share my knowledge and findings for free on this blog that I’m paying for. I code indicators and automated routines to aid my own trading, I share most things at no cost, and others I would only give out at for a small price. No one has ever purchased a single indicator from me, but that is not my loss.


Ok. Grumpy part over with. Different tone now.

Today you get to see the sun. We’ll pay a visit to the beach. Bring your camera too!

(after the arrival)

Let’s take in the scenery! A panoramic view everyone!

EUR486

At once so much motion, the tide… is currently going out, the waves are full of strength!

The chart window shows the 4h divergences , the blue and yellow bulls eyes. These mean that some institution purchased / sold and by those points, this is obvious, measurable in the form of a momentum divergence.

The indicator window plays around with the idea that you may not need a lower low / higher high for a secondary divergence, it is enough to close up on that low/high.

You, as a Forex trader are nowhere on this scenery. When you buy or sell, you simply make a bet at your broker about the guessed direction of the price. You do not purchase anything just as a person who is betting on a horse, does not buy any piece of the animal.

If you happen to trade Euro futures, at least you purchase something. The right to sell or buy the Euro by a given time.

Once a 4h divergence was set, some institution stepped and took a position. This may be for speculative reason or because of getting out of a trade or simply to park the money in a lower risk currency temporarily. Either way, this would show up as a momentum divergence.

Now, we capture images of the waves. Set your exposure rate to 30m, gentlemen!

EUR485

What do we see here? Morse? Yes! There are S.O.S. signals. No, they do not mean Save Our Souls. They mean Sign Of Strength. A sort of a prelude before the triplets.

Since we had a yellow 4H divergence, until that given level is broken, we are only interested in surfing the waves to the upside. Of course there can be another, opposing titan stepping up to the plate or the institute itself can roll out/reverse the position, but the price’s relationship to one single level would remain obvious.

Once you have an SOS sign, you want to get in on the coming wave as close to the previous low (that the SOS wave started from), as possible.

Then you need to stay in, but not over stay; wave 2 would be printing the left shoulder, and wave 3 would be the head/failure.

I just made an EA two days ago that licks through the open positions and hooks them up with a stop loss when it spots the 3rd push coming on strong (it reaches after the previous 15 min low minus 2 pips upon the fact that the position would be in gains by at least 5 pips – to pay for the dues of course).

As you can see, it is possible to know which wave you are in, and these end-of-wave signals can be plotted as well as the arrows for where the stop loss should be ratcheted closer.

EUR487

I had 8 years of trading and asking an infinite number of why-s and trying every idea under the sun that yielded me this. I suggest you to listen, even if all of this costs you nothing but your attention. It cost me 200k in US.

Should have purchased a supercar, eh?

red check marks for SOS long entries…

EUR488


The 8-Ball Levels

8 ball in here stands for

-> the one to tackle and

-> hard to crack

The idea is simply this: RSI 2 tracks the sudden moves, RSI 8 the regular ones.

If something is suddenly peak overbought within the overbought field, that location would remain something of an extreme, a divider. Same thing on the oversold side.

So, you are going to see these appearing from now on, and may make it into the current read field.

if (iRSI(NULL,0,2,PRICE_MEDIAN,i)>96.5 && Close[i]70) marker2[i]=High[i]+.001;
if (iRSI(NULL,0,2,PRICE_MEDIAN,i)LowBuffer3[i] ) marker2[i]=Low[i]-.001;

EUR470

I guess if my last name was Carter, I would have come up with a more superstitious name for this, such as Voodoo Levels.

EUR471

This of course takes us back to the EUR gap up of 2017.

Why was it necessary?

EUR472

EUR473

EUR474

Boot Camp #4 – Lock Step

Now you have an understanding of how the market is jay-walking.

As a next step, we need to get your movements right.

First thing is that there is no general trading. Buying and selling without any system is merely scrambling about, and this kind of hit and miss “trading” brings shame to the “trade” in general.

Optimal trading is when the trade does not move much against your direction (minimal stress) and you are in it for as long as it is feasible (maximal gains).

The trading I am about to teach you is an optimal one.

You have to be patient. You must wait for the right condition. Always.

Get the bias right: Download the Compass Line for free.

You already know that the heads are the targets.

What would be your entry then? A head? Wrong!

Your entry is always a failure. A failure at the left shoulder.

You need to make limit buys with buy stops: when the price passes by the left shoulder, you must place a buy stop above the price. (Or simply buy a Reversal EA routine from me for $99 – my routine is actually following the price 2 pips behind until it punches into it.)

Once you have the entry right, your exit would be:

– for half position the first deeply oversold (80) hourly RSI(8, hl2

– for the remainder, you want a momentum divergence on the 4h chart (later about this)


Here is a little preview on how the left shoulders operate. I made this for 1h or 30m.

_Compass_Left_ShoulderV1_1

EUR452

Homework: how much of your shorts should you have covered at 1.1732?

Instead of closure to this lesson now I’m going to show a piece of a conversation that I conducted with an imaginary student today.

— Teach, about the Euro sell off lately. Instead of over analyzing things, would not be better simply to notice the failure/divergence at the Deeply overbought level of 1.1918 on your Comfort Levels indicator and make a bet that price would correct back down to the overbought neckline of  1.1742?

— Bravo! That’s exactly what happened. You can think well on your feet. You would make an excellent fund manager. The percentages, such are 5, 10, 20% movements are things to keep an eye on and make decisions by. These numbers are for real, unlike the Fibonacci ones that are only in your head. I started writing my memoir about trading. I have not settled on the title, but it has a subtitle already. “From Fish of Blood to Blood of Fish”. I would like you to be the first one to read the first chapter.

EUR453

eur454