I have a lot to write about, so here is something else in the meantime.
36 was never meant to be merely an indicator.
The path to turning it into an EA came naturally.
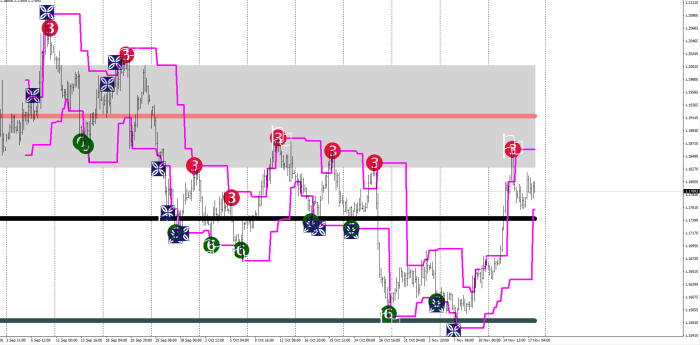
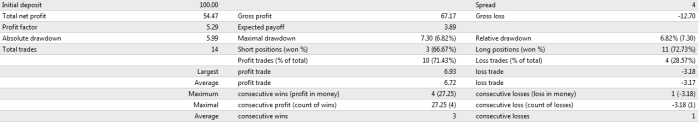
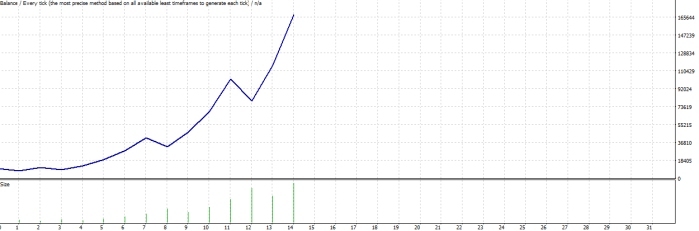
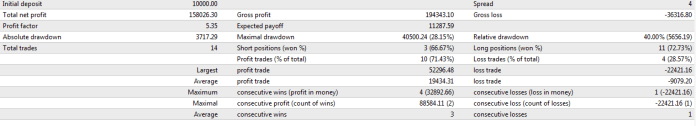
The sizing is equity dependent, and currently would figure 1 micro lot per $100.
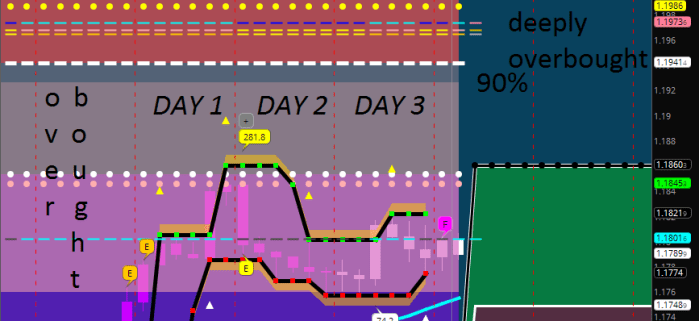
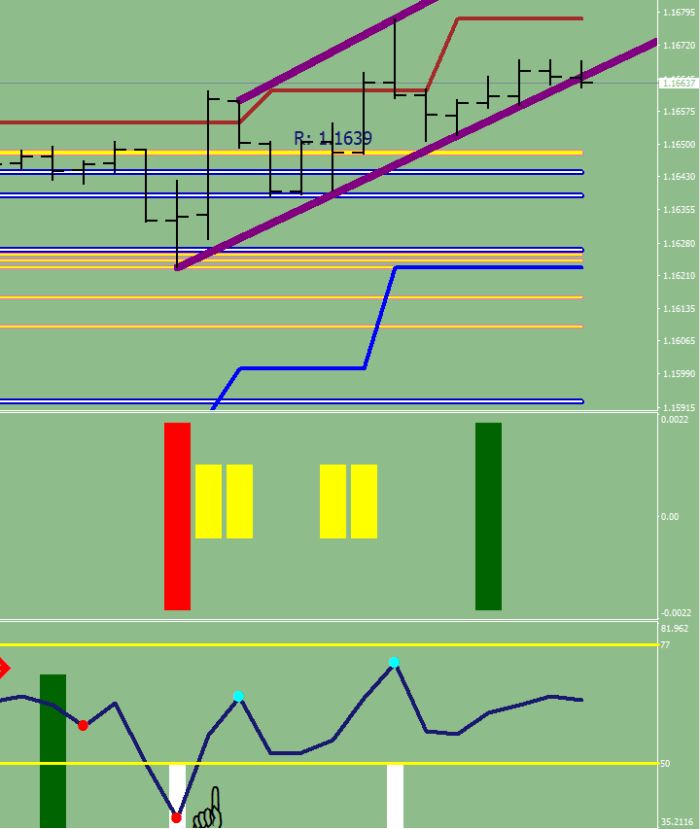
There are things to play with from size (here called Leverage), stop loss, target, magic numbers, close in pending seconds, EA choke flag and the RSI values (4H, 8 sample HL2).
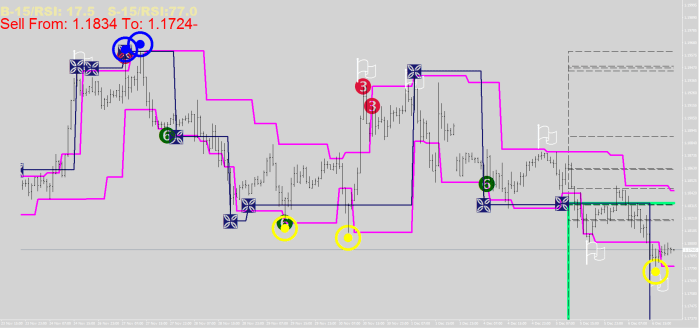
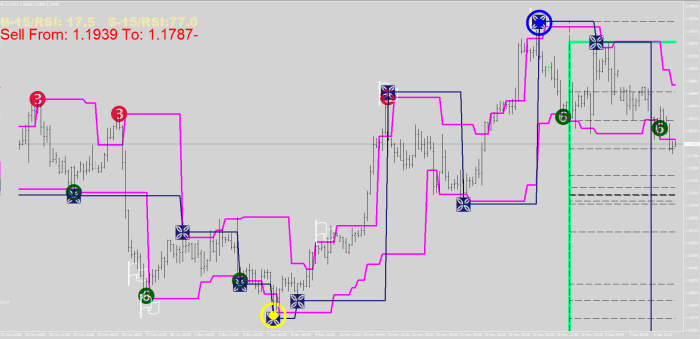
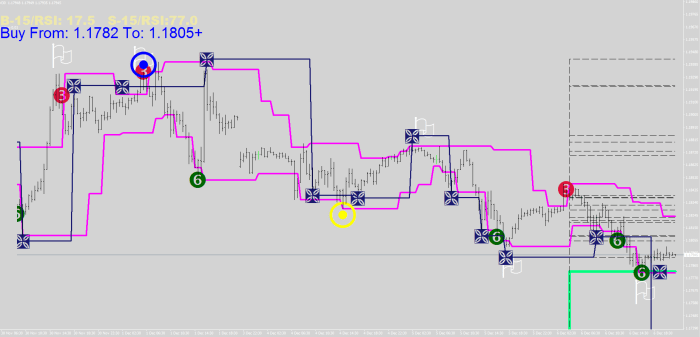
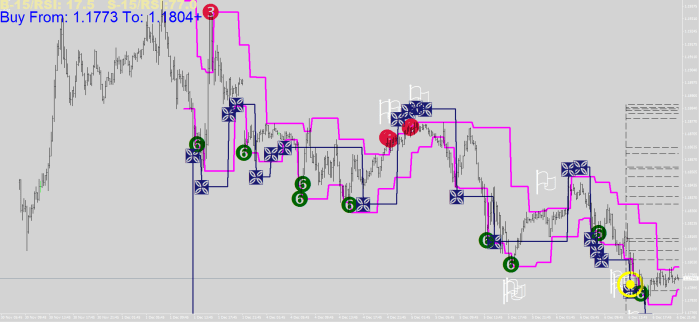
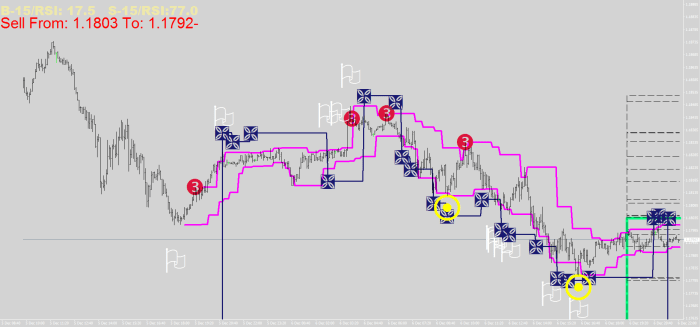
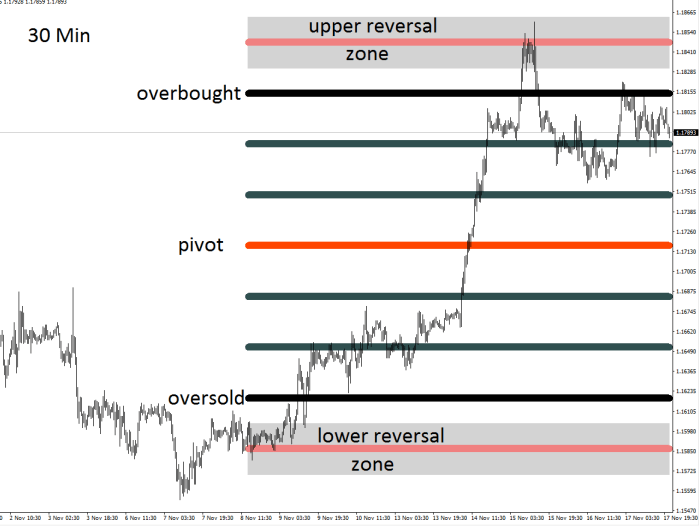
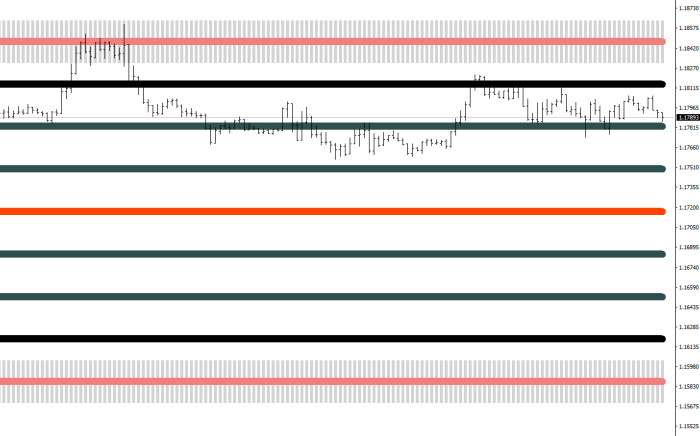
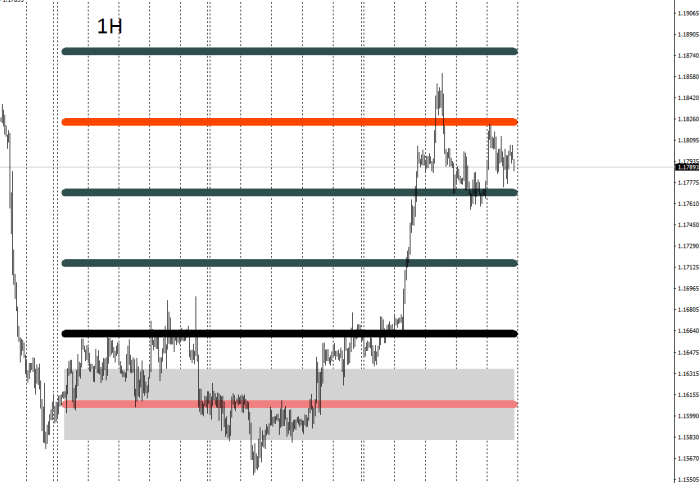
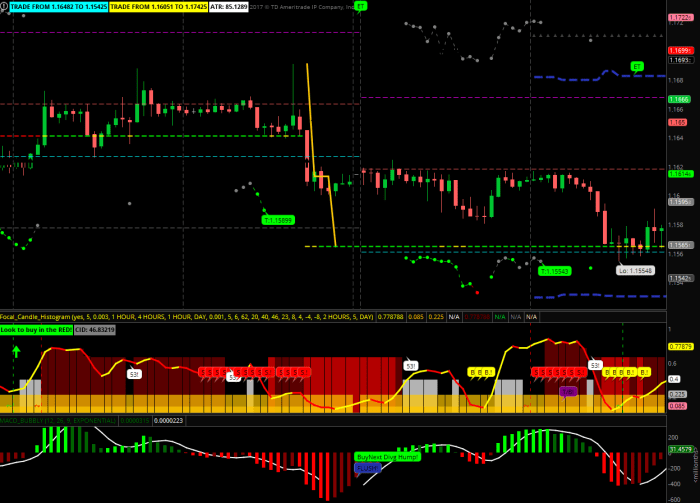
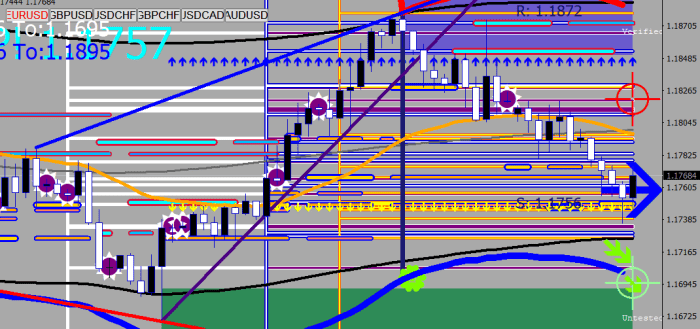
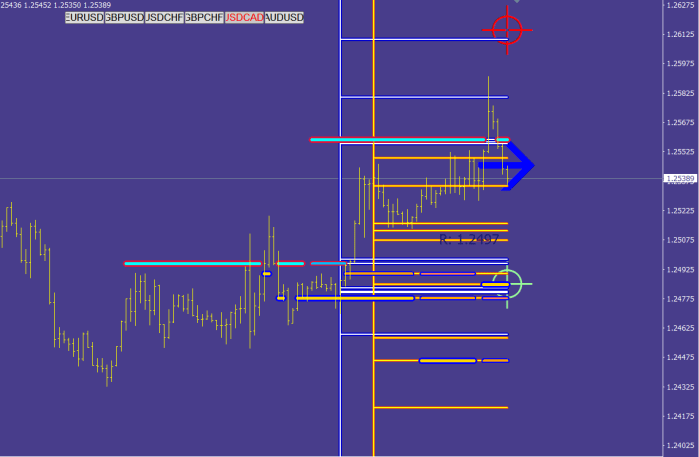
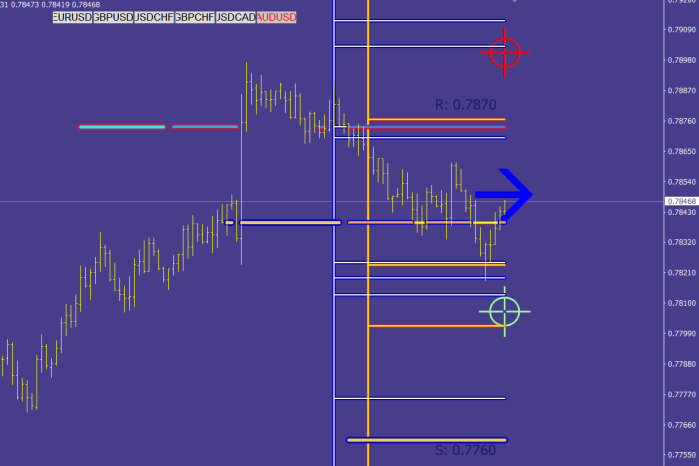
– Try this only on EUR/USD if your spread is low, variable, not fixed (mine is 0.2 pips on average, the test image was done with 0.4 pips),
– peg it onto either a 4H or a 30M chart – and turn auto trading on.
I shall make this available for a limited time only.
Apologies: I forgot that the Leverage was not external in the previous posted version, so the visitors 100 count starts now, the first 31 does not matter.

…expired…
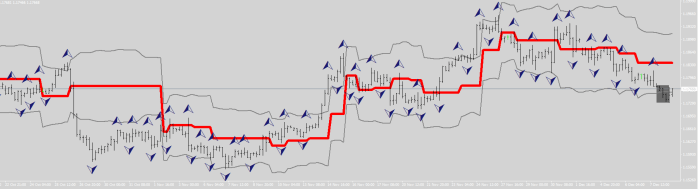
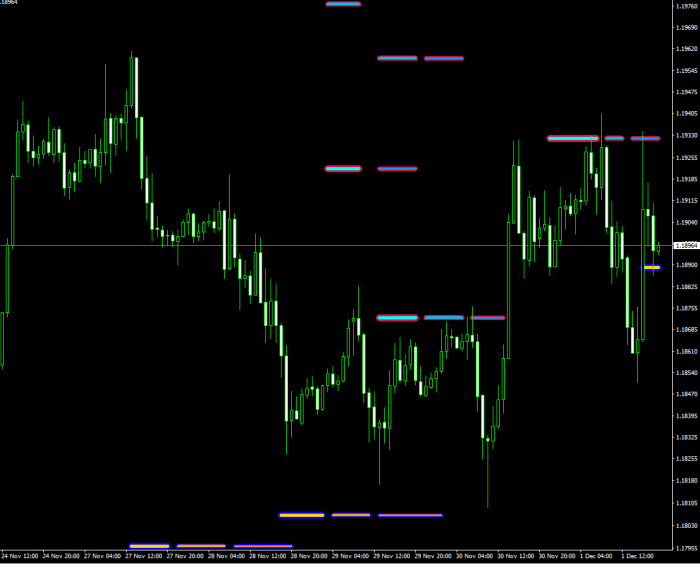
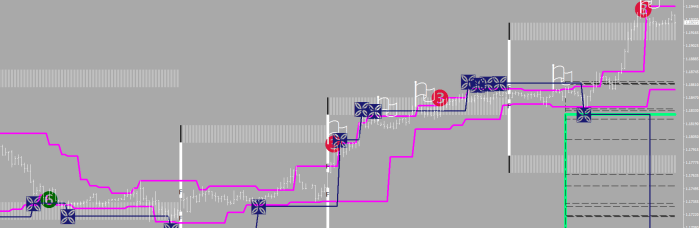
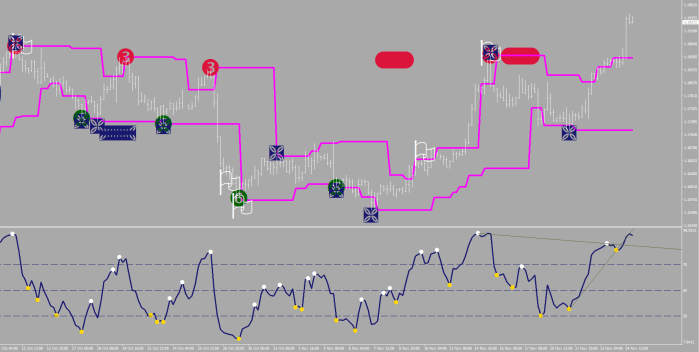
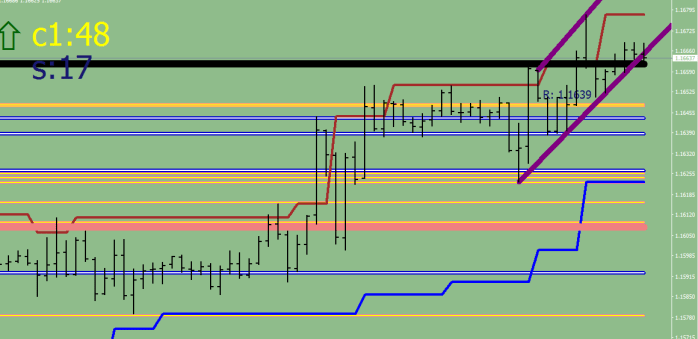
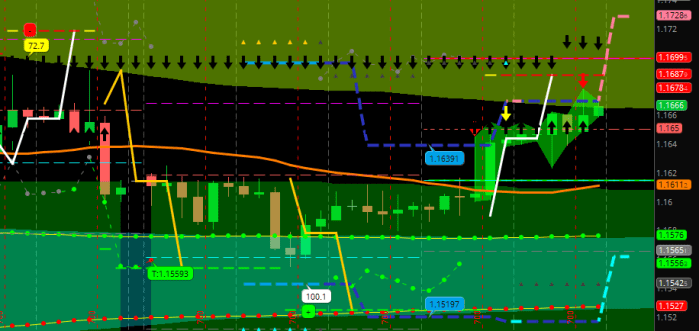
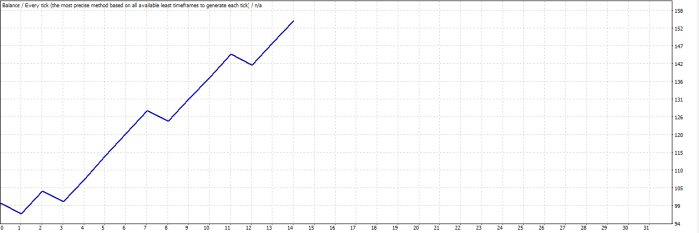
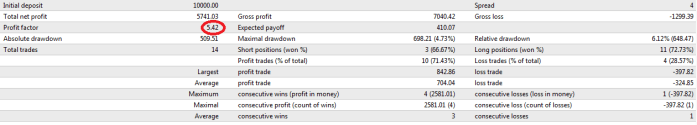
Picture below: size adjusts with every $100 equity gained
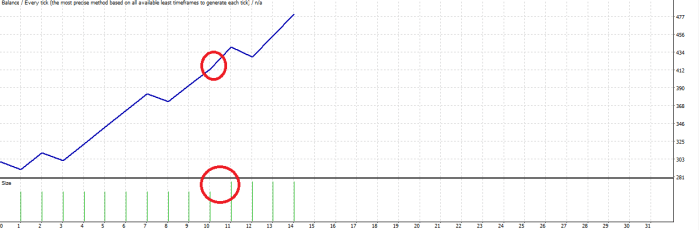
With larger equity the profit factor can be higher.
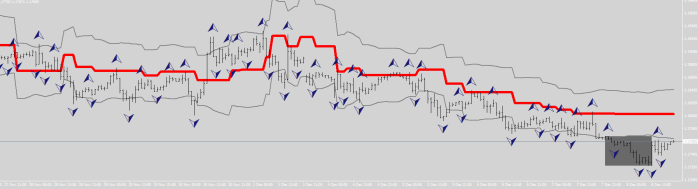
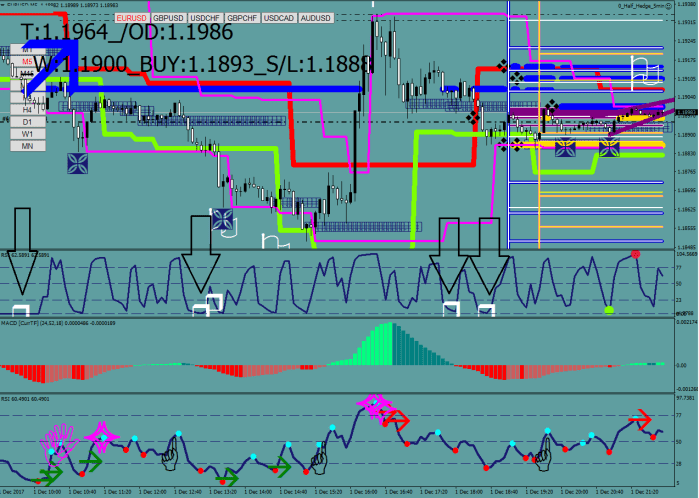
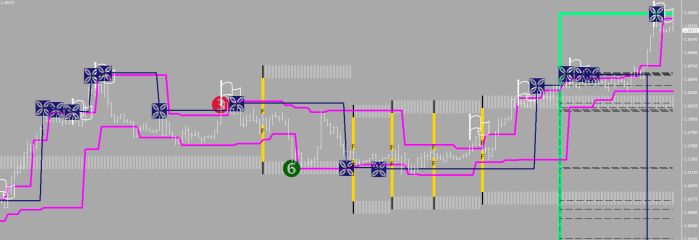
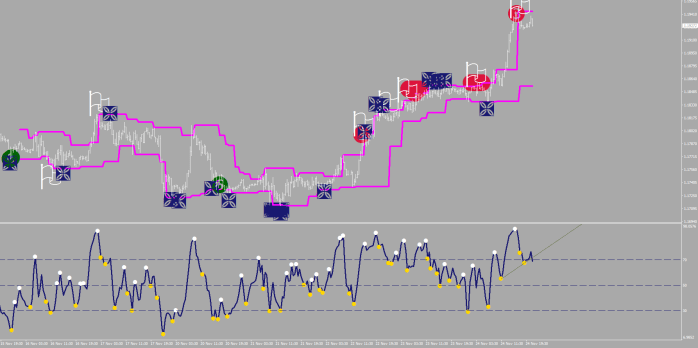
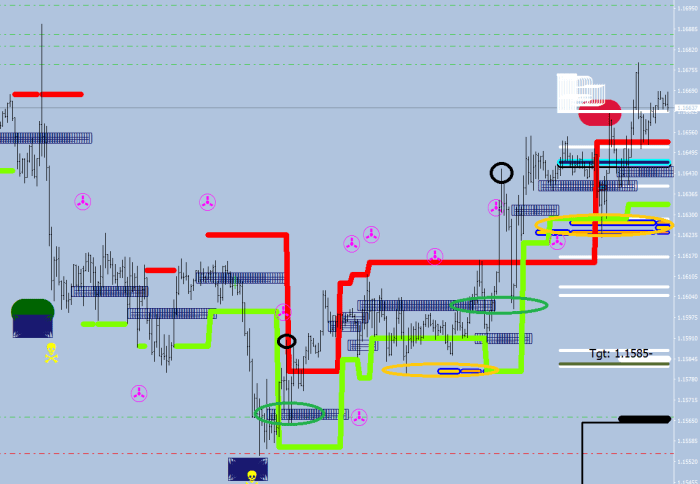
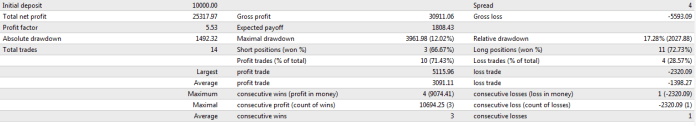
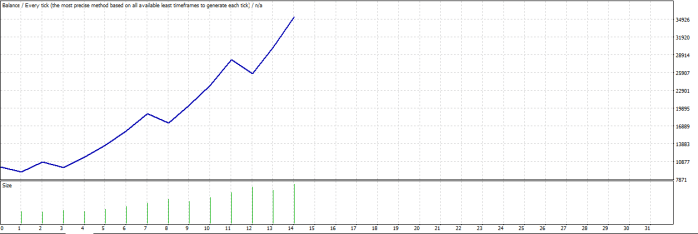
And gains can become exponential when multiplying the size. 3x example below:
…
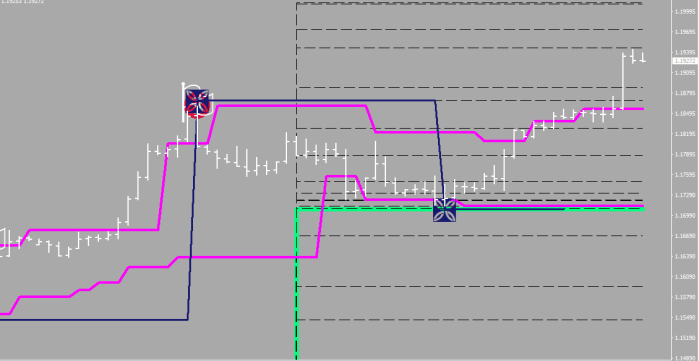
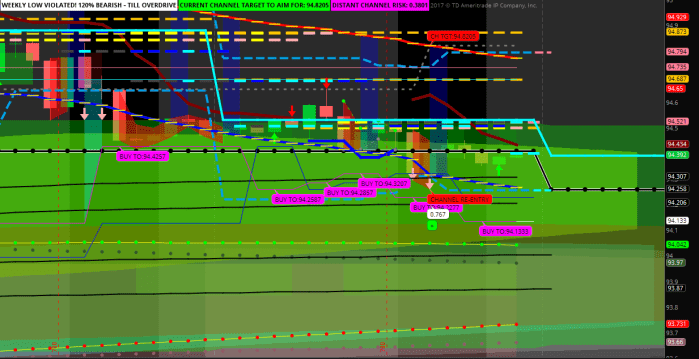
8x the charm…
I was meant to put this up for sale on the MT4 market, but when totally failing to communicate / get a pass by the monkeys running the show during my efforts with the Market Maker Lines, I had to surrender.
———————————————————————————————————————————————–
Support Team 2017.10.05 08:07 #1 EN
Improve your Product description
Your product description is not comprehensive enough, please try to better describe the idea of your product.
If your product has inputs, add them as a list of parameters with descriptions.
For this purpose, the editor provides the Bulleted list and Numbered list commands. If you want to create subparagraphs inside the list, use the Increase indent command.
Example:
Indicator parameters
- period – the number of bars used for the indicator calculations. Proper values – from 5 to 50.
- High_TF – the higher timeframe, from which the indicator values are taken. Must not be smaller than the timeframe of the chart the indicator is running on.
- ShowEntries – show entry points in history on the chart for visual analysis.
Use the editor functions, do not copy/paste from other programs.
Redesign your Logo
To learn how to prepare an attractive logo, please read the following article: Tips for an Effective Product Presentation on the Market
As far as the graphics format is concerned, the best thing to do is to use PNG format because it allows to keep the quality high both at editing and transferring files. We strongly recommend you to refrain from using JPG.
A good logo should be simple and describe the basic idea of the product. Fine details are also inadvisable because they are usually difficult to make out. A picture overloaded with too many colors and graphic effects will not serve as a good logo either. Ideally, 3-4 colors and a couple of recognizable images are enough to design a logo. Trade terms, wildly used and familiar to every trader, could be used in the inscription. They will play a significant role in conveying the idea of the product. For example, Buy, Sell etc. Serif fonts are better be avoided. Keep it simple so everyone can read the logo.
Promotion of third-party resources in Product descriptions is not allowed.
The Product page cannot be used for promotional purposes. You are not allowed to publish links to external resources in the product description, its logo, video or screenshots. The full Product description must be given directly in the Market.
Fix errors in the program code
Programs should not contain critical errors that lead to immediate termination:
- division by zero
- going beyond array boundary
- using an incorrect object pointer
Start your program on a chart and try to change it timeframe or symbol. Restart the terminal with an indicator/Expert Advisor attached to it. Such actions should not lead to program errors.
Not enough history data or vice versa too many bars on the chart should not hinder the client terminal operation or cause excessive use of computer resources.
2017.10.05 11:06:05.905 Market_Maker_Lines_DC XAUUSDcheck,Daily: array out of range in ‘_Market_Maker_Lines_DC.mq4’ (1060,17)
108
Me 2017.10.06 15:42 #2 EN
New version validation passed.
After submission: under one minute rejected. What does this mean? What to do here?
Support Team 2017.10.09 08:41 #3 EN
Timur Yakupov:
Improve your Product description
Your product description is not comprehensive enough, please try to better describe the idea of your product.
If your product has inputs, add them as a list of parameters with descriptions.
For this purpose, the editor provides the Bulleted list and Numbered list commands. If you want to create subparagraphs inside the list, use the Increase indent command.
Example:
Use the editor functions, do not copy/paste from other programs.
Redesign your Logo
To learn how to prepare an attractive logo, please read the following article: Tips for an Effective Product Presentation on the Market
As far as the graphics format is concerned, the best thing to do is to use PNG format because it allows to keep the quality high both at editing and transferring files. We strongly recommend you to refrain from using JPG.
A good logo should be simple and describe the basic idea of the product. Fine details are also inadvisable because they are usually difficult to make out. A picture overloaded with too many colors and graphic effects will not serve as a good logo either. Ideally, 3-4 colors and a couple of recognizable images are enough to design a logo. Trade terms, wildly used and familiar to every trader, could be used in the inscription. They will play a significant role in conveying the idea of the product. For example, Buy, Sell etc. Serif fonts are better be avoided. Keep it simple so everyone can read the logo.
Promotion of third-party resources in Product descriptions is not allowed.
The Product page cannot be used for promotional purposes. You are not allowed to publish links to external resources in the product description, its logo, video or screenshots. The full Product description must be given directly in the Market.
Fix errors in the program code
Programs should not contain critical errors that lead to immediate termination:
- division by zero
- going beyond array boundary
- using an incorrect object pointer
Start your program on a chart and try to change it timeframe or symbol. Restart the terminal with an indicator/Expert Advisor attached to it. Such actions should not lead to program errors.
Not enough history data or vice versa too many bars on the chart should not hinder the client terminal operation or cause excessive use of computer resources.
2017.10.05 11:06:05.905 Market_Maker_Lines_DC XAUUSDcheck,Daily: array out of range in ‘_Market_Maker_Lines_DC.mq4’ (1060,17)
108
Me 2017.10.09 22:21 #4 EN
Support Team:
I don’t understand what is going on. I posted a different version and I got the same message copied and pasted with the including the error message from the 5th of November that was cured already.
I do not know what to make of your impersonal messages.
There is nothing wrong with the description and what is this thing about the logo coped here all the time?
Could I get something other than this blabla?
Thank you in advance.
108
Me 2017.10.15 04:39 #5 EN
Not sure what is happening yet again.
I show a rejection, and I am unable to delete the last uploaded version, and
I do not have an upload product file icon either.
Support Team 2017.10.16 15:02 #6 EN
Hello, if you have any problem with this, use servicedesk please.
Support Team 2017.10.19 10:02 #7 EN
Improve your Product description
Your product description is not comprehensive enough, please try to better describe the idea of your product.
If your product has inputs, add them as a list of parameters with descriptions.
For this purpose, the editor provides the Bulleted list and Numbered list commands. If you want to create subparagraphs inside the list, use the Increase indent command.
Example:
Indicator parameters
- period – the number of bars used for the indicator calculations. Proper values – from 5 to 50.
- High_TF – the higher timeframe, from which the indicator values are taken. Must not be smaller than the timeframe of the chart the indicator is running on.
- ShowEntries – show entry points in history on the chart for visual analysis.
Use the editor functions, do not copy/paste from other programs.