Test Drive This Logic…

EUR344

(Bpb = Buy PullBack, Bbr = Buy BReak)

Chart is on 30 minute.

Download the RSI divergence routine from my blog – you’ll find it under the posted articles.

Set the period to 16 and adjust two of the fixed lines, the 77 to 73 and the 23 to 26.

Dowload the _Primary_Secondary routine as well.

The logic behind the label is the following. It will look for the last buy/sell signal. If it is a buy, it will suggest a primary buy at or below the latest 30-min Weight minus 12 pips,  which would be the preferred value for a pullback, and a secondary, break out entry to add to a position or if you missed the first turn.

You can then hold safely until the 3rd high RSI read (above 73).

EUR347

On the above picture you can see that there were 2 more opportuinities to enter at the high base, again at/around the green line and the add on at the red one. You will not have the plots, but you would see the numbers and the direction in a form of a label.

Just the opposite would be true for the sell side.

You should be able to get away with a 20-pip stop for the most part, and I think that’s pretty awesome…

EUR345

EUR346

About Market Making

There are dolphinately secrets to trading.

First and foremost: not all trading is created equal.

Futures trading is a clean thing. Zero sum means that to buy a contract someone has to sell a contract. There is even delivery upon expiration.

People buy stocks based on supply and demand bets: they hope to get a piggy ride on the excessive interest / greed of people, on a bet that a major company is buying up shares or that there is inside buying to gain more control or simply to drive up the share price before cashing out.

Just like Benioff selling some to reap the benefits of the cloud mania while alive.

There are others that intend to keep control, Zuckerberg and Bezos are conscious of not giving up share, and if you are at their level, you really do not need anything in life: your salary can buy you anything that is not already a write off for the company.

Apple is famous for faking previous meetings that did not happen to exercise back dated share buying options at a much lower price when things are running hot for an instant kill.

As for Forex, de de-centralized nature and no limitations breathe an unlimited number of brokers into existence.

Their Market Makers run different programs based on hype and no hype, and they do not even need to make any real transactions, but most likely would do it in a 15 minute window – after hours – to re-balance their books a bit.

We are gonna skip the lesson called: “there are only three real currencies in the world, USD, EUR and JPY. Cryptocurrencies are in fact commodities.”

Market Makers are the ones feeding the snake. When there is high demand in one direction, someone has to capitalize on this with a delay, meaning, first they pull down their pants. They will have made their money in both direction by the time the tide makes the full circle.

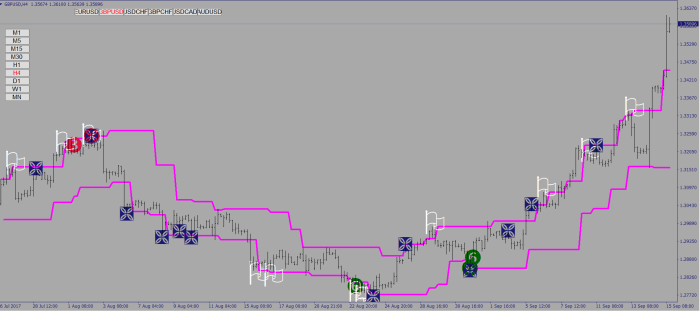
If you dared to say that there are no market maker levels, but boy, would you be wrong!

EUR052

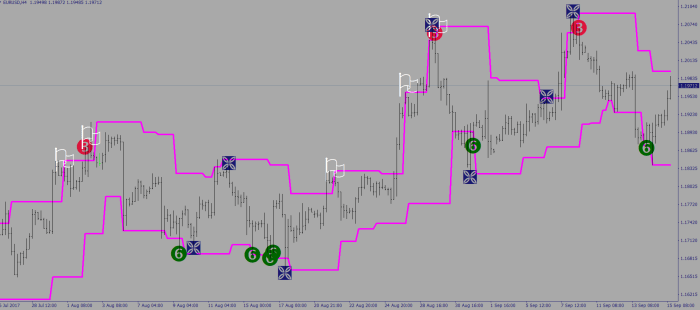
About 70% of all trading is high and low tides called into existence by the Market Makers.

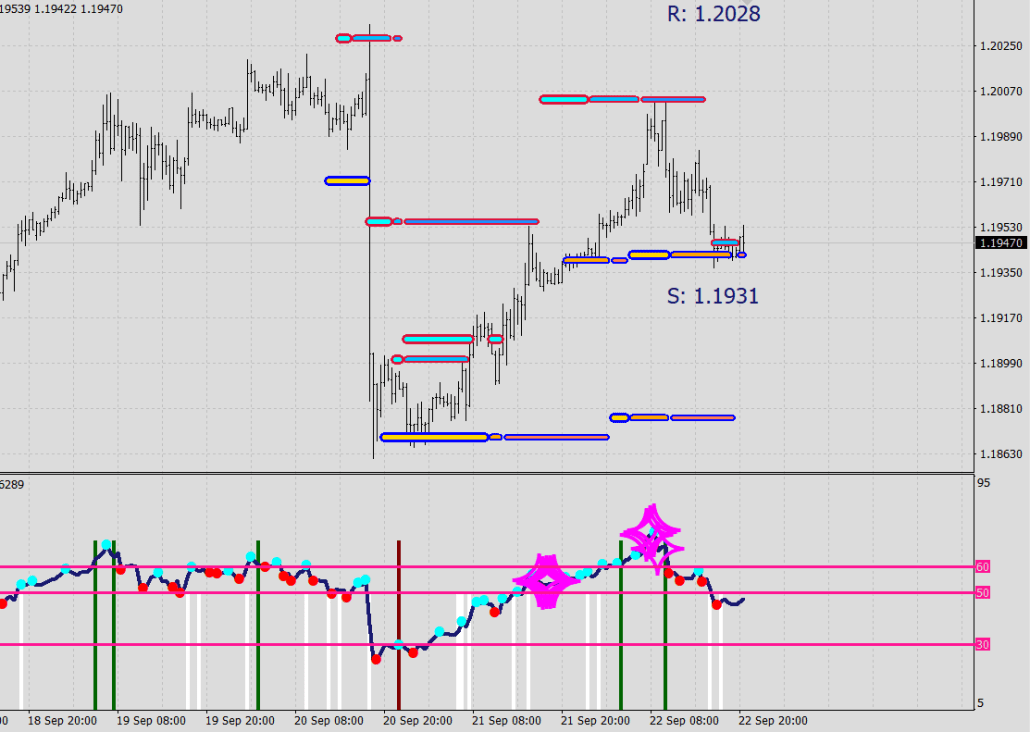
The only trace they leave behind is velocity, ferociousness.

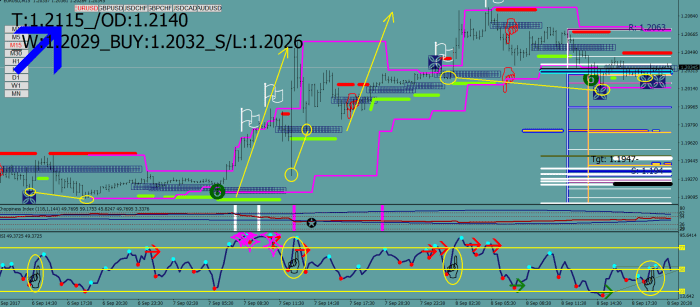
During hype they run an AT market fill routine, and the imbalance in the supply and demand would do the rest. This would come with a sudden burst.

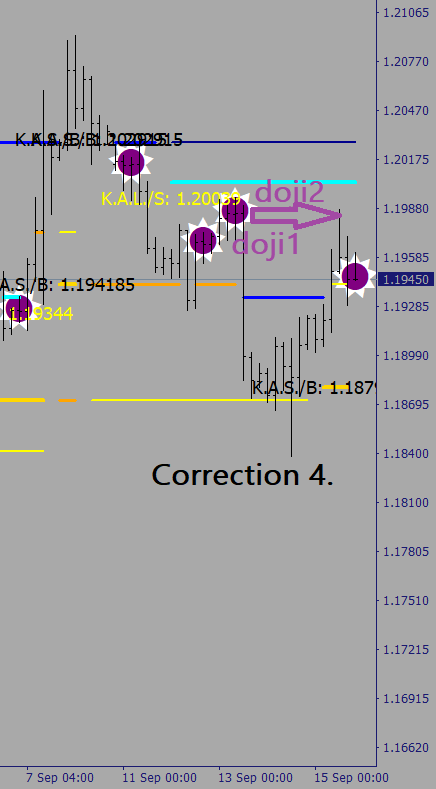
To detect for these bursts, you can use Heiken Ashi candles: wherever price was not able to center is where they started the program from.

Heiken Ashi plots slow down the MT4 quite a bit, so my system is much simpler than that.

That’s a wrap for this morning, I just gave back my badge to the security, I’m out of Bloomberg for good and looking forward to getting a new life.


Going the Distance

I promised the right thinking, and you get here nothing less.

The top was called perfectly by

36 Only V1.2 – in the downloads.

The second break was the key yet again.

I had to adjust my thinking and the RSI Divergence 4H routine ultimately to give me the 1-2 (starting and finishing exhaustion) signals in the right place. The new version is available from the previous blog post.

The improved thinking is this: exhaustion is not about crossing a level, it is about going the distance, regardless of the movement direction on the oscillator.

EUR334

The accuracy with the combination of this knowledge and the Market Maker levels is mind blowing.

I was actually short yesterday, but only 1/6th of my full size at 1.2028, for the next Market Maker level up was 1.2027 and the highest tick was 1.2034 – I was within 6 pips of the peak!

I have been not even a full step behind of the ultimate knowledge. The distance just got slashed in half.

I will have some routines for sale in the future such as the Market Maker levels and some automated trading routines as well.

RSI Divergence 4H

This version is a space-saver with added CI (consolidation strips).

The idea is that a reversal happens upon a divergence and a divergence sets up after beating an exhaustion level.

You make your own rules with this one.

Green strips printing meaning upside strength, yet it can also be the last flame to the upside.

Often, an opposing colour strip starts a move and the next one repeating the last colour ends it.

Be careful with wanting always to defy them. Evaluate the range on the RSI, did it go all the way from top to bottom/bottom to top (2 yellow lines plus) to make this a terminal move? Did it get high/low enough? (above/below the last yellow line)

EUR000

– white strip: full charge – consolidations wrap around this level, I call it weight at times, when dealing with the (High+Low)/2 read, if there is no trend in place, a re-visit is a good bet
– green strip: upside exhaustion ”
– maroon strip: downside exhaustion

I did something here that I have not done before: some exhaustions are being filtered out for being “insignificant”

_RSI_Divergence_4H V1.2

GBPUSD053

AUD043

As for re-visiting: both the white and the coloured strips are potential end points, and so they are points of interest. Bear in mind, that when one timeframe is becoming exhausted, the same moment a different timeframe may become fully energized. They are all terminals as well as starting points, call them spinning points.


Two Dojis Mine

Sure, I Do Not Want What I Haven’t Got… (Sinéad)

And all I Have Is You… (U2)

As Prince once said: Nothing Compares To You…

Three Babies Mine Two Dojis Mine

Correction:

The handful of visitors that I currently have surely won’t mind some habitual craziness every once in a while.

This is the suppressed poet coming over me, it’s that crazy dude with too much to say and has not yet for some reason re-launched his poem collection (after the multiple demises of multiple websites) under that imaginary blog, what was its name? Oh yes, he remembers now…

SYLLA-BELL

So, back to the correction part: figuring the target can be as easy finding once, twice a lady doji.

Figaro Figure 1-4.


EUR329

EUR330

EUR331

_Dojis

Don’t forget to flag Chart on foreground under Properties/Common.

Play around with pip values if you like.

By the way, I am perfectly sober while belching up associations like these. Perfectly normal? That’s up for a debate.


36 New Version

2nd update is here.

I am calibrating this thing on 4 Hours.

I want something that fits and is accurate for EUR/USD as well as for GBP/USD.

Here is how the V1.2 shapes up in the last 230 sample:

EUR327

GBPUSD052

V1.2 has 3 conditions for sells, 4 for buys, and the new filter takes into account the freshness of the turn – the essence in James Bond style would go like this:

  • One Break is Not Enough

Up in the Downloads now.


36 Re-Calibrated

V1.1 can now be downloaded from this blog

The sample size was brought down to 16.

2+2 new conditions got included.

eur315

I was upset for not finding the fake-out with the previous sample size & settings – I was running one day behind with my thinking instead of the regular one day ahead.

Static sample sizes do not work with every volatility reading, but I am aiming to find a sweet spot.


Comfort Levels Re-Visited

A bit of an actuality.

You can now download the 1H version from the Environment/Downloads menu.

The gap up over the weekend had the following purpose:  they put back the price into the overbought area.

As Ira Epstein would put it: they saved it (which can be done within 1 day of losing the overbought field – according to him).

Embedding means three consecutive days in the overbought or oversold field. This develops a safety for constant buying/selling.

Once price gets out of the overbought/oversold area, it is poised for a big distance move: from oversold to overbought is 60% of the total range, and that is if it even stops at the opposite neckline.

As Scott Barkley said about the Market Makers, that have positions to regurgitate back to the public, “they create a buyers / sellers market”.

Although I never quite understood what he exactly meant by that, this gap-up example does provide us with some answer; the gap required a small out of hours movement, that “saved” the price from losing the overbought status, practically they put the train back on the rails to secure their baggage to be picked up on the way.

Alles Klar, Kommisar?


Latest Article

The latest code, the Head Finder can be downloaded from the ENVIRONMENT / DOWNLOADS section.

I made it for 4H, but admittedly using it on 30 min as well.

It plots 2 things:

  • white flags for perceived left shoulders that would be re-visited, and
  • blue butterflies for perceived heads, that should not be exceeded or be broken

Of course not all heads and left shoulders would get found, so do not rely on this blindly, yet the plots are rather useful – according to me.

Now, the area of the lower fold of the right flag is the target area, but it only lines up right on 4H.

The heads are where things happen. I define a fake out at about 30 pips, you should surrender and possibly reverse beyond that point.