if (RSI2[i]<96.5 && RSI2[i+1]>96.5 && RSI2[ArrayMinimum(RSI2,6,i+1)]<80) excess[i+1]=1;
  if (RSI2[i]>5.5 && RSI2[i+1]<5.5 && RSI2[ArrayMaximum(RSI2,8,i+1)]>20) excess[i+1]=-1;
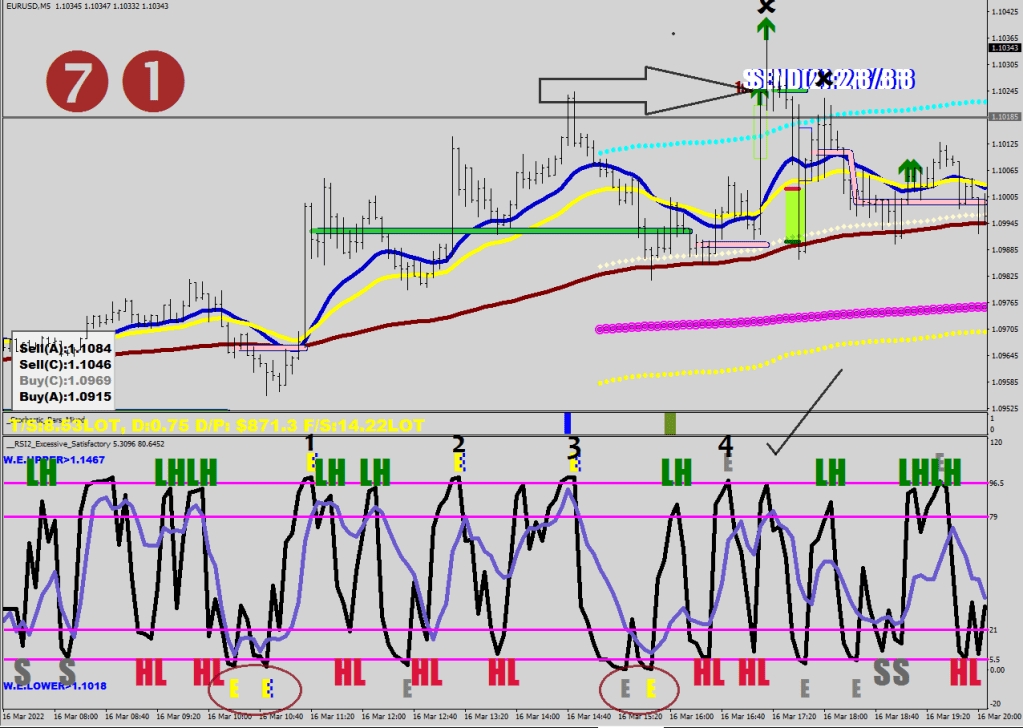
We have a bottom, we do not have a top yet.
Now, you would think that the extra steep is ought to be shorter in time than the steep one, but you would only be half right. In overdrive / hype would be good for 4 individual E-s whereas a mere steep incline is likely to only score 3.
In the gray mode the zero-mastodon trendlines can provide clues on the health of buying / selling. When the reach starts falling short get out/ hedge for a counter-leg which is going to be a deep correction (2 Es), but not a new wave.
E&E – deep corrections. A top as well at count #4.
Come to think of it, that’s overall more of a lucky dip/quick pick for a continuation/ final thrust made up of 3Es. What a quick dip does is it re-adjusts the swing point to push out the opportunistic counter entries further, so buy the double penetration.
Steepest decline, count 4.
Now you know why it is dangerous to short a boring market. The stakes don’t start until the yellow E-bricks get pushed out & the wall of hurry materializes.
What is an E-S-S sequence? It is not an end of a wave, it is an end of being brave (end of a leg).
HL and LH of course stands for Heil Hilter and vica versa.
Needless to say, I have to say Needles! at this point.
The 2022 version called No Tengo Monero is yet to be made.
The Best Revenge
Song by Color Theory
Teach me a lesson A wound at your hands And justice demands That I should pay attention Vengeance is fine But who has the time?
Call me a coward Go on the attack I won’t fight you back Or grant you any power An eye for an eye Leaves everyone blind A tooth for a tooth Is dental abuse
No I won’t chase down a hit and run Throw my life off track for anyone Moving on is the best revenge
A minor uproar An insult to you That karma and voodoo dolls Can not atone for A prisoner of war You’ll settle the score A lack of control That eats at your soul
Stardust falls from the sky tonight Let your guard down and feel it Really feel it.
Sign of times: every time someone says, the coded room, I hear the Covid room.
The point of this artikel is to point out shit at random.
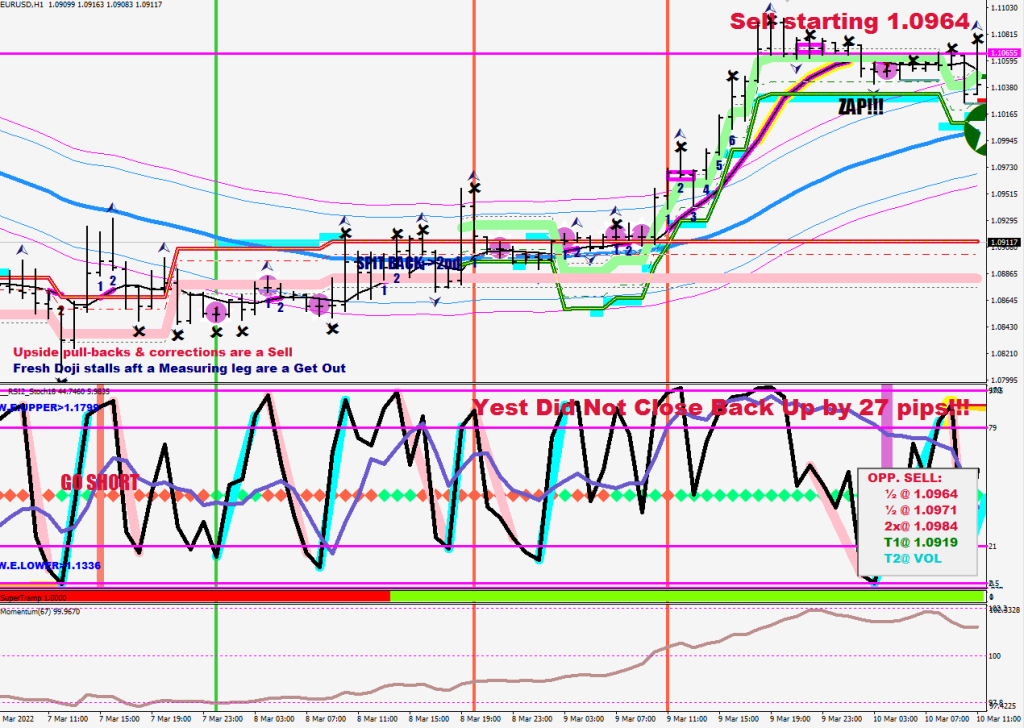
What happened when the market floated to the surface on the 67-samp momentum? Smart Money was aktiviziert.
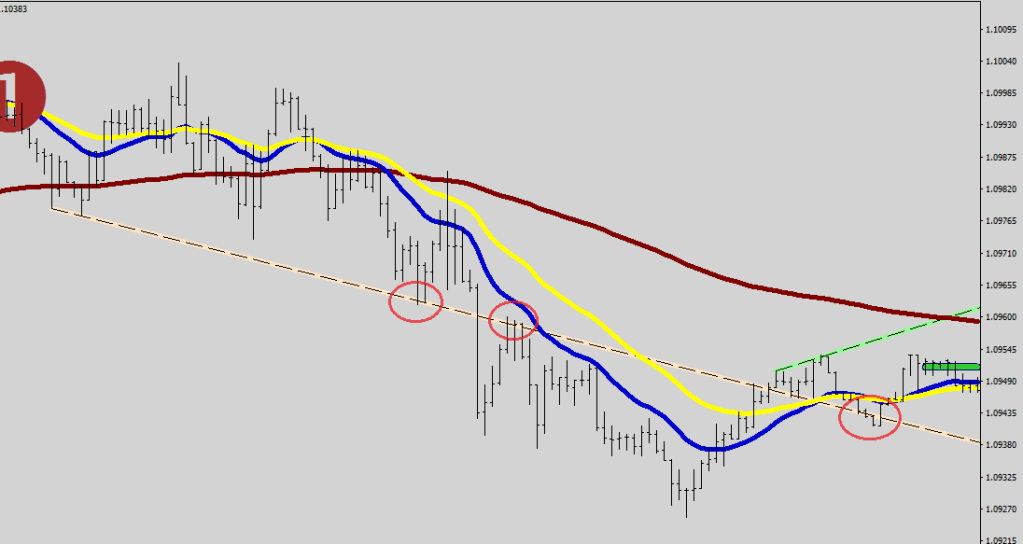
This actually was a better entry than the top itself. Now, a quick word about the 10-16 rejections. This could be played with any imaginary line, but if you have some basis, the better. I circled & arrowed 3 of these, and you can see that price always came back very close to the line itself before embarking on a 100+ pips journey. The Open and the Close fell to one side of the line, you had a move beyond the line by 10+ pips then a close back on the other side of the line by 16+ pips. The first two lines were MFI step shifted support/resistances and the third one reaching all the way was an MFI reversal divergence displacement line. We just had another one of those MFI support/resistance level formed at 1.0877 so we could / should see a move to 1.0867 at least to fulfill the first criteria of the rejection.
On the image below, you can see how the low and the high recently was made at 2.2 points away from the 100-mark on the 67-sample Hourly chart.
Guess where price finished at on Friday. Ett Hundra, yes.
Just below 100, how does that sound for a buy? Well, not just yet. The separation from the 8EMA would result in a zap, that would yield a lower low first. Major gap down? Nope. In the Bear market major gap downs would occur from an area of good strength, not after 220 pips of selling in barely more than a single day.
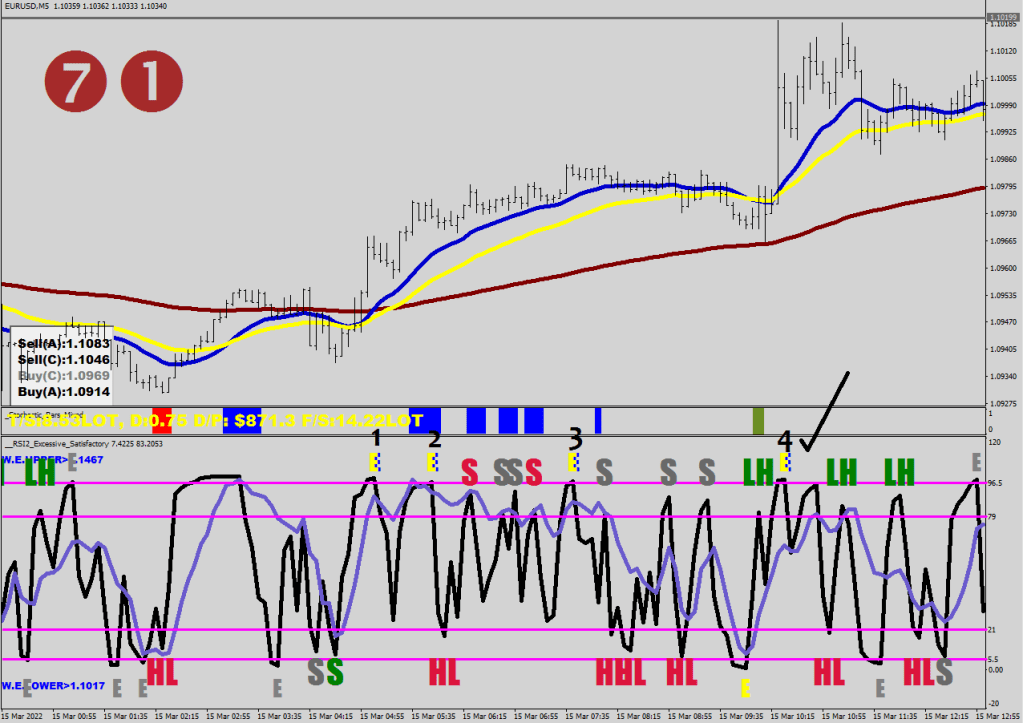
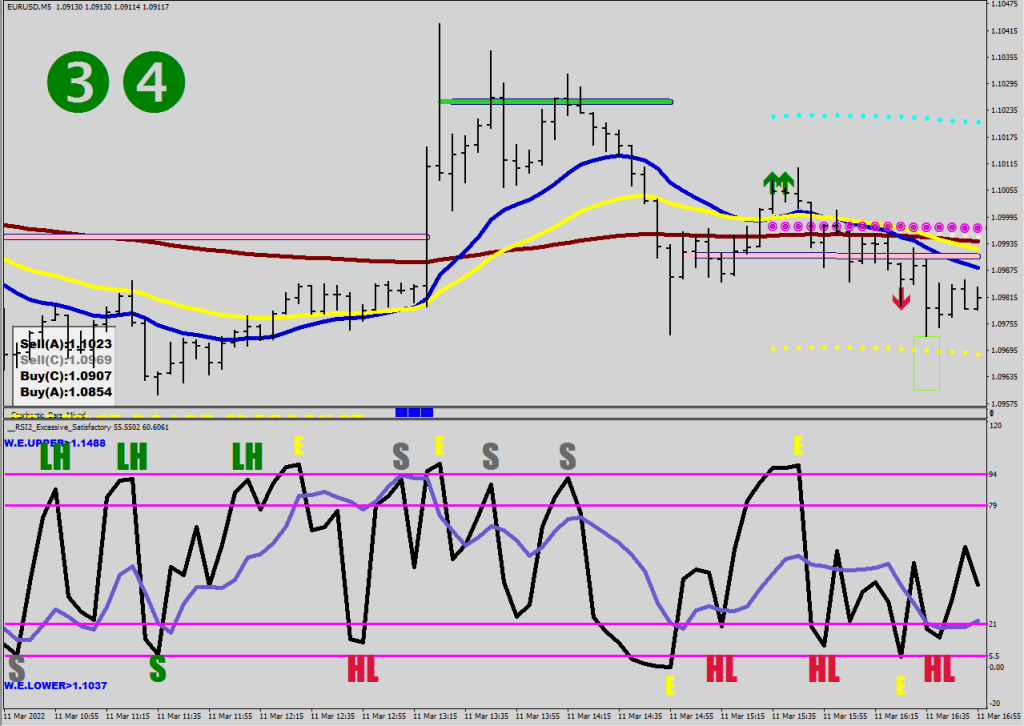
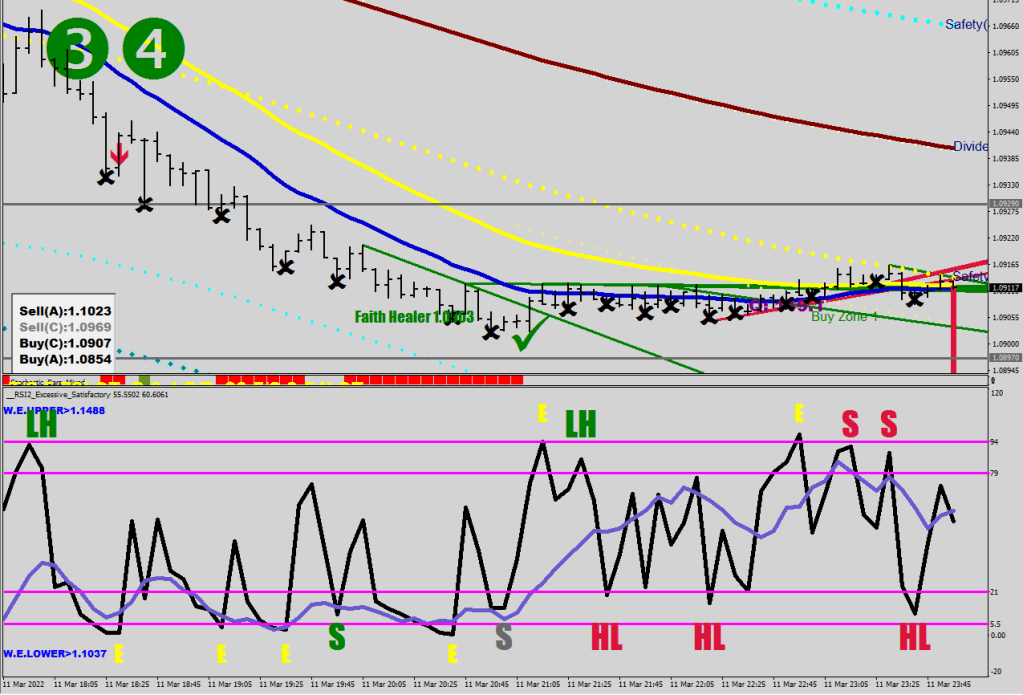
Quickly, let’s talk about 5-minute signals.
Here’s how the low was made early on Friday.
An Excessive RSI2 reading was followed by 2 Satisfactory (optimal strength) readings (the second was a lower low, and got colored Green.)
Then there was that spike that caused the Smart Money to activate.
An Excessive RSI2 reading was followed by 2 Satisfactory readings. Are you beginning to see a pattern here?
The day ended with another E-S-S.
Not very surprising, is it?
There is also a projected distance due to the strength of the move to guess where…?!
Better catch that 8:64 train then.
I believe that knowing that Smart Money is never far away to get in on an opportunistic trade, they can be provoked.
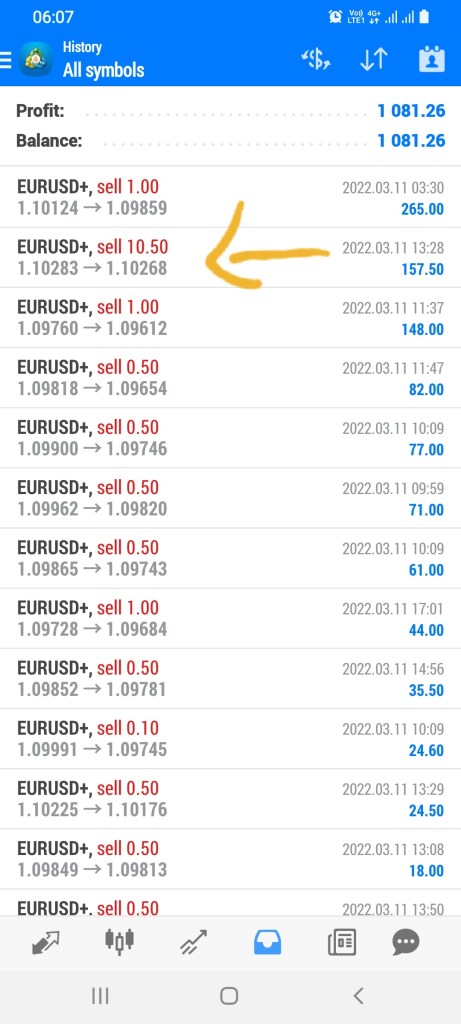
If you opened 7 lots at 1.1042 yesterday, you could had made 10k in a single day. I incidentally opened 10.5 lots instead of .10 (happens infrequently in the cell phone business), so I immediately closed it off with all the adrenaline in the head.
I shared the desired conditions for the opportunistic sell on this blog.
If I was Smart Money, I would not put out any pending orders, but rely on my algorithm to start buying at market when my level was hit (or when it was crossed back through after a return). This is why I think sentences like “I saw buyers stepping in” making little to no sense. Level 2 is mostly to entertain the retail with spoofing along with some poor quality algos relying on order flow sizes provided. No offense, Masi. Time will tell who’s knowledge is worth what.
Be kind, Erase & Rewind
I bailed on the forum at Forexfacrory. Now I only use it for the calendar.
In closing some Smooth Jazz from KKSF from the Coit tower. 12 years a nostalgy.
You are about to be taken serioisly.
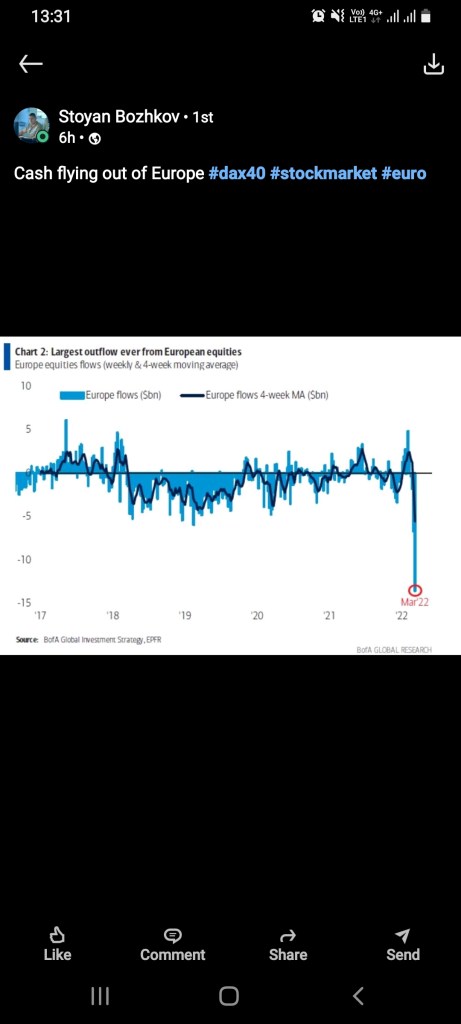
This isn’t a vote of confidence for the currency.
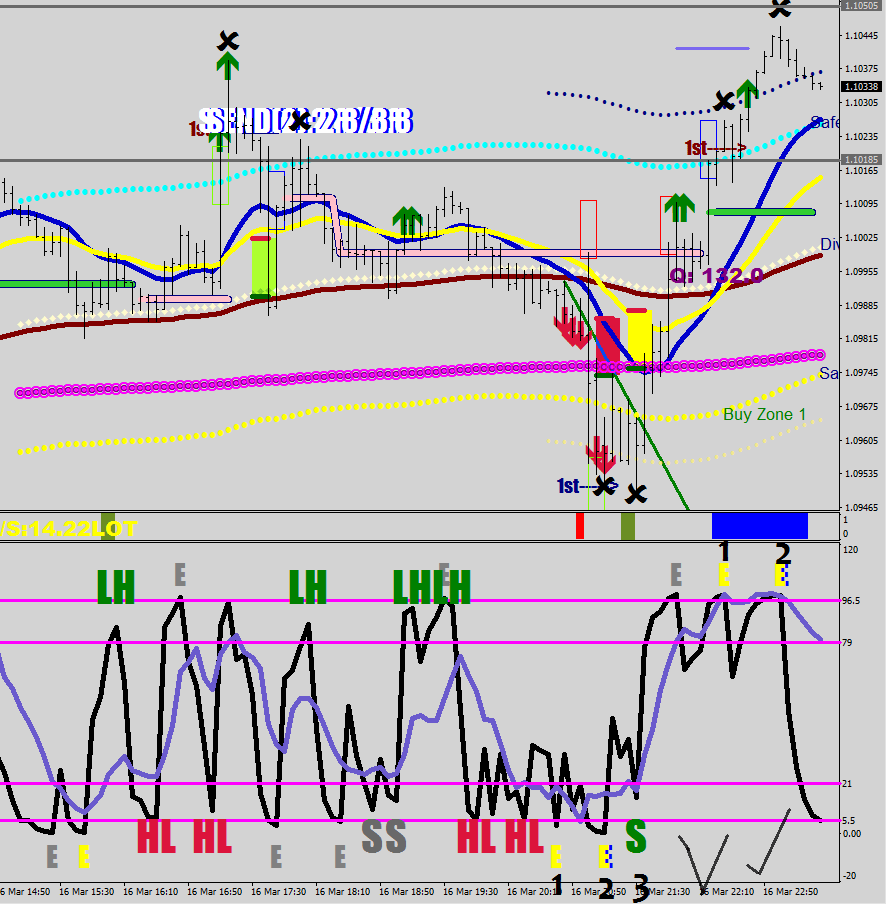
Price was rejected at first from the 3-sigma Window Envelope, then it was rejected from the neckline of the oversold area combined with the pivot and the 2-sigma Window Envelope. They need to be separated better to be able to deal with them. Could price start riding the 3-sigma Window Envelope lower? It is a possibility, we’ll have to see about this in a week.
My current thinking is a lower low for sure, but it may not be any further than another 12 pips below the current low. If it makes is to 1.0864 I’ll be doubling down on the longs.
Here’s an example of riding the 3-sigma band:
The stochastic was embedded, and a fresh reset was made at the E-59 on the prior week. Not the current setup.
The fact that the money bag does not want to pull down (draw down) their pants (naked holdings such as a Naked bar or a Naked Gun).
This can be achieved with two main tools: commanding size & knowing low risk entries (i.e. in a trending market).
This articulo is to give some ideas about what they might be looking at.
Let’s not start with saying that I was right again. Vanity is vanity even if it is intellectual.
A give away of professional trading activity is block size. On MT4 you would see an increased number of quotes as they are getting their larger size filled piece by piece.
There are obvious things about their thinking, such as they undetstand stretch conditions, aware of weekly window envelopes and they tend to scale out of position to get out untraceably.
Getting in is harder, it takes a conscious effort of building a position without screwing up the average cost for themselves by moving the price too much at once carelessly.
I wanted to talk about 2 smarty pantalones trades that I seem to have identified.
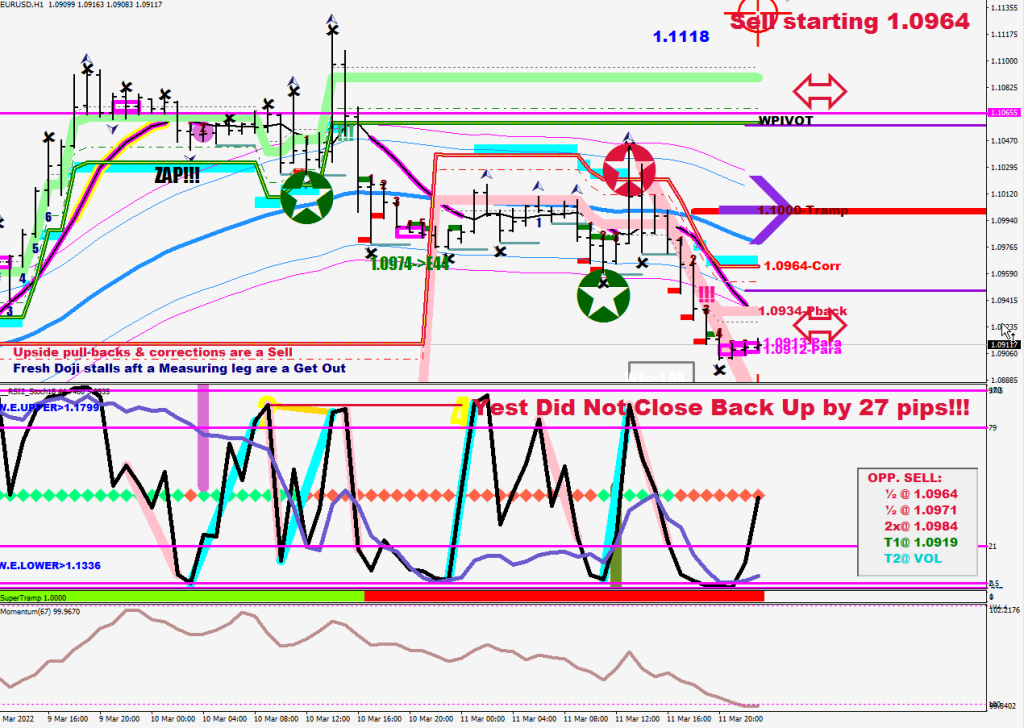
ZAPhod Beeblebrox
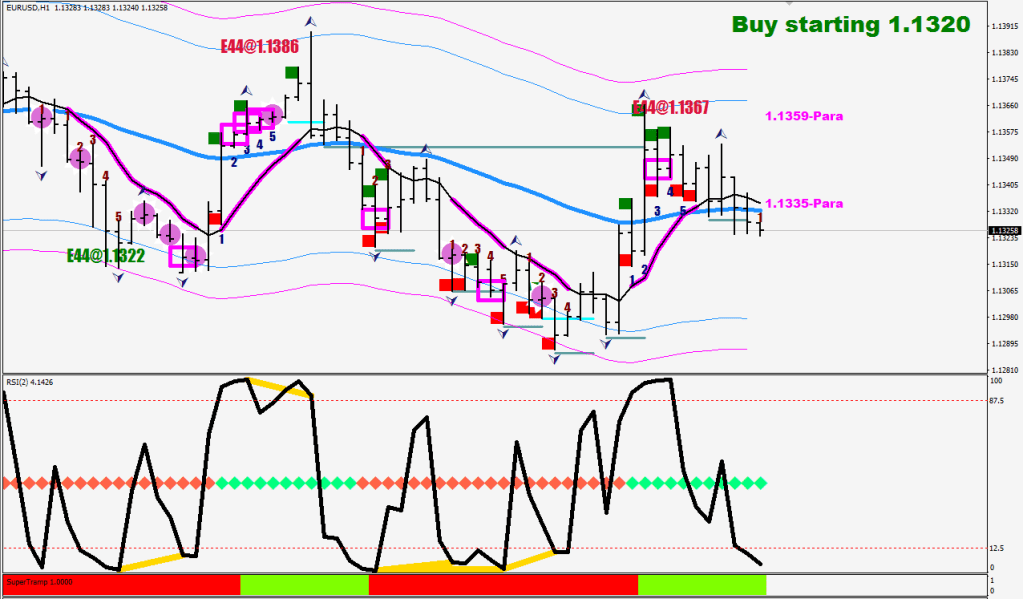
This is a trade that works in a trending market. I defined trending as multiple closes 45+ pips away from the hourly E44.
The trade requires price to separate from the 8EMA on hourly opens for more than 8 hours. The first return to this EMA is an easy fade towards the next Weekly target. Normally this works only once, but the last time around they managed to milk this twice: the first return was a near miss by 3 pips, and the second bullseye got credited as well.
Zap & Zap while the Supertramp is red. The yellow glow stayed on after the first touch being off a bit. Divergence takes back the excess made by the impulse.
Opportunistic buy / sell
These are 62 and 69-pip displacements of the 6-sample hourly low/high. I made cyan highlights that should conform with the Tramp again to be valid.
I need a separation of 4 out of the last five from the 62-pip displacement line for the entry to be valid.
image quality: jpeg on cell phone – at work again
I can’t seem to find that episode of the Son of the Beach where Noch Johnson ends up in a made up mid-American country and greets people with “Buenos retardes”. You know the one where they eat beans with the world’s highest protein content, then he sits on the leather couch and blames the farting sounds on it. Call me if you have this episode.
8.16x peak stretch , Green River (mean) on the top 5x stretch is the resistance at the moment (White)
some ideas on how to use the RSI-BB V1.0 indicator.
Buy-Buy-Buy
The bands are called upper2, upper, main, lower and lower2.
You are looking for a sequence shaping up as a V that is shaping below the main line or within a few pips.
What can be used as a filter here are the Money Flow Average (5 sample) in 2 colors. You want to see a blue run up preceding a buy entry. Also, you want the V to have at least 2 more values above the dip, and then there is the 8-sample EMA of the opens that I utilized.
They are reminders to look for the V in the upper / lower block(s). They are actually utilizing a VWAP routine. Frankly I don’t even recall why I did what, but the objective was something working. The importance is the outcome.
if (Low[i+1]>ExtBufferVWAP[ i+1 ] && High[i]>ExtBufferVWAP[ i ] && Low[i]<ExtBufferVWAP[ i ] && AVG[i+5]!=EMPTY_VALUE )
      {

      if (AVG[i]<AVG[i+5] && High[i]<iMA(NULL,0,8,0,MODE_EMA, PRICE_OPEN,i) && Open[i]>iMA(NULL,0,8,0,MODE_EMA, PRICE_OPEN,i)-170*Point ) {ObjectCreate(0,"TLine_v"+i,OBJ_TREND,indicator_window,Time[i],upper2[i],Time[i],lower2[i]); ObjectSet("TLine_v"+i,OBJPROP_COLOR,Red);

      }
      else if (AVG[i]<AVG[i+5]) {ObjectCreate(0,"TLine_v"+i,OBJ_TREND,indicator_window,Time[i],upper2[i],Time[i],upper[i]); ObjectSet("TLine_v"+i,OBJPROP_COLOR,Red);

      }
      else if (Low[i]>iMA(NULL,0,8,0,MODE_EMA, PRICE_OPEN,i) && AVG[i]>upper[i]){
      ObjectCreate(0,"TLine_v"+i,OBJ_TREND,indicator_window,Time[i],upper2[i],Time[i],lower2[i]); ObjectSet("TLine_v"+i,OBJPROP_COLOR,Green);}


      else {if (AVG[i]>upper[i]) ObjectCreate(0,"TLine_v"+i,OBJ_TREND,indicator_window,Time[i],main[i],Time[i],lower2[i]); ObjectSet("TLine_v"+i,OBJPROP_COLOR,Green);}
          ObjectSetInteger(0,"TLine_v"+i,OBJPROP_RAY_RIGHT,false);
      ObjectSet("TLine_v"+i,OBJPROP_WIDTH, 13);
      ObjectSet("TLine_v"+i,OBJPROP_BACK, 1);
      }

     if ( High[i+1]<ExtBufferVWAP[ i+1 ] && High[i]>ExtBufferVWAP[ i ] && Low[i]<ExtBufferVWAP[ i ] && AVG[i+5]!=EMPTY_VALUE) {

      if (AVG[i]<AVG[i+5]  && High[i]<iMA(NULL,0,8,0,MODE_EMA, PRICE_OPEN,i) && Open[i]>iMA(NULL,0,8,0,MODE_EMA, PRICE_OPEN,i)-170*Point) {ObjectCreate(0,"TLine_v"+i,OBJ_TREND,indicator_window,Time[i],upper2[i],Time[i],lower2[i]); ObjectSet("TLine_v"+i,OBJPROP_COLOR,Red);

      }
      else if (AVG[i]<AVG[i+5]) {ObjectCreate(0,"TLine_v"+i,OBJ_TREND,indicator_window,Time[i],upper2[i],Time[i],main[i]); ObjectSet("TLine_v"+i,OBJPROP_COLOR,Red);

      }
       else if (Low[i]>iMA(NULL,0,8,0,MODE_EMA, PRICE_OPEN,i) && RSI[i+2]>main[i+2] && RSI[i+2]<upper[i+2] && AVG[i]>upper[i]){
      ObjectCreate(0,"TLine_v"+i,OBJ_TREND,indicator_window,Time[i],upper2[i],Time[i],lower2[i]); ObjectSet("TLine_v"+i,OBJPROP_COLOR,Green);}


      else if (RSI[i+2]>main[i+2] && RSI[i+2]<upper[i+2] && AVG[i]>upper[i]) {ObjectCreate(0,"TLine_v"+i,OBJ_TREND,indicator_window,Time[i],lower[i],Time[i],lower2[i]); ObjectSet("TLine_v"+i,OBJPROP_COLOR,Green);}
      ObjectSetInteger(0,"TLine_v"+i,OBJPROP_RAY_RIGHT,false);
      ObjectSet("TLine_v"+i,OBJPROP_WIDTH, 13);
      ObjectSet("TLine_v"+i,OBJPROP_BACK, 1);
      }
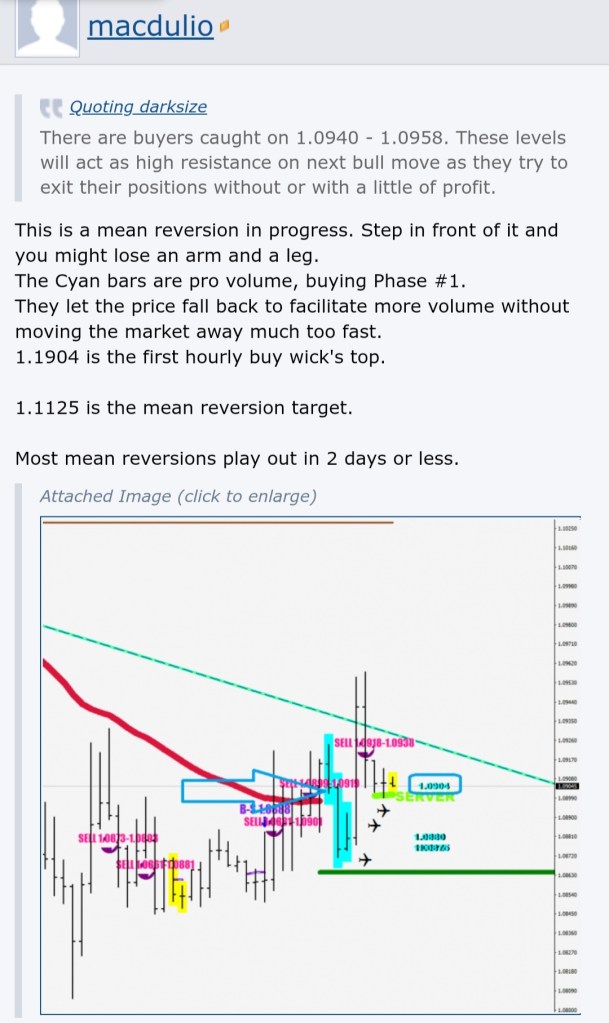
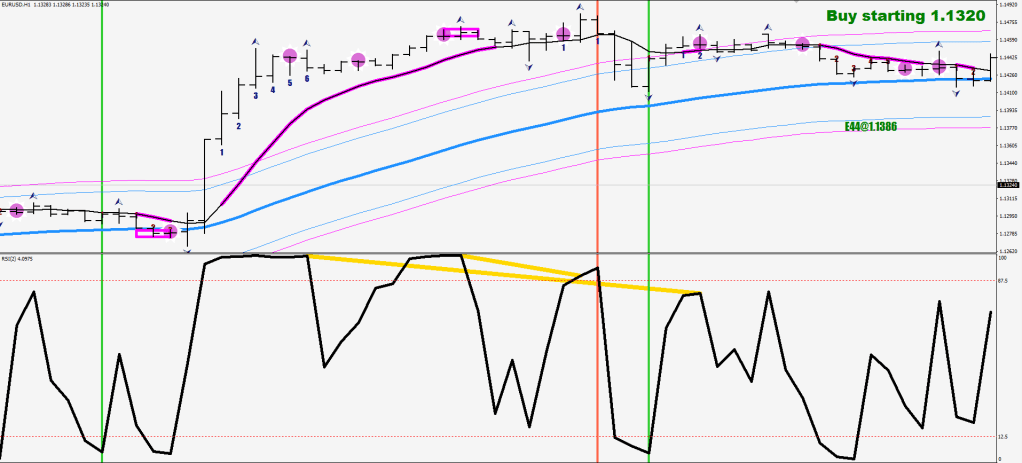
The idea behind the full length bars is that you can sell at will or buy at will.
A flick-flack can occur, of course – see image 1.
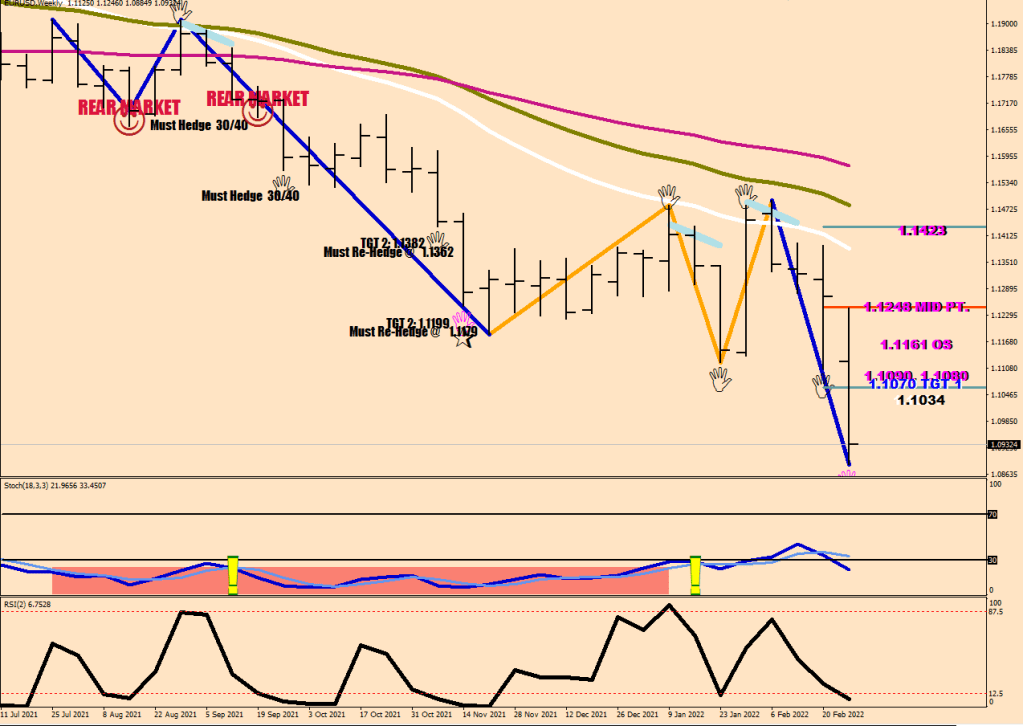
The reminder labels promote a side. The bias is coming from the Weekly chart, if the last series of 3 closes were above the weekly 59 EMA, the bull side would be promoted and vica versa.
The purple arrows are looking for crosses through the individual band lines, for instance, the RSI pulls in between the upper and upper 2 lines and the 6-sample bottom is more than 28 pips away, that’s a sell. I highlight a 20-pip block with the deep pink numbers, which are 16-36 pips away from the low of the candle in question. The idea is that if you have certain size in mind that you can handle, every 5 pips put out one fifth of that. They may not all get filled, and that’s ok. You want to cover when the RSI is getting close to the main (middle) line.
The “Must Go” labels remind of immediate action, they went through several passes of clever filtering. The landings in the Correction and in the New Wave fields are colored differently and the gray-out is not a strong enough signal by itself, only in combination with something else.
The one thing to note here is that the yellow line prints early, preparing you for a possible outcome, but can also be taken back if it goes on for longer than expected, and the text label may or may not follow, but once they printed they meant it.
  if (RSI[i]<main[i] && RSI[i-1]>RSI[i] && RSI[i+2]>upper[i+2]){
             ObjectCreate(0,"TLine"+IntegerToString(i),OBJ_TREND,indicator_window,Time[i+2],RSI[i+2],Time[i],RSI[i]);
                   ObjectSetInteger(0,"TLine"+IntegerToString(i),OBJPROP_RAY_RIGHT,false);
                   ObjectSet("TLine"+IntegerToString(i),OBJPROP_COLOR,clrYellow);
                   ObjectSet("TLine"+IntegerToString(i),OBJPROP_WIDTH,9);
                   ObjectSet("TLine"+IntegerToString(i),OBJPROP_BACK,1);

                    ObjectCreate("TLiney"+DoubleToStr(i), OBJ_TEXT, indicator_window, Time[i], RSI[i]-30*Point);
                      if (MathAbs(Close[i]-iMA(NULL,0,44,0,MODE_EMA, PRICE_MEDIAN,i))<800*Point)
                    ObjectSetText("TLiney"+DoubleToStr(i), "MUST GO LONG", 13, "Impact", Purple);
                    else ObjectSetText("TLiney"+DoubleToStr(i), "MUST GO LONG", 13, "Impact", DimGray);
                    if (Market[0]<0) ObjectSetText("TLiney"+DoubleToStr(i), "MUST GO LONG", 13, "Impact", DimGray);

      }
       if (RSI[i]<lower2[i] && RSI[i-1]>RSI[i] && RSI[i+3]>lower[i+3] && RSI[i+4]>lower[i+4]){
             ObjectCreate(0,"TLine"+IntegerToString(i),OBJ_TREND,indicator_window,Time[i+3],RSI[i+3],Time[i],RSI[i]);
                   ObjectSetInteger(0,"TLine"+IntegerToString(i),OBJPROP_RAY_RIGHT,false);
                   ObjectSet("TLine"+IntegerToString(i),OBJPROP_COLOR,clrYellow);
                   ObjectSet("TLine"+IntegerToString(i),OBJPROP_WIDTH,9);
                   ObjectSet("TLine"+IntegerToString(i),OBJPROP_BACK,1);

                   ObjectCreate("TLiney"+DoubleToStr(i), OBJ_TEXT, indicator_window, Time[i], RSI[i]-30*Point);
                   if (MathAbs(Close[i]-iMA(NULL,0,44,0,MODE_EMA, PRICE_MEDIAN,i))<800*Point)
                    ObjectSetText("TLiney"+DoubleToStr(i), "MUST GO LONG", 13, "Impact", Green);
                    else ObjectSetText("TLiney"+DoubleToStr(i), "MUST GO LONG", 13, "Impact", DimGray);
                    if (Market[0]<0 && RSI[i+3]>upper[i+3]) ObjectSetText("TLiney"+DoubleToStr(i), "MUST GO LONG", 13, "Impact", DimGray);
      }


           if (RSI[i]>main[i] && RSI[i-1]<RSI[i] && RSI[i+2]<lower[i]){
             ObjectCreate(0,"TLine"+IntegerToString(i),OBJ_TREND,indicator_window,Time[i+2],RSI[i+2],Time[i],RSI[i]);
                   ObjectSetInteger(0,"TLine"+IntegerToString(i),OBJPROP_RAY_RIGHT,false);
                   ObjectSet("TLine"+IntegerToString(i),OBJPROP_COLOR,clrYellow);
                   ObjectSet("TLine"+IntegerToString(i),OBJPROP_WIDTH,9);
                   ObjectSet("TLine"+IntegerToString(i),OBJPROP_BACK,1);

                    ObjectCreate("TLiney"+DoubleToStr(i), OBJ_TEXT, indicator_window, Time[i], RSI[i]+9);
                    if (MathAbs(Close[i]-iMA(NULL,0,44,0,MODE_EMA, PRICE_MEDIAN,i))<800*Point && High[i]-iLow(symbol,0,iLowest(symbol,0,MODE_LOW,6,i))>280*Point)
                    ObjectSetText("TLiney"+DoubleToStr(i), "MUST GO SHORT", 13, "Impact", Purple);
                    else  ObjectSetText("TLiney"+DoubleToStr(i), "MUST GO SHORT", 13, "Impact", DimGray);
     }


      if (RSI[i]>upper2[i] && RSI[i-1]<RSI[i] && RSI[i+3]<upper[i+3]){
             ObjectCreate(0,"TLine"+IntegerToString(i),OBJ_TREND,indicator_window,Time[i+3],RSI[i+3],Time[i],RSI[i]);
                   ObjectSetInteger(0,"TLine"+IntegerToString(i),OBJPROP_RAY_RIGHT,false);
                   ObjectSet("TLine"+IntegerToString(i),OBJPROP_COLOR,clrYellow);
                   ObjectSet("TLine"+IntegerToString(i),OBJPROP_WIDTH,9);
                   ObjectSet("TLine"+IntegerToString(i),OBJPROP_BACK,1);

                   ObjectCreate("TLiney"+DoubleToStr(i), OBJ_TEXT, indicator_window, Time[i], RSI[i]+9);
                   if (MathAbs(Close[i]-iMA(NULL,0,44,0,MODE_EMA, PRICE_MEDIAN,i))<800*Point)
                    ObjectSetText("TLiney"+DoubleToStr(i), "MUST GO SHORT", 13, "Impact", Crimson);
                    else ObjectSetText("TLiney"+DoubleToStr(i), "MUST GO SHORT", 13, "Impact", DimGray);
      }
I know, this was meant to be a user-friendly manual, but I chose to include the logical expressions as is for I currently have no idea how to explain things with accuracy otherwise.
Are you bad enough, are you really tough?
Your eyes without the haze…
Let’s dispose of this position in this disposition, candy girl…
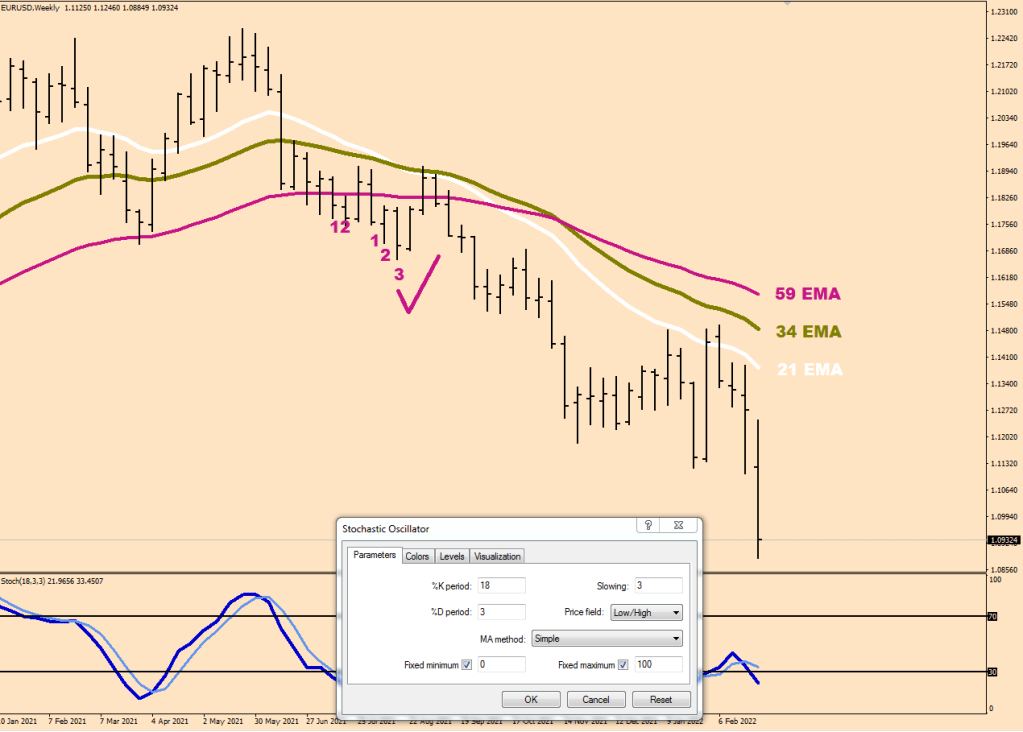
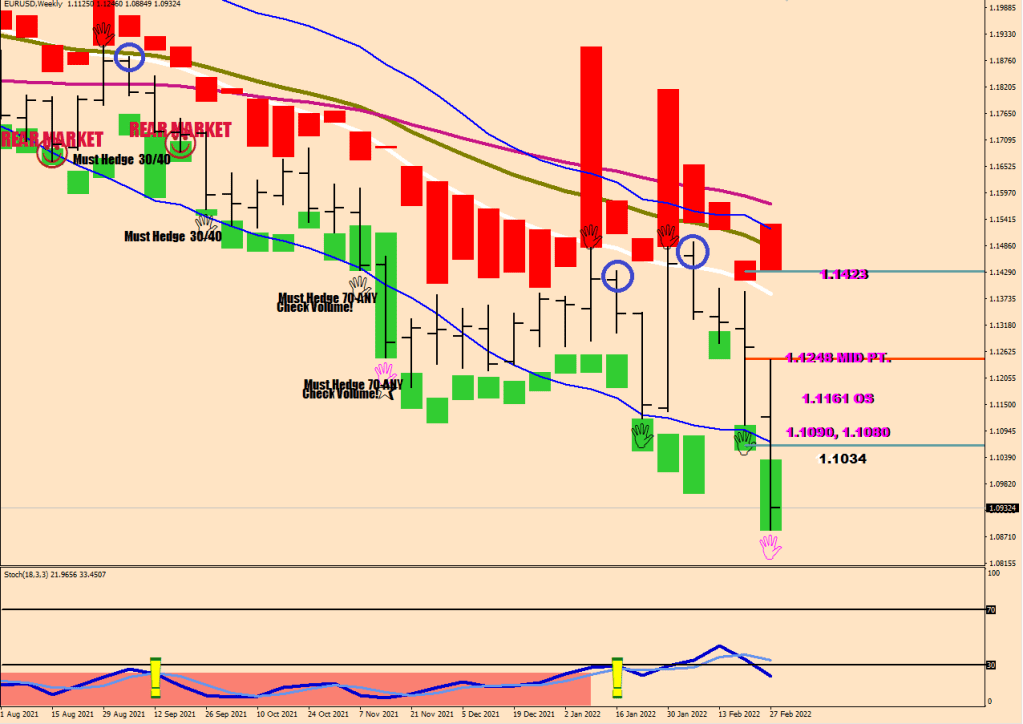
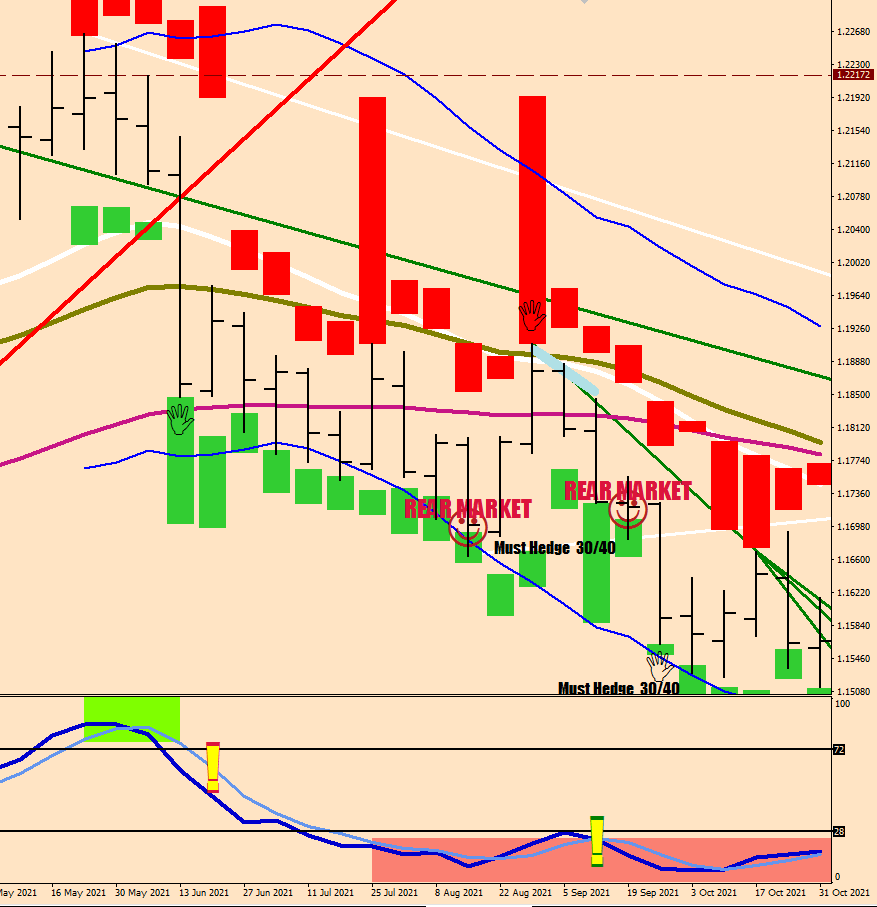
All EMAs are HL2s. The image shows the market going into bear mode upon 3 weekly closes were made below the 59 EMA. As you can see from then on the 21EMA proved to be a good short entry.
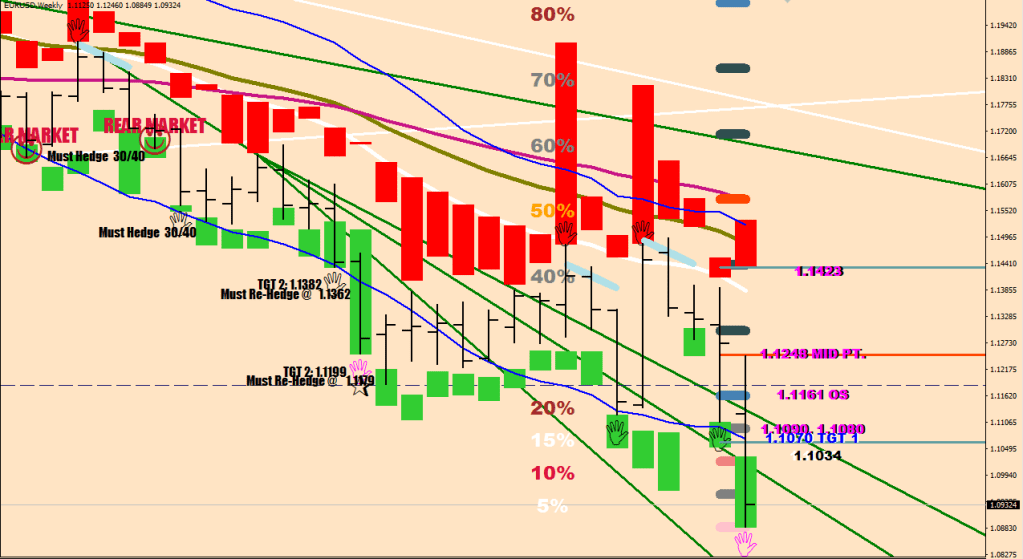
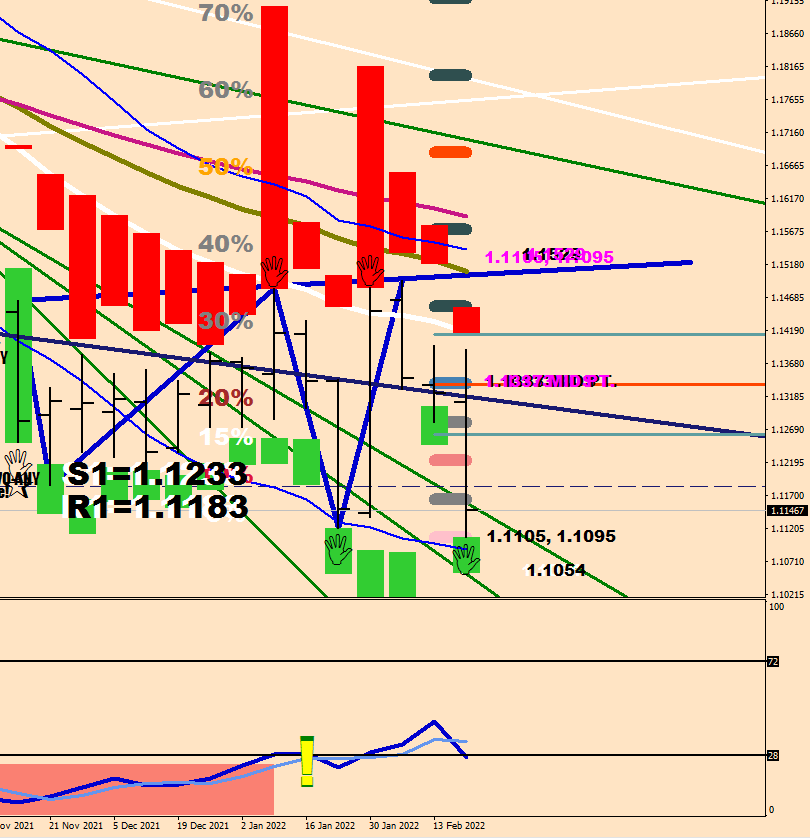
The quarter lines are generated from the last week’s data: they are a 15%-50% extra added on both sides relative to last week. If the 50% range gets exceeded, that is called a push and there is a palm representing this. I push out the start of the histogram to the terminal point.
As you can see, after the settled push, you also have a low risk entry in the blue circles, with a possible total of 9, 22 and 32 pips draw down if you buy at the opening price.
The blue lines are the 14-sample Window envelopes, they are sort of a “Target 1”.
The color coded hands… Magenta mean that the market closed outside the window envelope. Usually there is follow through to that. There is also a white palm (white lie when the hand does not make an 8-sample lower low/higher high), but not here.
The must hedge / re-hedge entries are 70 pips beyond the push terminal.
I would consider 50 below the push point to be TGT2.
Last week’s pivot can also prove to be a good entry.
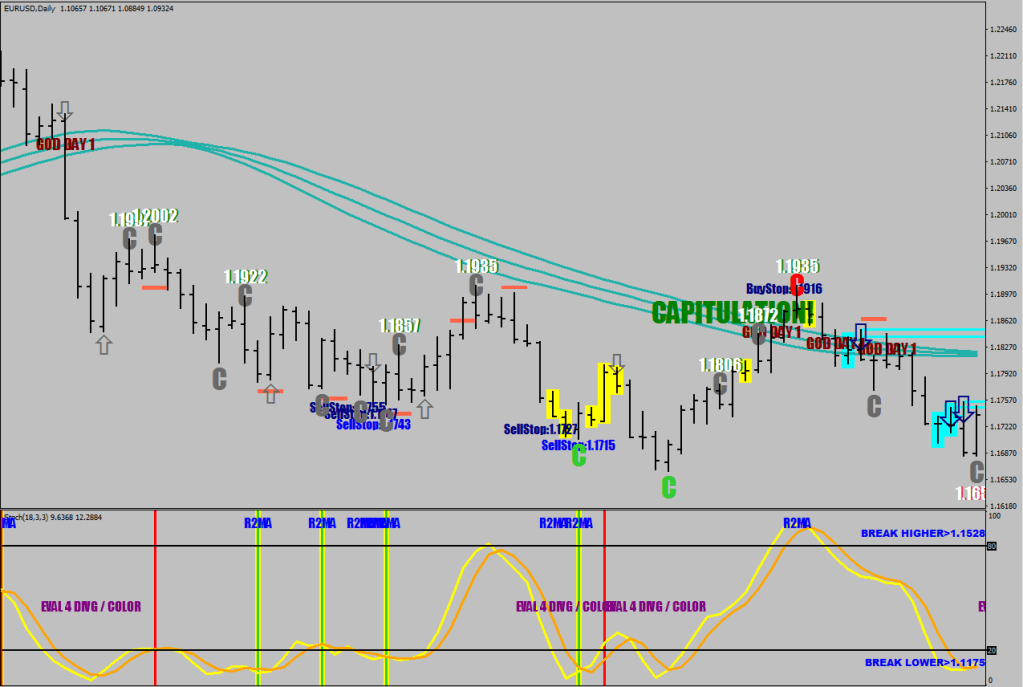
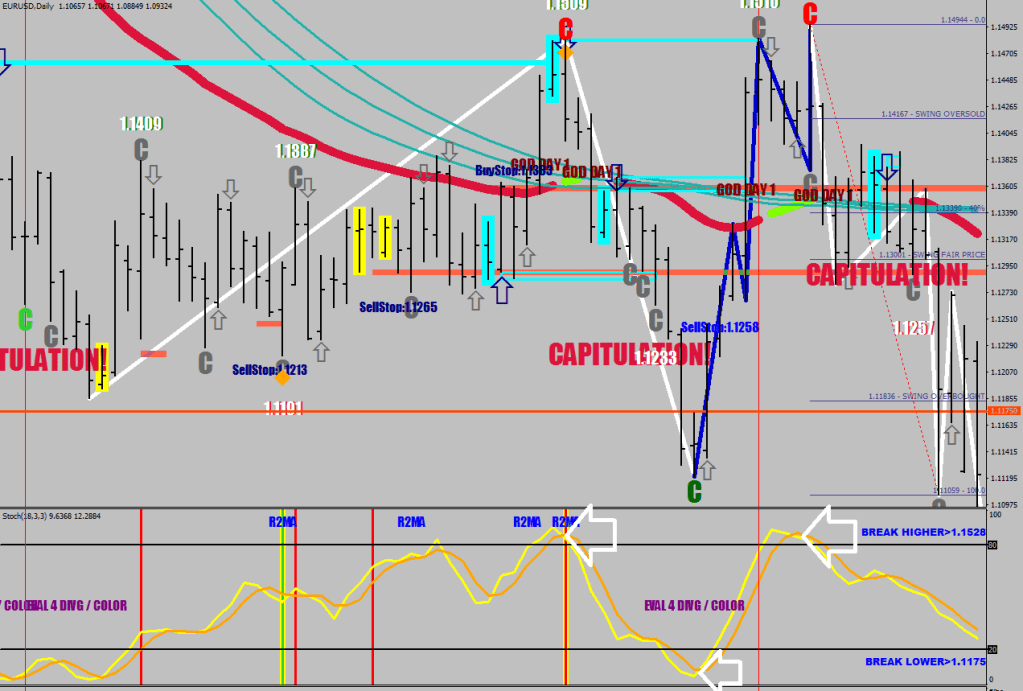
Now, let’s talk Salvatore Daily.
June was not a bear market – yet.
There was a God Day 1, a crossing that you don’t fade until Day 3.
The 18-sample stochastic becomes very important here.
The optimal entry in the Bear market was a Cover high (a day that is a 4-sample higher high closing down by 27+ pips) with the stochastic K above 80 (red C).
During the transition period, an overbought K and a C on the day or before was a very good entry.
The exit during the transition was below a fresh C print scale out in the next 60 pips watching the reversal divergence get more pronounced.
The Lime C-s also worked the same way, they are not fully ripe ones, but two had enough vitamin-C.
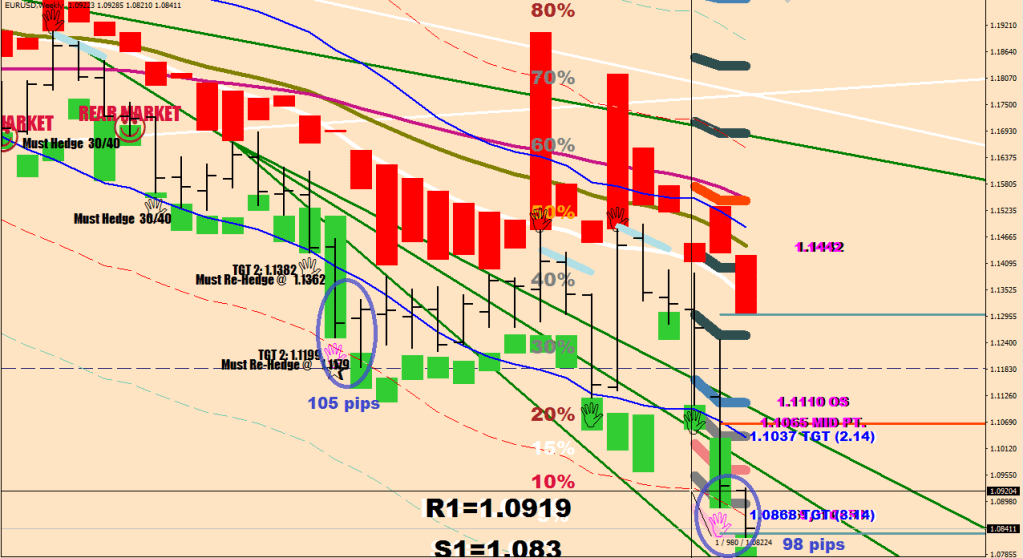
Ever since the world begun (the Rear Market) there have been mostly corrective waves.
The difference between the corrective wave and the impulsive is that the corrective one makes its high / low with optimal strength versus the impulsive one goes into excess and has to correct back with a divergence. Feel free to fry all of your E.W. knowledge.
Everyone has screwed up the wave count, particularly the ET EWs.
The orange ABC was a Wave 4. It made a lower low than Wave 3, yes.
Ok. Back to business.
Wave 3 ended with the impulsive divergence I’ve been talking about, under the under cooked C with a total of 80 pips.
Any move back to Murena (E44) was a prime sell during the heat-wave.
The following ABC took 2 full months to play out. Every wave ended with a Cover C and optimal strength.
The last thing to talk about is the Must entries, these are the moratorium numbers under / above the C-s at 27 or 30 pips. Two more pips and you have no more excuses not to take on a full hedge or a venture short.
To play these, aim for 150 pips from your entry and trail. Code 11 would be my choice after 20+ pips in gains.
Are we gonna get a lower low come next week? I think this Wave 5 has a corrective structure, and the stoch K isn’t gonna touch the 4.8 made by Wave 4, the settled value was 9.6 and intra day the lowest print I saw was 6.5 – I would call it satisfactory. It all depends on how the market would open. Some gap up would certainly decrease the chance of a beat.
…
Raw was my 7th book written in Hungarian, released it in 1997.
Back in the Summer of 59: the Baer Market entry did not work when price opened back up above the E-59, and transformed into a Bulk Market in 3 weeks & started riding the Envelope up.
The second envelope I placed at 3.5x
After Magenta push beyond the Window Envelope, Wave 3 mustered 105 extra pips beyond next week’s open, Wave 5 managed 98
Not entirely sure where the 100 comes from, but 3x fluctuation size is 96. I guess I know where Target 4 is then If you are curious, the Stoch was at 4.9 at its lowest. Strange? Not really. Same thing with the 67 momentum. Just about matched the prior reading with price 300 pips lower. This is the very definition of reversal divergence.
The difficulty of trading is that you don’t know how much knowledge is there to be had about the rules of the game and so you always seem to think that you already know enough, but you never do.
4 months ago I had no clear definitions for market type, I had not come up with a round enough interpretation of how the weekly quarter lines can provide hints, a few months ago I did not have a concept for Cover days, what preceeds a capitulation and until just yesterday I could not have provided good enough information about what makes a daily low/high a terminal one.
When you don’t know what to be looking for you are bound to be lost, bound to lose.
My one line code for trading goes like this: know the rules of the game!
This journey is paved with disproved thesis.
The latest one I’m waiting for the answer to is about momentum divergences between different wave structures. Namely can the intra wave structure divergence idea be used in the same manner for inter waves?
What I mean is this: during this bear market that was invoked by 3 closes below the 59-week EMA, we have seen two kinds of lows. Both had strength transpired to the downside, but one of them conformed with the too much love strength would kill you idea by going way below 4.9 on the Stochastic and therefore it had to get the depth right first wirh a reversal divergence.
The inter-wave dilemma goes like this: do you need another print below 4.9 or a good scare on this number in combination with the prior last leg printing a qualifier run should be enough?
⁹
The implications may be profoundly different: is this Wave prints a too strong low (a principle well known by me on the hourly thanks to my Zero-Mastodon RSI2 adventures) then this would only be finishing the Measuring leg to the downside in the coming days versus today may be a low before a return to God or at least his gate keeper, Murena.
Either way, no solid commitments should be made today.
The gazillion dollar question: is a sub 8 print the awaited divergence or a sub 4.5 but not much below is to be scored first? This being a weekend, the risk is a gap down, why, it has to be. The jump scare is in your your short term memory: last week’s 130+ pips gap down. How about a gap up then? Gentlemen, make your bets please!
8
Sorry for having no better images / source snapshot only, but I am at work & wanted to get this out today.
The 67 momentum is diverging grearly, 18-samp stoch is in the 7-s.
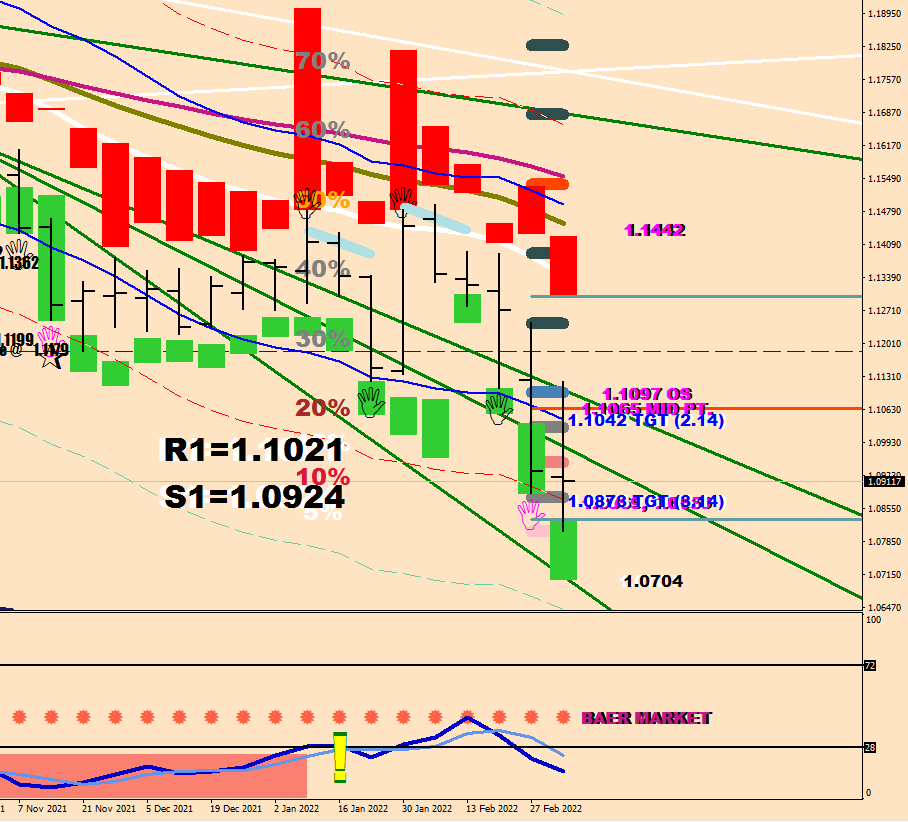
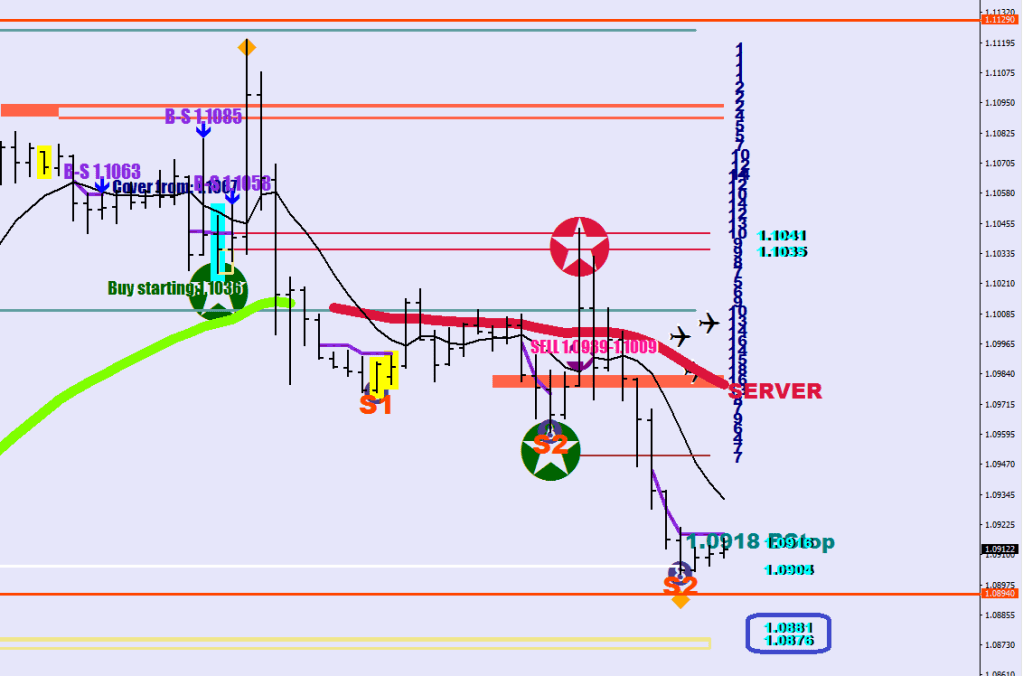
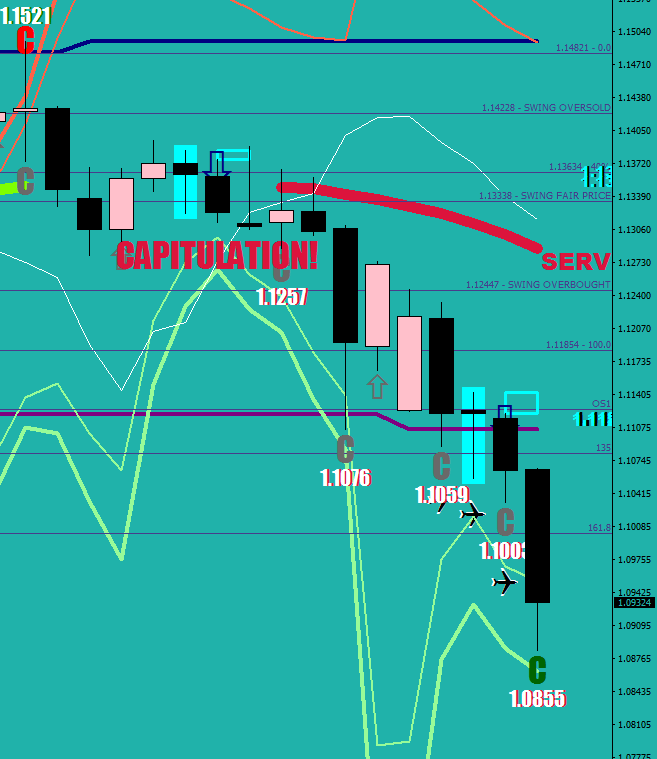
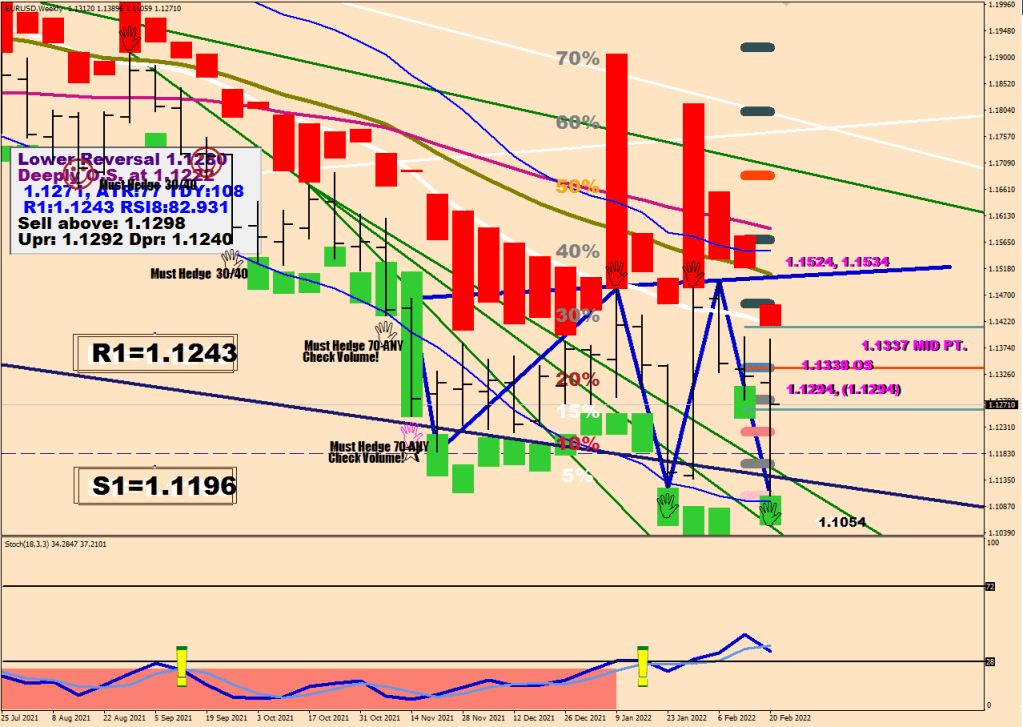
On the weekly chart we are looking at a reversal at a major trendline.
The Navy trendline is from connecting the last 3 major swing highs.
So this is a break-out back test. 1.1175 seems to be a particularly important level.
The megaphone (volatility expansion) pattern also hints a reversal. The stochastic seems to have left the oversold level decidedly.
Other weekly info: after a weekly push to the downside buy below the new weekly open any move, but statistically less than a fluctuation-sized move is expected downwards. i.e. 32 pips.
The weekly pivot would be at 1.1247.
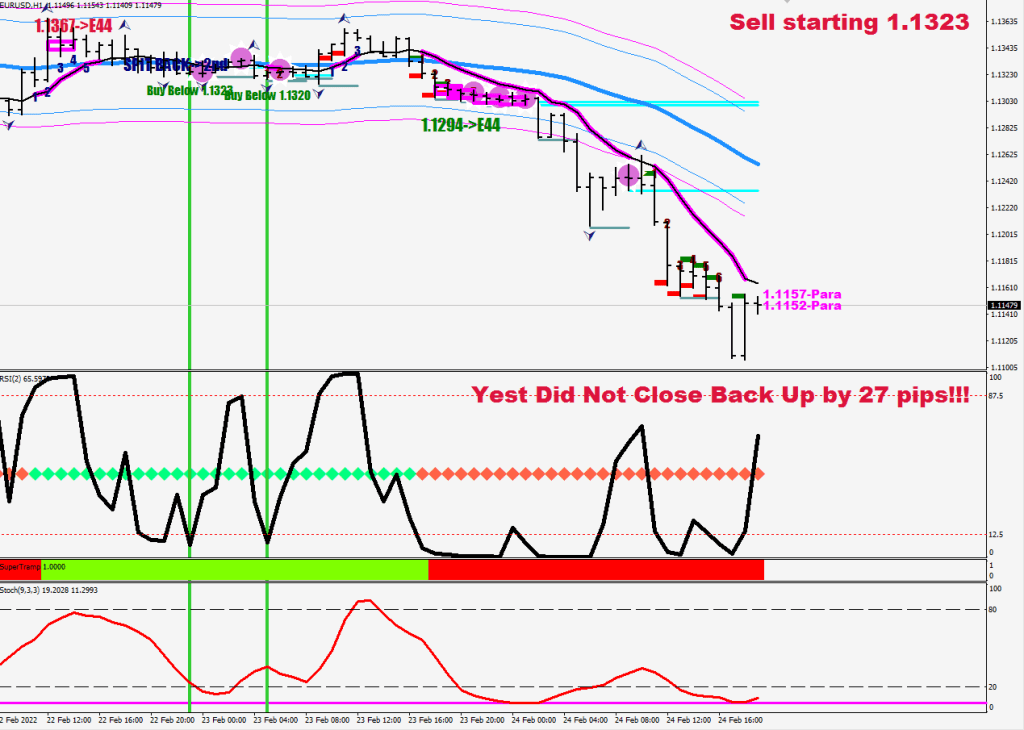
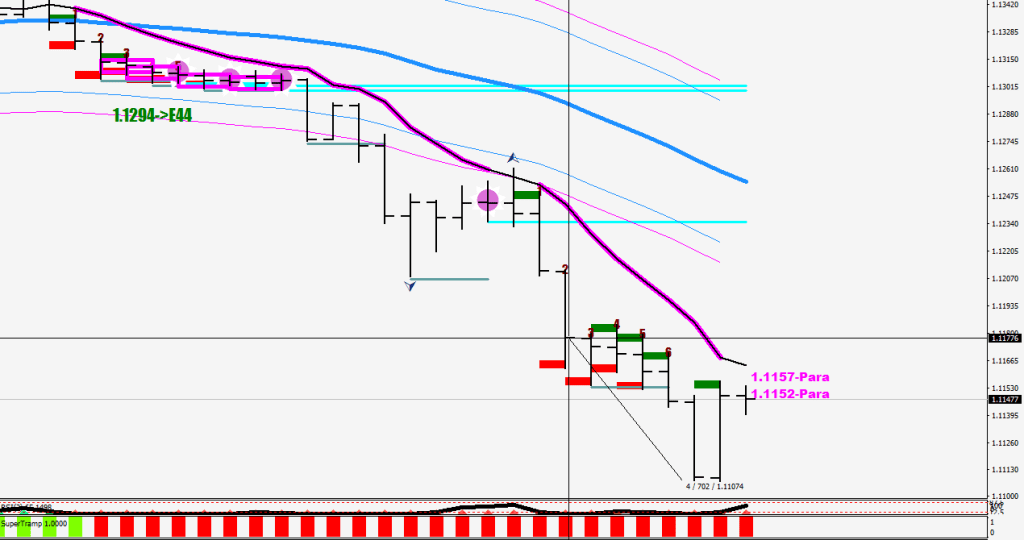
On the upside, I would anticipate some setback around the 1.1309-1.1322 area where the market profile steps are too steep.
1.1360 should be reached after some consolidation possibly on Monday.
Things would get really interesting after surpassing God (currently at 1.1342), as that would make Monday a God Day 1 which is not fade-able, and 2 days could certainly take price up to the very top of the second block, at 1.1528 – not seen since the 10th of November, 2021.
If they want to stop this catapult move, they would have to step in with force at the server (1.1336/39) with force utilizing the Wyckoff-Dudikoff-Sosnoff method. The only hope that Obi-Wan-Shinobi has is that the hourly money flow is showing some divergence and the second hump would be three fifth completed upon the dip at the open. This could buy an ABC back down to the 4-H pivot at 1.1204 or even for a catch-up with the H&S neckline, but I don’t think there is any hope to get beyond 1.1158.
I believe you should be very careful with taking downside trades.
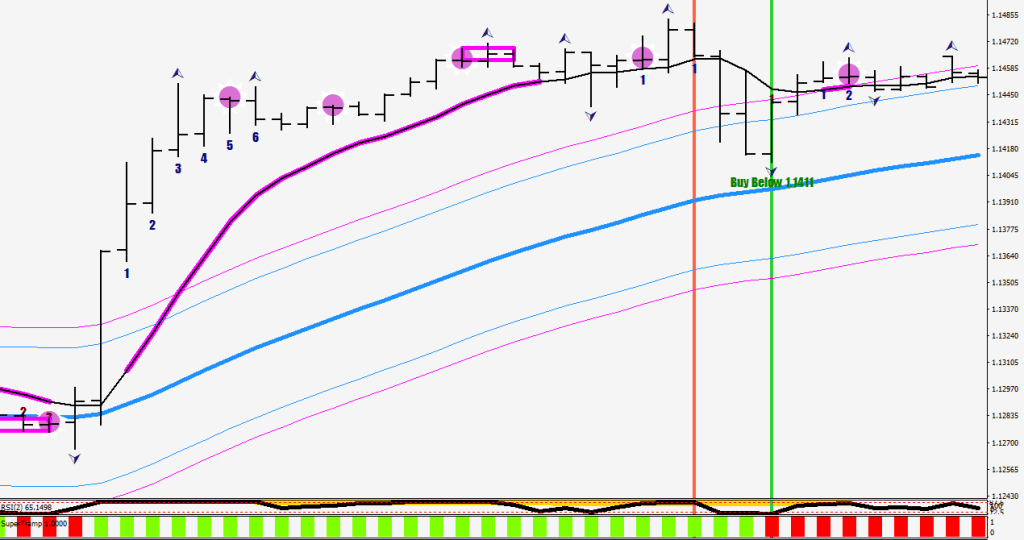
Opportunistic buys are at 1.1212 and seven pips lower. Price is currently stalling / relapsing from the same height where it started trending by closing below the Shadow line for 2 hours (purple lines).
This is a personal misery article, you may not learn much about trading, so don’t read it.
I started trading forex in 2013 after moving back to Europe. Here, in the smaller money, more scammy world you did not need 25k for a trading account, the bookmaker style, we write IOUs on a white board somewhere on an OffShore island was not particular about size.
In March 2014 I signed up for a Forex course in London. This was a month long proposition by SouthEgg Capital to try and earn a living trading Forex. Noone ever did, the company went belly up. So much for conventional risk managrment ideas.
I had 3 personal accounts throughout the yesrs. The first one was “fixed spread”. Big mistake. The second one gave me 300:1 leverage, but to avoid a margin call I had to call in and beg the clerk at the desk to credit my deposit already at any hour of the day.
I probably lost £35k of my own capital, and all IOUs got wiped off the white boards without exceptions. I even had an equity call one time, which is really hard to do: a fully hedged account can be blown up by the broker cranking up the spread until they manage to take the equity below zero.
The current, 500:1 leverage account is over 2 years old now.
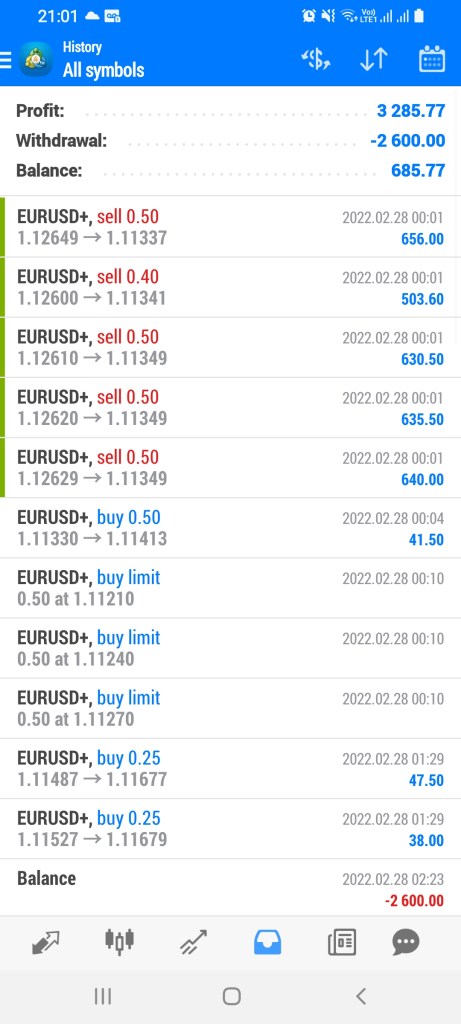
It has been blown up a few times. $146,000 got posessed by the broker, and some of it was my own capital (After taking out $7,600 later today, the net deposits would come to $35k). Not sure why, but Forex Factory shows it like all of it was deposited I have also made some withdrawals with this broker.
So now, that we pointed out that I cannot make money with Forex, let’s talk about what I can make: large percentages.
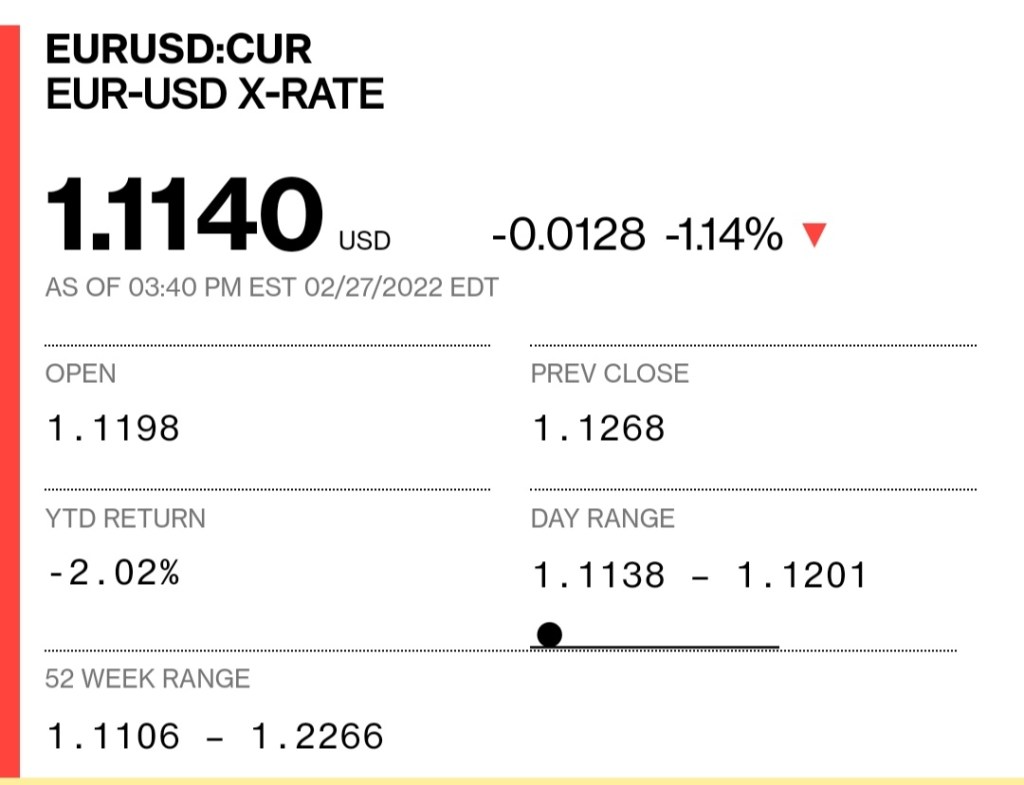
The account had $500 on it on the 23rd of November, 2021.
Today, on the 25th of February, after 2 withdrawals (2x$1,300) the equity reached $18,469, so the total got to $21,069.
The balance is higher, as I have open positions 100% of the time, but that money less the equity is the broker’s end of the bargain.
The time period was about 3 months. What does 4100% remind me of?
I have never seriously considered trading cryptos. The white board companies run some opening hours that I can’t figure out, and the crypto exchanges with access keys & wallets is a whole new level of endless scams that I am not curious about. Crypto Face and his 20 years of trading ecperience is safe from me for now. Phemex does not cater for Europe and I have no reason to start calling myself Clepto Face and start naming my indicators Market Stifle etc.
This blog entry was meant to show you how difficult it is to make & keep Forex gains, and when someone is claiming to have made 41,000% gains, be very, very sceptical & that’s all I’ve got to say. Don’t follow my lead, but learn from my mistakes as someone has to.
Geotical private-tension intetest-debate Mikhail Floomberzs climate-taper socio-physical-psycho tantrum-punktum. Take a rate hike, who cares?
To take away the edge of the upcoming recession, every country is in need of deficit spending, aka war – is all.
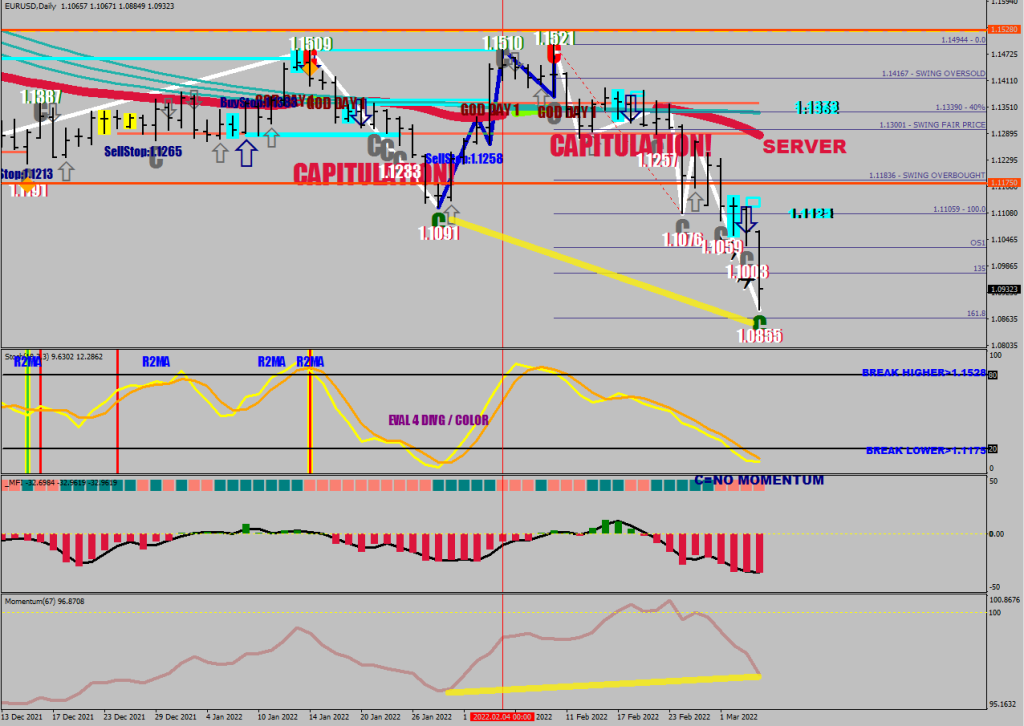
Can we all agree on the fact that smart money went short on the 17th of February and defended their holdings viciously 2 trading days later, on the 21st?
Can we also agree that yesterday did not close back up 27 pips+, hinting a coming capitulation move?
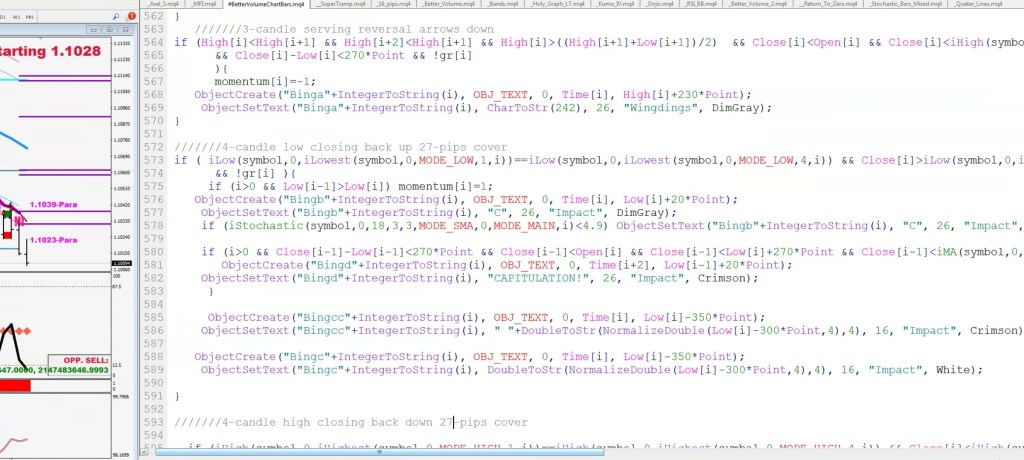
if (iClose(symbol,1440,1)<iLow(symbol,1440,1)+270*Point){
               deletetxt1("GELI");
              ObjectCreate("GELI",OBJ_LABEL,indicator_window, 0,0);
              ObjectSetText("GELI","Yest Did Not Close Back Up by 27 pips!!!",21,"Arial Black");
              ObjectSet("GELI",OBJPROP_CORNER,1);
              ObjectSet("GELI",OBJPROP_XDISTANCE,20);
              ObjectSet("GELI",OBJPROP_YDISTANCE,7);
              ObjectSet("GELI",OBJPROP_COLOR,clrCrimson);
}

if (iClose(symbol,1440,1)>iHigh(symbol,1440,1)-270*Point){
               deletetxt1("GELI");
              ObjectCreate("GELI",OBJ_LABEL,indicator_window, 0,0);
              ObjectSetText("GELI","Yest Did Not Close Back Down by 27 pips!!!",21,"Arial Black");
              ObjectSet("GELI",OBJPROP_CORNER,1);
              ObjectSet("GELI",OBJPROP_XDISTANCE,20);
              ObjectSet("GELI",OBJPROP_YDISTANCE,7);
              ObjectSet("GELI",OBJPROP_COLOR,clrGreen);
}
Nothing has changed. The Dollar was given the casus belli to print that right shoulder already (that got upgraded to a beat with a reversal-divergence).
There were two closes outside the swing of things, Dollar buying ensued. Eur/Usd is nowhere near embedding.
At first nobody wanted to buy Dollars, now there’s a war going on somewhere and the greenback becomes… simply irresistible. I suspect a sucker-trap.
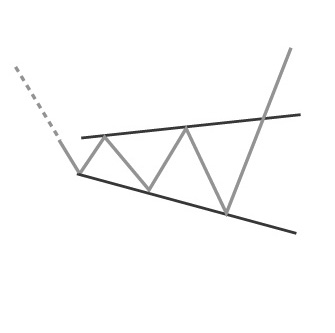
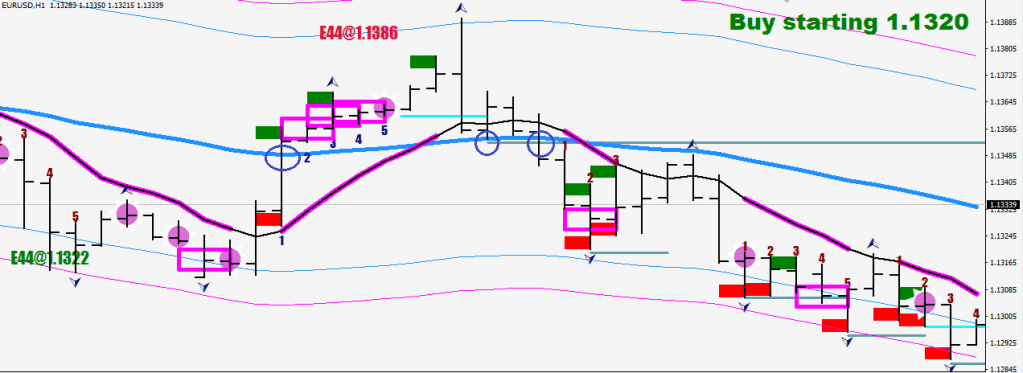
The next step is to lay down definitions and guidelines for trading a trending market.
Trending market: more than 1 close outside the shadow line of E44
Figure a
Play: fade 1st return to the interaction line (E8-o), measure a target field from the first F8 fractal: 30pips out (in a not embedded market), if the E8-o does not let go for more than 2 hours after re-connecting (figure a); if price closes away from the E8-o for the second hour after the re-connect, go back in the direction for an additional 70 pips (figure b)
Figure b, 1.1205 is a plausible zero to return to
Play 2: fade first return to E-32, target the resistance near the low/high
What do you buy come next week after a push without embedding? It was relayed in the Neverending Embedding #2.
The Window Envelope is at 1.1097.
I’m pretty sure, this Monday is going to be a mean one.
Now, let’s talk down the elephante from the cherry-tree.
We are only interested in the reversal divergence if the market is trending.
The very first divergence may not always catch the ultimate reversal, but you should see some green pips, and if stopped out, wait for the next bus to come.Strip-tease reprise, yes. Safety & shadow lines now around the E-44 at 35 and 45 pips displacements. Pendulum is my middle name.
Now, the usual Hudson Hawk joke: I wish you would lay off the pasta. Spit it out.
The E-44 has 3 modes. The normal mode is repulsive. It wants to reject price and chase it as far away as possible.
There are no back to back hourly touches, like the MA isn’t even present. The price starts from one end of the pendulum and makes it all the way to the other, no problem.
The latent mode is a digestion-attempt. If price hangs around too long in its stomach, say 6 hour or more, the E-44 is going to spit back the price.
Price goes from a safety line to the E-44 and never makes it to the other safety line.
The 3rd mode is the snake bite mode, during a trending (embedded) market. The slightest touch may provoke a violent blow.
During trending the price is likely to make closes beyond the shadow line and has periods when it is unable to return into the swing of things.