So yeah, I grew up with some extra background radiation at the mountain of Mecsek. We lived in a place that was called Uranium City (Uránváros). My mom used to work for the Uranium mine. The highlight of her life was handing over the flowers to Juríj Gagarin when he came to visit.
Guess whom we were exporting to. Of course they had to load the uranium onto a different train in Záhony, at the Hungarian-Ukranian border. They were always afraid of Russia pushing into Europe on a train, thus the incompatible rail span was invented. Some things don’t seem to change.
After Chernobyl the basic communist joke was about “radiant smiles”.
Oh yes, you came here to learn something about trading, so let’s proceed with that.
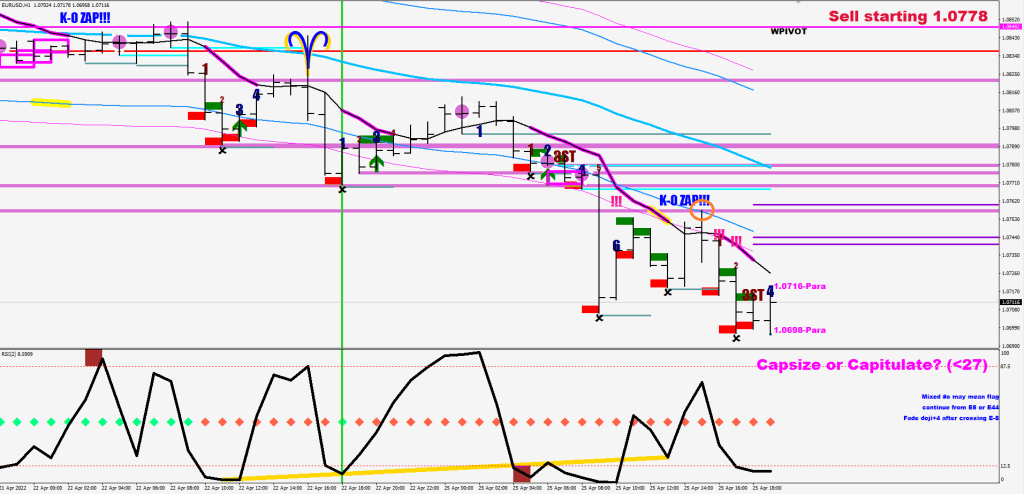
3 exclamation marks mark the spot
The exclamation level is where price steps outside the pendulum for a space walk (5 pips extra). This is where an effort to keep the price out is going to be expected on the return.
if (i<50 && Close[i]<E44l2[i]-50*Point && Close[i+1]<E44l2[i+1] && Close[i+2]>E44l2[i+2]-50*Point)
where E44l2 is the lower bottom pendulum band
They actually sold the previous low for a lower low (orange circle).
continuation divergence spanked
There was gonna be selling, regardless of the outcome of the French presidential elections.
There was 33% chance of price making it to the orange line yapering to 16% by the redish line without having to recharge.There was 0% chance that an impulse wave would end on strength.
The brown box is the highlight of the continuation divergence – busted in this case.
Once that low gets undercut, the divergence gets eliminated.
This is where we need to get a bit deeper into the separation numbers.
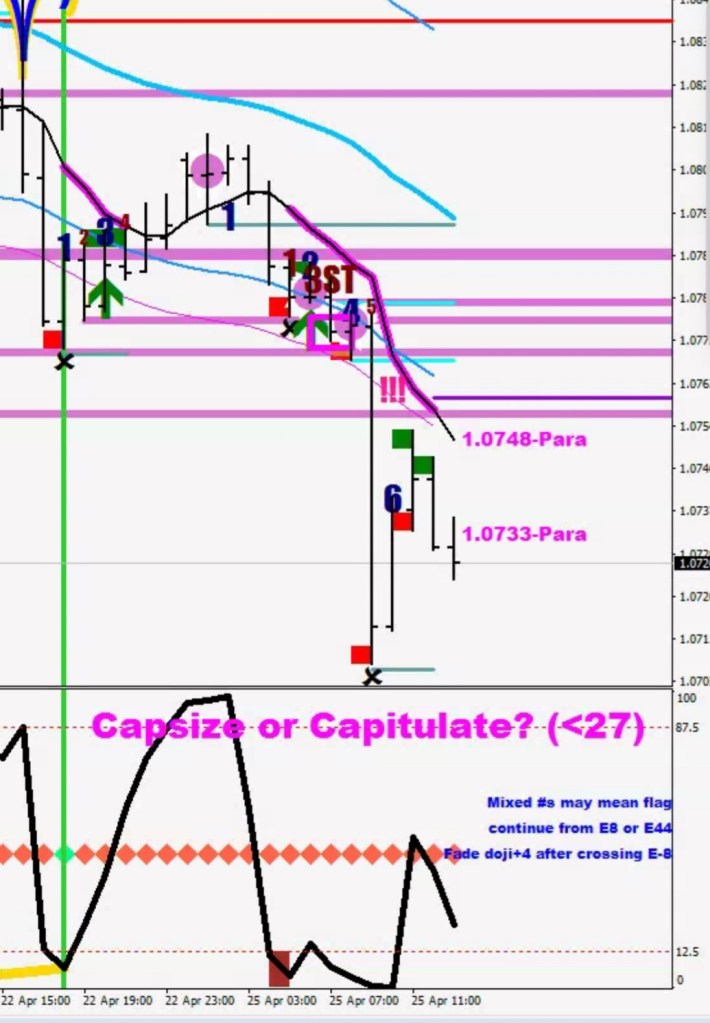
When a support / resistance level is made during 2-4 hours of separation, an immediate bounce (I call it touch and go) is initiated if the furthest six pips get touched by the upcoming hour (often right at the open).
These, reflex counter moves start right outside the pendulum bands and result in a counter move that gets capped either by the hourly E-44 or a slight beat of a new born doji (i.e. 4 pips).
To fail in a proper manner you need 5+ hours of separation or the back test of a recently printed support, but not within the next couple of hours and the current RSI2 leg cannot hit the floor (<4), otherwise the impulse leg has not ended.
Another numbers remark is that a mixed bag of different colors usually means a flag.
Cilantro Fist, the philantrophist philatrosits by your side.
– I only have subsidies for you – he says.
Silly, doesn’t he know that the Philantropicana drinks are free?
Let’s change the climate. Ooh-ooh, I change the world.
This one is gonna be a new foundation course. The tab is gonna get picked up by my new company, cheers.
Presents: the two parts of a terminal move.
Forget the idealistic world of Elliott Wave.
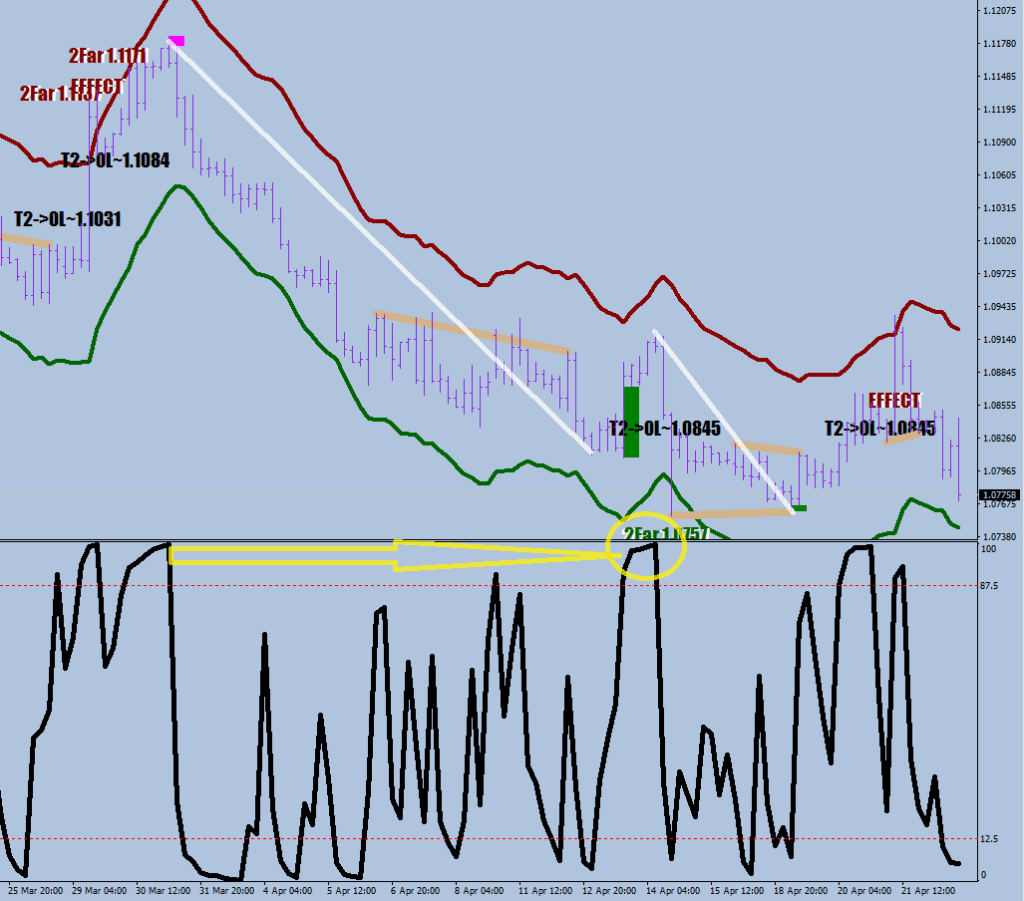
Every terminal move can be divided into two parts, the measuring leg and the divergent leg.
These two are separated by a Zero aka a continuation divergence. To find these divergences between the legs, we need to remember two things. One is that the measuring leg comes with a cross over of the hourly E-44 and that the best things in life such as the RSI2 are free.
Let’s try to appreciate what we are talking about here.
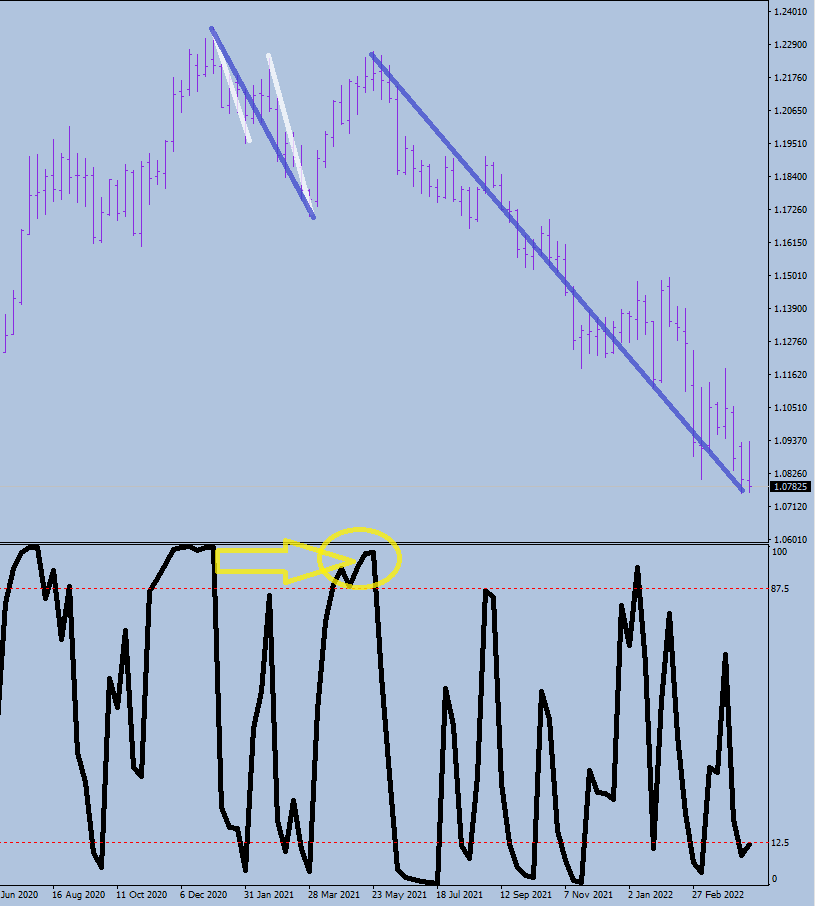
A 4H example of a continuation divergence (circled) separating the two legs.
Here’s an hourly example to the downside.
…and one to the upside.
The measuring leg crosses over the E-44.
When a leg becomes too parabolic, you may have to go down a time frame to sync up with the speed better.
On 30Min the E44 is E88, duh.
The first point I’m trying to make here is that it does not matter if you want to see 3 or 5 waves.
What matters is that there would be the divergent leg starting from the continuation divergence.
The second point is the fractal nature.
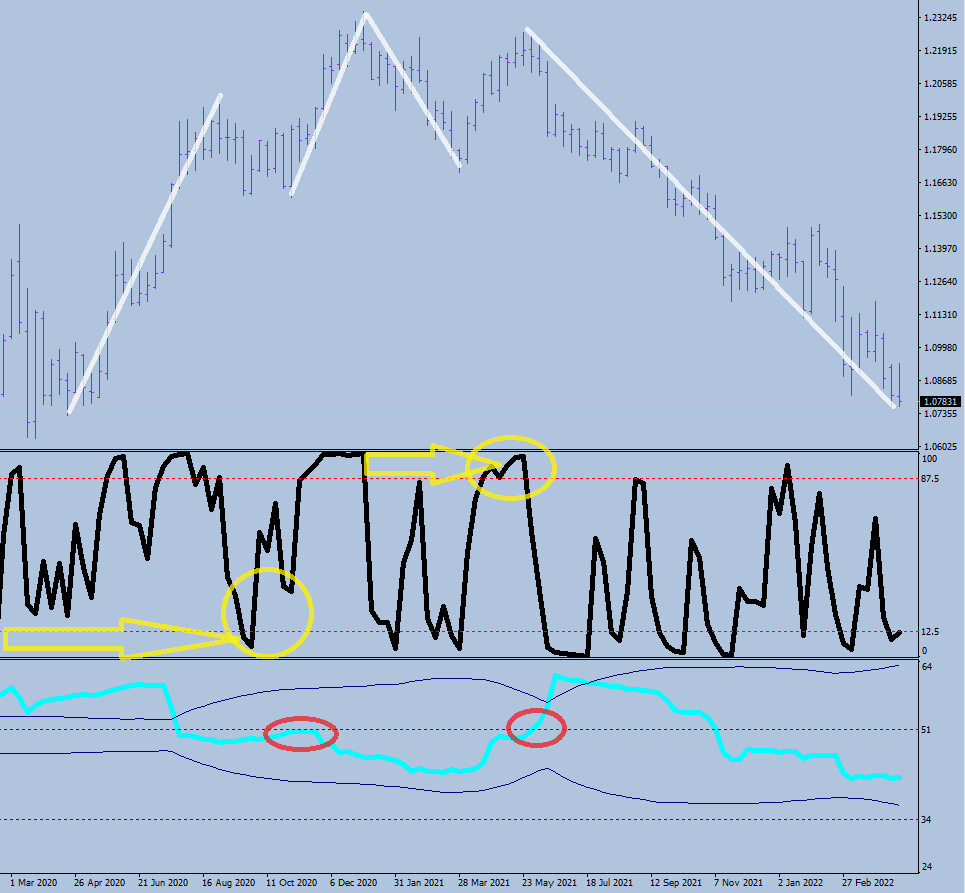
A measuring leg + divergent leg terminal sequence may be simply the Measuring Leg of a larger time frame move. The to white lines on the daily chart above are the same two lines (also as the first leg) on the weekly chart below.
Also, the continuation divergence makes the fractal energy consolidate in a rapid manner, at least tagging the full charge level.
On the upside the trend reversed at a 45 reading. The current CI is about 42, for the 3rd time. The two examples that made it to 38 and below were pushing on the StdDev band. Other times a dip below 45 was enough to make a full reversal.
– a lesson that has not much use for anyone without proper plots –
Let’s scare you off first with an example of how you could have known that the gap up was a sell on both accounts.
Image without explanation.
If you take nothing else away from this one, at least remember the importance of the top of the hour.
Also it does not hurt to learn the concept of separation from the 8EMA of opens. Most moves would fail within 2.5 hours, meaning on the second bar away from home.
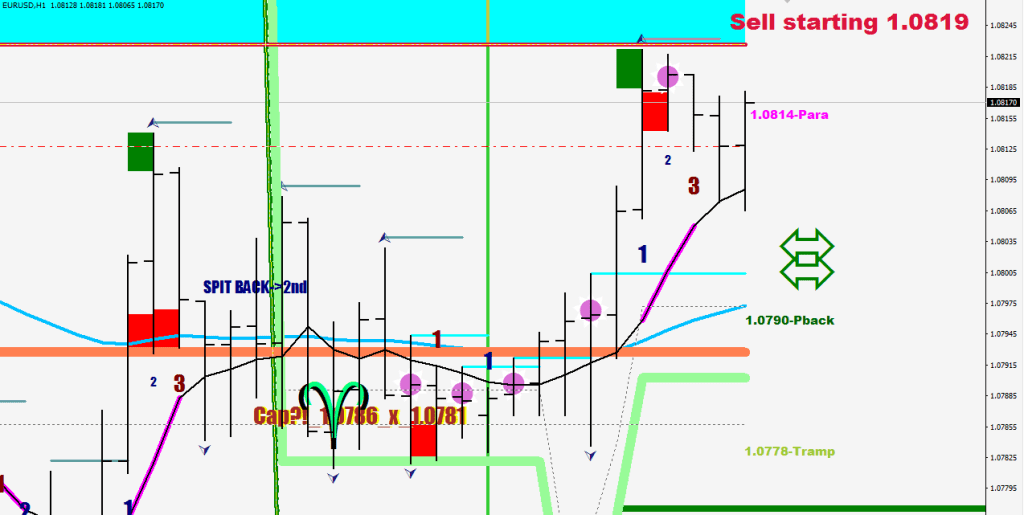
Here’s your quick warm up exercise. Was there ever any reason after the blue #1 separation on the upside to go short?
Of course not. #1 scored by taking out one SuperTramp line. #2 and #3 both held this line by the close. There was a quick re-visit to the 8EMA and thus success was consolidated. The short side was not a high probability trade, and was capped by the 8EMA.
The pendulum bands are 35 and 45 pips displacements of the E-44 HL2.
The SuperTramp lines are 25, 32, 52 and 62-pip displacements (all the King’s four horsemen) of 6-sample hourly lows and highs tied to a directional logic.
  if (NewDir[i]>0 && greenhigh[i]!=greenhigh[i+1]){
         u25[i]=iHigh(symbol,0,iHighest(symbol,0,MODE_HIGH,6,i))-250*Point;
         u32[i]=iHigh(symbol,0,iHighest(symbol,0,MODE_HIGH,6,i))-320*Point;
         u55[i]=iHigh(symbol,0,iHighest(symbol,0,MODE_HIGH,6,i))-520*Point;
         u64[i]=iHigh(symbol,0,iHighest(symbol,0,MODE_HIGH,6,i))-620*Point;
      }


      if (NewDir[i]<0 && redlow[i]!=redlow[i+1]){
           d25[i]=iLow(symbol,0,iLowest(symbol,0,MODE_LOW,6,i))+250*Point;
           d32[i]=iLow(symbol,0,iLowest(symbol,0,MODE_LOW,6,i))+320*Point;
           d55[i]=iLow(symbol,0,iLowest(symbol,0,MODE_LOW,6,i))+520*Point;
           d64[i]=iLow(symbol,0,iLowest(symbol,0,MODE_LOW,6,i))+620*Point;
      }
the directional logic makes a switch after 5 consecutive hours of the SuperTramp (with the settings I mentioned earlier) comes up with a royal flush
  if (NewDir[i]>0 && NewDir[i+1]<0) greenhigh[i] =  iHigh(symbol,0,iHighest(symbol,0,MODE_HIGH,1,i));

      if (NewDir[i]>0 && NewDir[i+1]>0 && High[i]> iHigh(symbol,0,iHighest(symbol,0,MODE_HIGH,6,i+1))) greenhigh[i] = High[i];

      if (NewDir[i]<0 && NewDir[i+1]>0) redlow[i] = iLow(symbol,0,iLowest(symbol,0,MODE_LOW,1,i));

      if (NewDir[i]<0 && NewDir[i+1]<0 && Low[i]< iLow(symbol,0,iLowest(symbol,0,MODE_LOW,6,i+1))) redlow[i] = Low[i];
Mlanden coded most of this, which you can tell by the variable names and syntax used.
The problem with every trader is that they think that they can trade everything.
The problem with Elliott Wave traders is that they aren’t able to write an algorithm for their ideas.
I have been trying to show you what the difference was between Impulse and Corrective waves from the aspect of a programmer on this blog for some time.
Grabbing an end to a Corrective wave can be as easy as
getting the oscillator setting right
monitoring for an exact stochastic range
having a definition made for a cover low / cover high
Getting the end of a corrective daily wave right within the context of having to wait for the stochastic settled print and therefore you can only act bravely right around the close of the CAPping day is not a major challenge for a good algorithm coder.
i.e.
 ///////4-candle low closing back up 27-pips cover
   if ( iLow(symbol,0,iLowest(symbol,0,MODE_LOW,1,i))==iLow(symbol,0,iLowest(symbol,0,MODE_LOW,4,i)) && Close[i]>iLow(symbol,0,iLowest(symbol,0,MODE_LOW,2,i))+270*Point
         && !gr[i] ){
        //if (i>0 && Low[i-1]>Low[i]) momentum[i]=1;
      ObjectCreate("Bingo"+IntegerToString(i), OBJ_TEXT, 0, Time[i], Low[i]+20*Point);
       ObjectSetText("Bingo"+IntegerToString(i), "C", 26, "Impact", DimGray);
       if (st18[i]<9.5) { ObjectSetText("Bingo"+IntegerToString(i), "CAP", 26, "Impact", DarkGreen); momentum[i]=1;
         if (st18[ArrayMinimum(st18,10,i)]<4) ObjectSetText("Bingo"+IntegerToString(i), "C77", 26, "Impact", LimeGreen);
As for an end of an Impulsive wave, where the initial capping gets exceeded and divergences start clocking for the miles, that is a ranking challenge.
You need to write in your head the things you are looking for in a descriptive language before you can turn to start coding it for real.
Say it after me:
I am looking for a settled candle
i>0
I want a new low to be made within the last 5 candles.
…and the back test is making the plots, i.e. thick pale green highlights.
Nothing’s ever gonna be perfect in the world of trading, but this is as close as you can get to an accurate binary decision around an impulse wave.
…
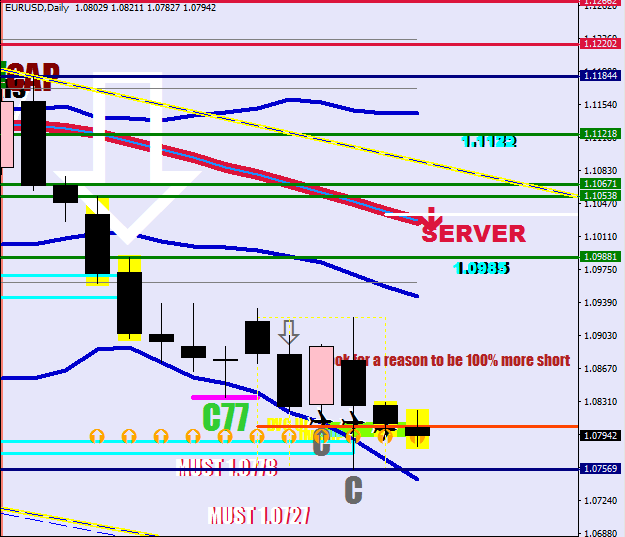
It is very rare to see a black candle making the ultimate low of the impulse wave, I found only 1 example in the last 5 years, and even that was not a rolling pin.
There’s a very good chance that the current low is going to be undercut by a candle that is closing up.
The moratorium is all the way down to 1.0727, but I think a handful of pips would do it.
Just a quick reminder of price is going to be headed when the impulsive wave caps out.
Price would be moved, lifted higher by a higher love. Why? Because sometimes it feels like a motherless child a long way from home.
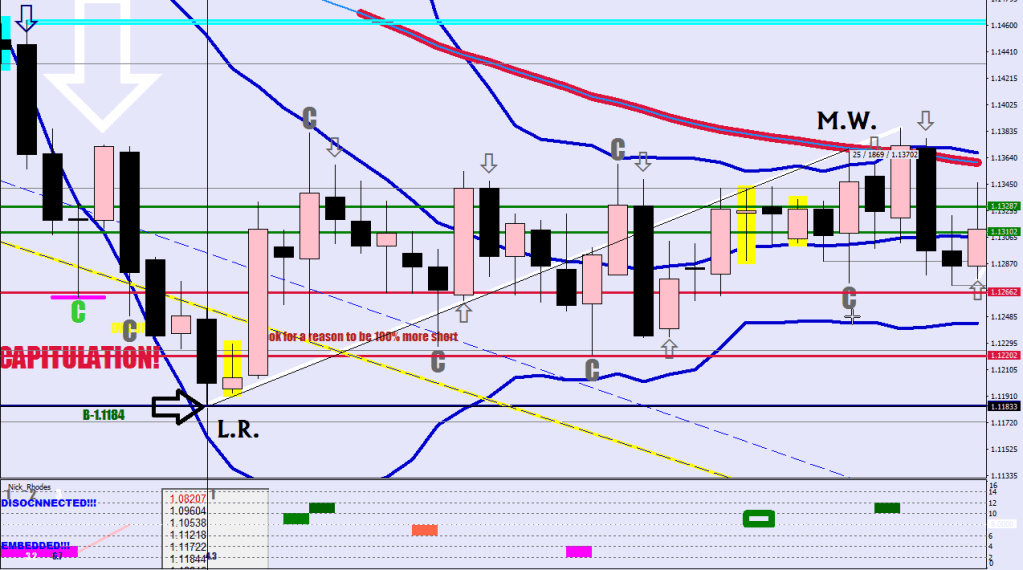
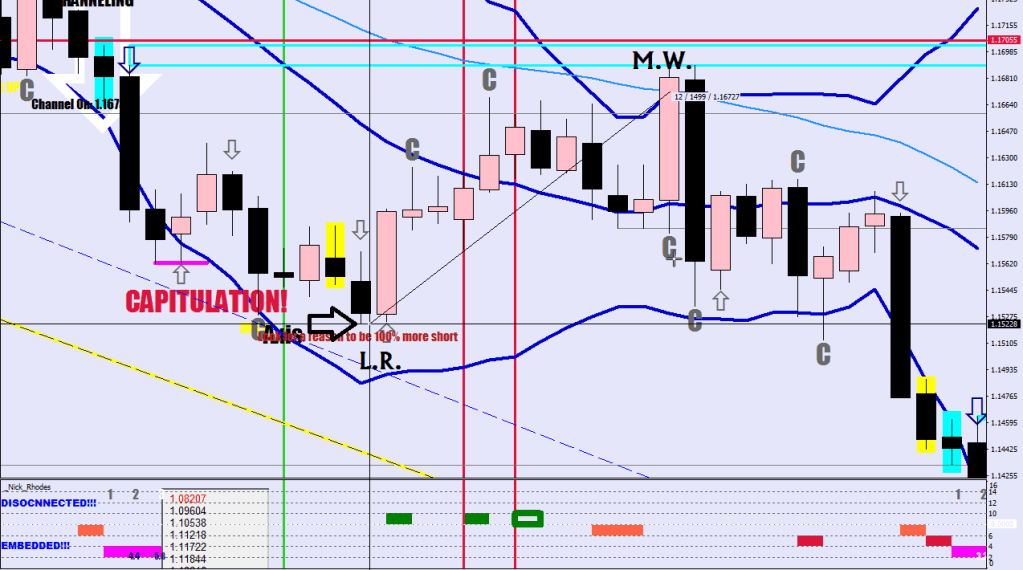
After the rigo mortis of the impulse wave sets in, L.R. (Losing Religion) finds his way back home to M.W. (Murena Williams – E44). Why? Because this is a razor act.
25 trading days, travel distance 189 pips. What followed this one was a 97-pip reaction from the M.W. and another 210-pip leg up before the reversal. From the point of encounter price ultimately managed to travel higher by another 113 pips.12 trading days, travel distance 149 pips.7 trading days, travel distance 152 pips. This is the only example of Murena Williams letting the ball slide by by 94 pips.7 trading days, travel distance 151 pips.? trading days, travel distance ? pips. Server = Mama Murena.
Racketeeling.
This was an actual English class at school. We had to translate the lyrics of this song. Also there was a British teacher who was hooked on Tracy Chapman and Suzanne Vega songs. What was his name? Luka? Was he living on the second floor? Did he have a fast car? Can’t remember. I certainly wasn’t kidding when I said I grew up with MTV.
Back in the swaddling clothes & back to the drawing board.
When others have option chains pricing in a probable move for the near future, I have a CI chain.
See, I was still wet behind the ears when I was already fascinated with fractal energies, as it goes.
I used to get so grumpy when we ran out of consolidation that I could spread evenly on my bread.
There was nothing besides MTV and Optionslinebacker that I could subscribe to, so did that.
Full charge, discharge, choppiness, Loch Ness, the regular miserable childhood that everyone’s going through but I don’t want to spare you the details.
While Doc Severson was using his 13-sample CI for Iron Condors mainly…
I came up with the concept of the Energy Bands instead.
Here I can be seen pondering on my tricycle about how to make the CI Moat instrument independent.
Now, fast forward 44 years and first take a look at the 48-sample 15-minute CI not being able to cross over 53 for a full consolidation.
Now, if I cropped the whole label yesterday – looks the same still, you may start to get some ideas about why I have been living in the world of pendulums quasi from the beginning.
The purple arrow above is the consolidation mean or the axis of the pendulum. I spare you flipping the image on its side this time.
 while (!(ChoppinessIndex(12*4,i+1)<53 && ChoppinessIndex(12*4,i)>53))
   i++;
   weight=(iHigh(NULL,15,i)+iLow(NULL,15,i))/2;
I went with the 15-minute for precision.
With this 3-day ATR based tool I practically invented my own Implied Volatility tool. Reaching 1 ATR distance from the weight in either direction has the probability of 66%, reaching 30% more drops to 33%.
From the beginning of time, humanity had only one question: when is the future?
Ever since there’s been stock market, a second, less articulated mutation of the same virulent question was formed: Where does an impulse wave end?
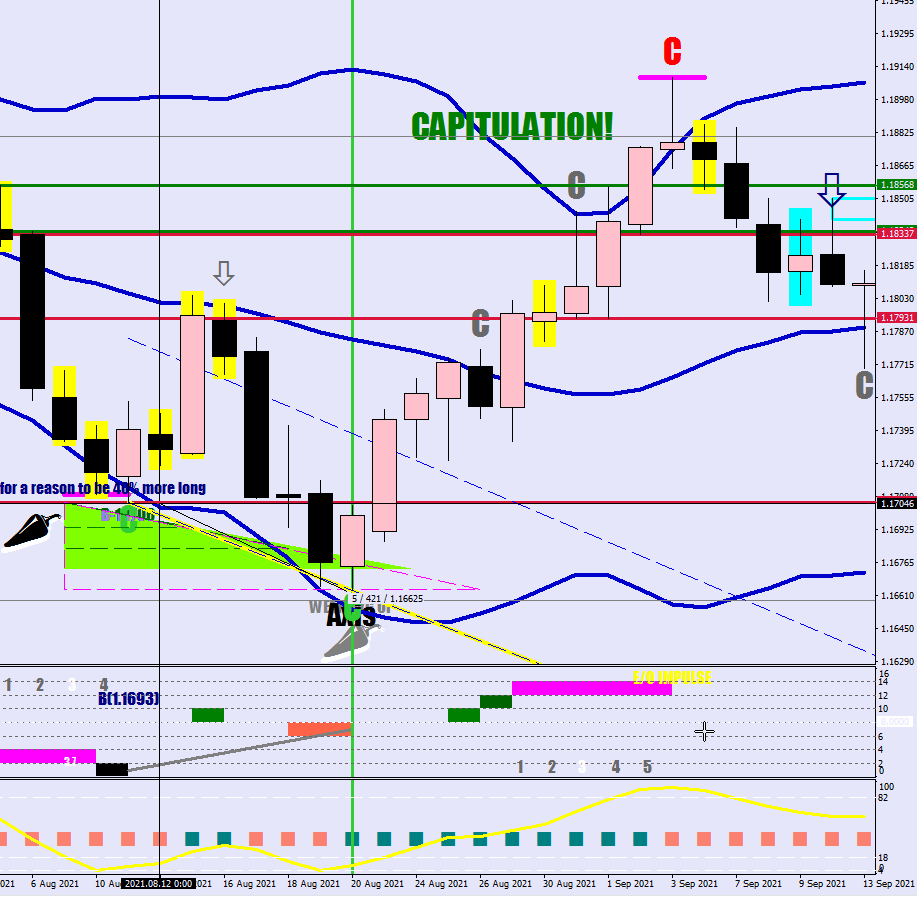
Let’s set the stage. Imagine it is last Friday, the market makes a cover low with optimal daily stochastic reading, and all is looking good for a corrective leg ending and a rally starting.
Green cover low got downgraded to lime cover low due to the next day’s muted accomplishment.
So market makers got creative. They wanted more longs on their books to be able to hand them out to the suckers on the way up, so they gapped the market up. Nothing too crazy, but was enough to make the weak hands part from their longs at a break even or worse. The upside got limited by these deeds: when the gap high was exceeded on the second up leg, the new low was already a secured prospect.
If you pay attention, although the resurrection candle came with a higher high and a higher low, it was unable to exceed the highs of the previous 2 candles.
With this fishy, meet my hook act they turned a corrective wave into an impulsive one with elusive ending summoned.
If you look at the previous divergent endings…
The market undercut the low by 56 pips 13 trading days later for a swing low.The market undercut the lime cover low by 42 pips 7 trading days out. The upside from the first lime C was 202 pips.The undercut of the lime cover low was 77 pips 5 trading days out. The total upside was 220 pips from the lime low, but it cost 41 trading days to get there.
…what you would find is that the swing lows do not coincide with cover lows, they simply choke without further impetus and the move back up looks like a bloody mess dragging on seemingly forever and getting nowhere fast. Instead of a clear cut correction in the neighborhood of 250 pips, they end when the market becomes overbought enough (market makers managed to dump their longs) and the market is still within a hundred odd pips away from the swing low before starting the next dump and pump scheme.
Gapping the market enforces transactions at the open with stops & target hit.
As you can see, after the divergence is set, the market is not going to drop much further, but whether it is going to be 2 or 77 pips more is impossible to say. If you go short, you are playing with fire, if you go long, you may be underwater for a week or more.
Trading is just an illusion. I just showed you an example of turning a corrective wave into an impulsive by the simple act of rigging. Good thing no one’s ever asking the question: what is moving the market when there are no transactions being made?
Fundamentals must be the most exact measurement of value then. They can even make the price gap! George Schwartz Soros and his reflexivity tss! Go fundees!
Think twice, do you wanna be a Kennedy or a Fundamental?
Is the fundamentalist a form of a mentalist?
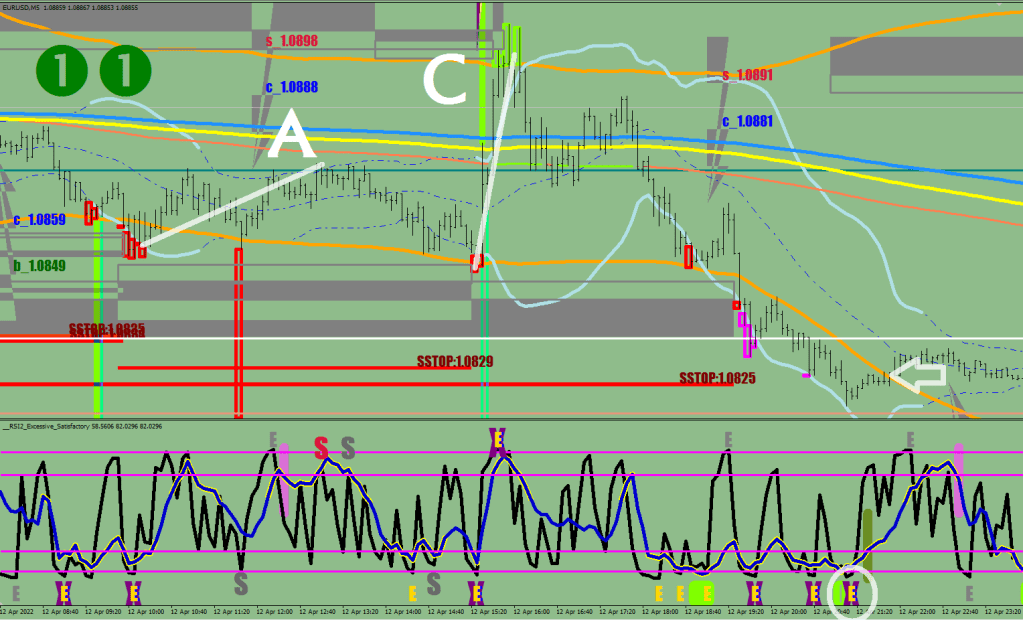
Here’s an E.W. dilemma for you. Without indicators, this move up looks like an ABC.
With indicators, you can see that the stochastic reading showed excess 3 separate times.
Was this 3 or 5 waves up?
W-wait a minute!
Us3: market makers, fundamentals and the Hannities.
So yea, I needed every brain cell I had to figure out what the current program was.
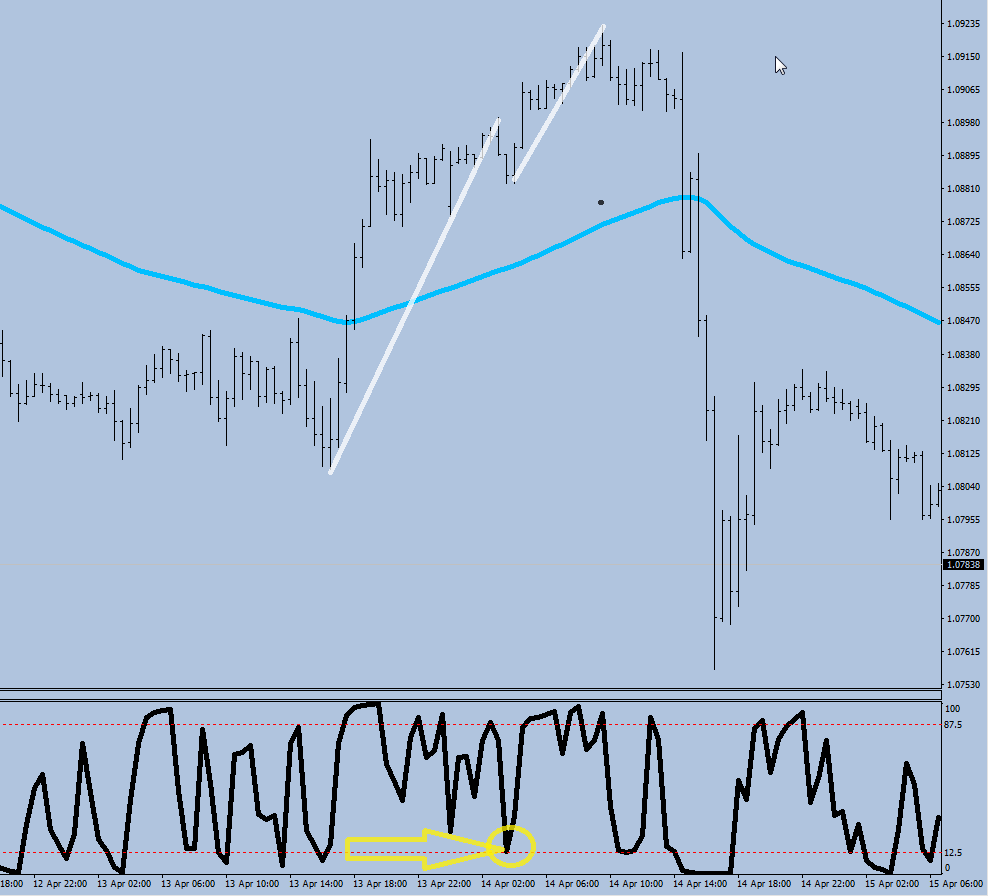
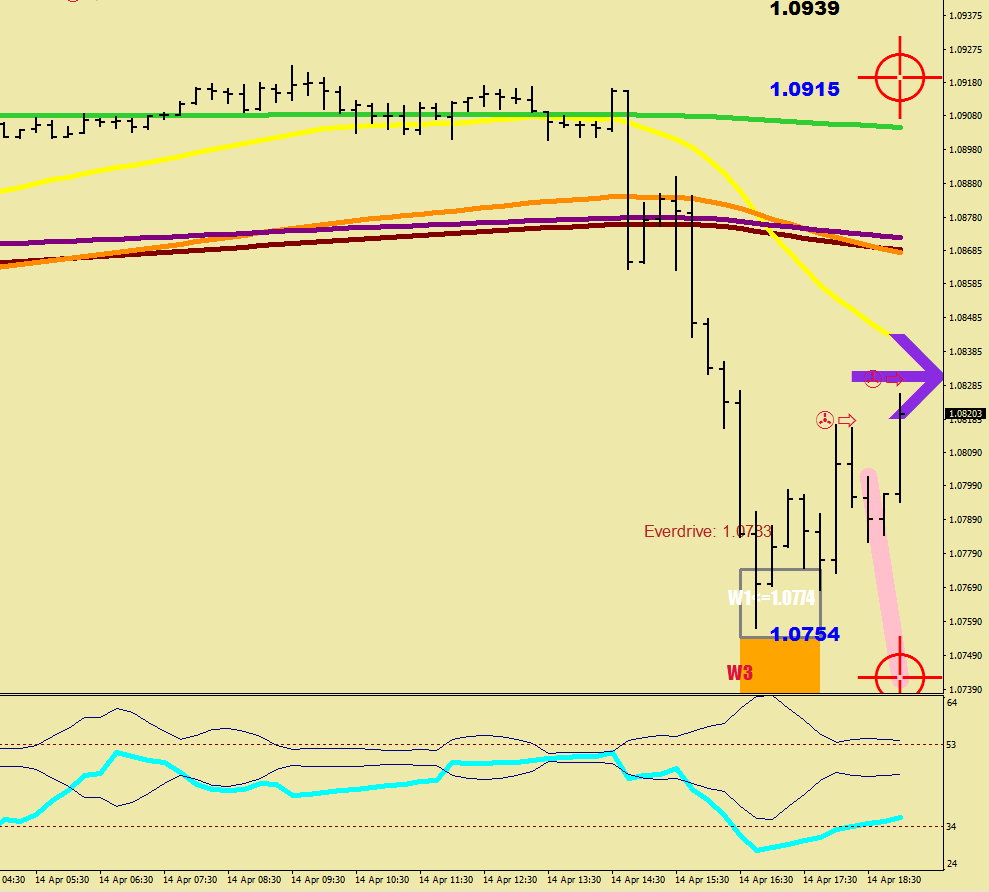
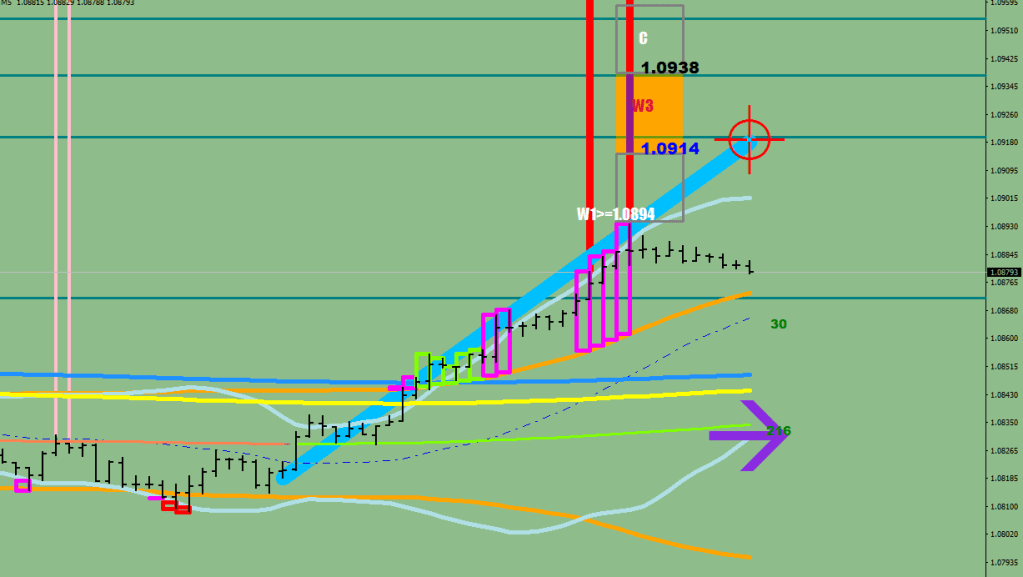
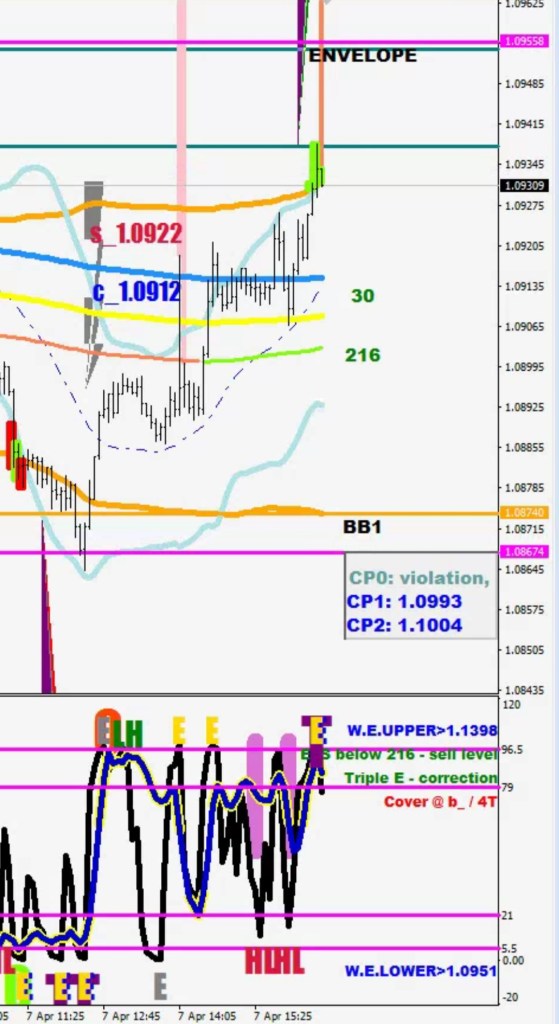
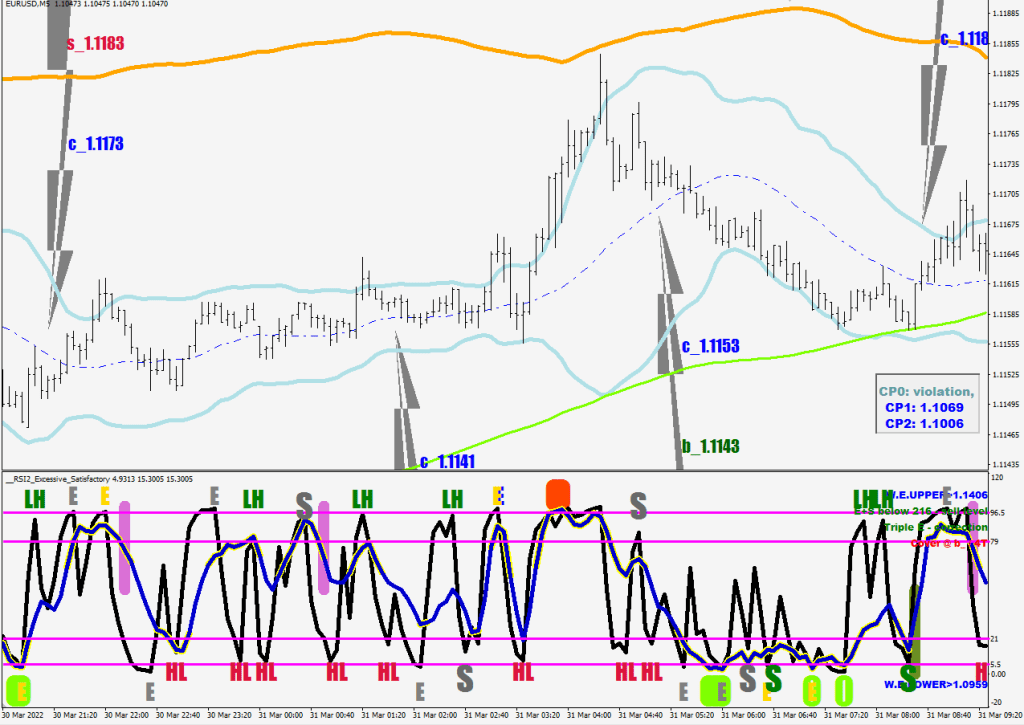
Sell double volatility breaches (preferably divergent legs) as long as they are made below the window envelope and target a new lower low (216 sample on 5 mins). Brother Bollinger gets missed by 5-10 pips every time.
E-X Machina. The Window Envelope (14 samp) is at 1.0918 this week.
Now I feel violently happy.
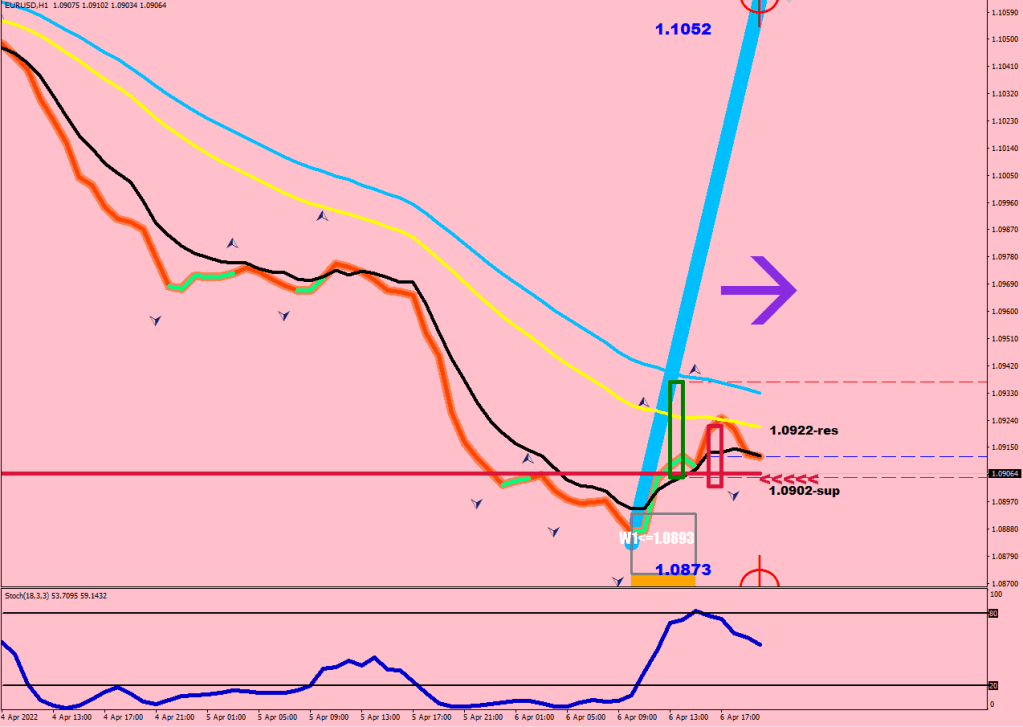
When you know that a Wave 3 would come in starting 1.0915, then you know that a wave 1 is likely to fizzle out 20 pips short of that. I gave you the 15-ATR Targets Pro for a reason. Use it.
From our editor and circuit raper breaker, Nick Rhodes.
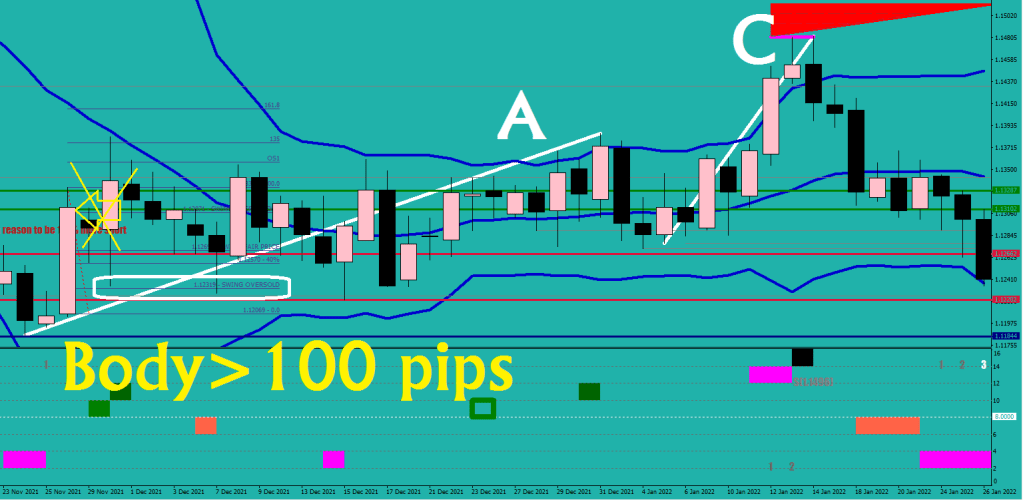
Pay attention to the magenta fields exceeding one day.
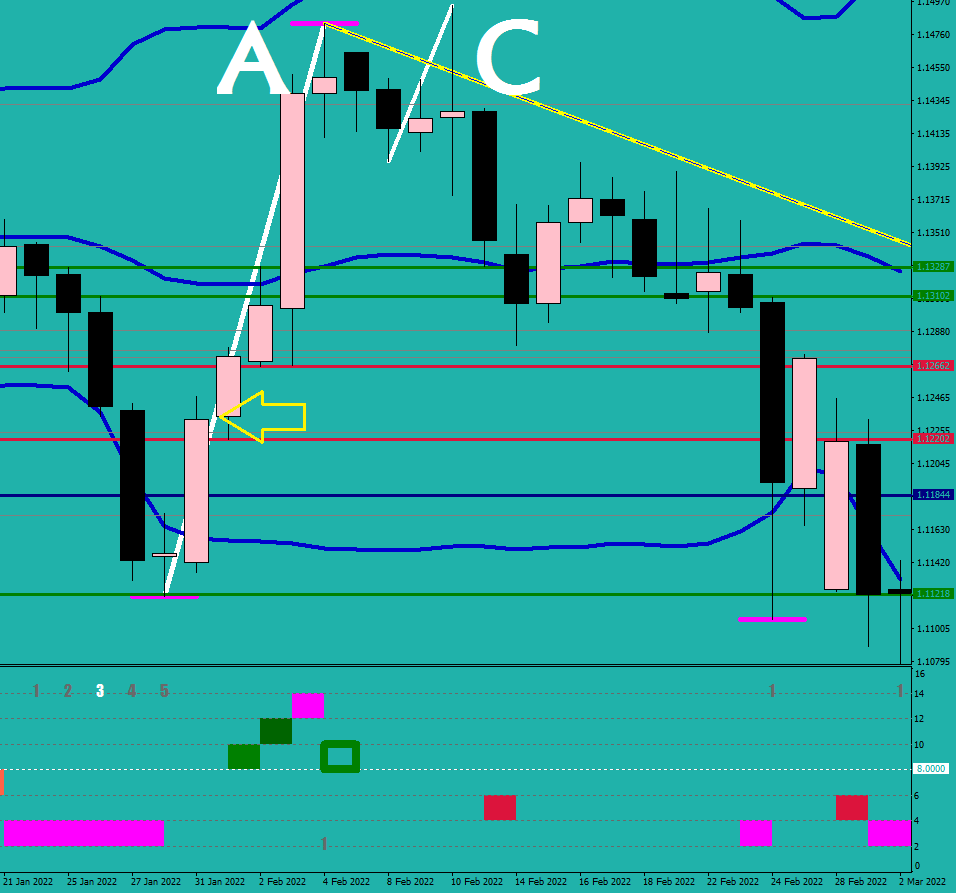
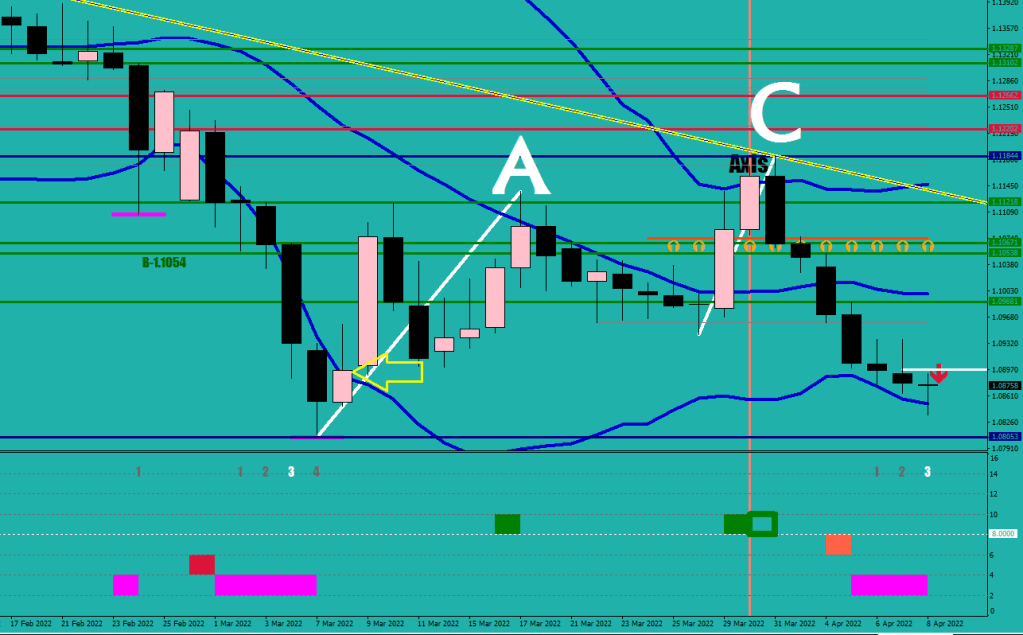
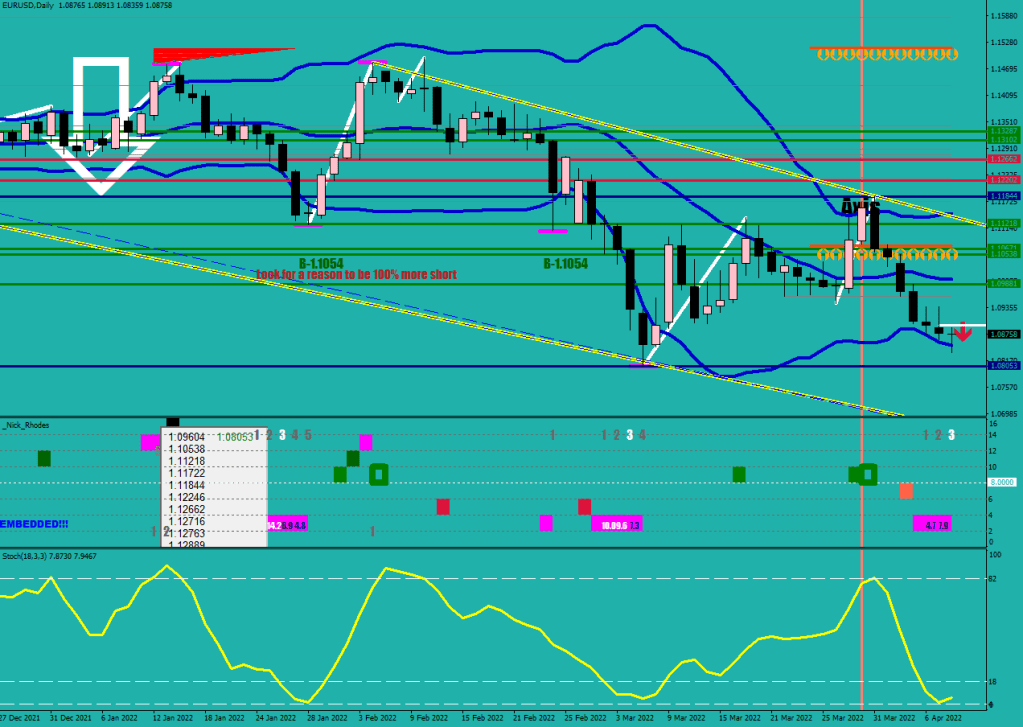
When the time is up, resurrection sets in for a move to be making an ABC sequence made up of a measuring leg and a divergent leg that is going to be improving on the ultimate swing high.
Therefore the game plan for Monday is (it has to rally at least 60 pips from the prior close first):
If the body of the candle exceeds 100 pips, buy near the oversold level of the day’s range.
If the body does not exceed 100 pips, buy right before the daily close for a 220+ pips move up.
Now, concentrate on the main issue here. 236 views over 8 years, what is wrong with people?
Bjorn Lynne seems to be the most under appreciated musician on YouTube.
Today we are short on teachers, so I’m going to hold the biology, music and trading lessons in one.
Let’s start with Finland. How can a small nation like them be such a powerhouse of synthetiser music? This remains a mistery.
Wonderful you and me. I actually have this CD.
Shrieks and Sighs and Calm Delight are some of the master pieces of Neuroactive even in terms of the poetry involved.
The logic of the “you’re gonna leave now, and hope for something better” still fills me up with joy about how different it is.
Kimmo’s voice is incredible.
Kebu is a true heavyweight champion of composition as well as a virtuose player.
Just what I would like to hear on my funeral.
Once I make it big, he’ll be the first one I’d invite to give a concert on my island in the Caribbean.
I only met a couple of Finns during the Koszovo war, and they told me about kezi and vizi that were of the same root in our languages (kez & viz in Hungarian).
For biology, I’m gonna hand out this short video on the Uralians.
Now, let’s portion out some momentum trading bones to the eager puppies who came.
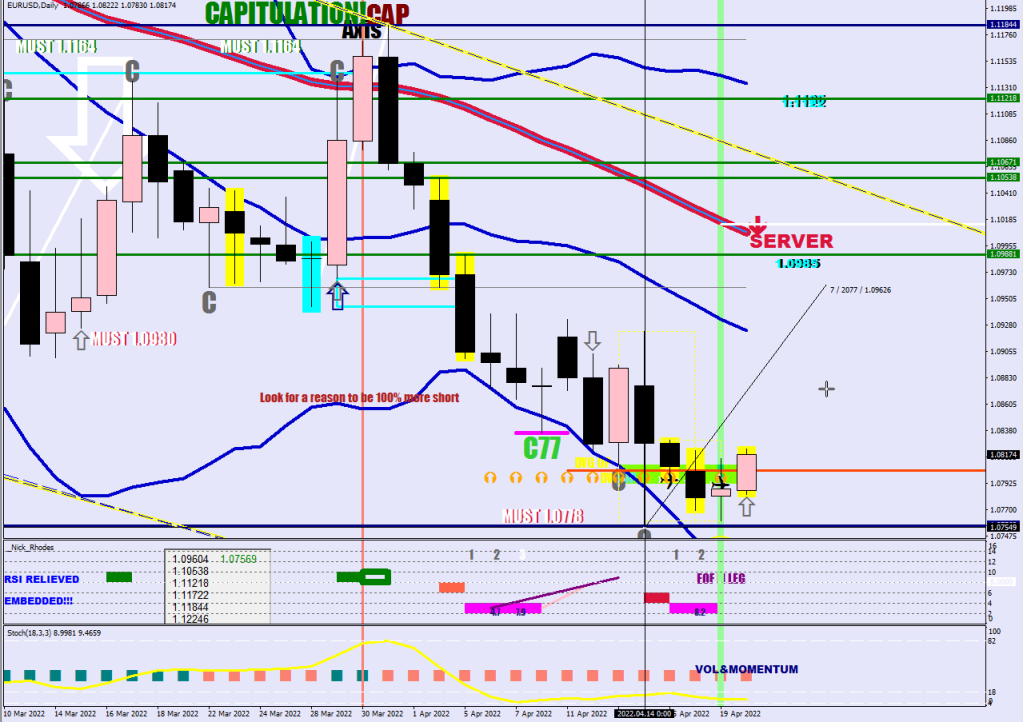
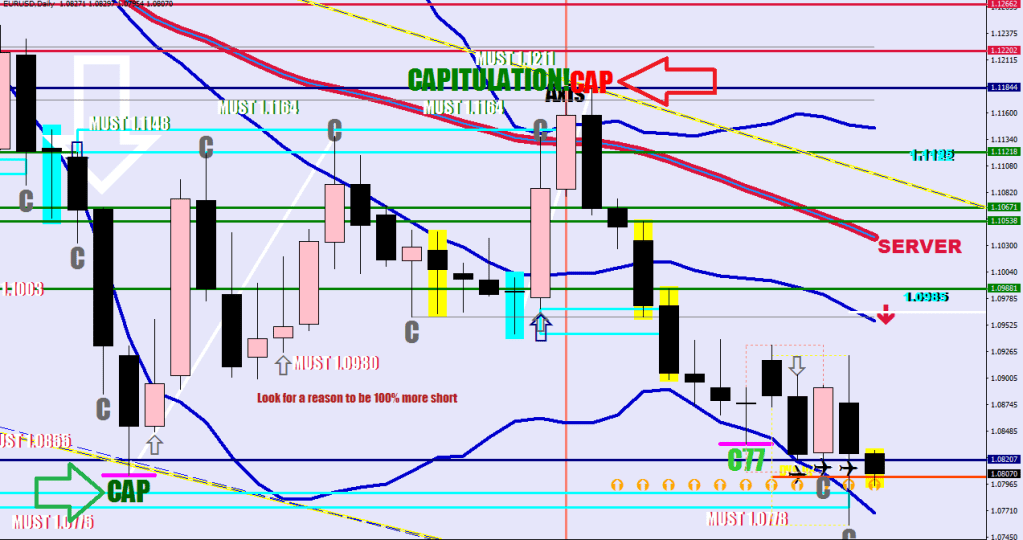
Stare at the Daily chart, and ask yourself, what’s missing?
In the direction that the martet is progressing, the wicks should become ever shorter. If they become longer, that means that the counter momentum is growing and it may flip the boat soon.
The adequate question as of yesterday would had been, where is the larger/cover wick and play the ABC terminal as an entry fora cover low which means a 4-sample lower low. Yesterday closed back outside the deeply oversold (below 8) which meant that the final cover low was yet to be made. With tofay’s candle loss the stochastic went as low as 3.5, what is important that at the close the k will still be in the deeply oversold still but price would be off the low by 27 pips.
A temporary loss of momentum can occur after a discharge on the BB (along with losing deeply OB or deeply OS), which triggers an ABC move where both A and C would be taken to the extreme of a double volaility breach and C may not exceed A.
Yet again, the post partum image shows price and the Daily Bollinger to have met, nevertheless, price only got within 10 pips of it when it was charging, but now the Band is reeled back into the price’s field.
Once the daily momentum had turned, all moves back towards that point would be retracements and would not exceed that terminal.
First time I was afraid, I was pacified.
There are only 3 things that can turn back the daily momentum.
Second time I was afraid, I was specified.
1: cover high/ cover low with optimal stochastic reading
2: impulse wave choking on momentum setting up a reversal divergence
3: Murena Williams Goonies-Player aka E44 and the safety net behind her
Now that we found momentum, what are we gonna do with it?
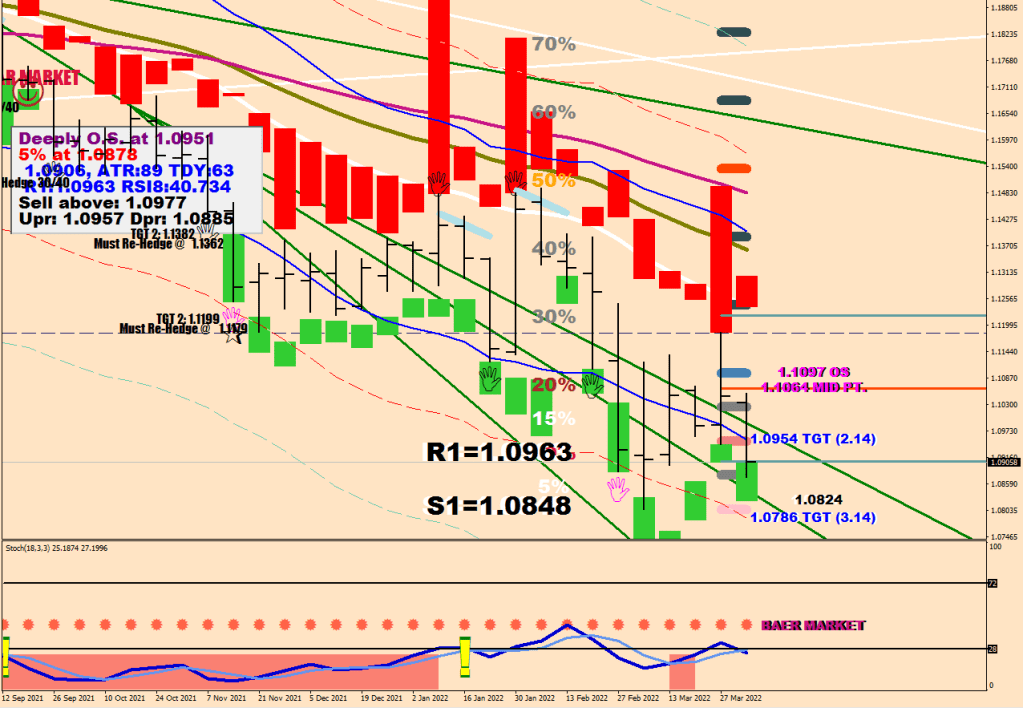
If you are below the main weekly MAs (i.e. Baer Market) and making a fresh run to the downside, target something that no one has on their screen other than professional momentum traders. Target the window envelope.
If the market stalls on the way down with a single overdrive + strong E + weak S or a quad E sequence cover half/all and re-enter on a strong E on the upside.
On the second run you may nurture target ideas further out, as it is most likely a Wave 3. What about on the 3rd return? I’m glad you asked.
Let’s talk Triumph cards then.
Bear with me, the honey color gets serious utilization here.
Until you figure out where the exits are, your knowledge equates to… (fill in blank)
What you need to know about the Bollinger Bands is that the current closing price has a great effect on them, meaning: when price is headed towards the Band, it also is pushing it further out, therefore if you want your algo to target the Bands, you need to aim say 5 pips closer.
The Yellow line is the hourly E-32 or the E-384 on the 5-min.
Whilst this image shows price having managed to pierce through the Daily Bollinger Band, in reality it never reached it, but as price started moving back up, it dragged the Band a little higher, like a blanket, eventually covering the feet. This was Macdulio’s enhanced Bollinger Band Course for entirely free.
Excessive definition
if (RSI2[i]<96.5 && RSI2[i+1]>96.5 && RSI2[ArrayMinimum(RSI2,6,i+1)]<80) excess[i+1]=1;
  if (RSI2[i]>5.5 && RSI2[i+1]<5.5 && RSI2[ArrayMaximum(RSI2,8,i+1)]>20) excess[i+1]=-1;

80-sample E drop shadow>
iHigh(symbol,0,iHighest(symbol,0,MODE_HIGH,78,i+2))<iHigh(symbol,0,iHighest(symbol,0,MODE_HIGH,2,i))

overdrive>
stoch[i]>94.5 or stoch[i]<5.5 where stoch is an 18-sample K
iStochastic(symbol,0,18,3,3,MODE_SMA,0,MODE_MAIN,i)

S means falling short
S has no color if they are in the inner half of magenta bands
S for instance>
RSI2[i]<79 && RSI2[i+1]>79 && RSI2[i+1]<95.5 && RSI2[i+3]<RSI2[i+1] && excess[ArrayMaximum(excess,24,i)]>0  && excess[ArrayMinimum(excess,24,i)]==0





































 ForexFore - Internals, indicators, algorithmic trading