A lot of people declare themselves as momentum traders.
Since I am not everyone else, I can only give you my ideas on what Momentum Trading should mean.
Yes, when the rate of price change (trajectory) of price changes declines, that shows tiredness and your odds improve for a mean reversion.
I want to go into the nitty gritty however.
How does price turn around at all?
Strength has to transpire. This is one of the 3 corner stones.
As a momentum trader your friends should be oscillators and moving averages. Divergences too with the caveat that they area a pressure relief called upon by excessive strength.
This is the first lesson here. You should not be looking at divergences as a reversal indicator. The most common waves are corrective and they end in optimal strength prompting no reversal divergences.
Divergences are not the typical ending of a wave. They are showing “momentum slowing” until the scale is tipped. The stochastic did not make it back to the overbought, yet price still turned back down?
See, the reversal off a reversal divergence is a weak one. An encounter with the 1-standard deviation of the 20 SMA of the 44 daily EMA may re-instate the trend in a jiffy. Lesson number 2.
It pays out to keep track of the presence of professional volume blocks in momentum trading.Lesson number 3 is that strength has to walk a fine line to stick the landing for a reversal. Number 4 is still about the day of the reversal, which is a Cover high / Cover low made with optimal strength (most likely) and only divergences have a luxury of dying slowly and temporarily running out of momentum without printing a Cover low / Cover high at the low / high.Let’s conclude here that momentum trading starts with a daily 18-sample stochastic reading and monitoring for Cover highs / Cover lows as well as keeping an eye out for divergences that are brought on by excessive strength.
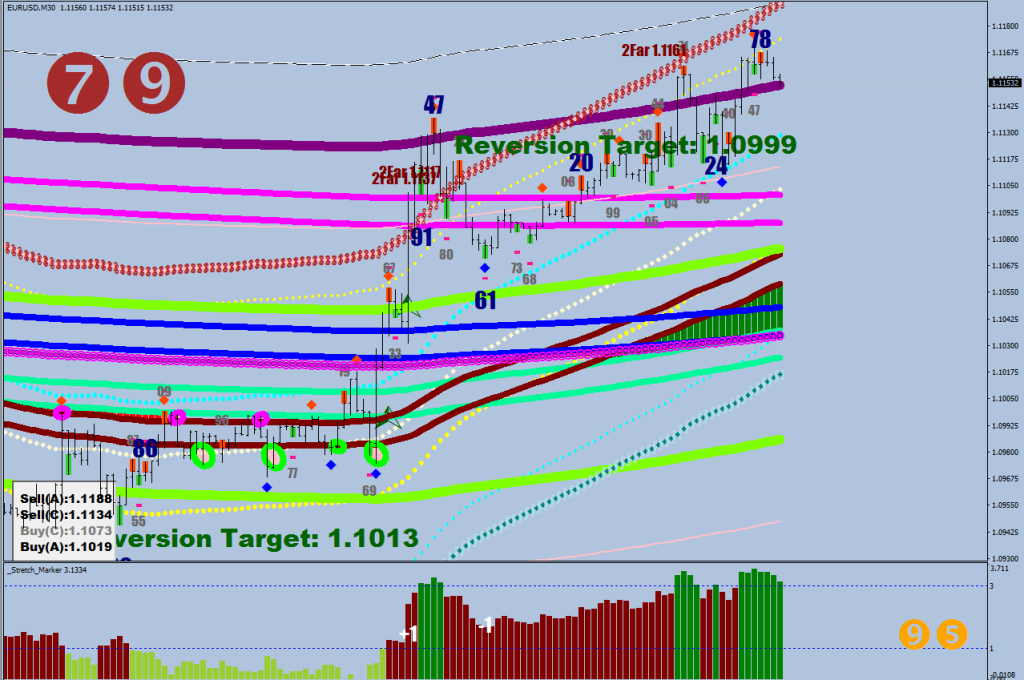
Your first piece of information derived from the daily chart therefore is that there was a red Cover high most recently meaning that the daily momentum is down.
Yea, I made this new 2-hr candle constructor boa a few days back. Civil name at birth was given as 2H Mean.
Warning, the following blog entry has a high mortal rate.
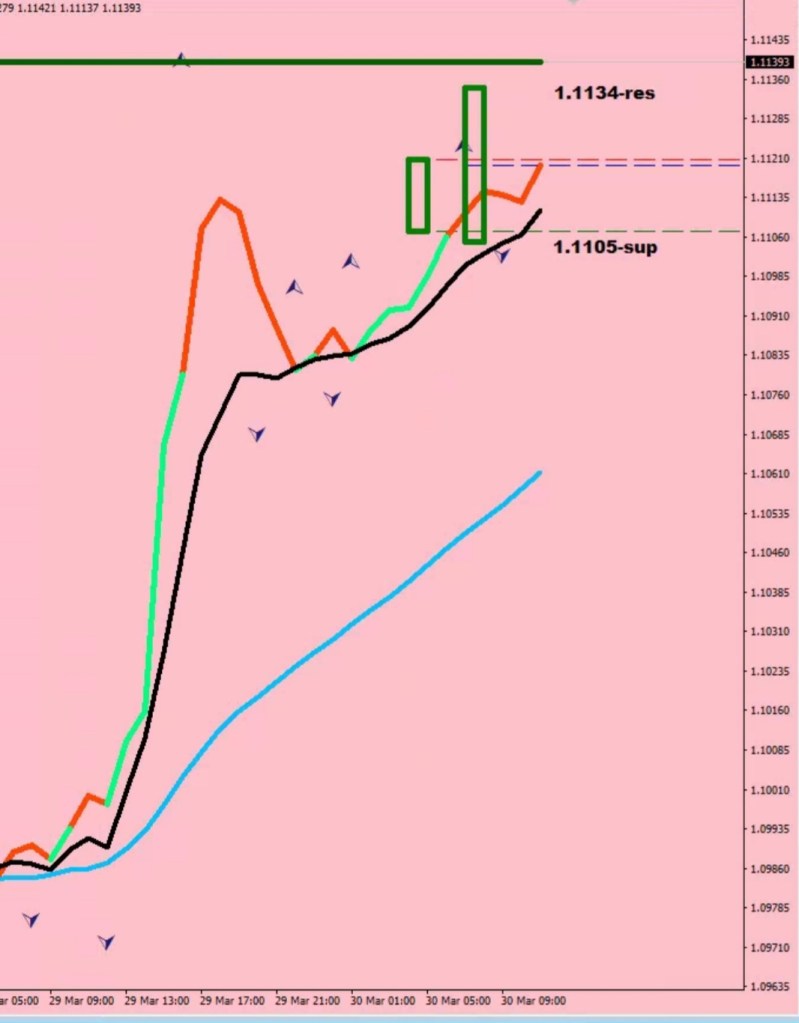
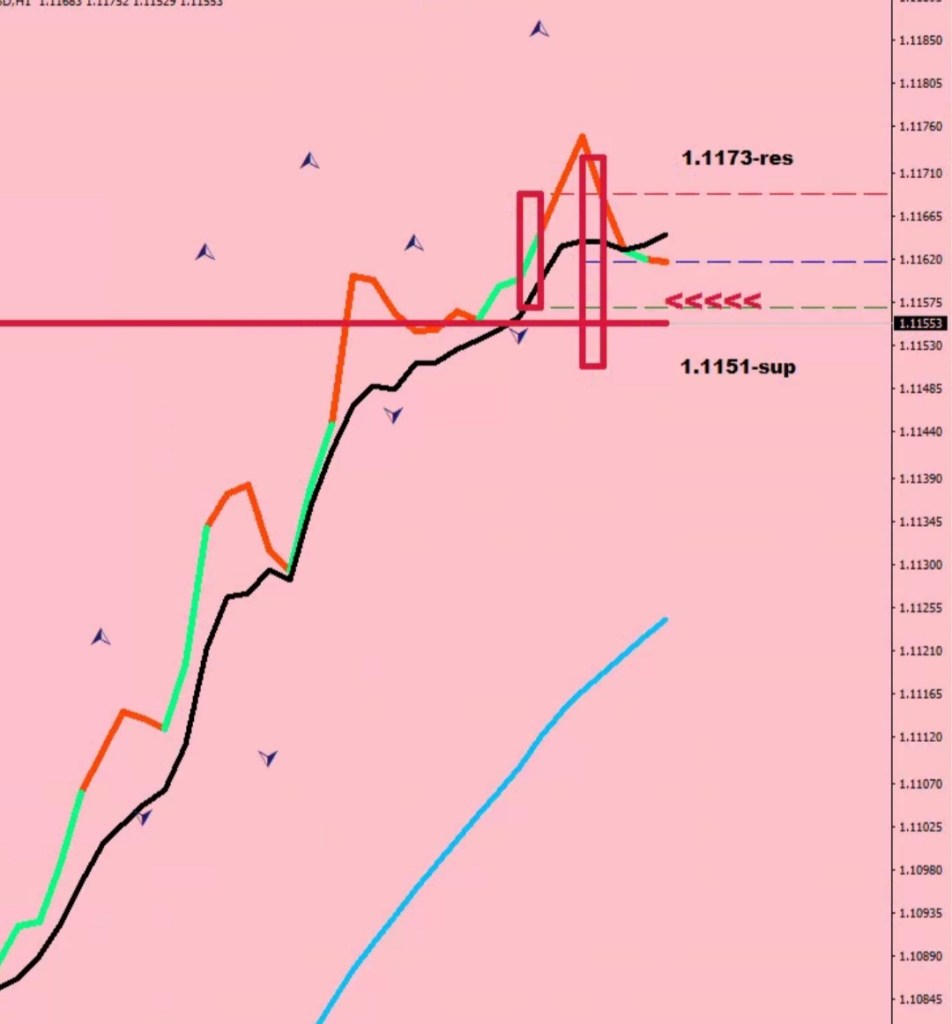
It could had come in handy for participating in this most recent 160-pip and counting move up.
The idea was sample: hide as much unnecessary info as possible.
E44 in blue, E8-opens in black. The two colored line is 50% of the last hourly candle.
The two constructed candles are the previous 2 candles combined and the other 2 prior to that with some spacing. Color based again on closing above or below the halfway mark.
Fractals are out for some swing point references.
The horizontal line is the current price – showing a break out currently.
Yes, the constructed candles would look a bit different in odd and even hours, but should this bother you or entertain you?
I’m considering to put an arrow head on the end of the line, yes.
The idea is longevity. Staying in the trade until the config is in your direction and the 2H Mean settles at or above the black line. The risk here is a God Day 1.
The following part is called “take a look at me now.”
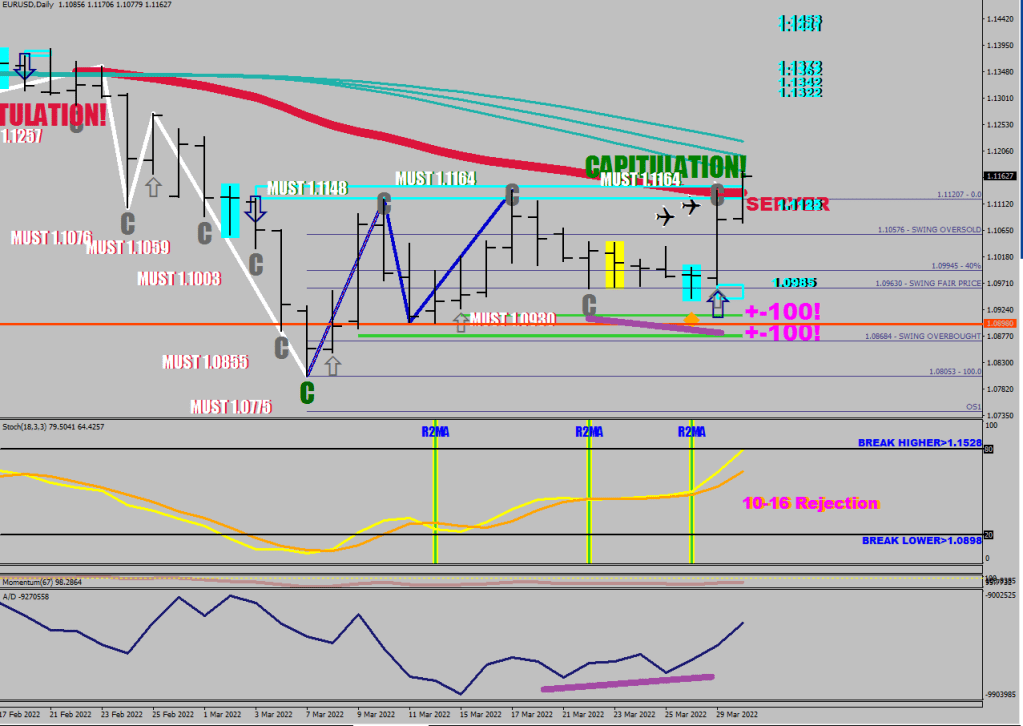
Take a look at the divergence on the Advansez/Recliner line below:
Murena “Server” Williams dropped the ball. The Prechter Doctor will see you now. The whole thing started with a Pro Volume day.
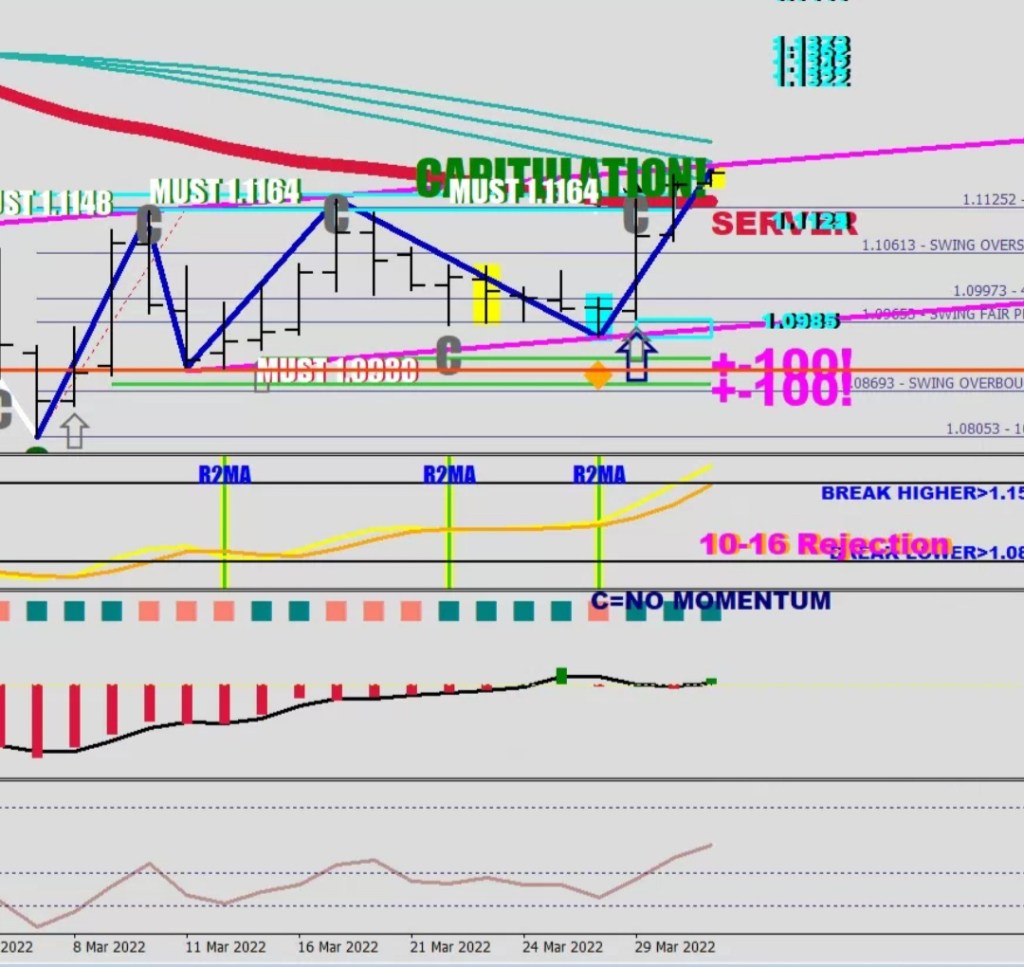
How interesting was this? Yesterday’s cover high had its moratorium field extending to 1.1164 and today set a high at 1.11706. A few more pips are always advised to tolerate an increased spread. The target is so close, yet so far away (Stoch @ 78.93). A capitulation with no momentum left. The top would only be in on a Cover high that is going to score above 82 on the settlement. Perhaps a pullback first.
The dip below the 20MA of the 14 RSI is a buy until it is not (red circles and exclamation marks).
This market is now running for its death.
E-S-S eso E-S-S aka Rain It On The Blame w/ a side of suicide.
The Green O-s are early warnings for a low to be hit soon. (Stoch 18K<5.5)
In short this song is about a drug addict who kills her girlfriend with 36 stabs and ends up walking free since he himself is was a “victim of the drugs”.
Ess eső, ess

Reggel volt, napsütés nélkül, a kiscsaj éppen a suliba készült.
Még nem sejtette, hogy el fog késni, s nagyon messze az az érettségi.
Csengettek, s ő beengedte, mert a tegnap estét már elfeledte.
A barát volt, megállt előtte herointól szénné lőve.
És indult a cirkusz, a féltékenység, a hernyótól nőtt meg szörnyeteggé.
A lány már sírt, csak menni akart, a lárma a házban senkit nem zavart.
Az első pofon még alig fájt, csak ütött a srác és felszakadt a száj.
A lány elesett és semmit nem érzett, pedig rossz bőrben volt és csúnyán vérzett.
A fiú most megállt, nem, nem ütött többet, Júlia ekkor még arcon köpte:
- Rómeo hagyj! Ne csináld, kérlek!
De penge villant és kés volt a kézben.

Harminchat szúrás a testen. Mosd le a vért! Az eső essen!
Örök sötét a gyilkos fejben. Sírjon az ég! Az eső essen!

Ess, eső, ess, ess! Hullj rá az arcomra!
Ess, eső, ess, ess! Hullj rá az álmokra!

Jött egy ügyvéd, mert volt rá lé, kétmillió a védőbeszéd:
- A lány drogos volt, a fiú drogos volt, az elmeállapot korlátolt!
Nincs gyilkos, a narkó divat, szegény srác, hisz ő is áldozat!
Kórházba vinni, kezelni kéne, ennyi az egész, az ügynek vége!
A lány nem él, a fiú még remél, a bíró enged és nincsen büntetés.
Az ügyvéden múlt, s a befolyáson, hogy köztünk jár most szabadlábon.
Nincs több érv, nincsen könny, hullaszáraz a jegyzőkönyv.
Hol az a reggel, mikor 7 óra múlt, s a kiscsaj éppen a suliba indult?

Harminchat szúrás a testen. Mosd le a vért! Az eső essen!
Örök sötét a gyilkos fejben. Sírjon az ég! Az eső essen!

Ess, eső, ess, ess! Hullj rá az arcomra!
Ess, eső, ess, ess! Hullj rá az álmokra! ...
You short within 3 pips of a previous hourly fractal.
The last one went beyond the first fractal on the measuring move making a higher low, this is why there was no need for the re-test and could get active at the second stumbling block.
You target the first Gray E’s 16-pip displacement for an exit. Go long at the 26-pip displacement & target just shy of the next fractal up.
Catching a capsizing turn can also qualify for a long entry.
You can already see what the next target would be.
I used the SuperTramp, settings posted on the blog earlier with an identical title.
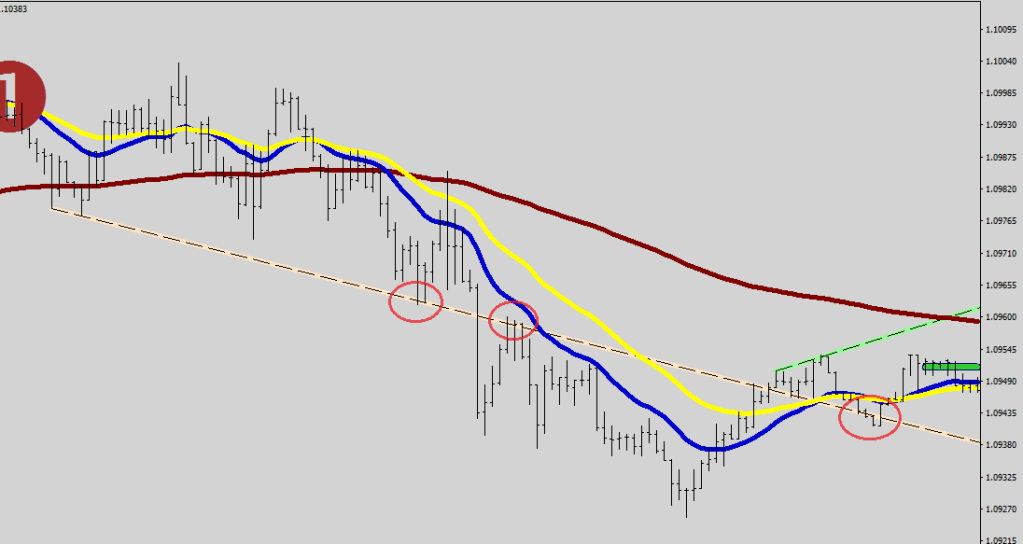
I call a trend Junior after 5 hourly same color prints and senior after 14.
This album is a delicacy from the most underappreciated band of the 90s. It tickles some organs you did not know existed. This is what you would get if you marry The Cure with Dead Can Dance, but who would even think of such a thing?Senior uptrend last minute buy: the fractal on the left was at 1.09604 and the buy level was 1.09634. Pull out that calculator!
What are the two chices of a market that is overwhelmingly long/short?
Capsize or capitulate.
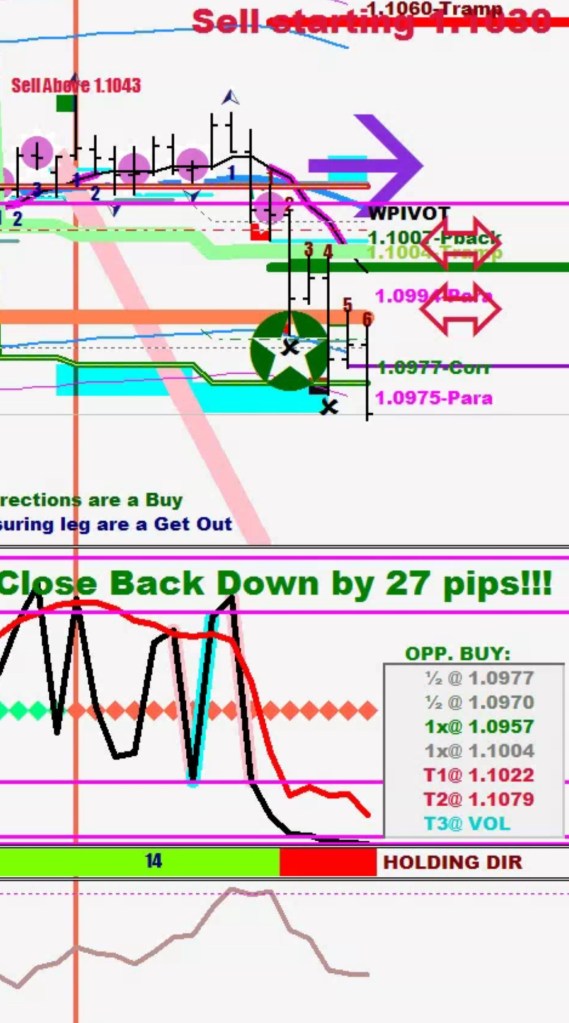
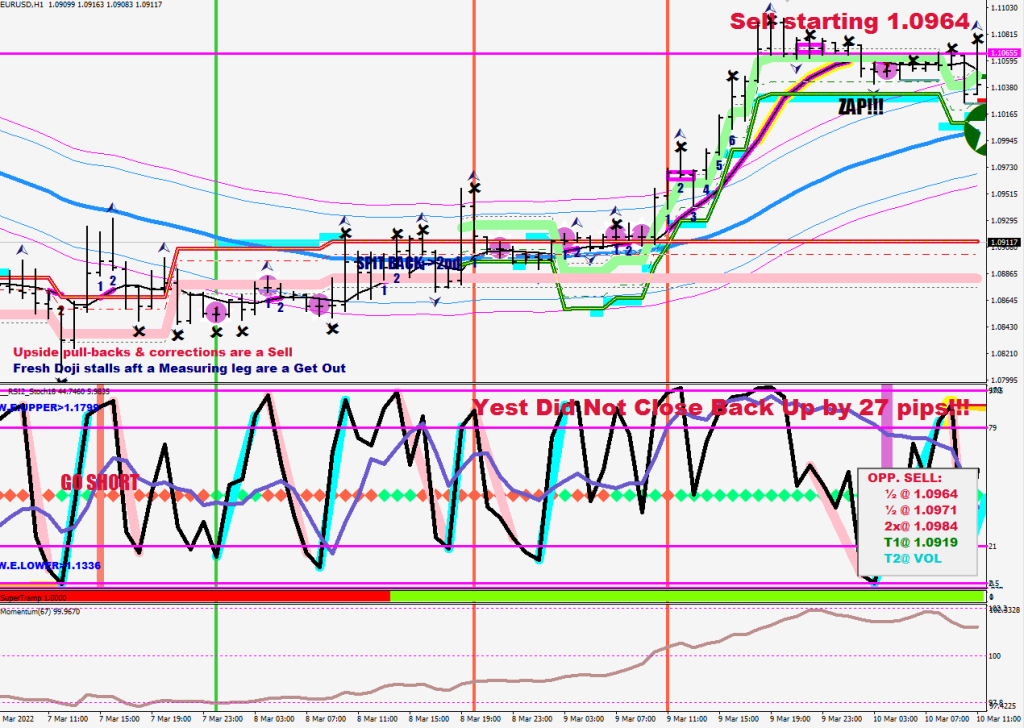
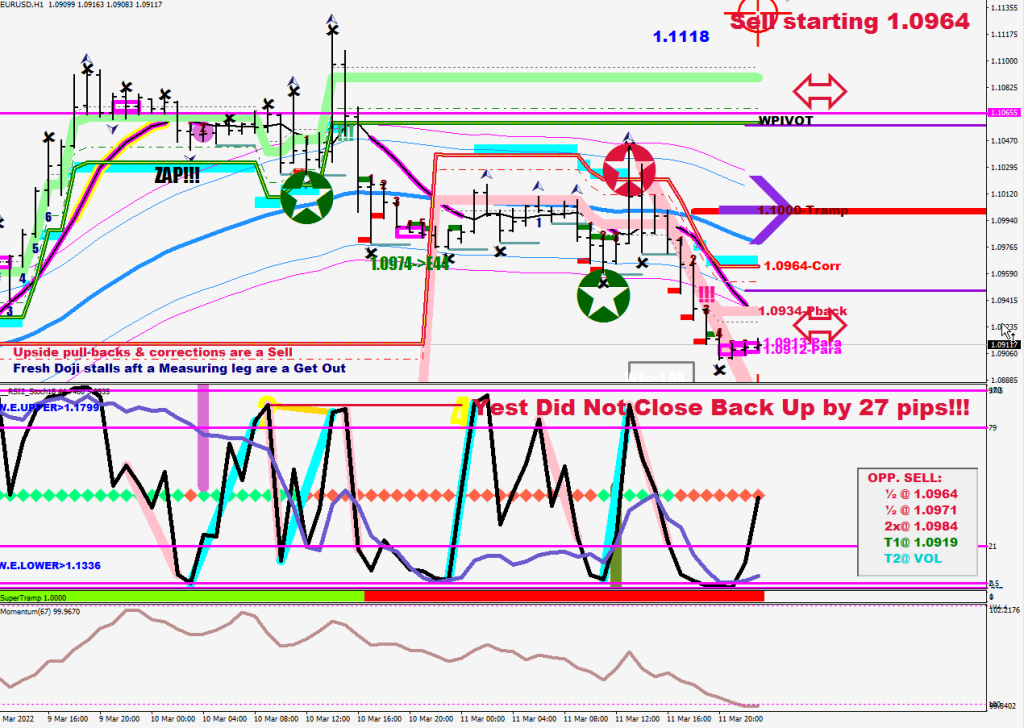
The daily checkpoint comes back with no balance: the close back was less than 27 pips from the high/low. There would be an attempt for the continuation. You would see a hourly candle separating from the 8-open-EMA.
#2 closing back down renamed #1 to Captain Capsize. Also, the 67-sample Momentum crossing back above 100 underlined this perfect short.
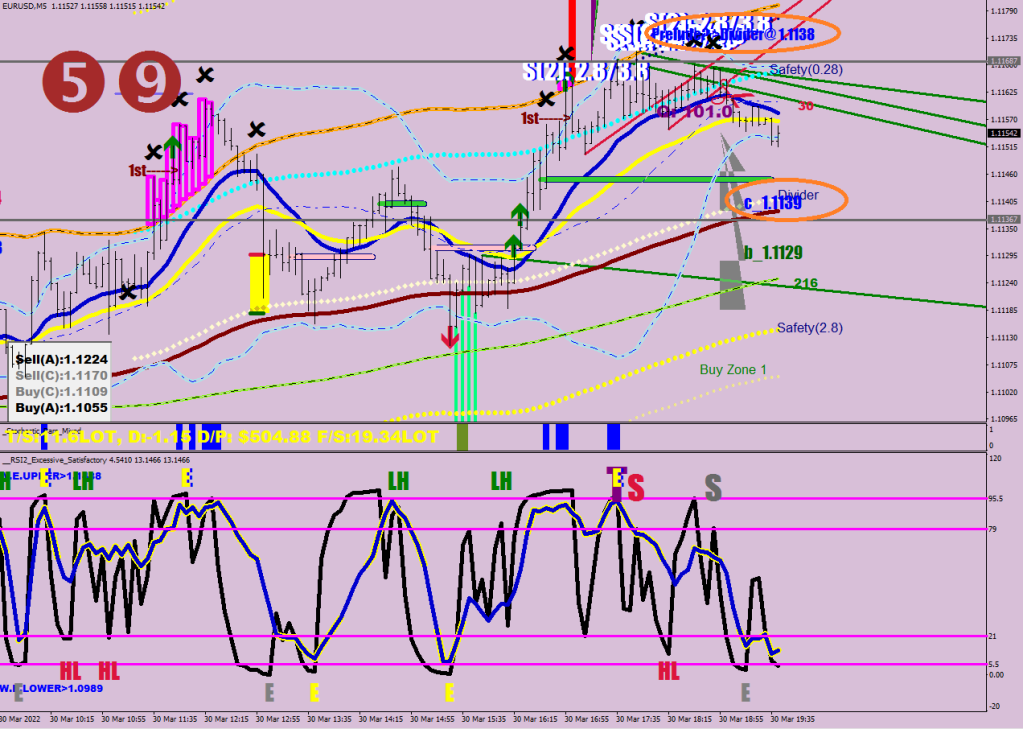
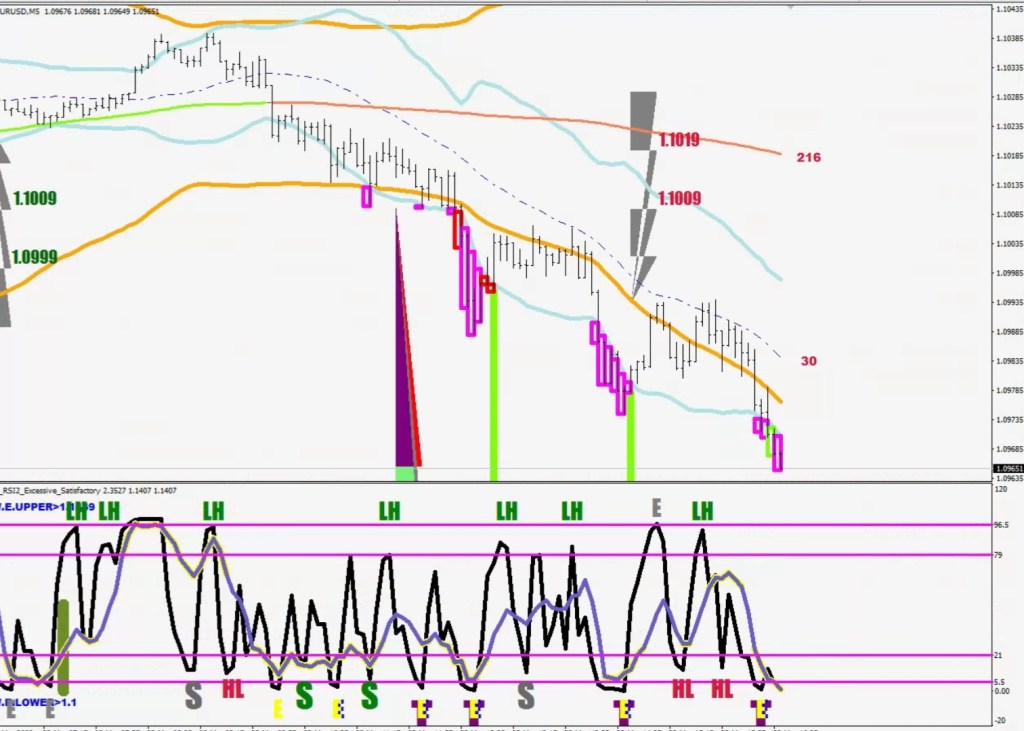
If the second or the third candle closes on the other side, the boat was just flipped. Also, look at the 5-min 2.0 30 SMA HL2 ans the 2.5 216 SMA HL2 to get a sense for the prospect sustainability of the continuation move.
What were the odds of continuing higher after re-visiting and failing the breach of the 2.0 BB right below the 2.5?
The objective of the driven thrusts is to work up volatility.
Volatility has no direction, this is why a pendulum market model is apt.
Volatility gets capped in one direction by the act of buying, this means that sustained progress can only be reached with ever more dedicated money to the cause.
The natural tendency of the market is idling, so the volatility is bound to decrease. Low volatility is nobody’s objective: you cannot make money if price does not move.
During trending the 30 SMA on the 5-minute is a suspect for volatility-cap add on.
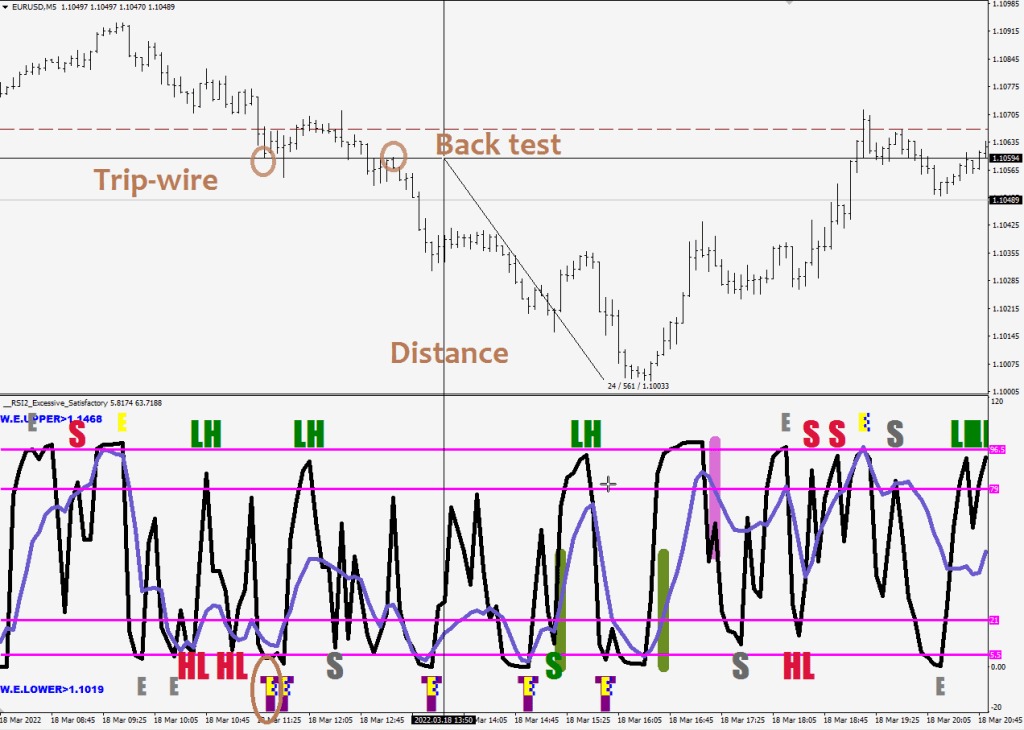
A drive sets up the level called the tripwire.
4 volatile trips (4 broken legs) mark the end of a wave structure. Think of the fractal nature of the individual time frames: your chosen zoom may not be able to show you all the details.
First cut is the deepest: The Tripwire
4 24-sample lower lows in combination with Excessive RSI2 readings + BB pop for good measure at the end.
Living’s in the way we die. (Few understand this).
What is happening?
Does this look good?
Looks O.K.
Does this volatility crush / mean reversion freak you out?
Not really.
Yet.
We failed this week and the last week to leave the oversold level behind. In fact, we are due to re-embed come next week. Seasonality might just get a punch in the face.Does an ABC correction sound bullish followed by today’s candle making a lower high and a lower low?
Blinded by the light?
Oh yeah, back to the topic. Traps. ET.
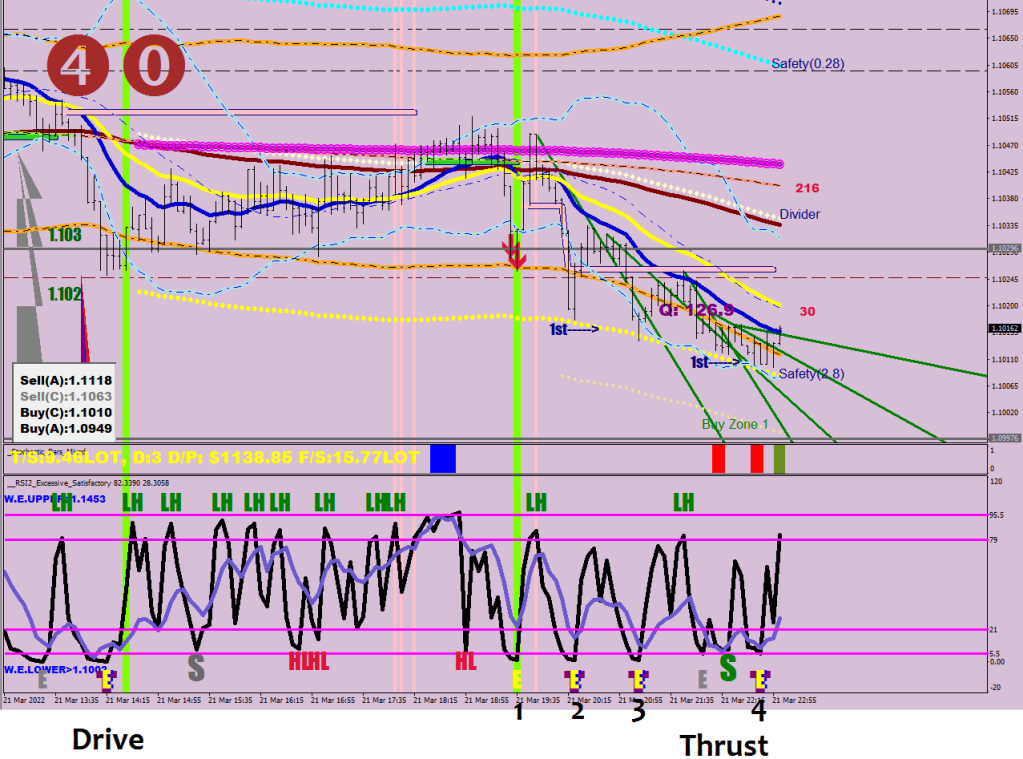
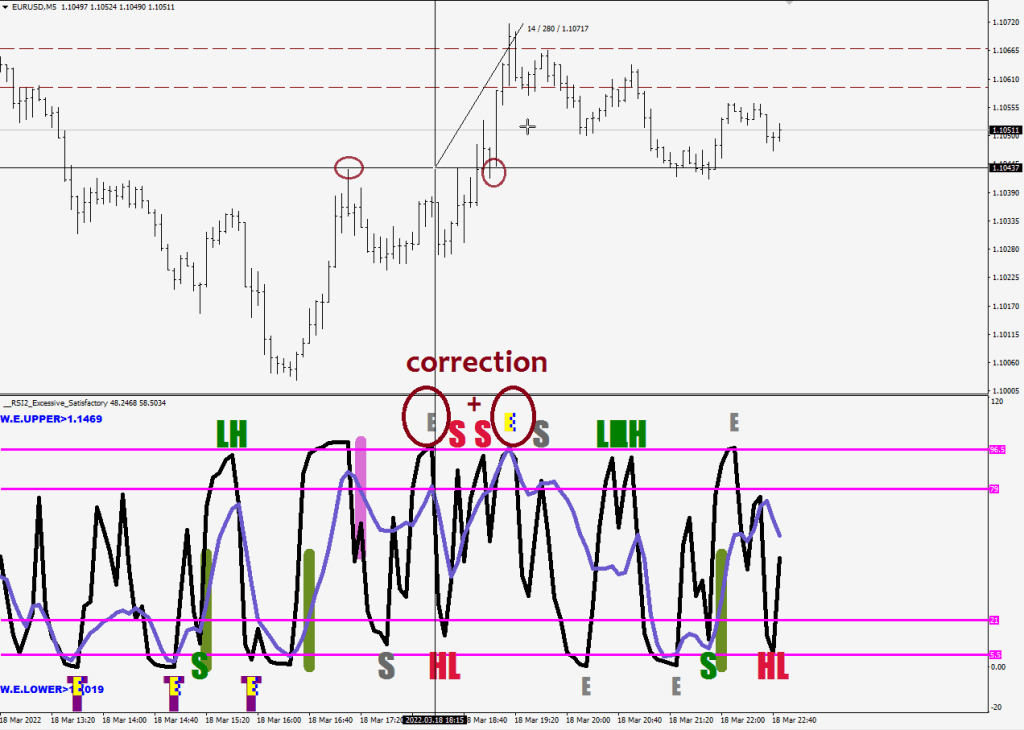
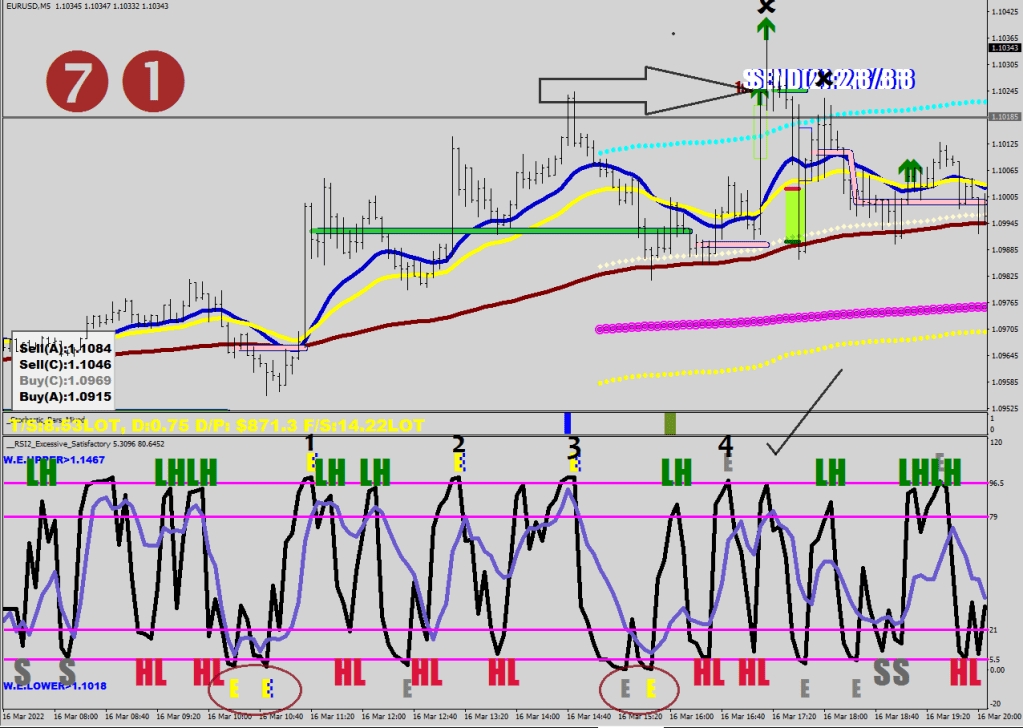
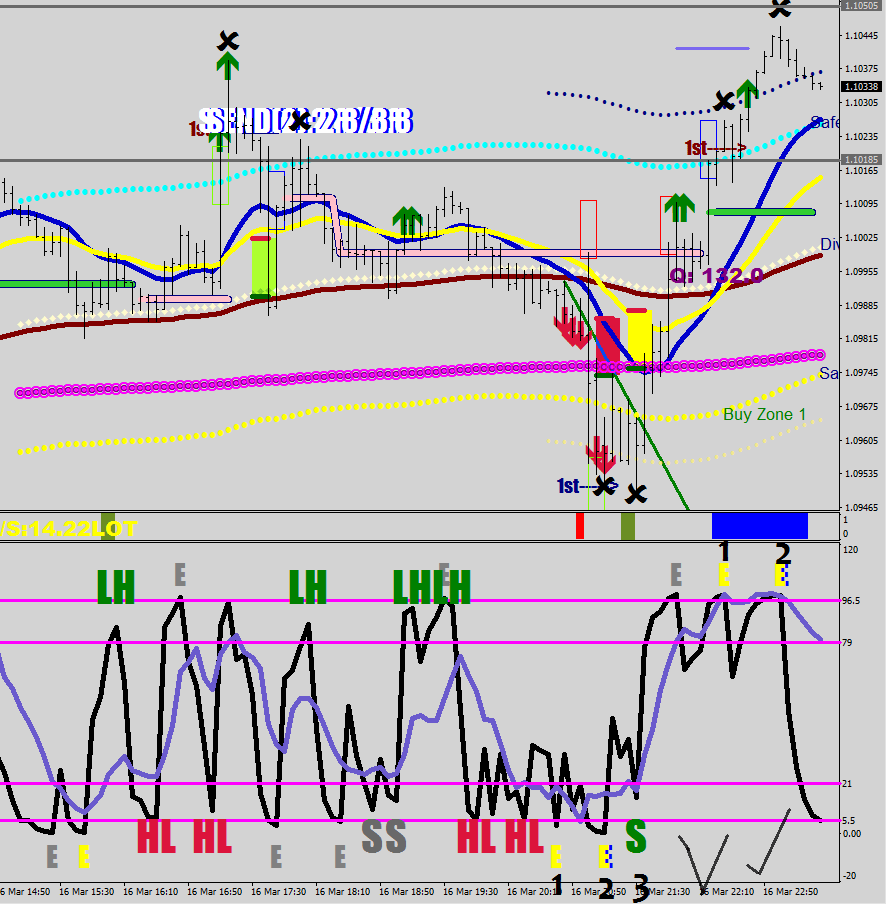
ET is an 18-hour higher high with RSI2 reaching above 95.5. An Excessive move (a drive) ultimately results in a thrust, that is in line with the current volatility. The first print counts (and embedding disqualifies).Think of it like this: if volatility is way high, you can have a thrust from the trip wire at 66+ pips. One step down in volatility and you are looking at 55+, then 44, 33.
Now, counter moves fizzle out on two Excessive peak prints & their initial drive is usually a subdued acceleration not achieving a 30-sample bracket break on the 5-min.
The thrust of the correction is also volatility based. 26+ pips is high relatively high, 16+ is two steps down, then 8 and 4. The highest reading would just exceed 32 pips.
So is this setup bullish then? Remember the E+E. Look at those trip wires right above. Think of the embedding come next week… and hedge for crying out loud.
if (RSI2[i]<96.5 && RSI2[i+1]>96.5 && RSI2[ArrayMinimum(RSI2,6,i+1)]<80) excess[i+1]=1;
  if (RSI2[i]>5.5 && RSI2[i+1]<5.5 && RSI2[ArrayMaximum(RSI2,8,i+1)]>20) excess[i+1]=-1;
We have a bottom, we do not have a top yet.
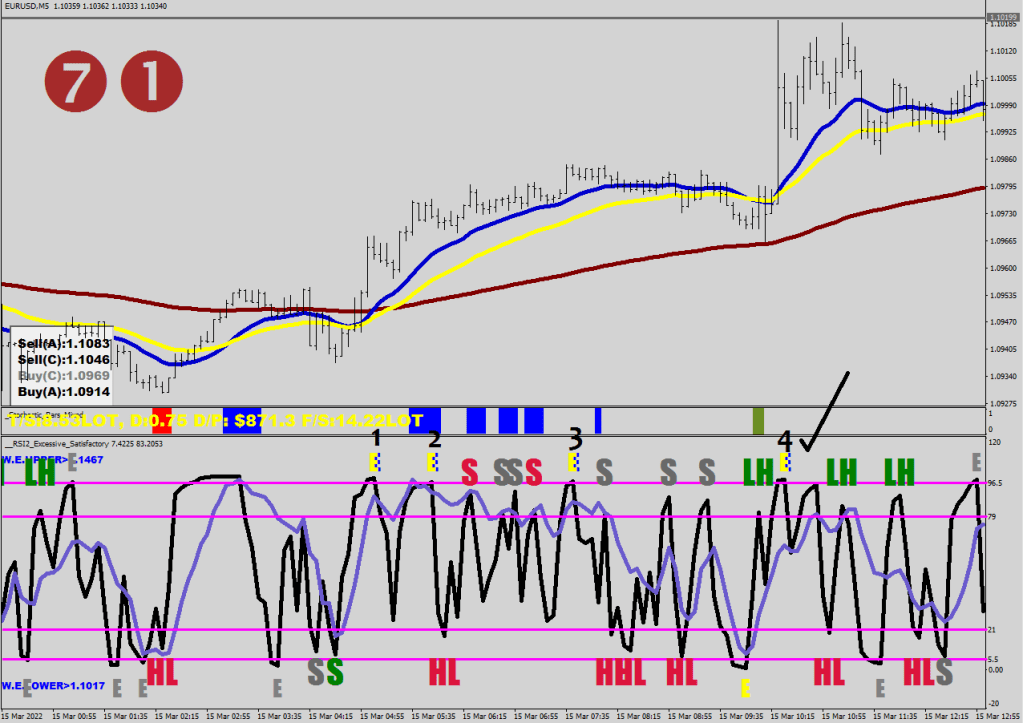
Now, you would think that the extra steep is ought to be shorter in time than the steep one, but you would only be half right. In overdrive / hype would be good for 4 individual E-s whereas a mere steep incline is likely to only score 3.
In the gray mode the zero-mastodon trendlines can provide clues on the health of buying / selling. When the reach starts falling short get out/ hedge for a counter-leg which is going to be a deep correction (2 Es), but not a new wave.
E&E – deep corrections. A top as well at count #4.
Come to think of it, that’s overall more of a lucky dip/quick pick for a continuation/ final thrust made up of 3Es. What a quick dip does is it re-adjusts the swing point to push out the opportunistic counter entries further, so buy the double penetration.
Steepest decline, count 4.
Now you know why it is dangerous to short a boring market. The stakes don’t start until the yellow E-bricks get pushed out & the wall of hurry materializes.
What is an E-S-S sequence? It is not an end of a wave, it is an end of being brave (end of a leg).
HL and LH of course stands for Heil Hilter and vica versa.
Needless to say, I have to say Needles! at this point.
The 2022 version called No Tengo Monero is yet to be made.
The Best Revenge
Song by Color Theory
Teach me a lesson A wound at your hands And justice demands That I should pay attention Vengeance is fine But who has the time?
Call me a coward Go on the attack I won’t fight you back Or grant you any power An eye for an eye Leaves everyone blind A tooth for a tooth Is dental abuse
No I won’t chase down a hit and run Throw my life off track for anyone Moving on is the best revenge
A minor uproar An insult to you That karma and voodoo dolls Can not atone for A prisoner of war You’ll settle the score A lack of control That eats at your soul
Stardust falls from the sky tonight Let your guard down and feel it Really feel it.
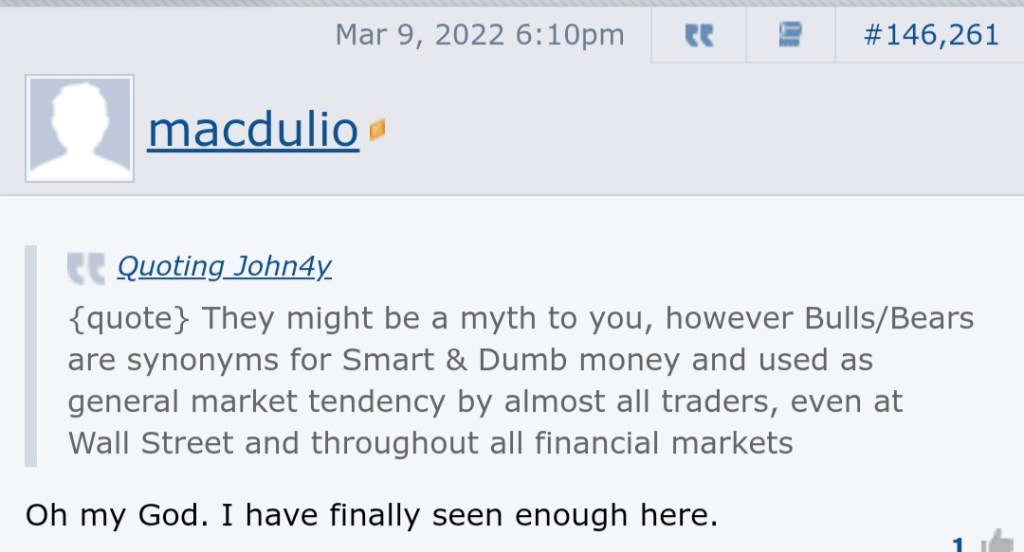
Sign of times: every time someone says, the coded room, I hear the Covid room.
The point of this artikel is to point out shit at random.
What happened when the market floated to the surface on the 67-samp momentum? Smart Money was aktiviziert.
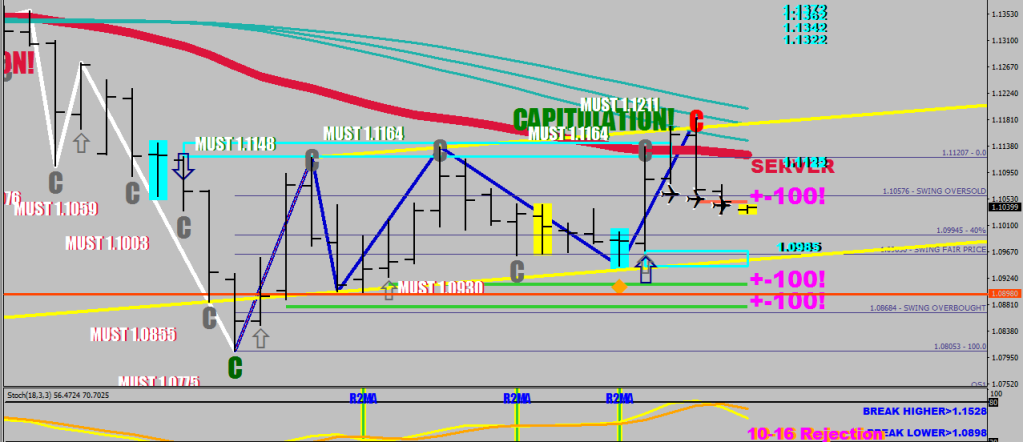
This actually was a better entry than the top itself. Now, a quick word about the 10-16 rejections. This could be played with any imaginary line, but if you have some basis, the better. I circled & arrowed 3 of these, and you can see that price always came back very close to the line itself before embarking on a 100+ pips journey. The Open and the Close fell to one side of the line, you had a move beyond the line by 10+ pips then a close back on the other side of the line by 16+ pips. The first two lines were MFI step shifted support/resistances and the third one reaching all the way was an MFI reversal divergence displacement line. We just had another one of those MFI support/resistance level formed at 1.0877 so we could / should see a move to 1.0867 at least to fulfill the first criteria of the rejection.
On the image below, you can see how the low and the high recently was made at 2.2 points away from the 100-mark on the 67-sample Hourly chart.
Guess where price finished at on Friday. Ett Hundra, yes.
Just below 100, how does that sound for a buy? Well, not just yet. The separation from the 8EMA would result in a zap, that would yield a lower low first. Major gap down? Nope. In the Bear market major gap downs would occur from an area of good strength, not after 220 pips of selling in barely more than a single day.
Quickly, let’s talk about 5-minute signals.
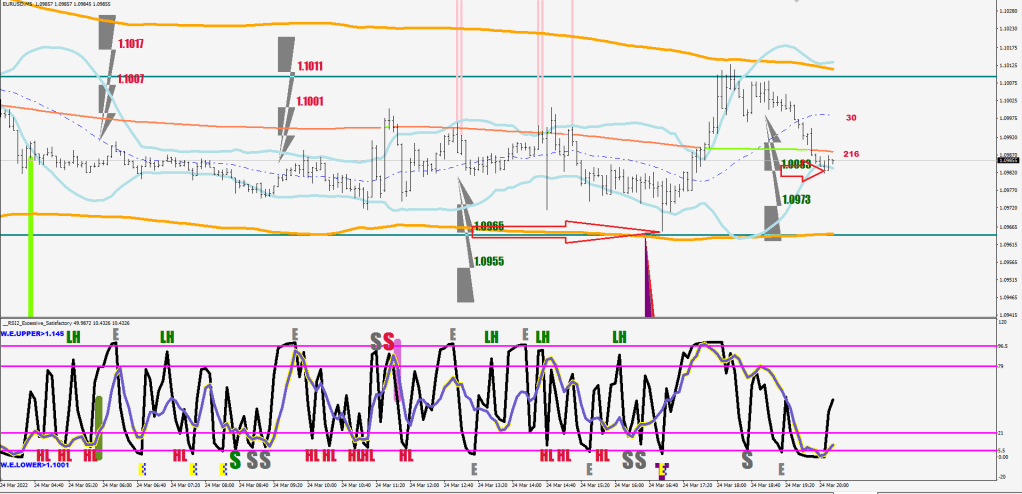
Here’s how the low was made early on Friday.
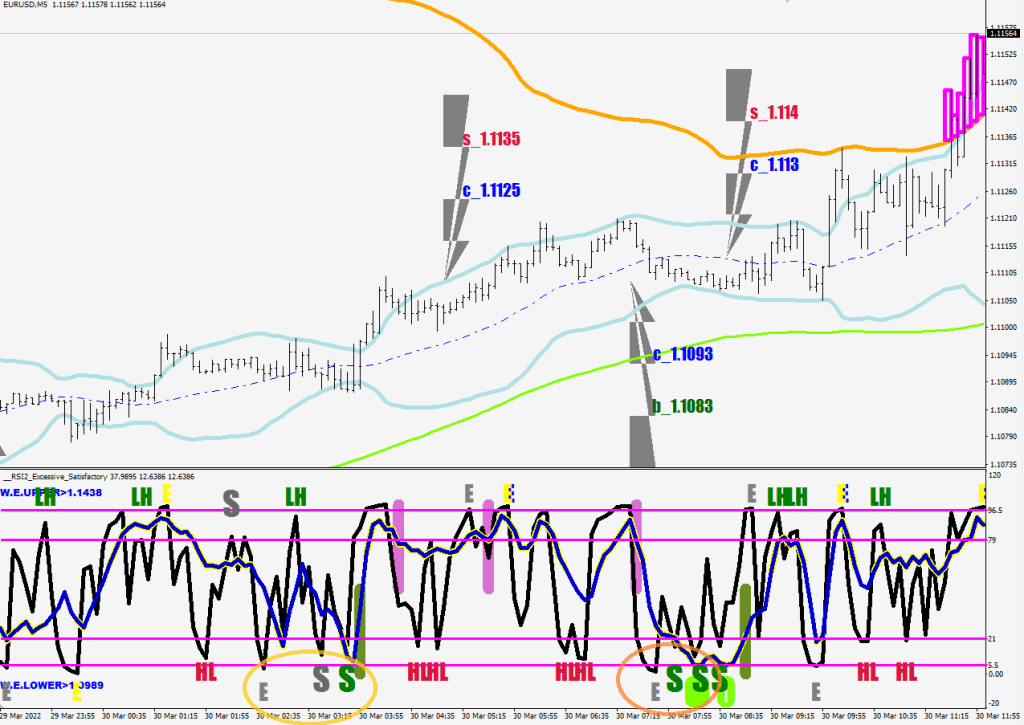
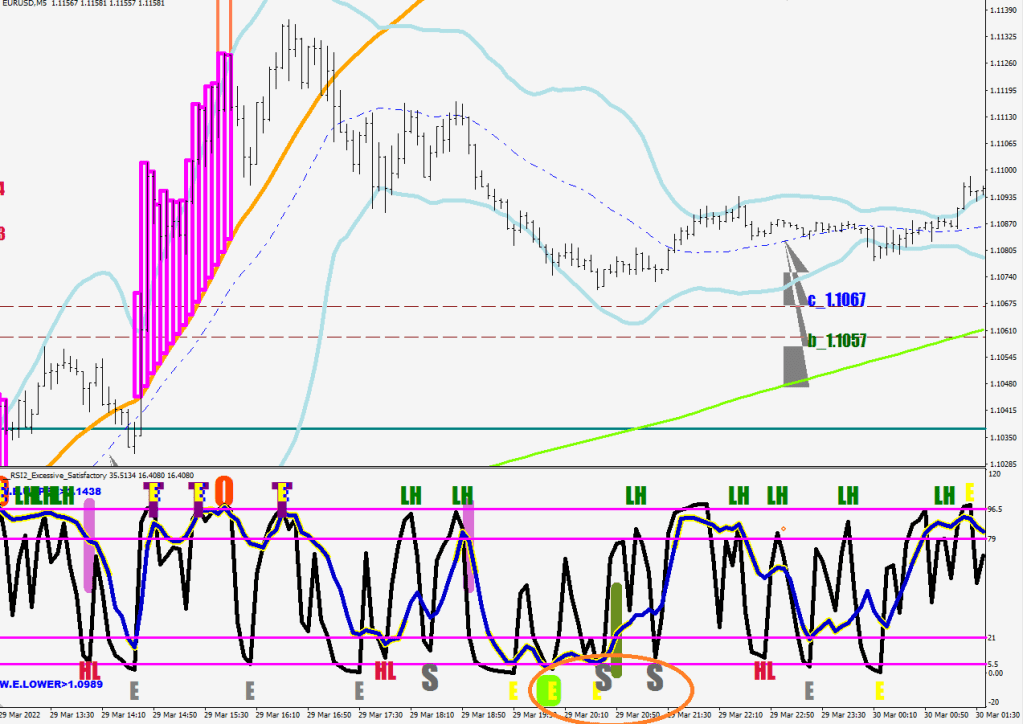
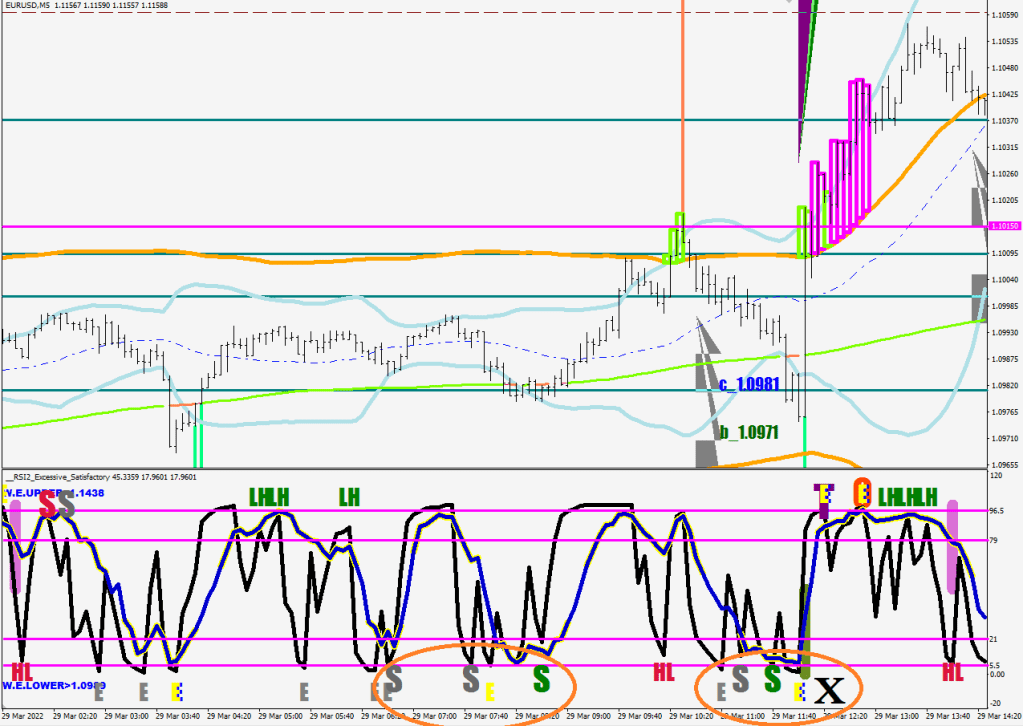
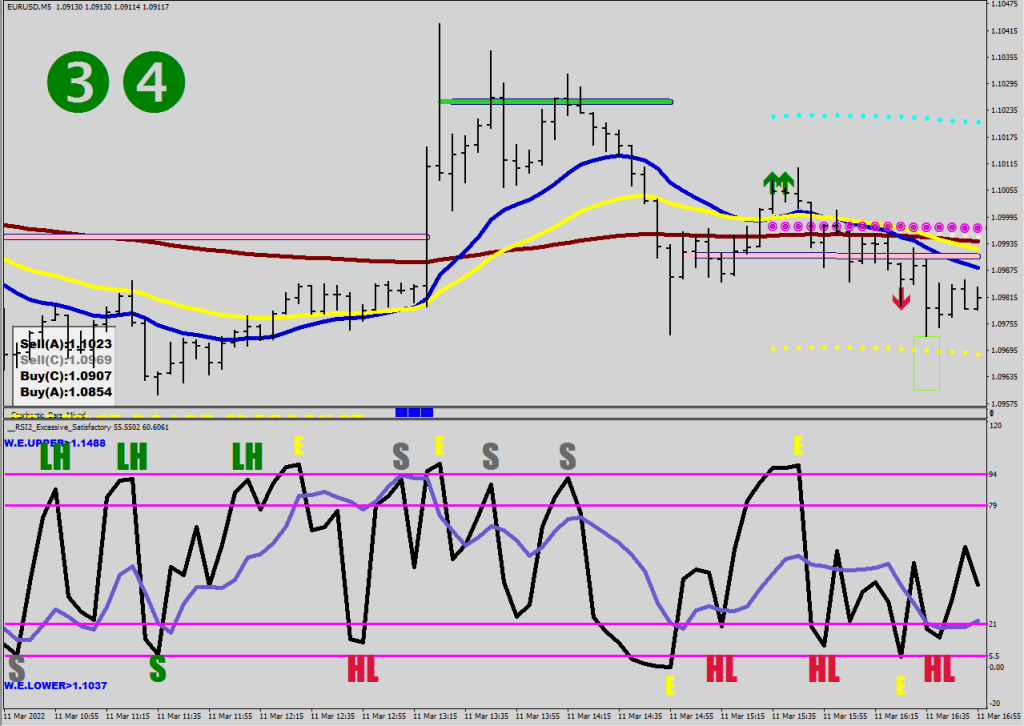
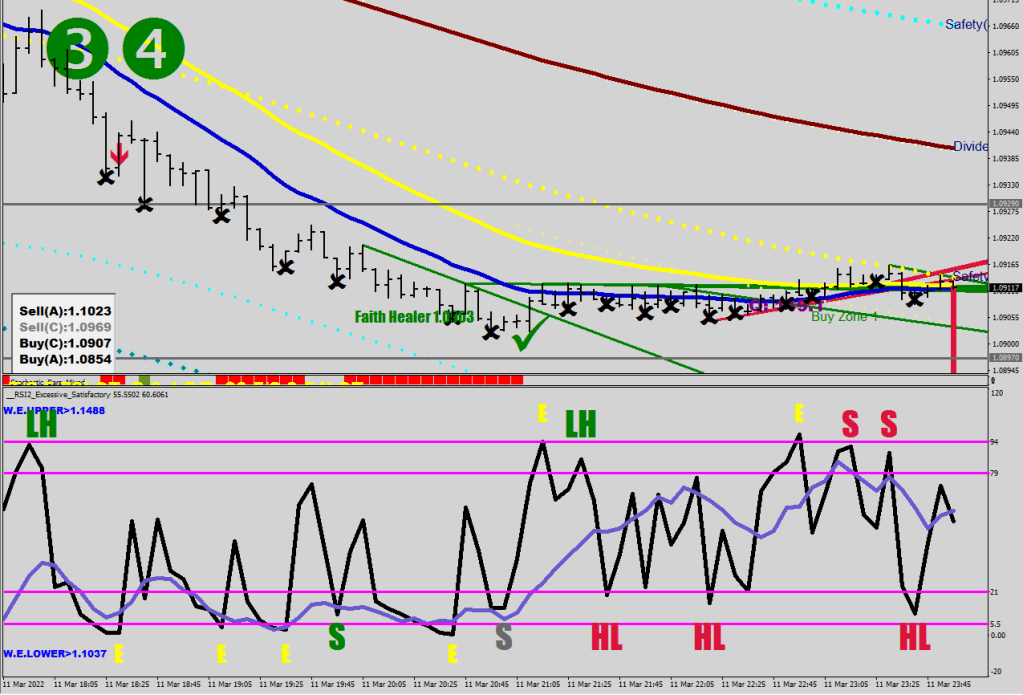
An Excessive RSI2 reading was followed by 2 Satisfactory (optimal strength) readings (the second was a lower low, and got colored Green.)
Then there was that spike that caused the Smart Money to activate.
An Excessive RSI2 reading was followed by 2 Satisfactory readings. Are you beginning to see a pattern here?
The day ended with another E-S-S.
Not very surprising, is it?
There is also a projected distance due to the strength of the move to guess where…?!
Better catch that 8:64 train then.
I believe that knowing that Smart Money is never far away to get in on an opportunistic trade, they can be provoked.
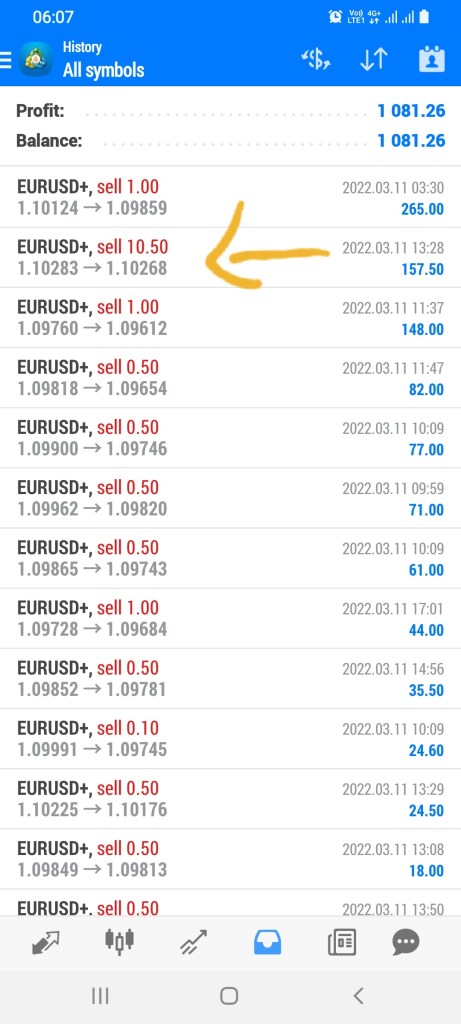
If you opened 7 lots at 1.1042 yesterday, you could had made 10k in a single day. I incidentally opened 10.5 lots instead of .10 (happens infrequently in the cell phone business), so I immediately closed it off with all the adrenaline in the head.
I shared the desired conditions for the opportunistic sell on this blog.
If I was Smart Money, I would not put out any pending orders, but rely on my algorithm to start buying at market when my level was hit (or when it was crossed back through after a return). This is why I think sentences like “I saw buyers stepping in” making little to no sense. Level 2 is mostly to entertain the retail with spoofing along with some poor quality algos relying on order flow sizes provided. No offense, Masi. Time will tell who’s knowledge is worth what.
Be kind, Erase & Rewind
I bailed on the forum at Forexfacrory. Now I only use it for the calendar.
In closing some Smooth Jazz from KKSF from the Coit tower. 12 years a nostalgy.
You are about to be taken serioisly.
This isn’t a vote of confidence for the currency.
Price was rejected at first from the 3-sigma Window Envelope, then it was rejected from the neckline of the oversold area combined with the pivot and the 2-sigma Window Envelope. They need to be separated better to be able to deal with them. Could price start riding the 3-sigma Window Envelope lower? It is a possibility, we’ll have to see about this in a week.
My current thinking is a lower low for sure, but it may not be any further than another 12 pips below the current low. If it makes is to 1.0864 I’ll be doubling down on the longs.
Here’s an example of riding the 3-sigma band:
The stochastic was embedded, and a fresh reset was made at the E-59 on the prior week. Not the current setup.
The fact that the money bag does not want to pull down (draw down) their pants (naked holdings such as a Naked bar or a Naked Gun).
This can be achieved with two main tools: commanding size & knowing low risk entries (i.e. in a trending market).
This articulo is to give some ideas about what they might be looking at.
Let’s not start with saying that I was right again. Vanity is vanity even if it is intellectual.
A give away of professional trading activity is block size. On MT4 you would see an increased number of quotes as they are getting their larger size filled piece by piece.
There are obvious things about their thinking, such as they undetstand stretch conditions, aware of weekly window envelopes and they tend to scale out of position to get out untraceably.
Getting in is harder, it takes a conscious effort of building a position without screwing up the average cost for themselves by moving the price too much at once carelessly.
I wanted to talk about 2 smarty pantalones trades that I seem to have identified.
ZAPhod Beeblebrox
This is a trade that works in a trending market. I defined trending as multiple closes 45+ pips away from the hourly E44.
The trade requires price to separate from the 8EMA on hourly opens for more than 8 hours. The first return to this EMA is an easy fade towards the next Weekly target. Normally this works only once, but the last time around they managed to milk this twice: the first return was a near miss by 3 pips, and the second bullseye got credited as well.
Zap & Zap while the Supertramp is red. The yellow glow stayed on after the first touch being off a bit. Divergence takes back the excess made by the impulse.
Opportunistic buy / sell
These are 62 and 69-pip displacements of the 6-sample hourly low/high. I made cyan highlights that should conform with the Tramp again to be valid.
I need a separation of 4 out of the last five from the 62-pip displacement line for the entry to be valid.
image quality: jpeg on cell phone – at work again
I can’t seem to find that episode of the Son of the Beach where Noch Johnson ends up in a made up mid-American country and greets people with “Buenos retardes”. You know the one where they eat beans with the world’s highest protein content, then he sits on the leather couch and blames the farting sounds on it. Call me if you have this episode.
8.16x peak stretch , Green River (mean) on the top 5x stretch is the resistance at the moment (White)
some ideas on how to use the RSI-BB V1.0 indicator.
Buy-Buy-Buy
The bands are called upper2, upper, main, lower and lower2.
You are looking for a sequence shaping up as a V that is shaping below the main line or within a few pips.
What can be used as a filter here are the Money Flow Average (5 sample) in 2 colors. You want to see a blue run up preceding a buy entry. Also, you want the V to have at least 2 more values above the dip, and then there is the 8-sample EMA of the opens that I utilized.
They are reminders to look for the V in the upper / lower block(s). They are actually utilizing a VWAP routine. Frankly I don’t even recall why I did what, but the objective was something working. The importance is the outcome.
if (Low[i+1]>ExtBufferVWAP[ i+1 ] && High[i]>ExtBufferVWAP[ i ] && Low[i]<ExtBufferVWAP[ i ] && AVG[i+5]!=EMPTY_VALUE )
      {

      if (AVG[i]<AVG[i+5] && High[i]<iMA(NULL,0,8,0,MODE_EMA, PRICE_OPEN,i) && Open[i]>iMA(NULL,0,8,0,MODE_EMA, PRICE_OPEN,i)-170*Point ) {ObjectCreate(0,"TLine_v"+i,OBJ_TREND,indicator_window,Time[i],upper2[i],Time[i],lower2[i]); ObjectSet("TLine_v"+i,OBJPROP_COLOR,Red);

      }
      else if (AVG[i]<AVG[i+5]) {ObjectCreate(0,"TLine_v"+i,OBJ_TREND,indicator_window,Time[i],upper2[i],Time[i],upper[i]); ObjectSet("TLine_v"+i,OBJPROP_COLOR,Red);

      }
      else if (Low[i]>iMA(NULL,0,8,0,MODE_EMA, PRICE_OPEN,i) && AVG[i]>upper[i]){
      ObjectCreate(0,"TLine_v"+i,OBJ_TREND,indicator_window,Time[i],upper2[i],Time[i],lower2[i]); ObjectSet("TLine_v"+i,OBJPROP_COLOR,Green);}


      else {if (AVG[i]>upper[i]) ObjectCreate(0,"TLine_v"+i,OBJ_TREND,indicator_window,Time[i],main[i],Time[i],lower2[i]); ObjectSet("TLine_v"+i,OBJPROP_COLOR,Green);}
          ObjectSetInteger(0,"TLine_v"+i,OBJPROP_RAY_RIGHT,false);
      ObjectSet("TLine_v"+i,OBJPROP_WIDTH, 13);
      ObjectSet("TLine_v"+i,OBJPROP_BACK, 1);
      }

     if ( High[i+1]<ExtBufferVWAP[ i+1 ] && High[i]>ExtBufferVWAP[ i ] && Low[i]<ExtBufferVWAP[ i ] && AVG[i+5]!=EMPTY_VALUE) {

      if (AVG[i]<AVG[i+5]  && High[i]<iMA(NULL,0,8,0,MODE_EMA, PRICE_OPEN,i) && Open[i]>iMA(NULL,0,8,0,MODE_EMA, PRICE_OPEN,i)-170*Point) {ObjectCreate(0,"TLine_v"+i,OBJ_TREND,indicator_window,Time[i],upper2[i],Time[i],lower2[i]); ObjectSet("TLine_v"+i,OBJPROP_COLOR,Red);

      }
      else if (AVG[i]<AVG[i+5]) {ObjectCreate(0,"TLine_v"+i,OBJ_TREND,indicator_window,Time[i],upper2[i],Time[i],main[i]); ObjectSet("TLine_v"+i,OBJPROP_COLOR,Red);

      }
       else if (Low[i]>iMA(NULL,0,8,0,MODE_EMA, PRICE_OPEN,i) && RSI[i+2]>main[i+2] && RSI[i+2]<upper[i+2] && AVG[i]>upper[i]){
      ObjectCreate(0,"TLine_v"+i,OBJ_TREND,indicator_window,Time[i],upper2[i],Time[i],lower2[i]); ObjectSet("TLine_v"+i,OBJPROP_COLOR,Green);}


      else if (RSI[i+2]>main[i+2] && RSI[i+2]<upper[i+2] && AVG[i]>upper[i]) {ObjectCreate(0,"TLine_v"+i,OBJ_TREND,indicator_window,Time[i],lower[i],Time[i],lower2[i]); ObjectSet("TLine_v"+i,OBJPROP_COLOR,Green);}
      ObjectSetInteger(0,"TLine_v"+i,OBJPROP_RAY_RIGHT,false);
      ObjectSet("TLine_v"+i,OBJPROP_WIDTH, 13);
      ObjectSet("TLine_v"+i,OBJPROP_BACK, 1);
      }
The idea behind the full length bars is that you can sell at will or buy at will.
A flick-flack can occur, of course – see image 1.
The reminder labels promote a side. The bias is coming from the Weekly chart, if the last series of 3 closes were above the weekly 59 EMA, the bull side would be promoted and vica versa.
The purple arrows are looking for crosses through the individual band lines, for instance, the RSI pulls in between the upper and upper 2 lines and the 6-sample bottom is more than 28 pips away, that’s a sell. I highlight a 20-pip block with the deep pink numbers, which are 16-36 pips away from the low of the candle in question. The idea is that if you have certain size in mind that you can handle, every 5 pips put out one fifth of that. They may not all get filled, and that’s ok. You want to cover when the RSI is getting close to the main (middle) line.
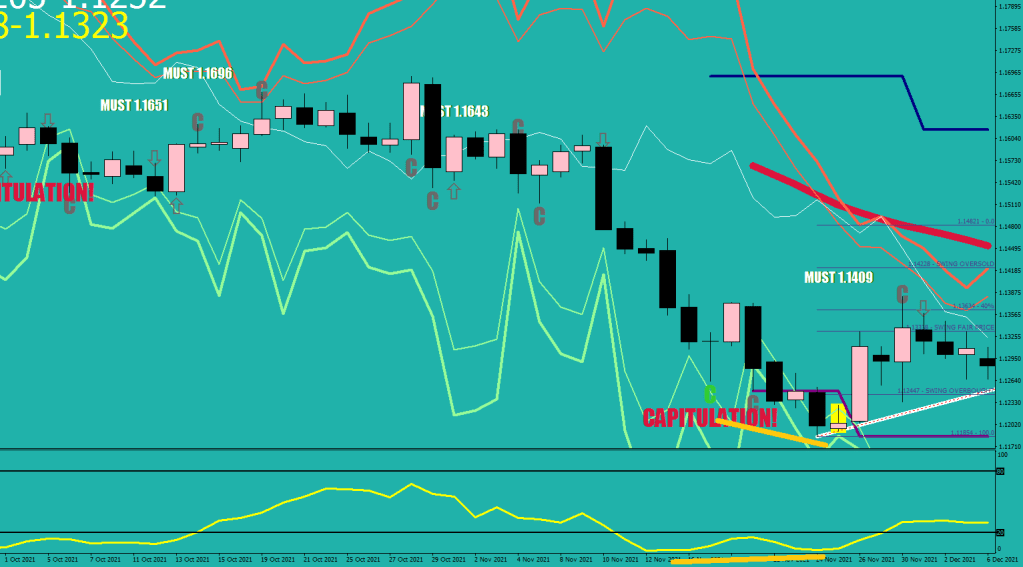
The “Must Go” labels remind of immediate action, they went through several passes of clever filtering. The landings in the Correction and in the New Wave fields are colored differently and the gray-out is not a strong enough signal by itself, only in combination with something else.
The one thing to note here is that the yellow line prints early, preparing you for a possible outcome, but can also be taken back if it goes on for longer than expected, and the text label may or may not follow, but once they printed they meant it.
  if (RSI[i]<main[i] && RSI[i-1]>RSI[i] && RSI[i+2]>upper[i+2]){
             ObjectCreate(0,"TLine"+IntegerToString(i),OBJ_TREND,indicator_window,Time[i+2],RSI[i+2],Time[i],RSI[i]);
                   ObjectSetInteger(0,"TLine"+IntegerToString(i),OBJPROP_RAY_RIGHT,false);
                   ObjectSet("TLine"+IntegerToString(i),OBJPROP_COLOR,clrYellow);
                   ObjectSet("TLine"+IntegerToString(i),OBJPROP_WIDTH,9);
                   ObjectSet("TLine"+IntegerToString(i),OBJPROP_BACK,1);

                    ObjectCreate("TLiney"+DoubleToStr(i), OBJ_TEXT, indicator_window, Time[i], RSI[i]-30*Point);
                      if (MathAbs(Close[i]-iMA(NULL,0,44,0,MODE_EMA, PRICE_MEDIAN,i))<800*Point)
                    ObjectSetText("TLiney"+DoubleToStr(i), "MUST GO LONG", 13, "Impact", Purple);
                    else ObjectSetText("TLiney"+DoubleToStr(i), "MUST GO LONG", 13, "Impact", DimGray);
                    if (Market[0]<0) ObjectSetText("TLiney"+DoubleToStr(i), "MUST GO LONG", 13, "Impact", DimGray);

      }
       if (RSI[i]<lower2[i] && RSI[i-1]>RSI[i] && RSI[i+3]>lower[i+3] && RSI[i+4]>lower[i+4]){
             ObjectCreate(0,"TLine"+IntegerToString(i),OBJ_TREND,indicator_window,Time[i+3],RSI[i+3],Time[i],RSI[i]);
                   ObjectSetInteger(0,"TLine"+IntegerToString(i),OBJPROP_RAY_RIGHT,false);
                   ObjectSet("TLine"+IntegerToString(i),OBJPROP_COLOR,clrYellow);
                   ObjectSet("TLine"+IntegerToString(i),OBJPROP_WIDTH,9);
                   ObjectSet("TLine"+IntegerToString(i),OBJPROP_BACK,1);

                   ObjectCreate("TLiney"+DoubleToStr(i), OBJ_TEXT, indicator_window, Time[i], RSI[i]-30*Point);
                   if (MathAbs(Close[i]-iMA(NULL,0,44,0,MODE_EMA, PRICE_MEDIAN,i))<800*Point)
                    ObjectSetText("TLiney"+DoubleToStr(i), "MUST GO LONG", 13, "Impact", Green);
                    else ObjectSetText("TLiney"+DoubleToStr(i), "MUST GO LONG", 13, "Impact", DimGray);
                    if (Market[0]<0 && RSI[i+3]>upper[i+3]) ObjectSetText("TLiney"+DoubleToStr(i), "MUST GO LONG", 13, "Impact", DimGray);
      }


           if (RSI[i]>main[i] && RSI[i-1]<RSI[i] && RSI[i+2]<lower[i]){
             ObjectCreate(0,"TLine"+IntegerToString(i),OBJ_TREND,indicator_window,Time[i+2],RSI[i+2],Time[i],RSI[i]);
                   ObjectSetInteger(0,"TLine"+IntegerToString(i),OBJPROP_RAY_RIGHT,false);
                   ObjectSet("TLine"+IntegerToString(i),OBJPROP_COLOR,clrYellow);
                   ObjectSet("TLine"+IntegerToString(i),OBJPROP_WIDTH,9);
                   ObjectSet("TLine"+IntegerToString(i),OBJPROP_BACK,1);

                    ObjectCreate("TLiney"+DoubleToStr(i), OBJ_TEXT, indicator_window, Time[i], RSI[i]+9);
                    if (MathAbs(Close[i]-iMA(NULL,0,44,0,MODE_EMA, PRICE_MEDIAN,i))<800*Point && High[i]-iLow(symbol,0,iLowest(symbol,0,MODE_LOW,6,i))>280*Point)
                    ObjectSetText("TLiney"+DoubleToStr(i), "MUST GO SHORT", 13, "Impact", Purple);
                    else  ObjectSetText("TLiney"+DoubleToStr(i), "MUST GO SHORT", 13, "Impact", DimGray);
     }


      if (RSI[i]>upper2[i] && RSI[i-1]<RSI[i] && RSI[i+3]<upper[i+3]){
             ObjectCreate(0,"TLine"+IntegerToString(i),OBJ_TREND,indicator_window,Time[i+3],RSI[i+3],Time[i],RSI[i]);
                   ObjectSetInteger(0,"TLine"+IntegerToString(i),OBJPROP_RAY_RIGHT,false);
                   ObjectSet("TLine"+IntegerToString(i),OBJPROP_COLOR,clrYellow);
                   ObjectSet("TLine"+IntegerToString(i),OBJPROP_WIDTH,9);
                   ObjectSet("TLine"+IntegerToString(i),OBJPROP_BACK,1);

                   ObjectCreate("TLiney"+DoubleToStr(i), OBJ_TEXT, indicator_window, Time[i], RSI[i]+9);
                   if (MathAbs(Close[i]-iMA(NULL,0,44,0,MODE_EMA, PRICE_MEDIAN,i))<800*Point)
                    ObjectSetText("TLiney"+DoubleToStr(i), "MUST GO SHORT", 13, "Impact", Crimson);
                    else ObjectSetText("TLiney"+DoubleToStr(i), "MUST GO SHORT", 13, "Impact", DimGray);
      }
I know, this was meant to be a user-friendly manual, but I chose to include the logical expressions as is for I currently have no idea how to explain things with accuracy otherwise.
Are you bad enough, are you really tough?
Your eyes without the haze…
Let’s dispose of this position in this disposition, candy girl…





























 ForexFore - Internals, indicators, algorithmic trading