Bear Market Trading Framework

The weekly setup.

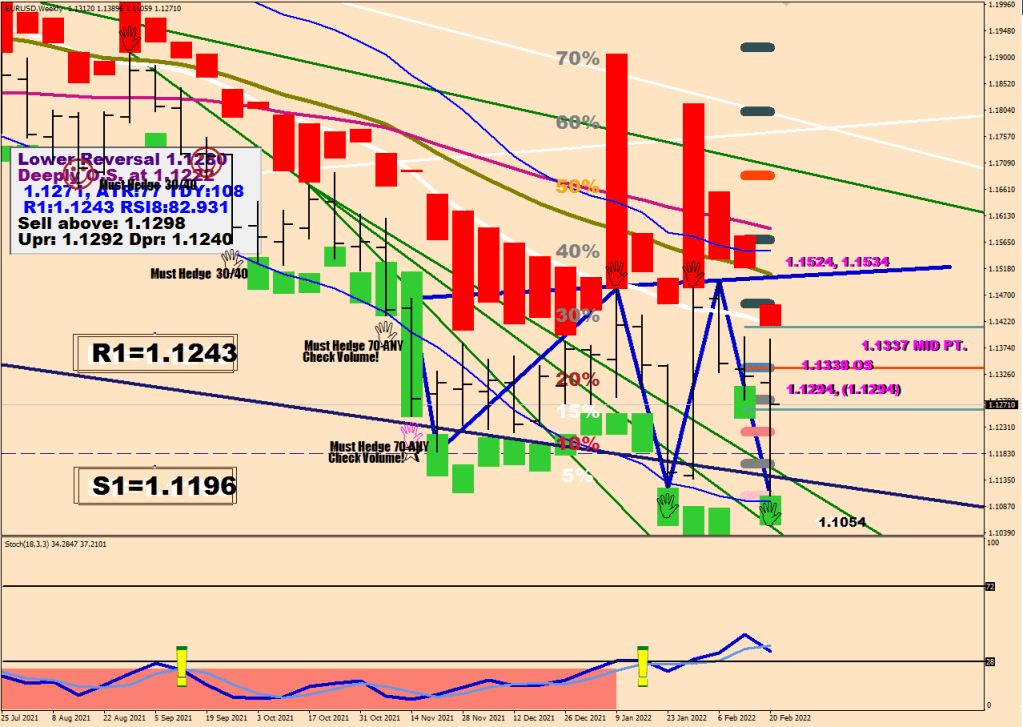
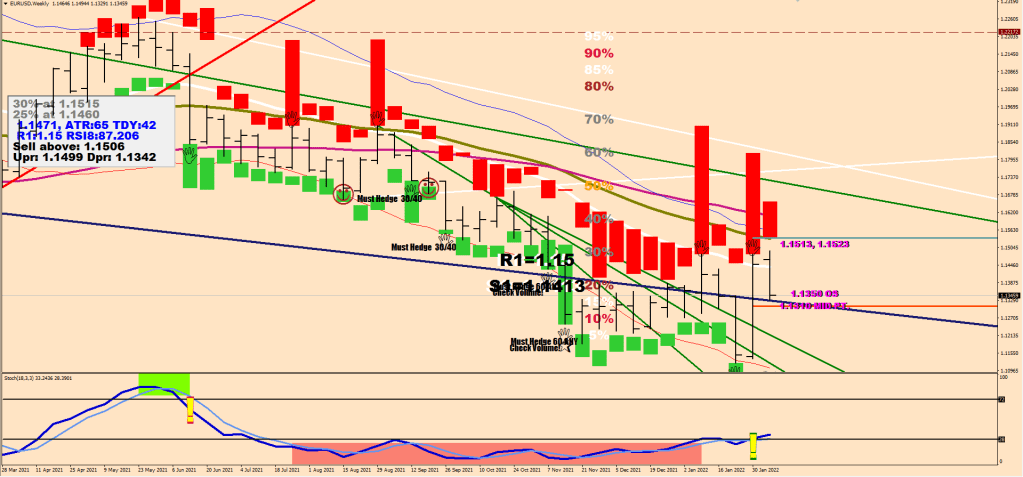
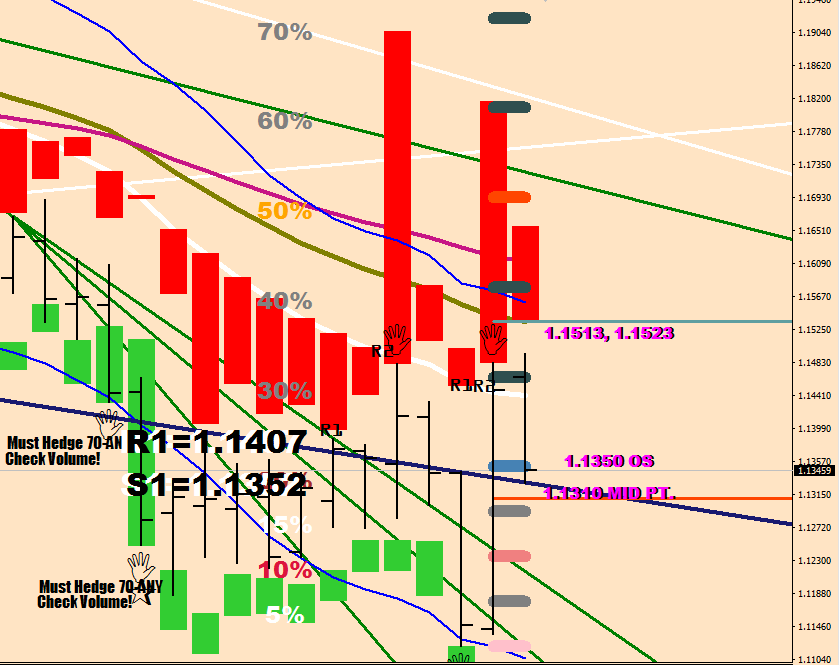
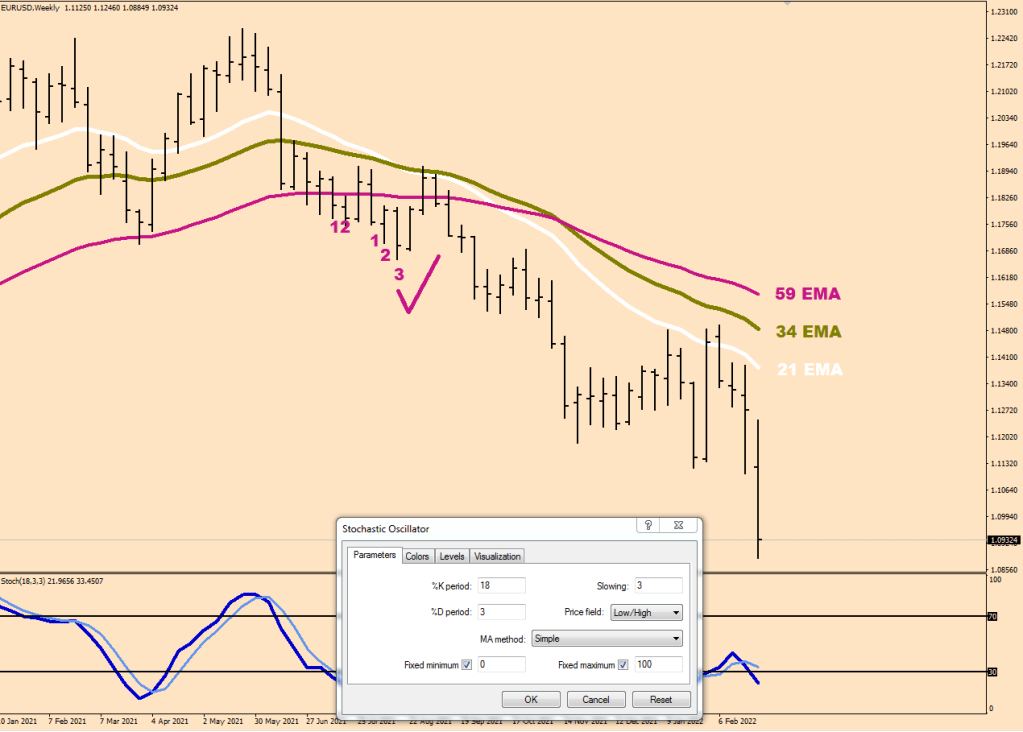
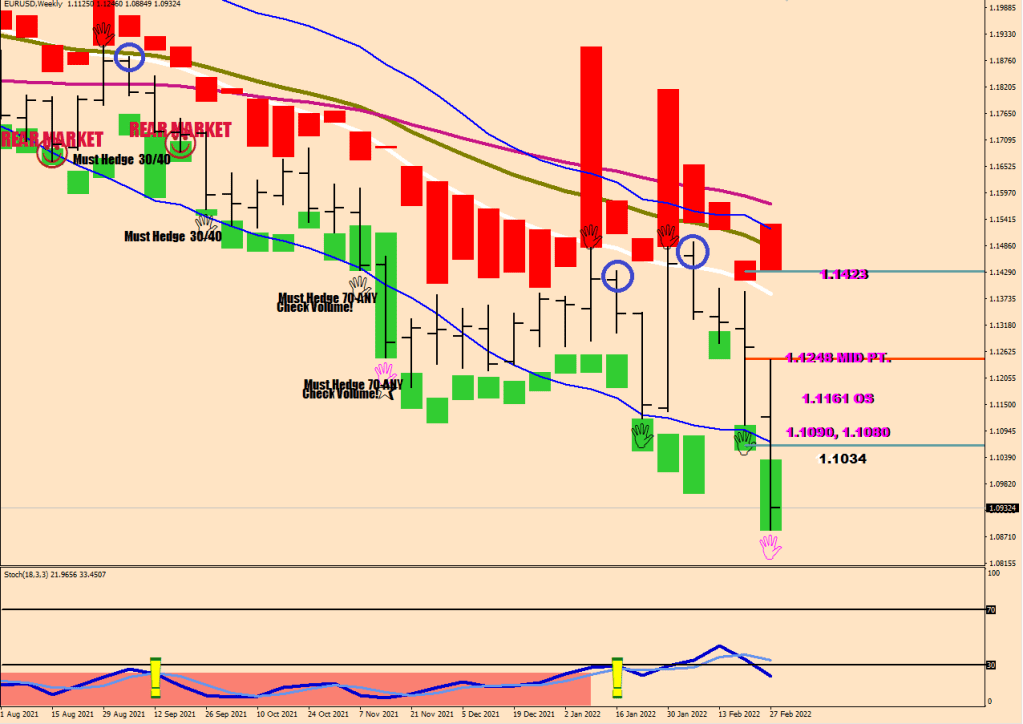
All EMAs are HL2s. The image shows the market going into bear mode upon 3 weekly closes were made below the 59 EMA. As you can see from then on the 21EMA proved to be a good short entry.

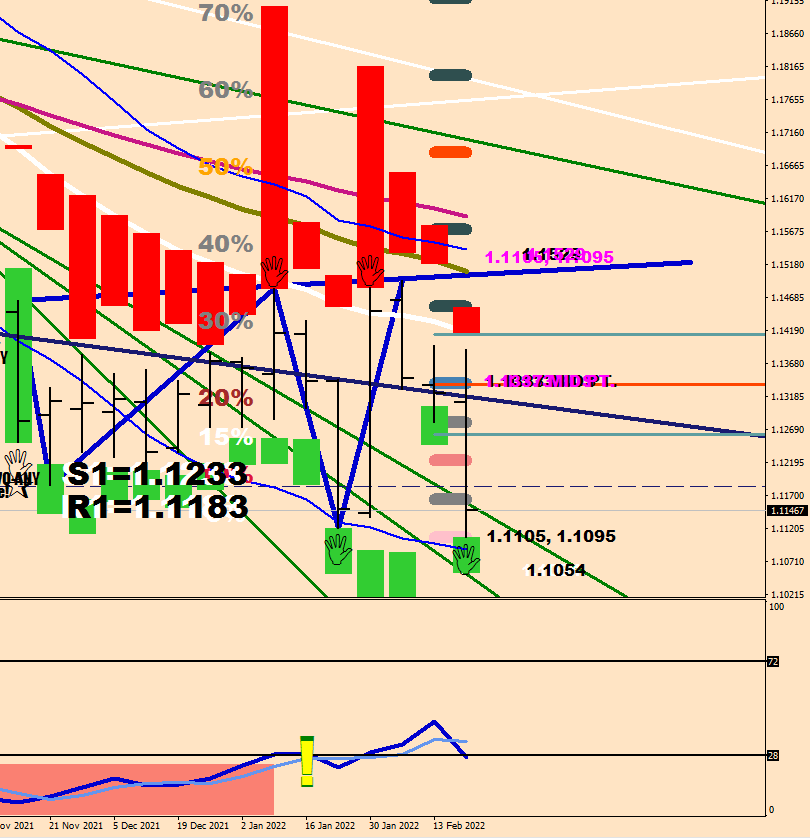
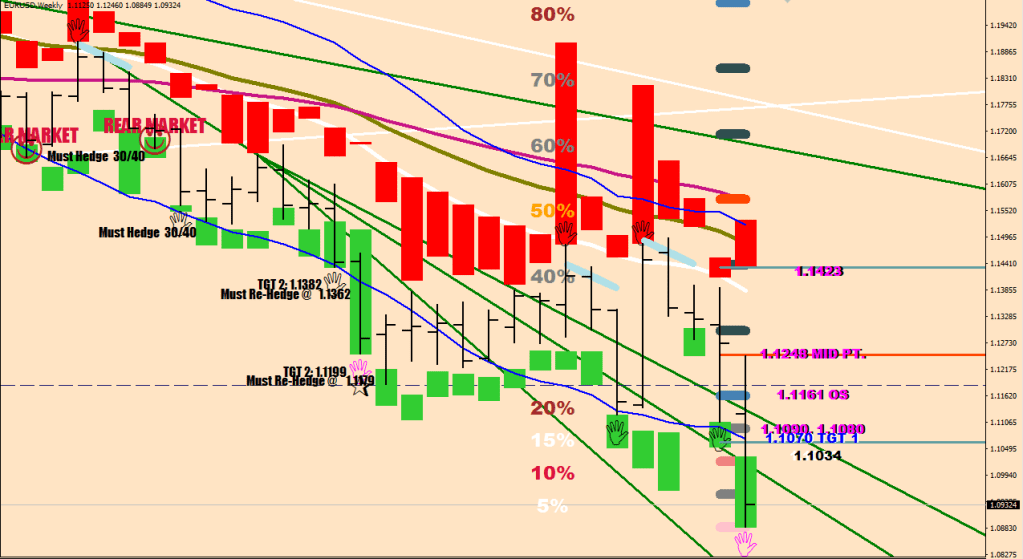
The quarter lines are generated from the last week’s data: they are a 15%-50% extra added on both sides relative to last week. If the 50% range gets exceeded, that is called a push and there is a palm representing this. I push out the start of the histogram to the terminal point.

As you can see, after the settled push, you also have a low risk entry in the blue circles, with a possible total of 9, 22 and 32 pips draw down if you buy at the opening price.

     AxelU[i]=(High[i+1]-Low[i+1])/100*15+High[i+1];
     AxelHU[i]=(High[i+1]-Low[i+1])/2+High[i+1];
     AxelU1[i]=(High[i+1]-Low[i+1])/2+Low[i+1];
     AxelL[i]=Low[i+1]-(High[i+1]-Low[i+1])/100*15;
     AxelHL[i]=Low[i+1]-(High[i+1]-Low[i+1])/2;

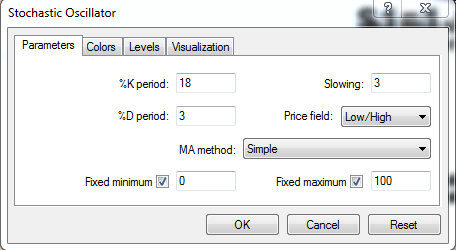
if (iStochastic(symbol,0,18,3,3,MODE_SMA,1,MODE_MAIN,i)<25 && iStochastic(symbol,0,18,3,3,MODE_SMA,1,MODE_MAIN,i+1)<25 && iStochastic(symbol,0,18,3,3,MODE_SMA,1,MODE_MAIN,i+2)<25 && iMA(symbol,0,21,0,MODE_EMA, PRICE_MEDIAN,i)>AxelU[i]){
         HighBuffer[i]=iMA(symbol,0,21,0,MODE_EMA, PRICE_MEDIAN,i);
         LowBuffer[i]=AxelHU[i];
      }
      else {
         HighBuffer[i]=AxelHU[i];
         LowBuffer[i]=AxelU[i];
      }
      
      
          if (iStochastic(symbol,0,18,3,3,MODE_SMA,1,MODE_MAIN,i)>75 && iStochastic(symbol,0,18,3,3,MODE_SMA,1,MODE_MAIN,i+1)>75 && iStochastic(symbol,0,18,3,3,MODE_SMA,1,MODE_MAIN,i+2)>75 && iMA(symbol,0,21,0,MODE_EMA, PRICE_MEDIAN,i)<AxelL[i]){
         HighBuffer2[i]=AxelHL[i];
         LowBuffer2[i]=iMA(symbol,0,21,0,MODE_EMA, PRICE_MEDIAN,i);
      }
      else {
         HighBuffer2[i]=AxelL[i];
         LowBuffer2[i]=AxelHL[i];
      }

The blue lines are the 14-sample Window envelopes, they are sort of a “Target 1”.

The color coded hands… Magenta mean that the market closed outside the window envelope. Usually there is follow through to that. There is also a white palm (white lie when the hand does not make an 8-sample lower low/higher high), but not here.

The must hedge / re-hedge entries are 70 pips beyond the push terminal.

I would consider 50 below the push point to be TGT2.

Last week’s pivot can also prove to be a good entry.
Now, let’s talk Salvatore Daily.
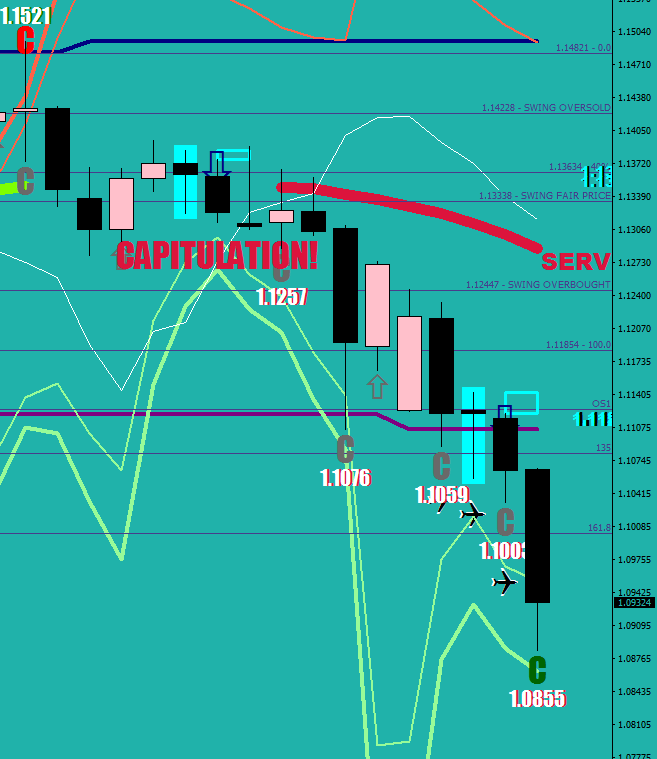
June was not a bear market – yet.
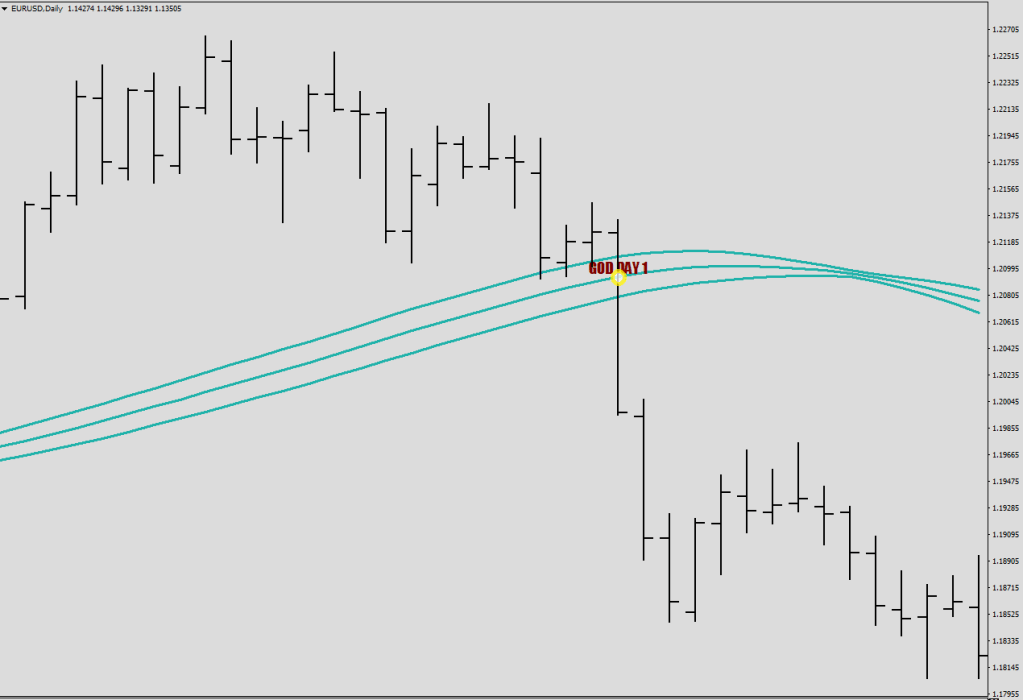
There was a God Day 1, a crossing that you don’t fade until Day 3.
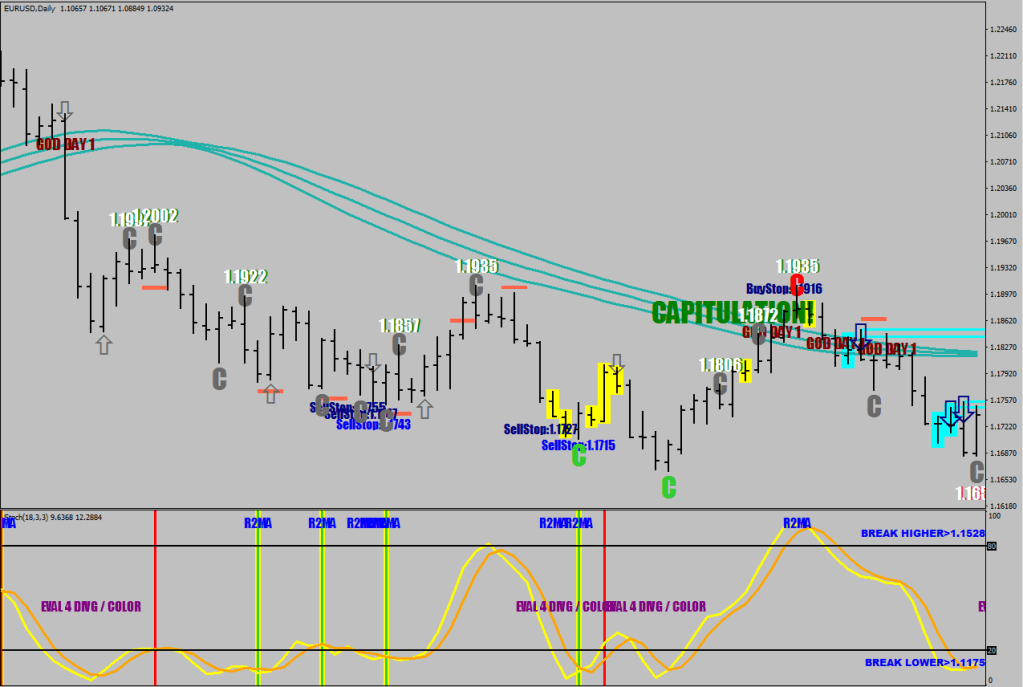
The 18-sample stochastic becomes very important here.

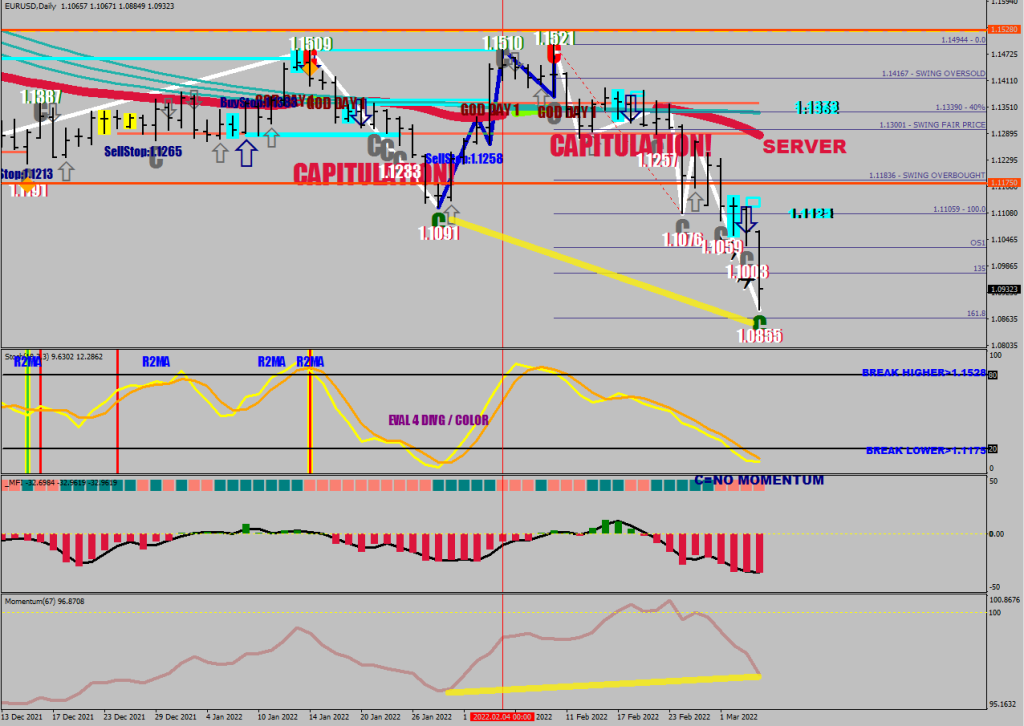
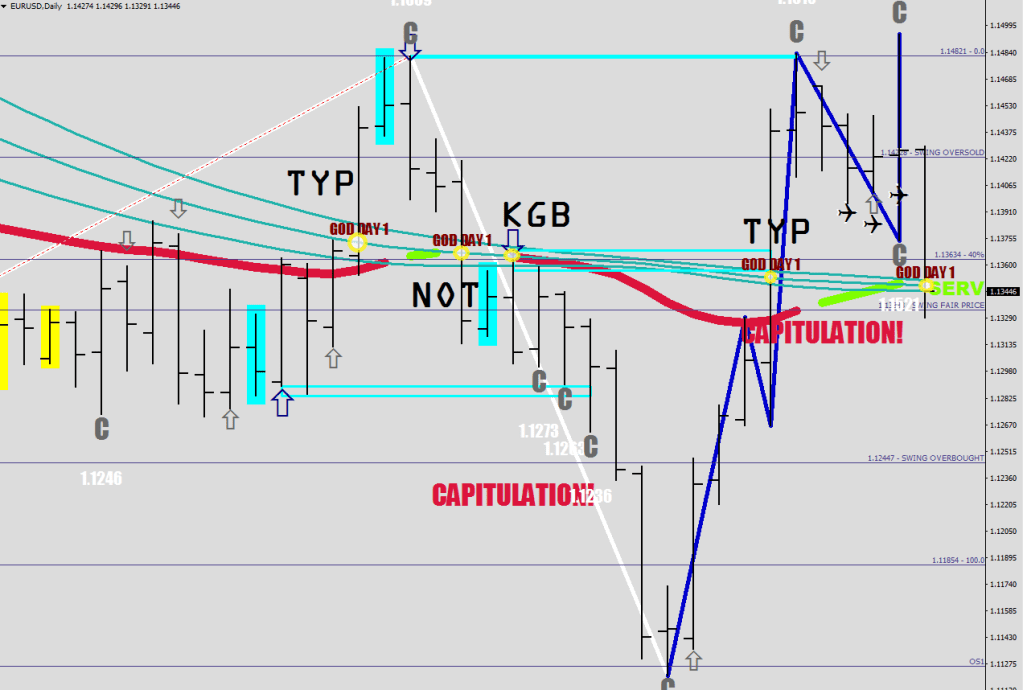
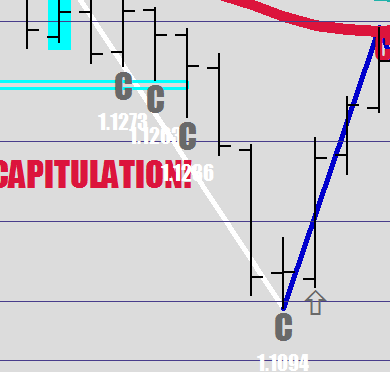
The optimal entry in the Bear market was a Cover high (a day that is a 4-sample higher high closing down by 27+ pips) with the stochastic K above 80 (red C).

During the transition period, an overbought K and a C on the day or before was a very good entry.

The exit during the transition was below a fresh C print scale out in the next 60 pips watching the reversal divergence get more pronounced.

The Lime C-s also worked the same way, they are not fully ripe ones, but two had enough vitamin-C.

Ever since the world begun (the Rear Market) there have been mostly corrective waves.

The difference between the corrective wave and the impulsive is that the corrective one makes its high / low with optimal strength versus the impulsive one goes into excess and has to correct back with a divergence. Feel free to fry all of your E.W. knowledge.

Everyone has screwed up the wave count, particularly the ET EWs.

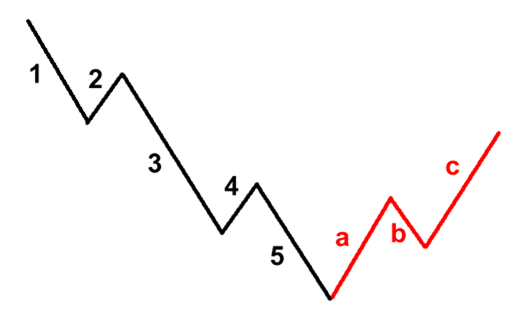
The orange ABC was a Wave 4. It made a lower low than Wave 3, yes.
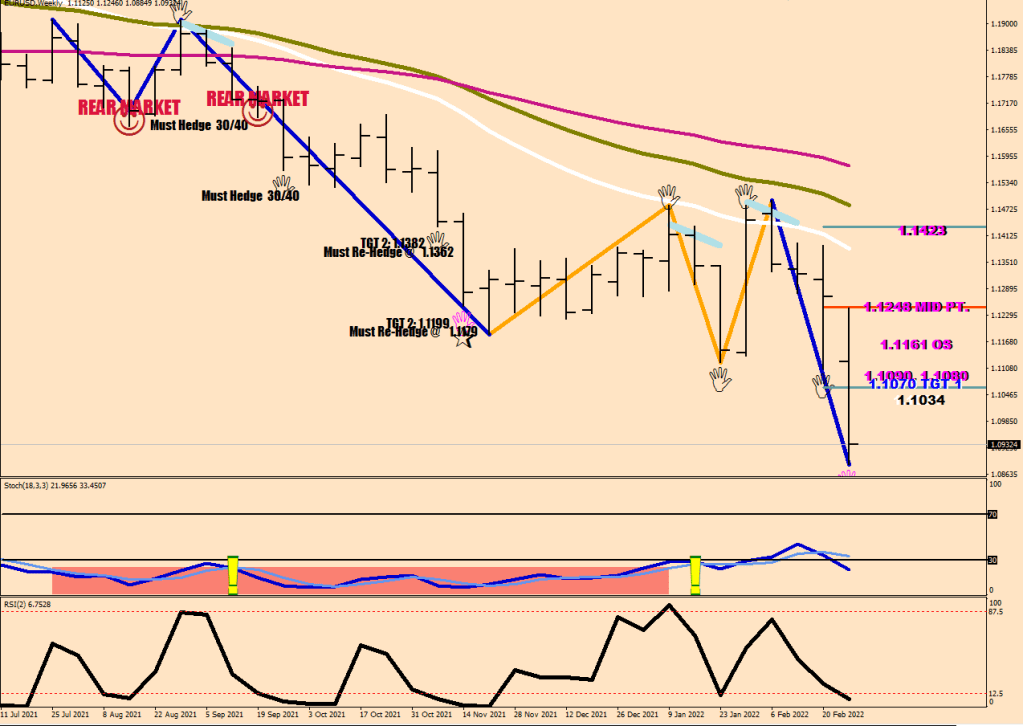
Ok. Back to business.

Wave 3 ended with the impulsive divergence I’ve been talking about, under the under cooked C with a total of 80 pips.

Any move back to Murena (E44) was a prime sell during the heat-wave.

The following ABC took 2 full months to play out. Every wave ended with a Cover C and optimal strength.
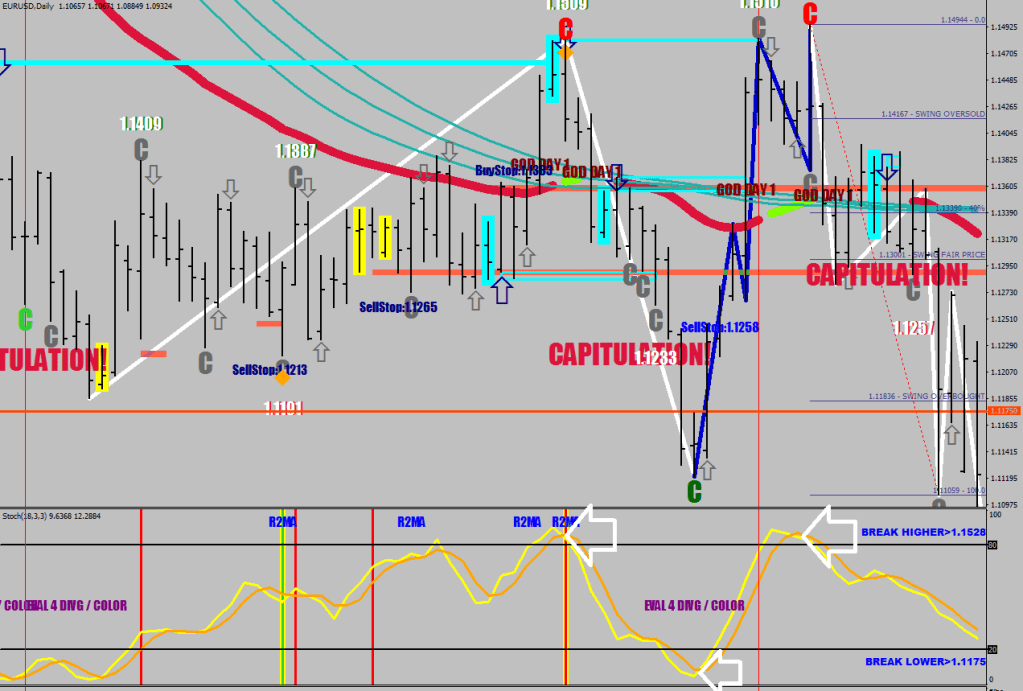
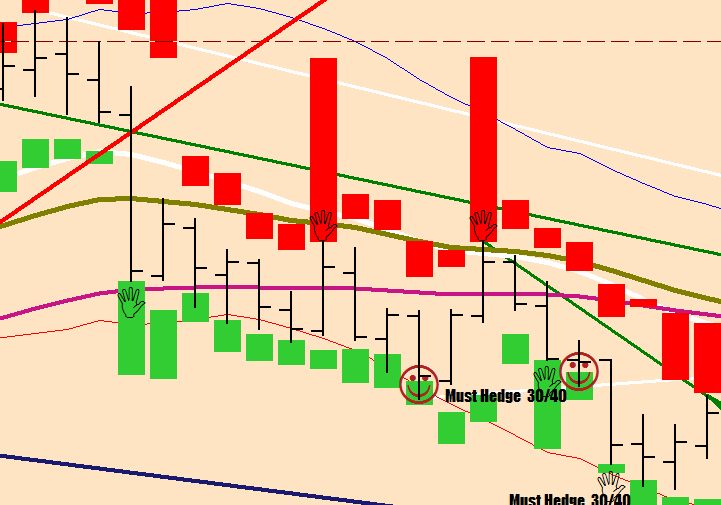
The last thing to talk about is the Must entries, these are the moratorium numbers under / above the C-s at 27 or 30 pips. Two more pips and you have no more excuses not to take on a full hedge or a venture short.

To play these, aim for 150 pips from your entry and trail. Code 11 would be my choice after 20+ pips in gains.

Are we gonna get a lower low come next week? I think this Wave 5 has a corrective structure, and the stoch K isn’t gonna touch the 4.8 made by Wave 4, the settled value was 9.6 and intra day the lowest print I saw was 6.5 – I would call it satisfactory. It all depends on how the market would open. Some gap up would certainly decrease the chance of a beat.

Raw was my 7th book written in Hungarian, released it in 1997.

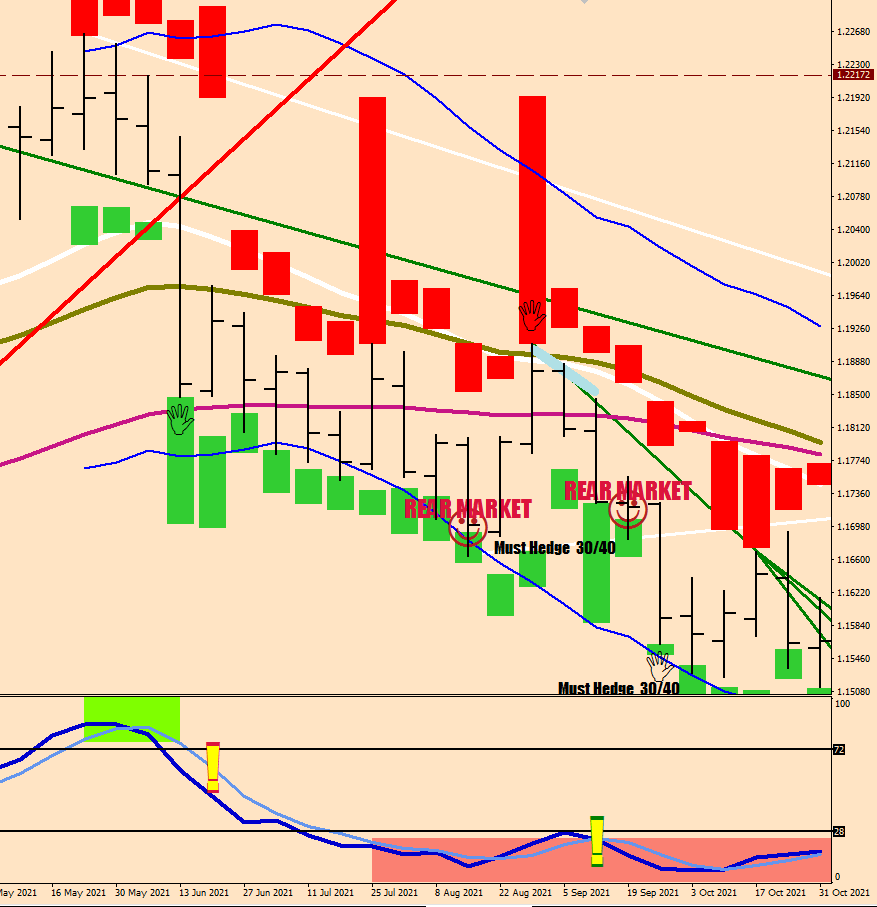
Back in the Summer of 59: the Baer Market entry did not work when price opened back up above the E-59, and transformed into a Bulk Market in 3 weeks & started riding the Envelope up.

The second envelope I placed at 3.5x

After Magenta push beyond the Window Envelope, Wave 3 mustered 105 extra pips beyond next week’s open,
Wave 5 managed 98
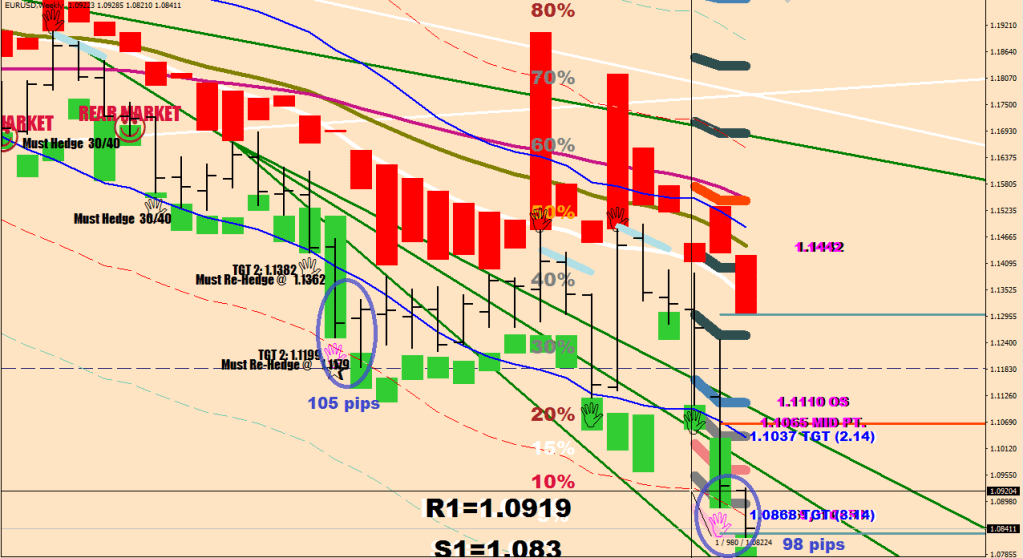
Not entirely sure where the 100 comes from, but 3x fluctuation size is 96. I guess I know where Target 4 is then If you are curious, the Stoch was at 4.9 at its lowest. Strange? Not really. Same thing with the 67 momentum. Just about matched the prior reading with price 300 pips lower. This is the very definition of reversal divergence.

The Cost of No Opportunity #1

The difficulty of trading is that you don’t know how much knowledge is there to be had about the rules of the game and so you always seem to think that you already know enough, but you never do.

4 months ago I had no clear definitions for market type, I had not come up with a round enough interpretation of how the weekly quarter lines can provide hints, a few months ago I did not have a concept for Cover days, what preceeds a capitulation and until just yesterday I could not have provided good enough information about what makes a daily low/high a terminal one.

When you don’t know what to be looking for you are bound to be lost, bound to lose.

My one line code for trading goes like this: know the rules of the game!

This journey is paved with disproved thesis.

The latest one I’m waiting for the answer to is about momentum divergences between different wave structures. Namely can the intra wave structure divergence idea be used in the same manner for inter waves?

What I mean is this: during this bear market that was invoked by 3 closes below the 59-week EMA, we have seen two kinds of lows. Both had strength transpired to the downside, but one of them conformed with the too much love strength would kill you idea by going way below 4.9 on the Stochastic and therefore it had to get the depth right first wirh a reversal divergence.

The inter-wave dilemma goes like this: do you need another print below 4.9 or a good scare on this number in combination with the prior last leg printing a qualifier run should be enough?

The implications may be profoundly different: is this Wave prints a too strong low (a principle well known by me on the hourly thanks to my Zero-Mastodon RSI2 adventures) then this would only be finishing the Measuring leg to the downside in the coming days versus today may be a low before a return to God or at least his gate keeper, Murena.

Either way, no solid commitments should be made today.

The gazillion dollar question: is a sub 8 print the awaited divergence or a sub 4.5 but not much below is to be scored first? This being a weekend, the risk is a gap down, why, it has to be. The jump scare is in your your short term memory: last week’s 130+ pips gap down. How about a gap up then? Gentlemen, make your bets please!
8

Sorry for having no better images / source snapshot only, but I am at work & wanted to get this out today.

The 67 momentum is diverging grearly, 18-samp stoch is in the 7-s.

Ladies & Gentlemen, I know what you want…

The Barracuda-Baramundi-Bernáthegyi System

A practical application

To my dear husband – oh wait, I don’t have one

From the top, make it drop

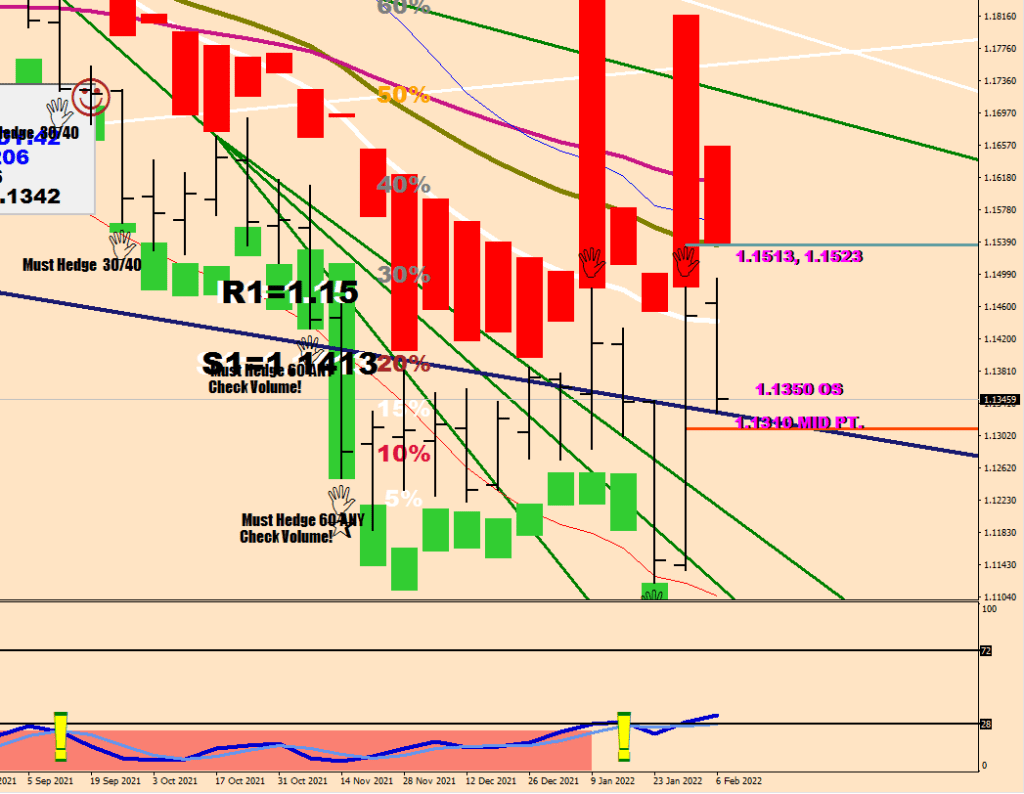
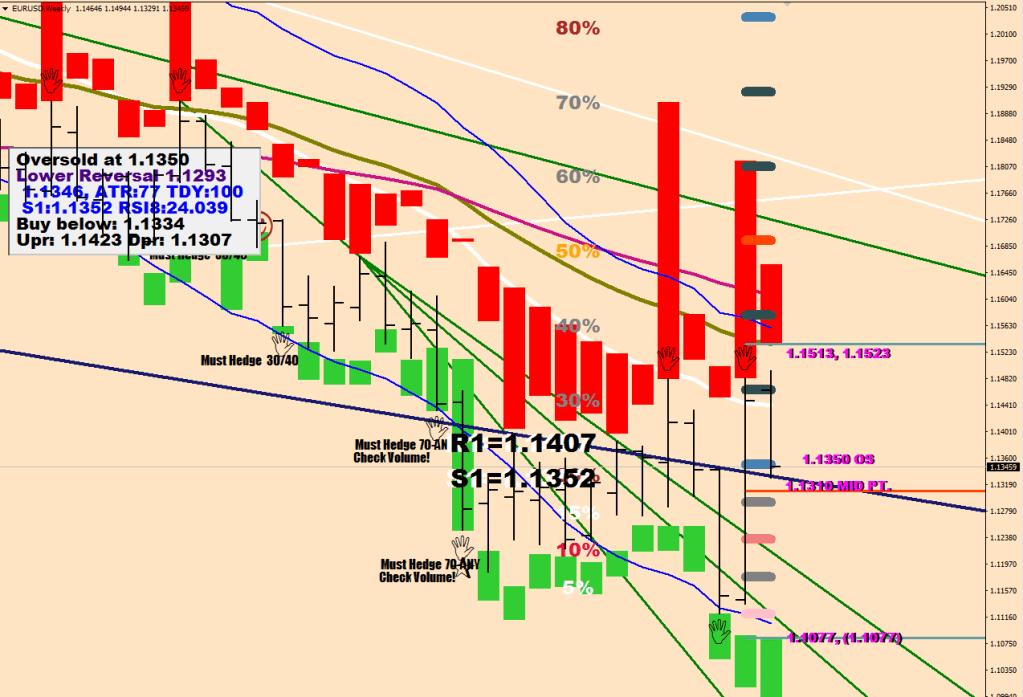
On the weekly chart we are looking at a reversal at a major trendline.

The Navy trendline is from connecting the last 3 major swing highs.

So this is a break-out back test. 1.1175 seems to be a particularly important level.

The megaphone (volatility expansion) pattern also hints a reversal. The stochastic seems to have left the oversold level decidedly.

Other weekly info: after a weekly push to the downside buy below the new weekly open any move, but statistically less than a fluctuation-sized move is expected downwards. i.e. 32 pips.

The weekly pivot would be at 1.1247.

On the upside, I would anticipate some setback around the 1.1309-1.1322 area where the market profile steps are too steep.

1.1360 should be reached after some consolidation possibly on Monday.

Things would get really interesting after surpassing God (currently at 1.1342), as that would make Monday a God Day 1 which is not fade-able, and 2 days could certainly take price up to the very top of the second block, at 1.1528 – not seen since the 10th of November, 2021.

If they want to stop this catapult move, they would have to step in with force at the server (1.1336/39) with force utilizing the Wyckoff-Dudikoff-Sosnoff method. The only hope that Obi-Wan-Shinobi has is that the hourly money flow is showing some divergence and the second hump would be three fifth completed upon the dip at the open. This could buy an ABC back down to the 4-H pivot at 1.1204 or even for a catch-up with the H&S neckline, but I don’t think there is any hope to get beyond 1.1158.

I believe you should be very careful with taking downside trades.

Opportunistic buys are at 1.1212 and seven pips lower. Price is currently stalling / relapsing from the same height where it started trending by closing below the Shadow line for 2 hours (purple lines).

…reimbursement for a Mean Monday

Hey Hey Guy

This is a personal misery article, you may not learn much about trading, so don’t read it.

I started trading forex in 2013 after moving back to Europe. Here, in the smaller money, more scammy world you did not need 25k for a trading account, the bookmaker style, we write IOUs on a white board somewhere on an OffShore island was not particular about size.

In March 2014 I signed up for a Forex course in London. This was a month long proposition by SouthEgg Capital to try and earn a living trading Forex. Noone ever did, the company went belly up. So much for conventional risk managrment ideas.

I had 3 personal accounts throughout the yesrs. The first one was “fixed spread”. Big mistake. The second one gave me 300:1 leverage, but to avoid a margin call I had to call in and beg the clerk at the desk to credit my deposit already at any hour of the day.

I probably lost £35k of my own capital, and all IOUs got wiped off the white boards without exceptions. I even had an equity call one time, which is really hard to do: a fully hedged account can be blown up by the broker cranking up the spread until they manage to take the equity below zero.

The current, 500:1 leverage account is over 2 years old now.

It has been blown up a few times. $146,000 got posessed by the broker, and some of it was my own capital (After taking out $7,600 later today, the net deposits would come to $35k). Not sure why, but Forex Factory shows it like all of it was deposited I have also made some withdrawals with this broker.

So now, that we pointed out that I cannot make money with Forex, let’s talk about what I can make: large percentages.

The account had $500 on it on the 23rd of November, 2021.

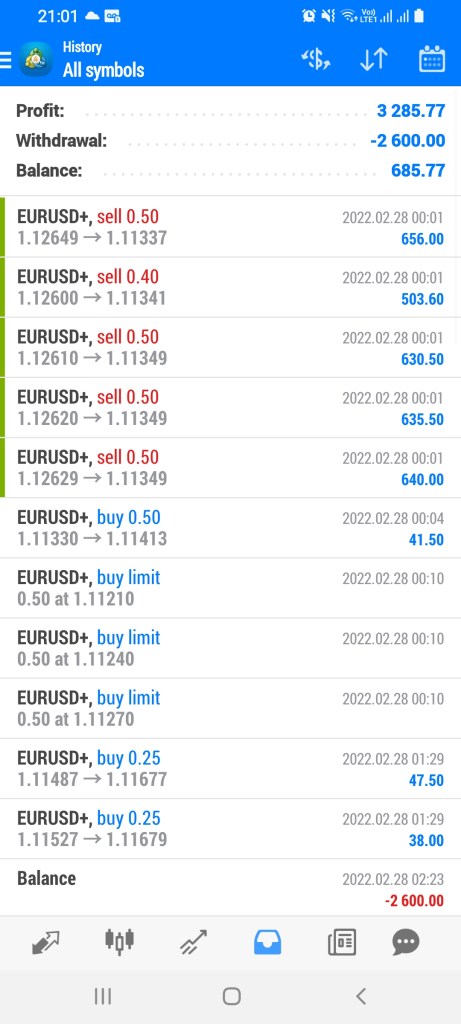
Today, on the 25th of February, after 2 withdrawals (2x$1,300) the equity reached $18,469, so the total got to $21,069.

The balance is higher, as I have open positions 100% of the time, but that money less the equity is the broker’s end of the bargain.

The time period was about 3 months. What does 4100% remind me of?

I have never seriously considered trading cryptos. The white board companies run some opening hours that I can’t figure out, and the crypto exchanges with access keys & wallets is a whole new level of endless scams that I am not curious about. Crypto Face and his 20 years of trading ecperience is safe from me for now. Phemex does not cater for Europe and I have no reason to start calling myself Clepto Face and start naming my indicators Market Stifle etc.

This blog entry was meant to show you how difficult it is to make & keep Forex gains, and when someone is claiming to have made 41,000% gains, be very, very sceptical & that’s all I’ve got to say. Don’t follow my lead, but learn from my mistakes as someone has to.

Best regards,

the 4,100% Guy

February statement

Pop Goes The Reason

Geotical private-tension intetest-debate Mikhail Floomberzs climate-taper socio-physical-psycho tantrum-punktum. Take a rate hike, who cares?

To take away the edge of the upcoming recession, every country is in need of deficit spending, aka war – is all.

Can we all agree on the fact that smart money went short on the 17th of February and defended their holdings viciously 2 trading days later, on the 21st?

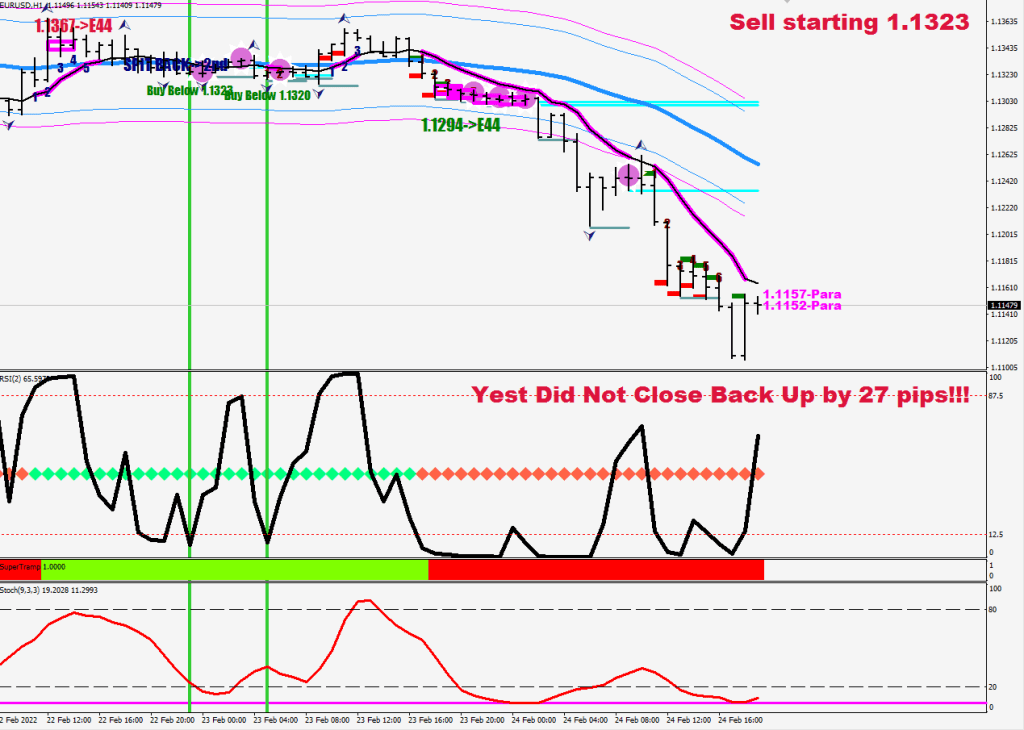
Can we also agree that yesterday did not close back up 27 pips+, hinting a coming capitulation move?

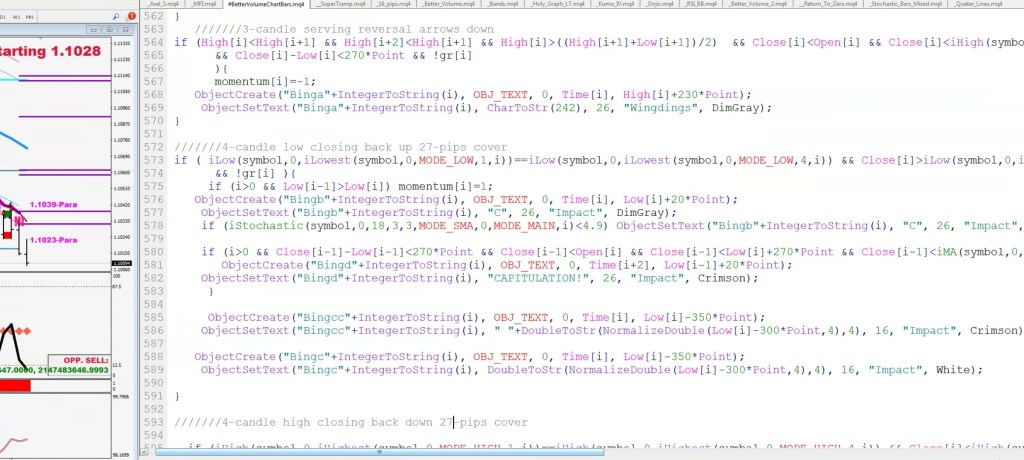
if (iClose(symbol,1440,1)<iLow(symbol,1440,1)+270*Point){
               deletetxt1("GELI");
              ObjectCreate("GELI",OBJ_LABEL,indicator_window, 0,0);
              ObjectSetText("GELI","Yest Did Not Close Back Up by 27 pips!!!",21,"Arial Black");
              ObjectSet("GELI",OBJPROP_CORNER,1);
              ObjectSet("GELI",OBJPROP_XDISTANCE,20);
              ObjectSet("GELI",OBJPROP_YDISTANCE,7);
              ObjectSet("GELI",OBJPROP_COLOR,clrCrimson);
}

if (iClose(symbol,1440,1)>iHigh(symbol,1440,1)-270*Point){
               deletetxt1("GELI");
              ObjectCreate("GELI",OBJ_LABEL,indicator_window, 0,0);
              ObjectSetText("GELI","Yest Did Not Close Back Down by 27 pips!!!",21,"Arial Black");
              ObjectSet("GELI",OBJPROP_CORNER,1);
              ObjectSet("GELI",OBJPROP_XDISTANCE,20);
              ObjectSet("GELI",OBJPROP_YDISTANCE,7);
              ObjectSet("GELI",OBJPROP_COLOR,clrGreen);
}

Nothing has changed. The Dollar was given the casus belli to print that right shoulder already (that got upgraded to a beat with a reversal-divergence).

There were two closes outside the swing of things, Dollar buying ensued. Eur/Usd is nowhere near embedding.

At first nobody wanted to buy Dollars, now there’s a war going on somewhere and the greenback becomes… simply irresistible. I suspect a sucker-trap.

The next step is to lay down definitions and guidelines for trading a trending market.

Trending market: more than 1 close outside the shadow line of E44

Figure a

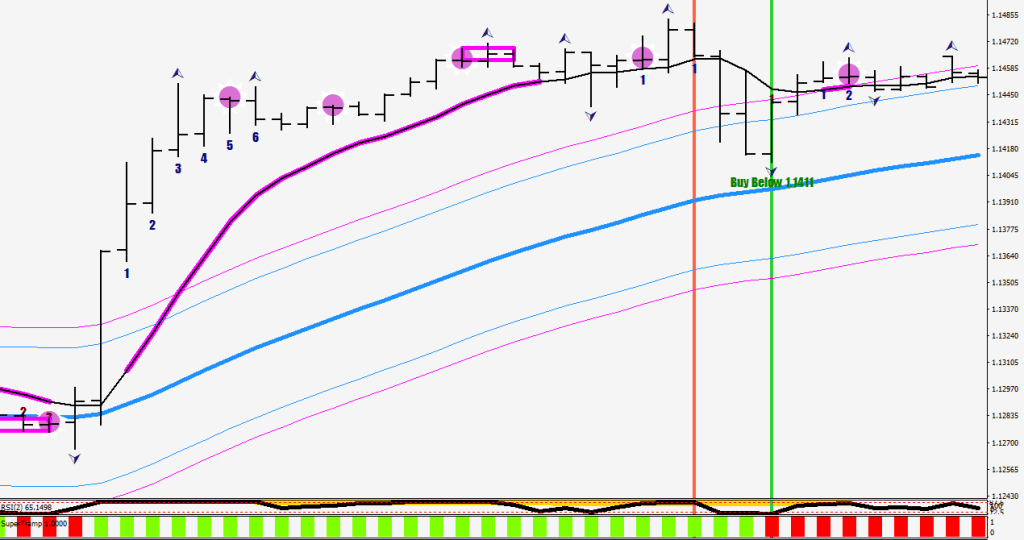
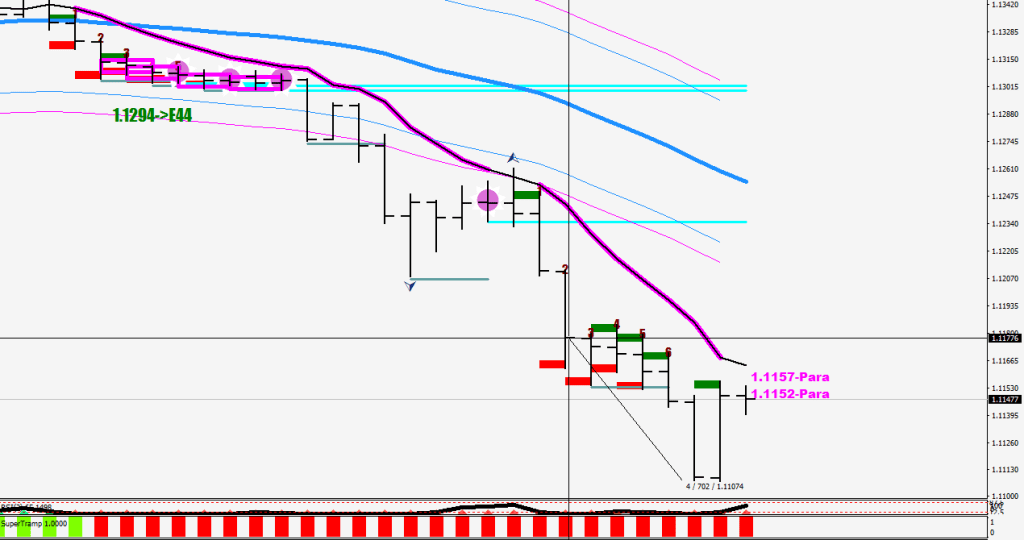
Play: fade 1st return to the interaction line (E8-o), measure a target field from the first F8 fractal: 30pips out (in a not embedded market), if the E8-o does not let go for more than 2 hours after re-connecting (figure a); if price closes away from the E8-o for the second hour after the re-connect, go back in the direction for an additional 70 pips (figure b)

Figure b, 1.1205 is a plausible zero to return to

Play 2: fade first return to E-32, target the resistance near the low/high

What do you buy come next week after a push without embedding? It was relayed in the Neverending Embedding #2.

The Window Envelope is at 1.1097.

I’m pretty sure, this Monday is going to be a mean one.

Return To Furlough

The original title was gonna be Carbohydrate, but this one is a sequel.

A plate full of Hydras hydrates. Not quite as funny as in Hungarian (Egy tál hidra hidratál).

Triple bypass =
0M + para reversal + takeoff

To be played with full size

" F/S:"+DoubleToStr(NormalizeDouble(NormalizeDouble(AccountEquity()/2/600,2),2),2)+"LOT"

Trail CODE 11

 if (OrderType() == OP_BUY  
  && OrderStopLoss()==0.11 && RSI2[0]>80) 
     if (Bid>OrderOpenPrice()+40*Point && OrderOpenPrice()+40*Point>OrderStopLoss() && OrderOpenPrice()+30*Point>OrderStopLoss()){
  //               Print("bUY sTOP lOSS ATTEMPT ", OrderTicket());
              if (!OrderModify(OrderTicket(), OrderOpenPrice(), NormalizeDouble(OrderOpenPrice()+15*Point,6), OrderTakeProfit(), Red))
          Print("Error setting Buy trailing stop: ", GetLastError());
      }
       
 if (OrderType() == OP_SELL  
    && OrderStopLoss()==11 && RSI2[0]<20 )
     if  (Ask<OrderOpenPrice()-40*Point && OrderOpenPrice()-40*Point<OrderStopLoss() && OrderOpenPrice()-30*Point<OrderStopLoss()
       ) {
  
 //    Print("sELL sTOP lOSS ATTEMPT ", OrderTicket());
      if (!OrderModify(OrderTicket(), OrderOpenPrice(), NormalizeDouble(OrderOpenPrice()-15*Point,6), OrderTakeProfit(), Red)) 
         Print("Error setting Sell trailing stop: ", GetLastError());
  }


Until an RSI2 divergence shows up…

…or a safety band gets hit, or both. Yellow, uncooked spaghetti.

Speaking of RSI reversal divergences…

deletetxt1("FRACTAL");
     
for(i=1; i<=lookback-25; i++){    
   if (Low[i]<Low[i+1] && Low[i]<Low[i-1] && RSI2[i]<30) {
      j=i+3;
      while (j<i+24){
         if (Low[j]<Low[j+1] && Low[j]<Low[j-1] && RSI2[j]<RSI2[i] && Low[j]>Low[i] && RSI2[j]<12.5) break;
         j++;
      }
      if (Low[j]<Low[j+1] && Low[j]<Low[j-1] && RSI2[j]<RSI2[i] && Low[j]>Low[i] && RSI2[j]<12.5){
         ObjectCreate(0,"FRACTAL"+DoubleToStr(i),OBJ_TREND,indicator_window,Time[j], RSI2[j],Time[i],RSI2[i]);
         ObjectSetInteger(0,"FRACTAL"+DoubleToStr(i),OBJPROP_RAY_RIGHT,false);
         ObjectSet("FRACTAL"+DoubleToStr(i),OBJPROP_COLOR,clrGold);
         ObjectSet("FRACTAL"+DoubleToStr(i),OBJPROP_WIDTH,8); 
         ObjectSet("FRACTAL"+DoubleToStr(i),OBJPROP_BACK,1);
      } 
   }
     if (High[i]>High[i+1] && High[i]>High[i-1] && RSI2[i]>70) {
      j=i+3;
      while (j<i+24){
         if (High[j]>High[j+1] && High[j]>High[j-1] && RSI2[j]>RSI2[i] && High[j]<High[i] && RSI2[j]>87.5) break;
         j++;
      }
      if (High[j]>High[j+1] && High[j]>High[j-1] && RSI2[j]>RSI2[i] && High[j]<High[i] && RSI2[j]>87.5 ){
         ObjectCreate(0,"FRACTALZ"+DoubleToStr(i),OBJ_TREND,indicator_window,Time[j], RSI2[j],Time[i],RSI2[i]);
         ObjectSetInteger(0,"FRACTALZ"+DoubleToStr(i),OBJPROP_RAY_RIGHT,false);
         ObjectSet("FRACTALZ"+DoubleToStr(i),OBJPROP_COLOR,clrGold);
         ObjectSet("FRACTALZ"+DoubleToStr(i),OBJPROP_WIDTH,8); 
         ObjectSet("FRACTALZ"+DoubleToStr(i),OBJPROP_BACK,1);
      } 
   } 
}

Now, let’s talk down the elephante from the cherry-tree.

We are only interested in the reversal divergence if the market is trending.

The very first divergence may not always catch the ultimate reversal, but you should see some green pips, and if stopped out, wait for the next bus to come.
Strip-tease reprise, yes. Safety & shadow lines now around the E-44 at 35 and 45 pips displacements. Pendulum is my middle name.

Now, the usual Hudson Hawk joke: I wish you would lay off the pasta. Spit it out.

What is a spit back? It is an eating disorder.

High[i]>iMA(NULL,0,44,0,MODE_EMA, PRICE_MEDIAN,i) && Low[i]<iMA(NULL,0,44,0,MODE_EMA, PRICE_MEDIAN,i) && 
            High[i+1]>iMA(NULL,0,44,0,MODE_EMA, PRICE_MEDIAN,i+1) && Low[i+1]<iMA(NULL,0,44,0,MODE_EMA, PRICE_MEDIAN,i+1) && 
            High[i+2]>iMA(NULL,0,44,0,MODE_EMA, PRICE_MEDIAN,i+2) && Low[i+2]<iMA(NULL,0,44,0,MODE_EMA, PRICE_MEDIAN,i+2) && 
            High[i+3]>iMA(NULL,0,44,0,MODE_EMA, PRICE_MEDIAN,i+3) && Low[i+3]<iMA(NULL,0,44,0,MODE_EMA, PRICE_MEDIAN,i+3) && 
            High[i+4]>iMA(NULL,0,44,0,MODE_EMA, PRICE_MEDIAN,i+4) && Low[i+4]<iMA(NULL,0,44,0,MODE_EMA, PRICE_MEDIAN,i+4) && 
            High[i+5]>iMA(NULL,0,44,0,MODE_EMA, PRICE_MEDIAN,i+5) && Low[i+5]<iMA(NULL,0,44,0,MODE_EMA, PRICE_MEDIAN,i+5) && 
            !(High[i+6]>iMA(NULL,0,44,0,MODE_EMA, PRICE_MEDIAN,i+6) && Low[i+6]<iMA(NULL,0,44,0,MODE_EMA, PRICE_MEDIAN,i+6))

The E-44 has 3 modes. The normal mode is repulsive. It wants to reject price and chase it as far away as possible.

There are no back to back hourly touches, like the MA isn’t even present. The price starts from one end of the pendulum and makes it all the way to the other, no problem.

The latent mode is a digestion-attempt. If price hangs around too long in its stomach, say 6 hour or more, the E-44 is going to spit back the price.

Price goes from a safety line to the E-44 and never makes it to the other safety line.

The 3rd mode is the snake bite mode, during a trending (embedded) market. The slightest touch may provoke a violent blow.

During trending the price is likely to make closes beyond the shadow line and has periods when it is unable to return into the swing of things.

In closing after all this wasted saliva…

Yes, I’m Short Bread.

Return To Zero

I had this framework in my mind around how to present something better than the oh-so-popular VWAP and so I came up with making some fun of Chew-ee-wap, the hairy, Wet-Ass Wookiee.

I think what I was trying to say is that it wasn’t the future.

It is my personal opinion that everything you will ever need for trading was already said in a pop song from the eighties.

The PSB was certainly onto something with the Two Divided By Zero, but Michael Cretu, the smoking samurai was a step ahead with his “Return to Zero” vocal insert.

So, what is the zero that a return is made to?

A zero can be 2 things. The E-44 or an opposing high / low.

The opposing high / low is a stick-out high low or a doji’s high / low.

Returning to zero is brought on by 2 things.

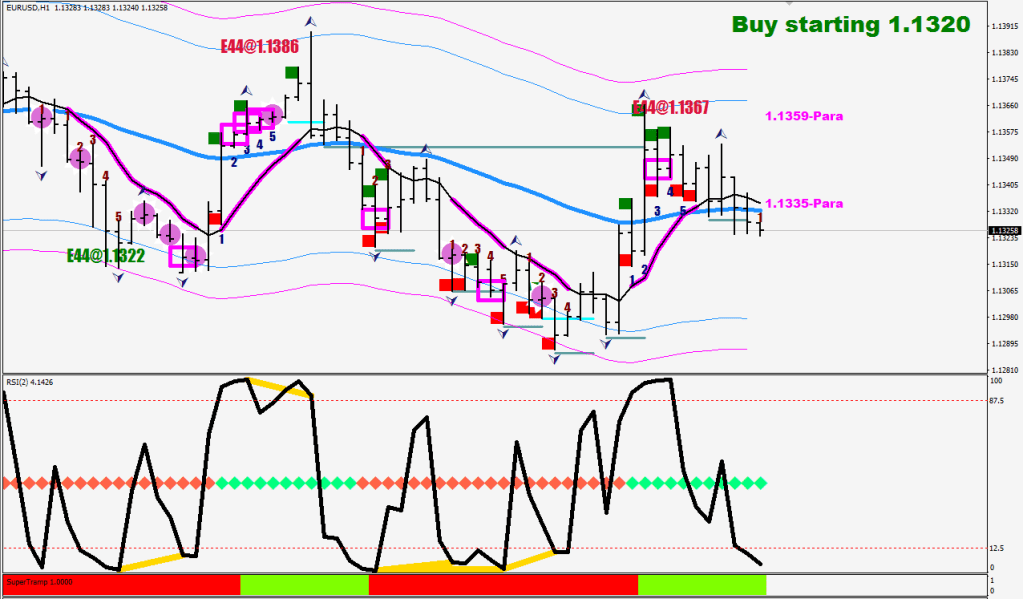
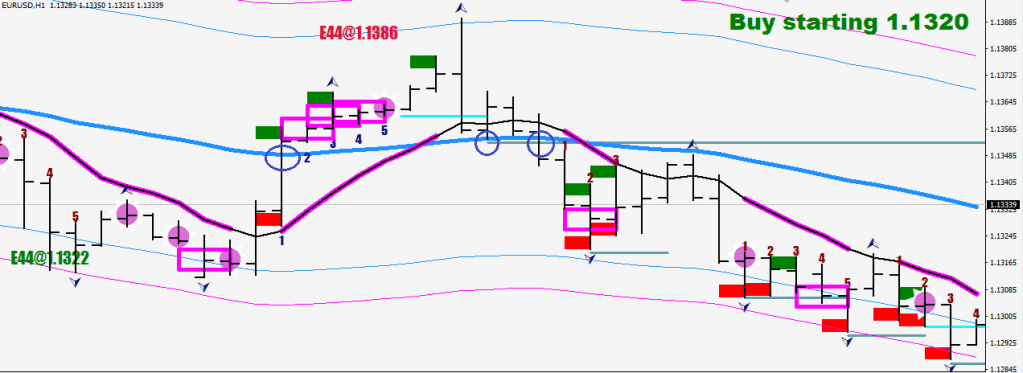
3 hourly closes with neither of them more than 7.5 pips from the other (magenta boxes) or a break of the most recent pressure wick that is in excess of 3.6 pips (red and green squares).

The numbers are the hours of separation counted from the 8EMA on opens.

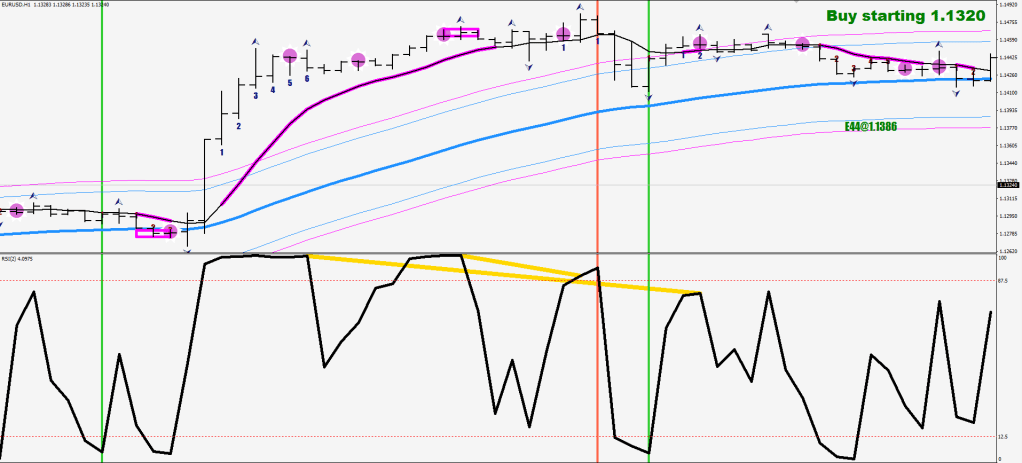
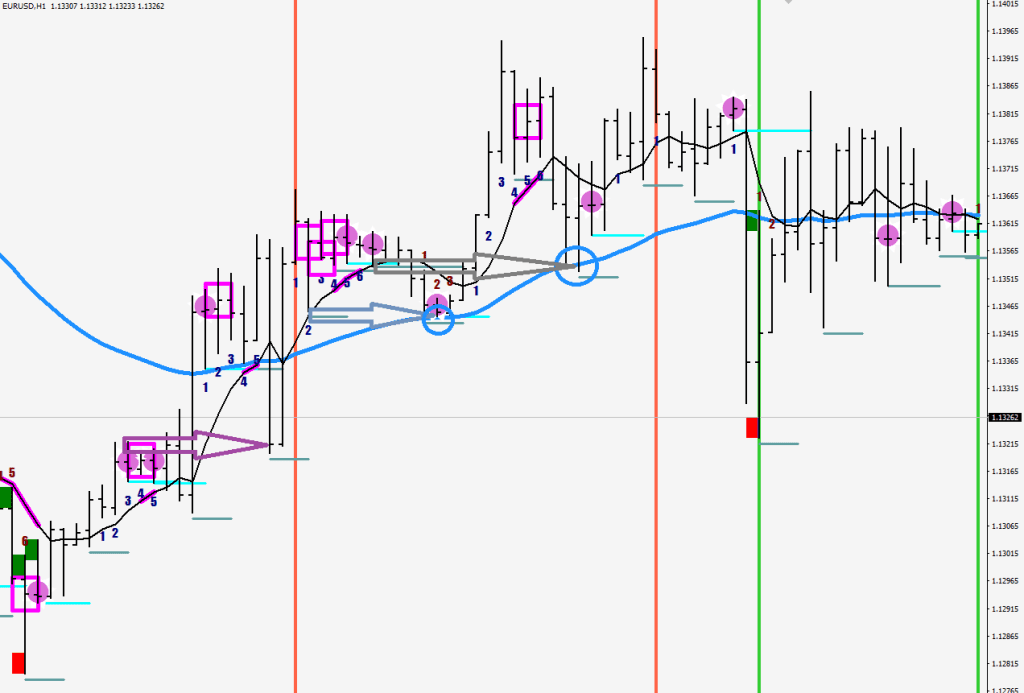
The vertical lines are take-off failures, meaning no follow though on the following candle. If the separation is to the upside and the second candle closes lower than the first, that means that the landing gear could not be pulled in.

The indicator’s name identical to the blog entry’s title.

In a Cool Combination with Doctor Alban the Keltinger Chaos & the 15-min ATR Targets.

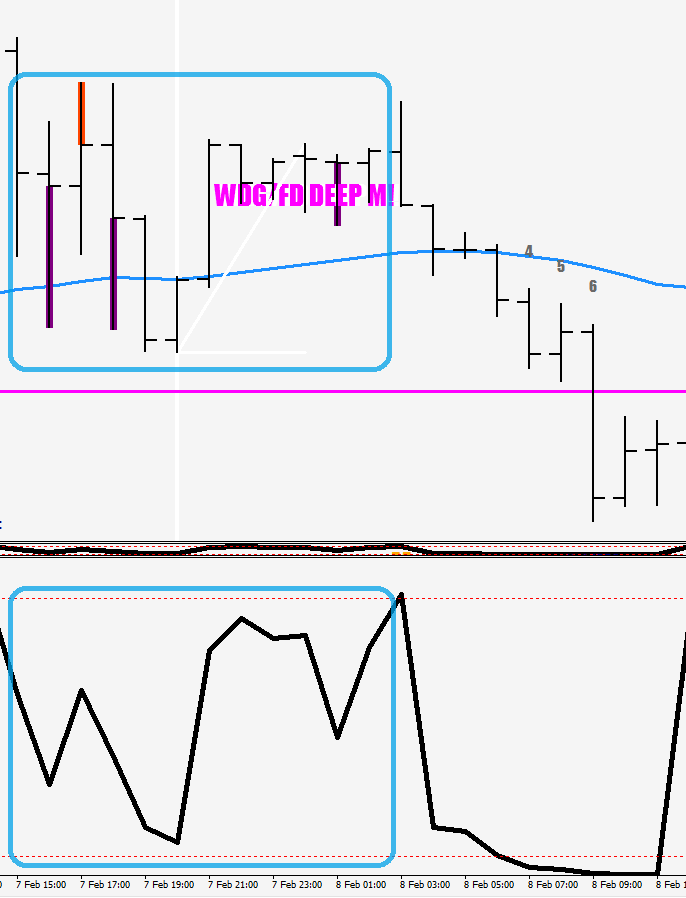
There’s the red deep M I was saying to be an instant fade in the last entry.

LYRICS:
I think it’s about time that I walk away, walk away
So I turn around to walk away but then I look back
Sad lady make me turn and walk away again

Even though it looks like it’s the future
It’s really a long, long, time ago
When there were knights
And they got into fights
Using sabers of light
Please remember
Even though some things look so familiar
They’re not really on Earth
Yeah, it’s a galaxy far, far away
Alien DNA walking ‘round every day
And no one notices

Well, I messed up
Yeah, I made a mistake
I can’t sleep
Have to find your place soon
My tailor’s awesome
All the people looking
Rolling like I’m platinum
You know I’ve gone a long way to
change my mind about us since I seen you
But I’m talking at my robot as you mill about the city
And I’m on my way
Girl, there’s something that you need to know

Even though it looks like it’s the future
It’s really a long, long, time ago
When there were knights
And they got into fights
Using sabers of light
Just remember
Even though some things look so familiar
They’re not really on Earth
Yeah, it’s a galaxy far, far away
Alien DNA walking ‘round every day
And no one notices

Ahhhh, space station blown away
(It’s not the future)
Ahhhh, floating in the diaper tank
(It’s not the future)
Ahhhh, space leprechaun fade away
(It’s not the future)
Ahhhh, cyborg with no big boy words to say
(It’s not the future)

Get turnt
Get real turnt
Get turnt
Get, get real turnt

Well I’m a jaywalker
Got a lot of fresh damage, oh no
I can’t always be around to
Explore foreign love
Overflowing for your love
At night I’m sure that when we argue
makes me dream about those demon fishies
It’s not the way that it’s meant to be and
I bless your outfit
Mmmm, that’s a good choice
What is he saying? I don’t understand
Listen girl
I hope the heartbreak leaves me on the weekend

Even though it looks like it’s the future
It’s really a long, long, time ago
When there were knights
And they got into fights
Using sabers of light
Just remember
Even though some things look so familiar
They’re not really on Earth
Yeah, it’s a galaxy far, far away
Alien DNA walking ‘round every day

It’s a place where
Little furry creatures dance but they’re not teddy bears
They’re an alien equivalent
And they may rage in familiar trees
But it’s not the Redwoods you see
Alien trees on an alien moon, oh-oh
It’s something else indeed
Alien trees on an alien moon, oh-oh
Time to break it down
Break it down, down, down, down

Yeah, I was big in Japan
I was king of Ping Pong
Yeah I was bad at tuba
And I’m sure you’d like me to bounce
Master, I need one of these
Do they come in threes?
‘cause I need to squeeze them
Yeahhh
Yeah, I was big in Japan
I was king of Ping Pong
Yeah I was bad at tuba
And I’m sure you’d like me to bounce

Sometimes that moment when you wish you could run and hide
Is when you find you need a new hyperdrive
We all sometimes wish we could get away
And if you try
Then you gotta just make sure if you hide in a cave that it’s
Really not some giant space snake

Even though it looks like it’s the future
It’s really a long, long, time ago
When there were knights
And they got into fights
Using sabers of light
Just remember
Even though some things look so familiar
They’re not really on Earth
Yeah, it’s a galaxy far, far away
Alien DNA walking ‘round every day
And no one notices

Even though it looks like it’s the future
It’s really a long, long, time ago
When there were knights
And they got into fights
Using sabers of light
Just remember
Even though some things look so familiar
They’re not really on Earth
Yeah, it’s a galaxy far, far away
Alien DNA walking ‘round every day
And no one notices

Get turnt
Get real turnt
Get turnout
Get, get real turnt
It’s not the future
Get turnt
Get real turnt
Get turnt
Get, get real turnt
It’s not the future

Don’t Cry (The Breakup of the World)

Sandra

people crowd together
why don’t you take it
wait a little longer
an’ see how they make it

twinin’ with time
why can’t you see me
risk of eclipse
if you can’t forgive me
return to zero

the breakup of the world
don’t cry
we’re gonna save our lives
an’ time is on my side
don’t cry
i’m gonna realize
the breakup of the world
baby please don’t cry
we can forgive
we’re gonna try
baby please don’t cry
i wanna live
i fear the breakup of the world

world is torn an’ tattered
why can’t you take it
hope a little longer
an’ see how we’ll make it

swallow your pride
why can’t you see me
risk of eclipse
if you can’t forgive me
return to zero

the breakup of the world
don’t cry
we’re gonna save our lives
an’ time is on my side
don’t cry
i’m gonna realize
the breakup of the world
baby please don’t cry
we can forgive
we’re gonna try
i wanna live
i fear the breakup of the world

Zero / Delerium


It’s your touch
Against the whiteout
Blind as a blizzard
I have been
Take me to zero
I, I, I’m a traitor
For your love
Cold as the ice-flow
I, I, I’m a failure
For your trust
Keeping me hollow
Take me to zero
It’s enough to sink
A lighthouse
It’s an masterminding sea
Your wave over-turns me
I, I, I’m a traitor
For your love
Cold as the ice-flow
I, I, I’m a failure
For your trust
Leaving me hollow
Take me to zero
I’m a traitor for your love
Cold as the ice-flow
I, I, I’m a failure
For your trust
Leaving me hollow
Take me to zero
And I never wanted to
Survive that wave
I never wanted
I never wanted
To be saved
And I never wanted to
Survive that we I never
Wanted to be saved
No, take me to zero
I, I, I’m a failure for your
Trust Leaving me hollow
Oh, Oh, take me to zero
I never wanted

Bi-Fi Roll

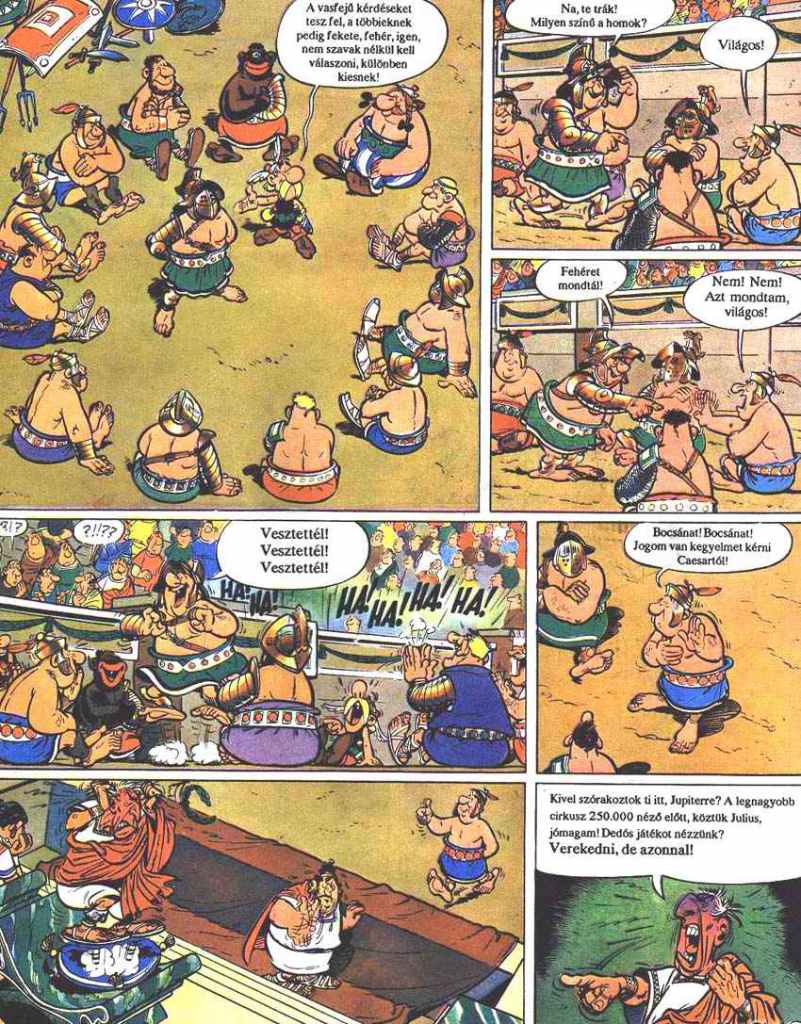
There is a scene in the Asterix the Gladiator, where they invent a new, less bloody game.

The rules are simple, you are not allowed to say black, white, yes and no. If you do, you lose.

My intention with this blog entry to call attention on a self-imposed imprisonment that comes with drawing too many trendlines.

See the world is not black and white, it isn’t left or right and trading isn’t merely buying or selling.

When people draw a correction, this is what they always seem to do uniformly.

There are a lot of problems with this, even if you are conscious of the possibility that wave C does not always make a high beyond Wave A.

Here’s the recent ABC up.

Not only that the end of A did not coincide with the swing high, B, that was “supposed to be” a counter move, went completely sideways, it took out the high made by A, it ended more than half way up of its range, with way higher than the low that it made in the first hour. Some down wave that was.

Wave C made a high, Wave c of Wave C failed that high as well, but Wave C did not end until volatility wore off. Thus the end point and the furthest point did not coincide again.

As shown by the Market Stifle indicator.

If you want to count this wave structure up as 5 waves, be my guest.

So yeah, just about everything you think you know of waves is wrong, and I hope you are starting to get the picture that putting trendlines in the way of a corrective wave structure will get you nothing. They will walk back and forth through them like they never existed in the first place.

Does Smart Money understand, that sudden-found volatility will reverse on itself?

Smart money activity is always cyan. Check the doji resolution above. They may have dumped some higher, but in volume only when volatility choked.

Does Smart Money understand that they command the new market direction after volatility dries up and act right after a hourly doji?

Is their favorite song called: Move Any Market?

Could it be that Smart Money is a bunch of opportunistic dudes of similar thinking?

Could it be that Smart Money is reading my blog?

Believing that the market can do anything at any given moment is absolutely the wrong approach.

The market can do a limited number of things and everything is the function of the underlying volatility.

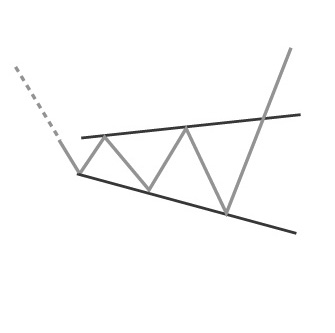
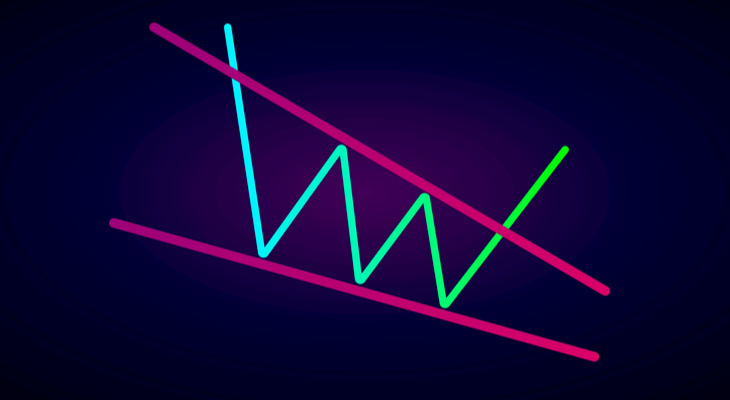
Alright, here’s another one for you. How does a wedge look like?

Like this?

What if I told you that this below was a wedge.

And this.

The price movement does not have to resemble a wedge shape. You know, I hold your chin, you hold my chin, whoever smiles first is gonna get slapped..

A wedge is a period (10 hours plus would take my attention) lacking relative strength extremes, so the first extreme showing up is an instant fade. See there you go again with that narrowed in straight-line-jacket thinking.

Good thing I was here for you to pump you up with lithium.

if ((RSI2[i+11]>88.7 || RSI2[i+11]<9.5) && RSI2[ArrayMaximum(RSI2,10,i)]<88.7 && RSI2[ArrayMinimum(RSI2,10,i)]>9.5 && 
    !((RSI2[i+12]>88.7 || RSI2[i+12]<9.5) && RSI2[ArrayMaximum(RSI2,10,i+1)]<88.7 && RSI2[ArrayMinimum(RSI2,10,i+1)]>9.5)
    )

Neverending Embedding #2

I haven’t made any adjustments to the weekly settings for a while.

Just as I could define the bear and bull market switch off on the daily chart as “3 constructive closes above / below God”, on the Weekly I have the E-55 HL2 as the line in the sand, and what I was missing is this being uniform. Now, the smileys (Market Mode) are prompted by well defined lines (E-59 is a factor as well). No more dual standards.

Weekly E-34 is the equivalent of the E-44 on daily and below.
      ////3 closes above E-55
              if (Close[i]>iMA(symbol,0,55,0,MODE_EMA, PRICE_MEDIAN,i) && Close[i+1]>iMA(symbol,0,55,0,MODE_EMA, PRICE_MEDIAN,i+1) && Close[i+2]>iMA(symbol,0,55,0,MODE_EMA, PRICE_MEDIAN,i+2) && Low[i+3]<iMA(symbol,0,59,0,MODE_EMA, PRICE_MEDIAN,i+3)  && Close[i+4]<iMA(symbol,0,59,0,MODE_EMA, PRICE_HIGH,i+4)  ){
         ObjectCreate("TitusTFxx"+DoubleToStr(i), OBJ_TEXT, 0, Time[i+1], Close[i+1]+270*Point); 
            ObjectSetText("TitusTFxx"+DoubleToStr(i), CharToStr(74), 39, "Wingdings", clrDarkGreen);
            }  
      
      
            ////3 closes below E-55
              if (Close[i]<iMA(symbol,0,55,0,MODE_EMA, PRICE_MEDIAN,i) && Close[i+1]<iMA(symbol,0,55,0,MODE_EMA, PRICE_MEDIAN,i+1) && Close[i+2]<iMA(symbol,0,55,0,MODE_EMA, PRICE_MEDIAN,i+2) && High[i+3]>iMA(symbol,0,55,0,MODE_EMA, PRICE_MEDIAN,i+3)   && Close[i+4]>iMA(symbol,0,59,0,MODE_EMA, PRICE_MEDIAN,i+4)    ){
         ObjectCreate("TitusTFxx"+DoubleToStr(i), OBJ_TEXT, 0, Time[i+1], Close[i+1]+290*Point); 
            ObjectSetText("TitusTFxx"+DoubleToStr(i), CharToStr(74), 39, "Wingdings", clrFireBrick);

The Oscillator got some adjustments as well as the losing embedding limits.

In the end my true self won out. Screw everyone who are plotting oscillators and moving averages on closing prices.

///embedding definitions

if (iStochastic(symbol,10080,18,3,3,MODE_SMA,1,MODE_SIGNAL,i+2)<22 && iStochastic(symbol,10080,18,3,3,MODE_SMA,1,MODE_SIGNAL,i+1)<22 && iStochastic(symbol,10080,18,3,3,MODE_SMA,1,MODE_SIGNAL,i)<22 ){
 
                     ObjectCreate("Fracabbb"+IntegerToString(i), OBJ_RECTANGLE, 1,  Time[i+1], 24, Time[i], 0);
                     ObjectSetInteger(0,"Fracabbb"+IntegerToString(i),OBJPROP_COLOR,clrSalmon);
                     ObjectSet("Fracabbb"+IntegerToString(i),OBJPROP_BACK,1);
                     ObjectSet("Fracabbb"+IntegerToString(i),OBJPROP_WIDTH,5);   
                     embedded[i]=true;
}

if (iStochastic(symbol,10080,18,3,3,MODE_SMA,1,MODE_SIGNAL,i+2)>78 && iStochastic(symbol,10080,18,3,3,MODE_SMA,1,MODE_SIGNAL,i+1)>78 && iStochastic(symbol,10080,18,3,3,MODE_SMA,1,MODE_SIGNAL,i)>78){
                      ObjectCreate("Fracabbbb"+IntegerToString(i), OBJ_RECTANGLE, 1,  Time[i+1], 76, Time[i], 100);
                     ObjectSetInteger(0,"Fracabbbb"+IntegerToString(i),OBJPROP_COLOR,clrChartreuse);
                     ObjectSet("Fracabbbb"+IntegerToString(i),OBJPROP_BACK,1);
                     ObjectSet("Fracabbbb"+IntegerToString(i),OBJPROP_WIDTH,5);   
                     embedded[i]=true;
}

    if (iStochastic(symbol,0,18,3,3,MODE_SMA,1,MODE_MAIN,i+1)>72 && iStochastic(symbol,0,18,3,3     if (iStochastic(symbol,0,18,3,3,MODE_SMA,1,MODE_SIGNAL,i+1)>80 && iStochastic(symbol,0,18,3,3,MODE_SMA,1,MODE_SIGNAL,i)<80){
       ObjectCreate("Claim"+DoubleToStr(i), OBJ_TEXT, 1, Time[i], 84); 
                      ObjectSetText("Claim"+DoubleToStr(i), "!", 48, "Impact", clrCrimson);
                      ObjectSet("Claim"+DoubleToStr(i), OBJPROP_BACK,0);
                      ObjectCreate("Claims"+DoubleToStr(i), OBJ_TEXT, 1, Time[i], 80); 
                      ObjectSetText("Claims"+DoubleToStr(i), "!", 42, "Impact", clrYellow);
                      ObjectSet("Claims"+DoubleToStr(i), OBJPROP_BACK,0);
                       }
   if (iStochastic(symbol,0,18,3,3,MODE_SMA,1,MODE_SIGNAL,i+1)<20 && iStochastic(symbol,0,18,3,3,MODE_SMA,1,MODE_SIGNAL,i)>20){
       ObjectCreate("Claim"+DoubleToStr(i), OBJ_TEXT, 1, Time[i], 44); 
                      ObjectSetText("Claim"+DoubleToStr(i), "!", 48, "Impact", clrGreen);
                      ObjectSet("Claim"+DoubleToStr(i), OBJPROP_BACK,0);
                      ObjectCreate("Claims"+DoubleToStr(i), OBJ_TEXT, 1, Time[i], 40); 
                      ObjectSetText("Claims"+DoubleToStr(i), "!", 42, "Impact", clrYellow);
                      ObjectSet("Claims"+DoubleToStr(i), OBJPROP_BACK,0);
                       }

Just as using Median prices, using Stochastic D over the K remains my signature.

Now, the hands. There has not been a manual for them yet.

The “PUSH” in a direction is either the ending point or the following week the turn will complete – unless there is an embedding in the push’s direction.

What is important about the push is the close. When not embedded, anything beyond that particular close is a good entry for a fade, but 36 pips beyond are certainly not likely to occur.

When embedded, catching the falling knife goes like this: you take the furthest point made by the push (not the closing price), you place a 1/2 size fade at 30 pips out, a 1/2 size fade at 40 pips out, close all of your directional holdings 50 pips out and reverse / hedge 70 pips out. Rinse and repeat.

The first exclamation mark was a warning that the embedding got close to being lost. The second lived to see the wolf show up.

You can see that the embedding was lost on the next push up, so the push down fell under the “not embedded push” scrutiny.

Last modification was to incorporate the 14-sample Window Envelopes, for the histogram plots would always get priority and cover them out otherwise. From now on they are Bollinger Blue.

  env_u[i]=iEnvelopes(symbol,0,14,0,0,0,2,MODE_UPPER,i);
   env_d[i]=iEnvelopes(symbol,0,14,0,0,0,2,MODE_LOWER,i);  

Re-vitalizing the comfort levels helps you to understand that this dip into the oversold (blue marker) is a back test of the oversold and the time spent down there would likely be limited both in time and in distance. A right shoulder matching the left shoulders depth would be at 1.1182 or so, but there is no sacred script stating where the down move would have to be bought.

God Day 1

The 1st rule of God Day is that we don’t speak of God Day.

The second rule of God Day is that you don’t fade normally it.

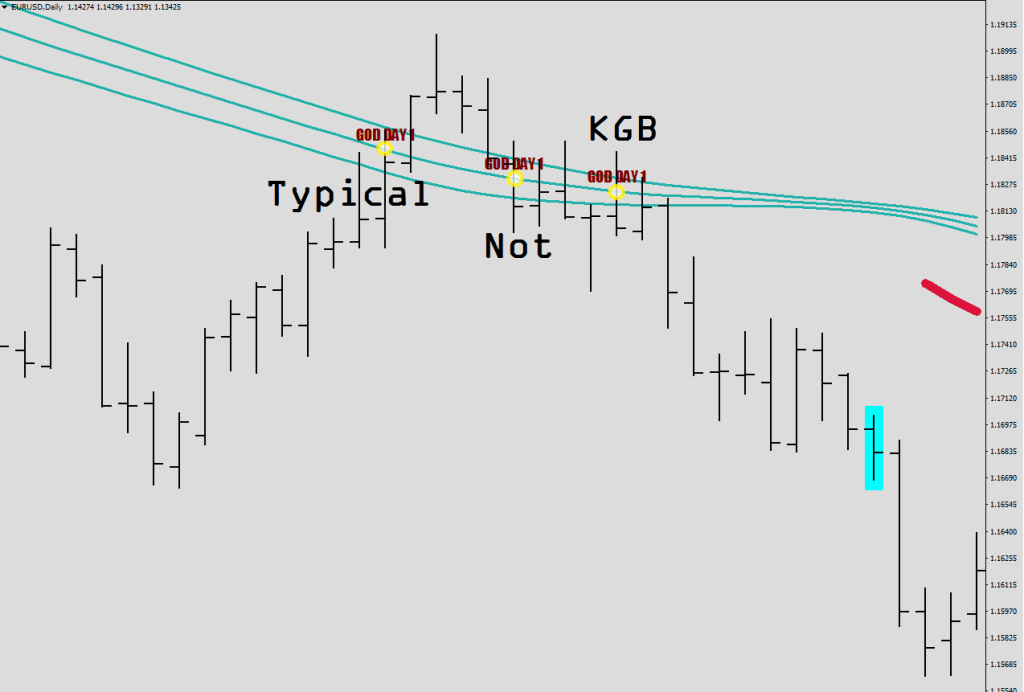
Image 1 shows a Typical encounter with God, a non-typical and a KissGoodBye

The Typical encounter starts with Murena Williams ultimately dropping the ball at the fence, leaving God defenseless.

Concentrate on the fish-eye optic here. God’s weapon of choice is words, he tries to talk you out of crossing to the other side. His odds of succeeding are slim to none.

What I’m trying to call attention to here is that fading a Typical God Day 1 may have a risk of no return, and even a 280-pip one way ticket that would likely blow up your account, if not in the coming days, then perhaps 1,100 pips later. The Typical encounter should not be faded until 2 more days later.

I know, this is Friday, right before the close, and the downside crosses – apart from the one above are usually Non-typical ones. So, there shall be a KGB. Just remember to Save A Prayer for the Morning After.

The Not Typical-God Encounter is when for some strange, uncertain reason you meet Boy George who is waving you back in for a quick chill-out. The KGB core to the swing low distance statistically would fall between 240-280 pips away.

God = Daily 20 SMA of 44 EMA HL2

In conclusion the Not Typical encounter Typically comes with a drop-away on day 1 or day 2 and a KGB on day 3.

Why Go?

Faithless

Don’t go
I didn’t know you’d be here
and I wasn’t meant to come
I’d be sitting watching TV
If there was anything decent on

If I’d missed the taxi
Or found nothing good to wear
But for some uncertain reason
Some strange uncertain reason
This is how it all
It all began

Why go?
Why go?
When you could stay a while

If I made some coffee
Would you sit and talk some more?
I know words are usually pointless
When you’ve used them all before

The way you smile fills the room
Stay a while kick off your shoes
Don’t go
Please stay
It always happens this way

Why go?
Why go?
When you could stay a while

The way you smile fills the room
Stay a while
What’s there to lose?
Thea way you laugh
When I say
Don’t go
Please stay

Why go?
Why go?
When you could stay a while


The Same Deep Water as You

The Cure

Kiss me goodbye
Pushing out before I sleep
Can’t you see I try?
Swimming the same deep water as you is hard

The shallow drowned lose less than we
The strangest twist upon your lips
And we shall be together

Kiss me goodbye bow your head and join with me
And face pushed deep, reflections meet
The strangest twist upon your lips
And disappear, the ripples clear

And laughing break against your feet
And laughing break the mirror sweet
So we shall be together

So we shall be together

Kiss me goodbye
Pushing out before I sleep
It’s lower now, and slower now
The strangest twist upon your lips

But I don’t see, and I don’t feel
But tightly hold up silently
My hands before my fading eyes
And in my eyes your smile

The very last thing before I go

I will kiss you, I will kiss you
I will kiss you forever on nights like this
I will kiss you, I will kiss you
And we shall be together


Typical & Typical

Typical & Not Typical

Not Typical & Volatility Squeeze (sideways) – last one is a KGB

Not Typical

Hard to be consistent these days…

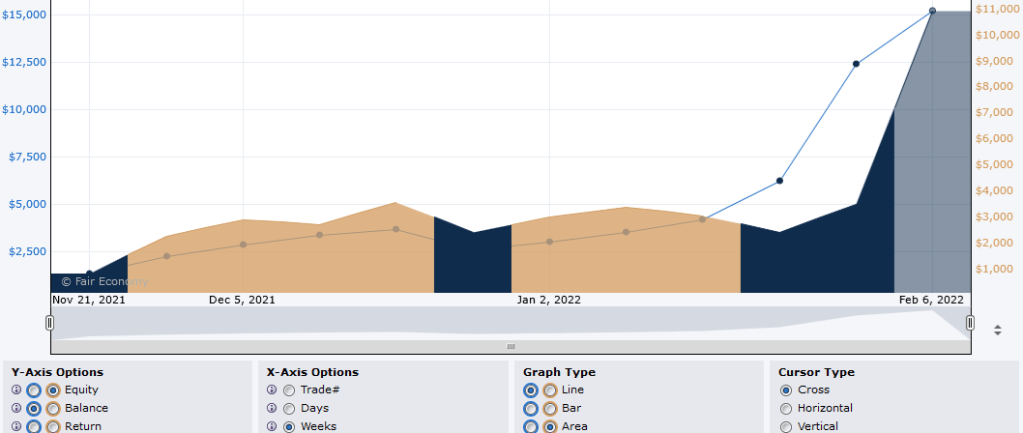
11 weeks, 2,087% gains on equity ( $10,933-$500 base = $10,433 => divided by $500 = 20.866 ).

Parabolic reversal play

Examples of Cover low being violated the next day with no close back beyond 27 pips from the low:

Day 1: violation of C by 20 pips and close back up by 5 pips

Day 2: reflex move back up, 44 pips from the recent low

Day 3: kicking in at the low of the C, for a total swing length of 90 pips – new low remains untouched for 46 trading days.

Likelihood is very low: this occurred in a far, far away galaxy from God.

Day 1: violation of C by 28 pips and close back by 6 pips

Day 2: total annihilation starting

Day 3: low found at 124 pips from the swing high made after taking out C, low is still holding

Likelihood is very low: this occurred in a far, far away galaxy from God.

Example of above God violated at God.

Day 1: violation of C by 41 pips and close back by 20 pips

Day 2: drop starts, total sell off is 106 pips in a jerky manner, low held for 25 days

Likelihood is very low: this occurred with the bands trending higher, turning to a flat phase.

The following examples are not comparable:

This one resembles a little bit with the bands dropping & wrapping, but the speed was different. The low held for 11 days only.
Montage.

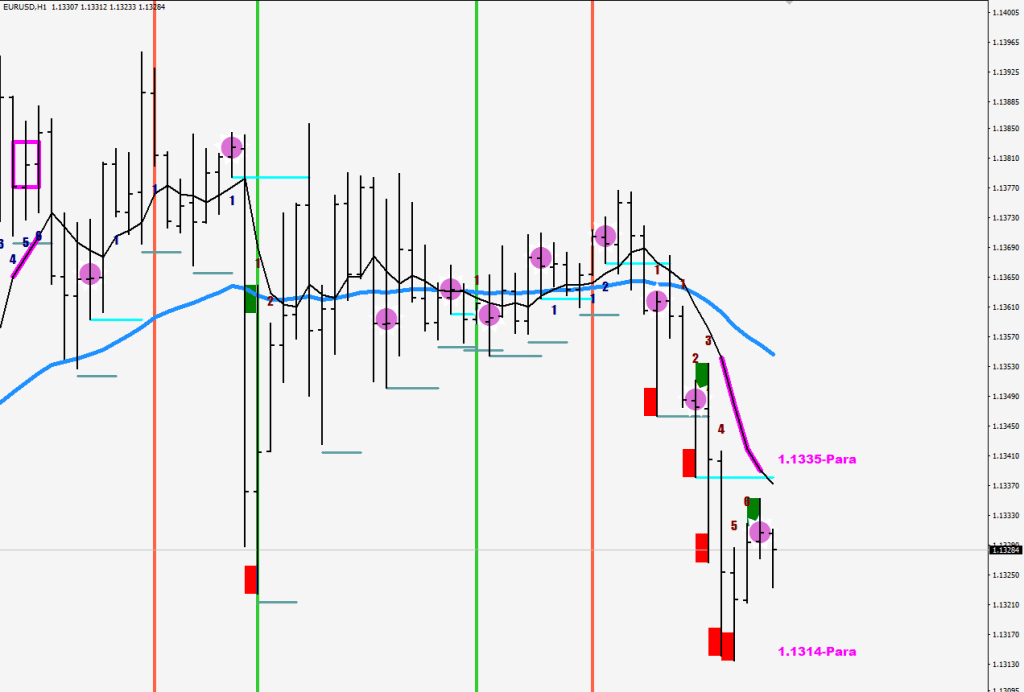
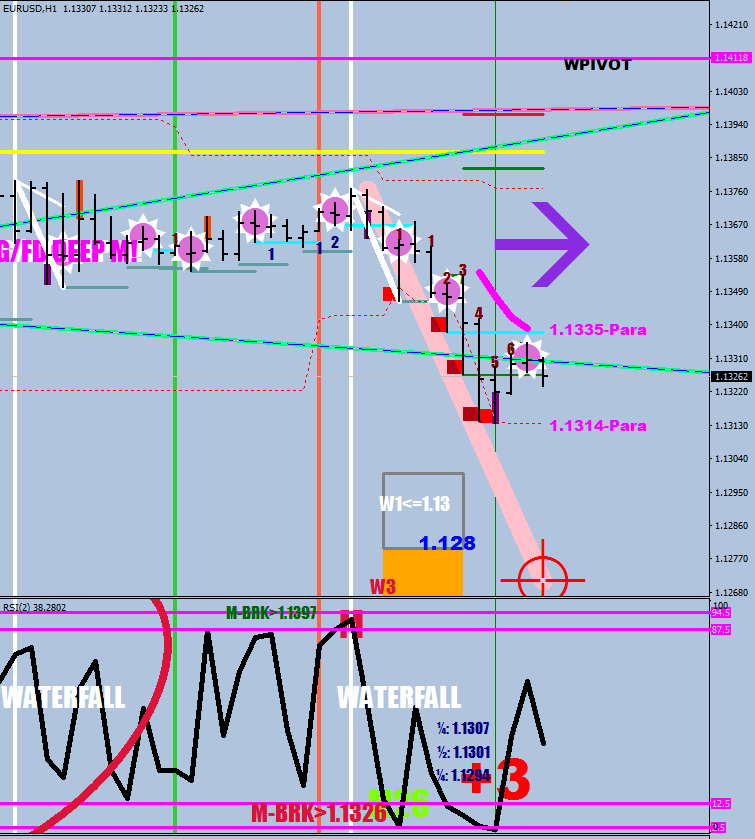
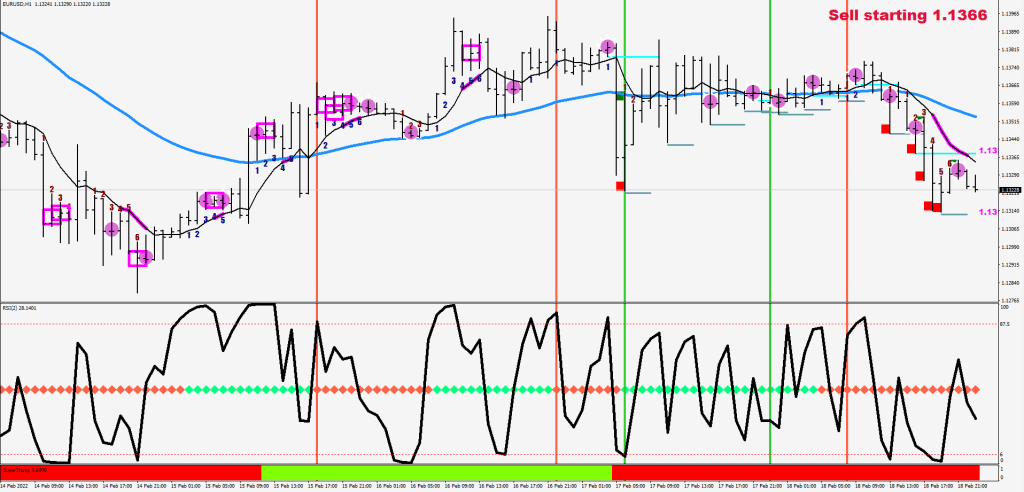
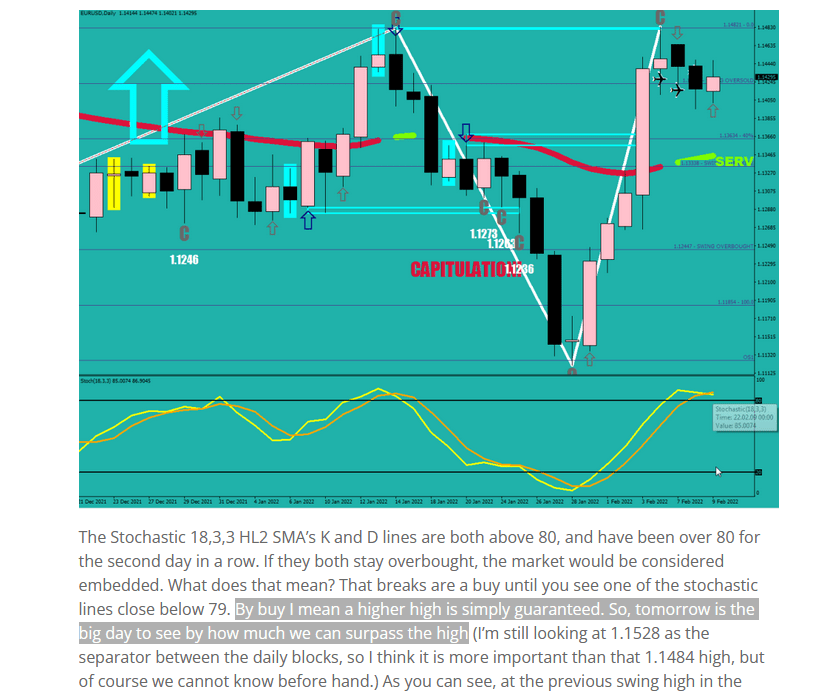
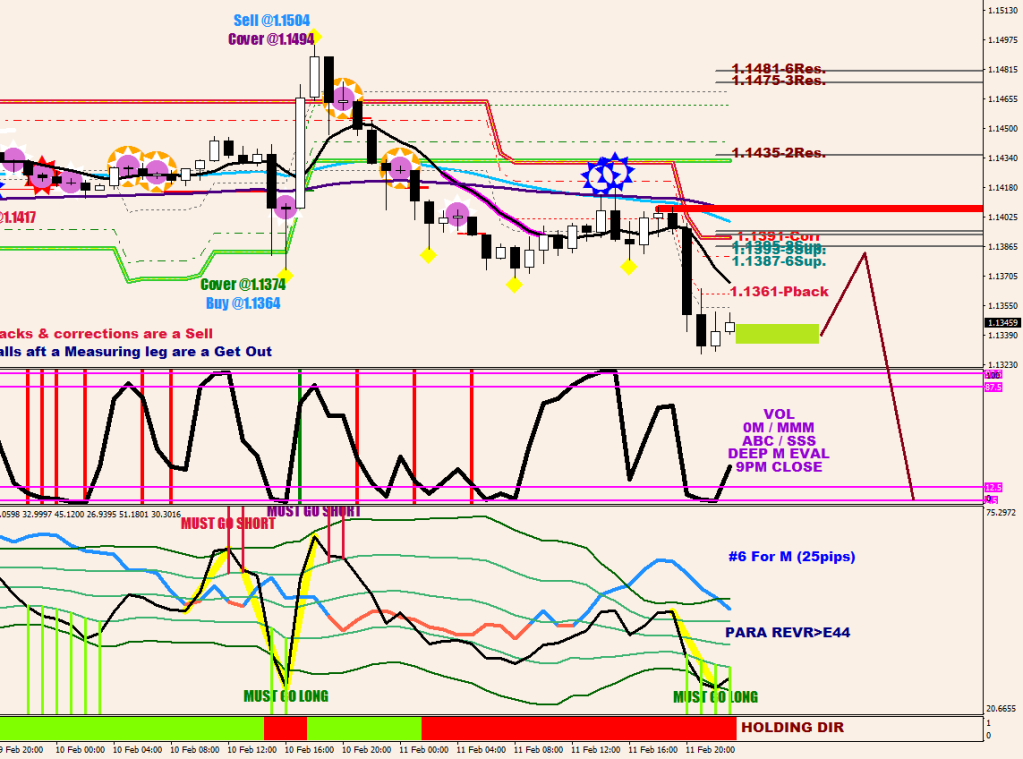
Plan: buy for a move back to 1.1380+ before a drop to 1.1280