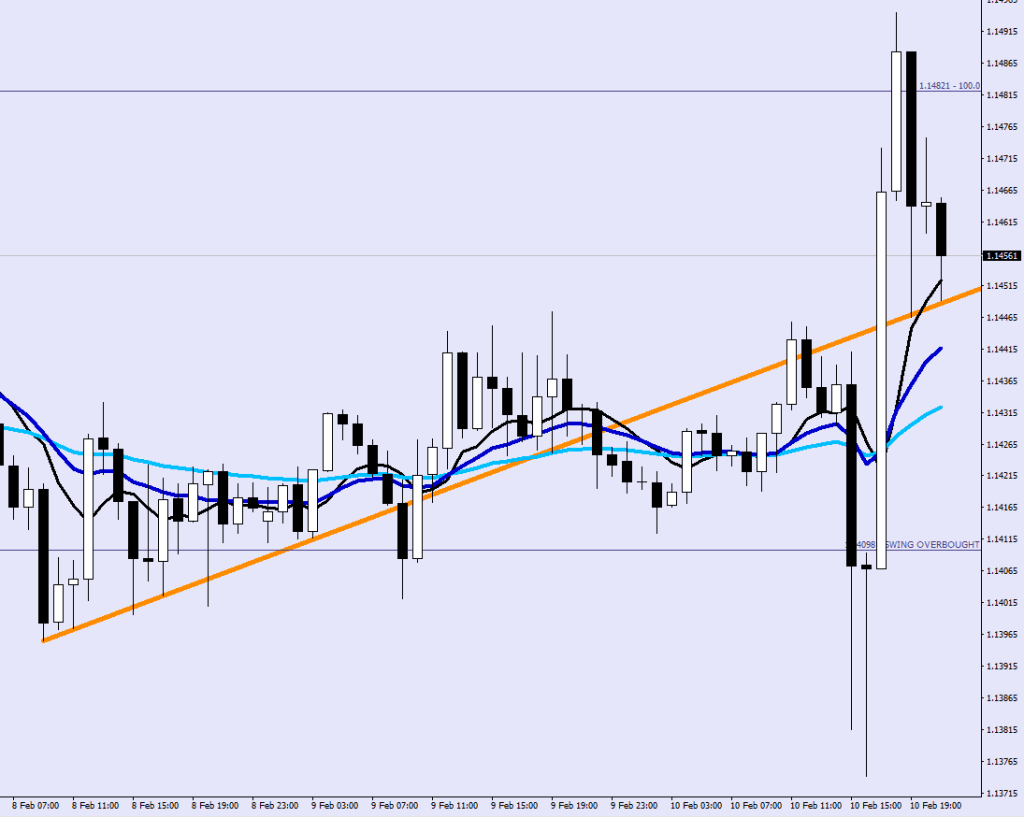
There was a rising wedge up with E89 providing the lower border.
The Drive (“0”) was ultimately followed by a Thrust. It went 72 pips below the 5-sample high which would mean a deep correction (for exceeding 62 pips) if the market was going up. But it wasn’t. It was putting in the finish for the Wave 4 down.
What about Wave 5 then? Is it over? Can’t say for certain, but there is more time left. If this closes back below the high of Wave 3 (currently below by 10 pips), then in terms of the purpose of making a beat beyond the high was met (10 pips here as well).
I think there should be a hourly doji printed sometime later tonight and there may be a reach for the high again afterwards, but that may be lackluster.
There are a number of problems here.
Today’s outside day is not an outside reversal up, since yesterday was a green candle. The rise in volatility at the same time hints a reversal transpiring.
The doji on the upside held this run up.
Today’s sell off did not manage to prevent the Stochastic embedding. In fact, I was looking at them at the lows and never saw a print below 79.50 (K line).
The other problem with the reversal up is that the SuperTramp got reset by the violent up and down moves.
SuperTramp counted 3 down, now it has to restart the counting for the upside.
The Volume sequence starts with a strong selling, then professional buying, then an autction getting cut short by no more bets.
The most interesting clue about future prospects here is the God awful closeness of the Green River. The quick dip at the end of the Wave 4 was an actual mean reversion. The way I see this closeness is that another outside day tomorrow would price back below the mean.
I think the increased volatility is Dollar Bullish. I have no longs.
That’s how my daughter used to call the Blue’s Clues.
You probably don’t realize how bullish this setup is about to become:
But let’s make a step back first.
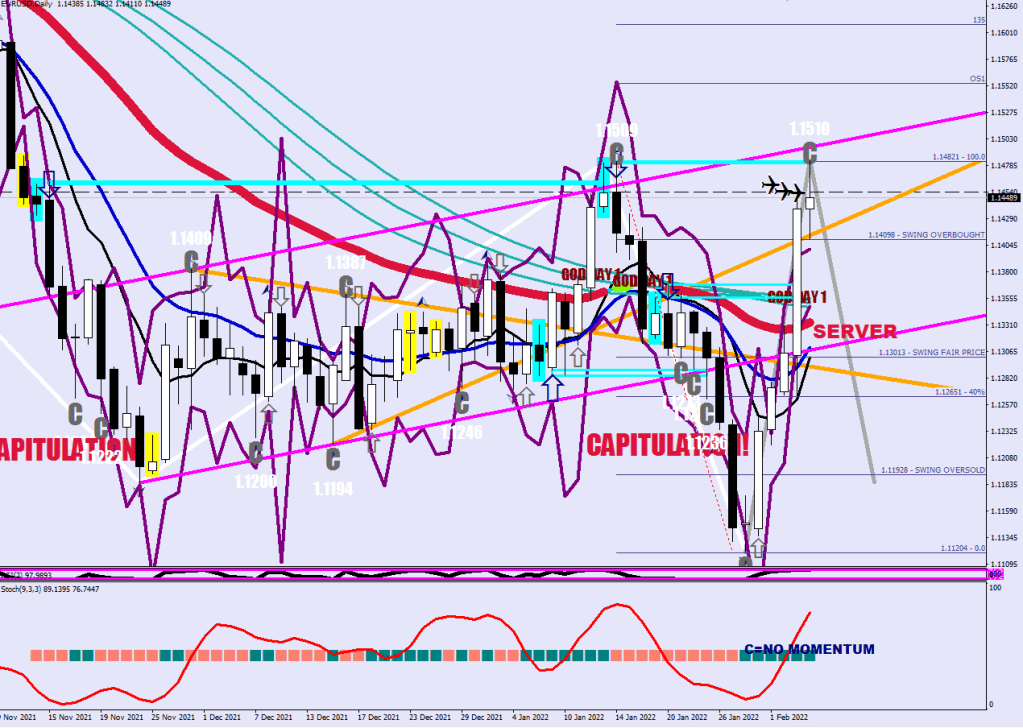
The bull flag becomes quite obvious on the daily chart.
The Stochastic 18,3,3 HL2 SMA’s K and D lines are both above 80, and have been over 80 for the second day in a row. If they both stay overbought, the market would be considered embedded. What does that mean? That breaks are a buy until you see one of the stochastic lines close below 79. By buy I mean a higher high is simply guaranteed. So, tomorrow is the big day to see by how much we can surpass the high (I’m still looking at 1.1528 as the separator between the daily blocks, so I think it is more important than that 1.1484 high, but of course we cannot know before hand.) As you can see, at the previous swing high in the middle of January embedding did not occur, for there was no 3rd day when both the K and the D lines were above 80. There is a good distance to the top, 60 pips from here sounds like a very good deal.
Now, back to the first image. First thing to notice is the purple line, which is the E89 HL2. Who is conscious of this MA? Smart money, professional traders.
Second thing to notice is the absence of lower lows. They are forcing everyone to chase this move up. No discounts would be given.
As good old Dutch used to say, when you have higher lows, the highs will take care of themselves.
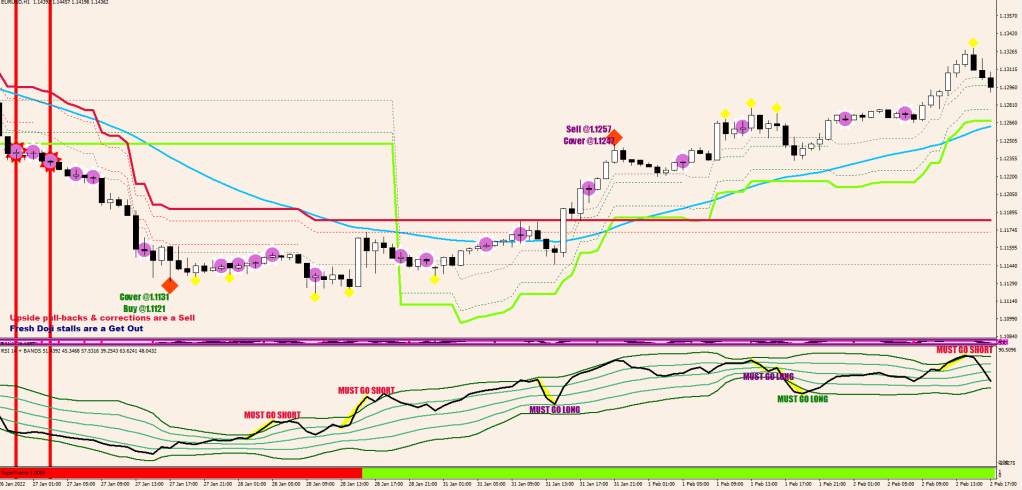
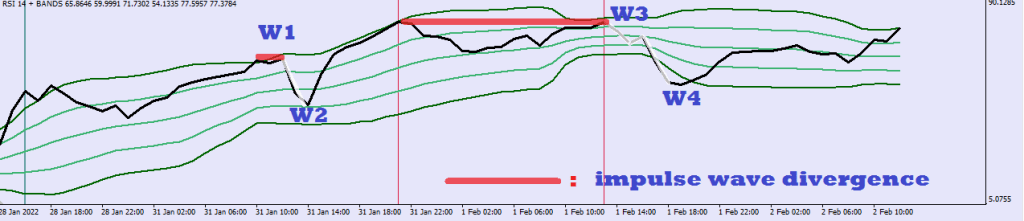
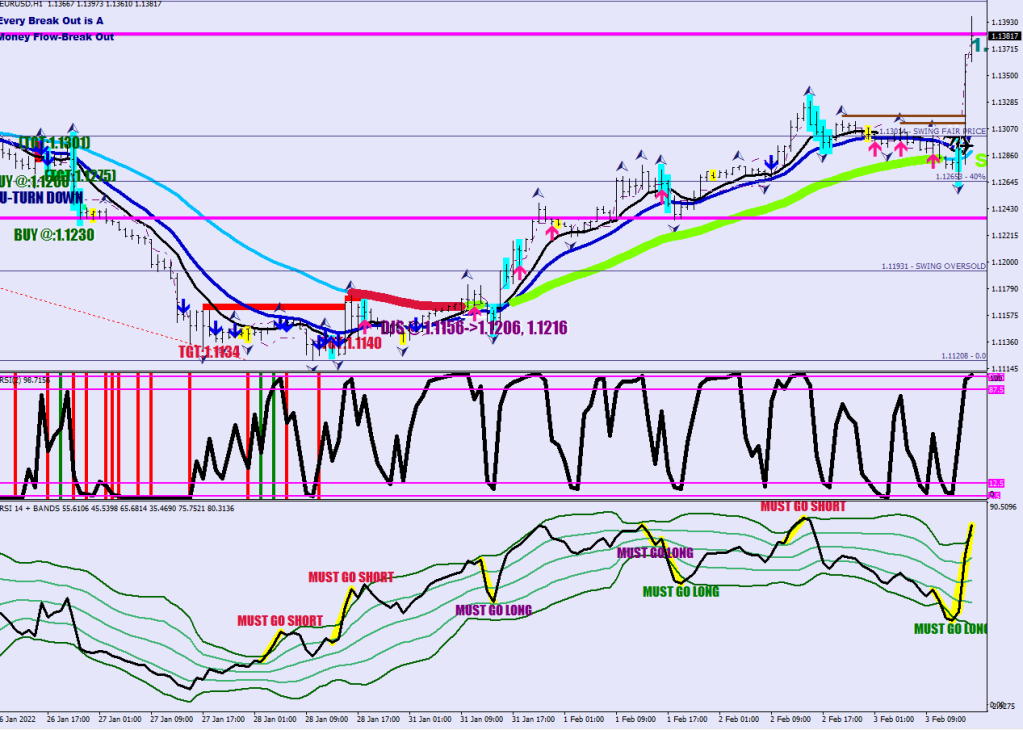
Now, the next thing on the bottom indicator (the RSI with the deviation bands) has now a new line on it. I use the 20 SMA of the RSI14 for splitting the Money Flow. I ran a 5 sample average on the 14-sample MFI for an early bird special. As you can see below, this changes before the SuperTramp does.
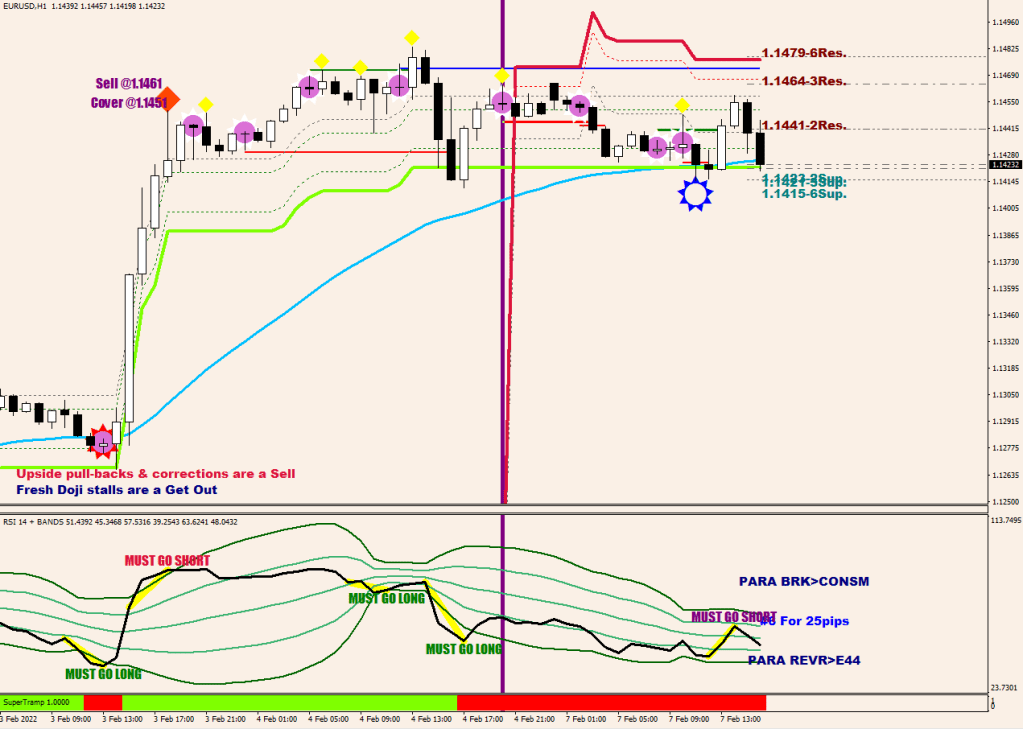
I grayed out the MUSTs where the distance from the E-44 exceeds 100 pips.
SuperTramp is on the slow side, and you need 5 of the new color for the transformation to take place.
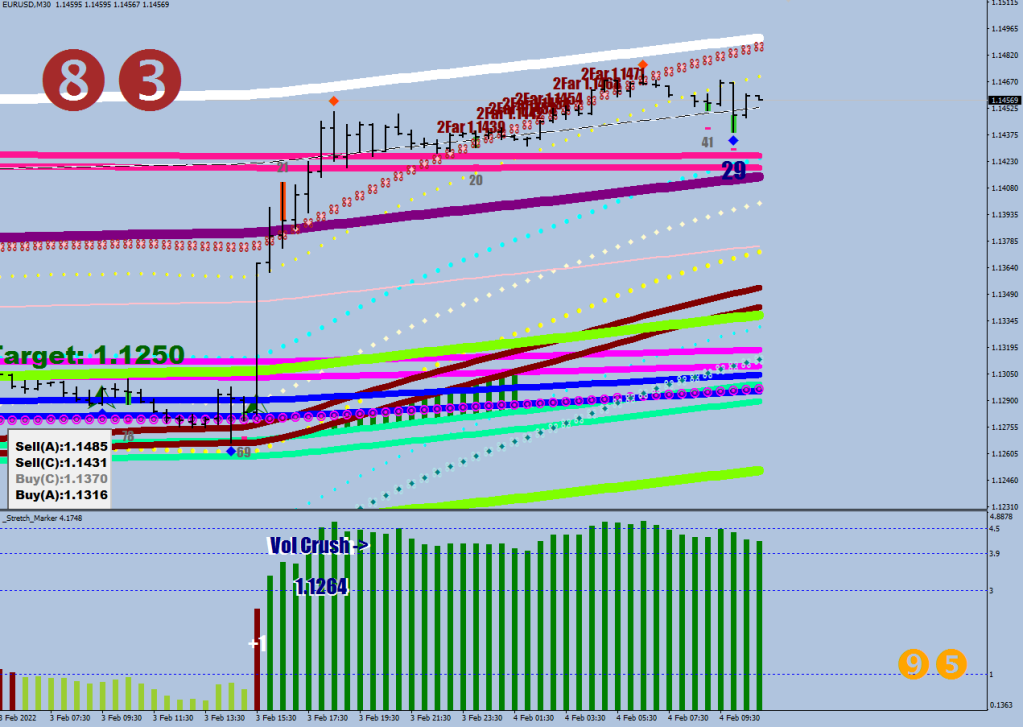
Currently we have 8.
Watch how the RSI is diving below the main line (middle of the 5) . In this field the indicator would only prompt buy signals.
The reason you did not get any sell signals is that the incline was not steep: I’m looking for a 2-sample cross over & peak out above the main line or a 3-sample cross outside the 2nd upper line from at least one below.
extern int                period       = 10;
extern ENUM_APPLIED_PRICE appliedPrice = PRICE_MEDIAN;
extern double             multiplier   = 3.0;
The purple vertical line is a Wyckoff Volume Demand Dry Up Doji. Not a pronounced version, but it sort of worked anyways.
Now. Rules.
5 ticks is one color = flipping direction. From then on the direction of the trend was picked.
Less than 5 of the color: an episode called correction.
The 4+4 lines are displaced highs and lows by 25, 32, 55 and 62 pips.
Hitting the closer two lines are a pullback whilst the second two count as a correction.
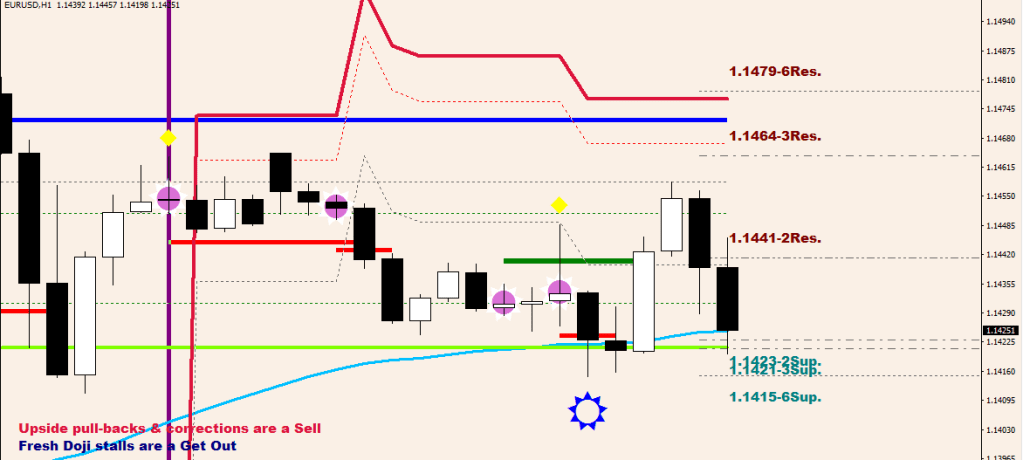
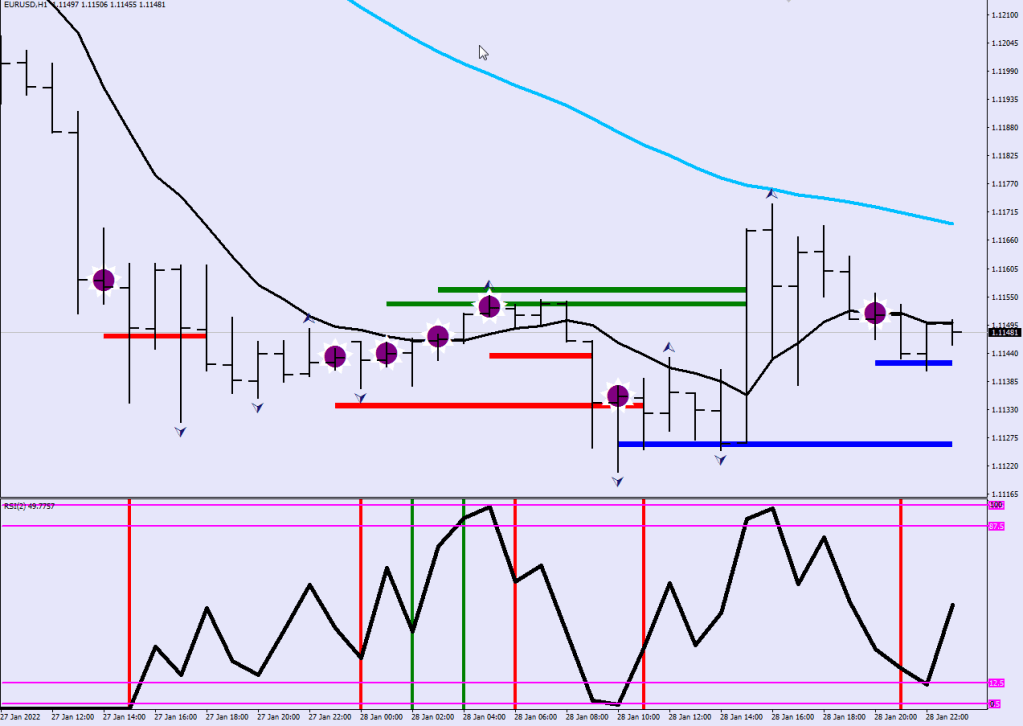
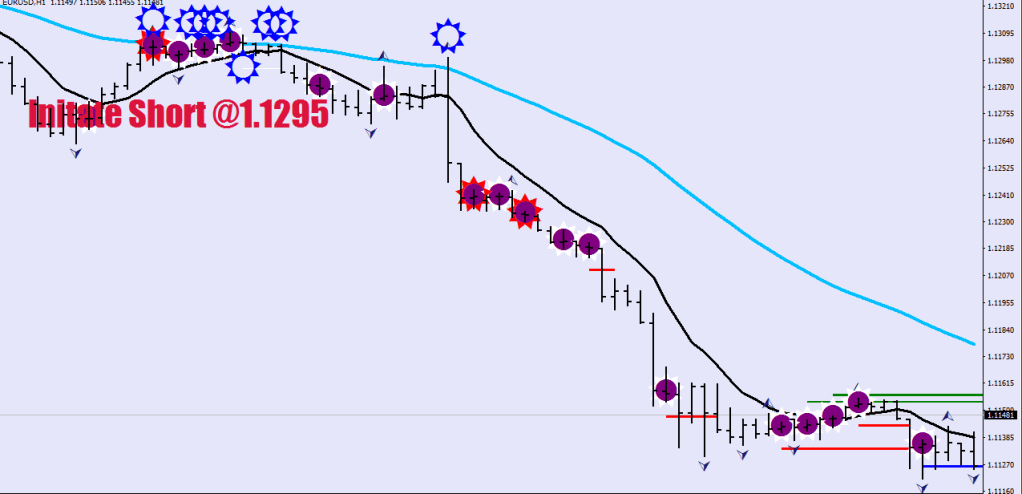
Dojis. Shared the basic version on ForexFactory. The routine now plots the last 2, 3 and 6-doji ranges with increasing displacement as supports and resistances on the right margin with the numbers plotted. It also makes the thick blue, red and green lines depending on if the market has managed to close beyond that particular line for an idea of fake outs / current progression.
Plot E44 HL2 in Light Blue, because that’s always fun.
If price hits the middle of that blue halo, that’s an immediate short.
I was just curious about how far I could possibly push a SuperTramp indicator. Quite far. You cannot change the trending direction in less than 5 hours.
Today’s the 3rd day of price being in the overbought field, if it manages to close above 1.14228 it embeds thus the market will change character. Until that happens, being in the overbought field is toxic and does not tempt new money to come in.
& I didn’t say Donald anywhere. It was quite classy of me.
The close right against the doji resistance. Nothing has flipped yet. A correction could take price back to the high. (1.1479+)
Momentum means a million and one things for a million people. For me, it is about daily candles closing up / down 27 pips or not on the Euro.
A new Cover low / high is an indication of loss of previous momentum / possible reversal. Until a Cover high/low is printed the momentum shows up in the counter direction, the momentum is considered intact. A Cover low / high has to be a 4-candle low/ high. Inside candles, mere 2, 3 sample highs / lows don’t count.
First, the sensationalist part. A double top target (upon taking) out the low is 1.10752.
Intermission.
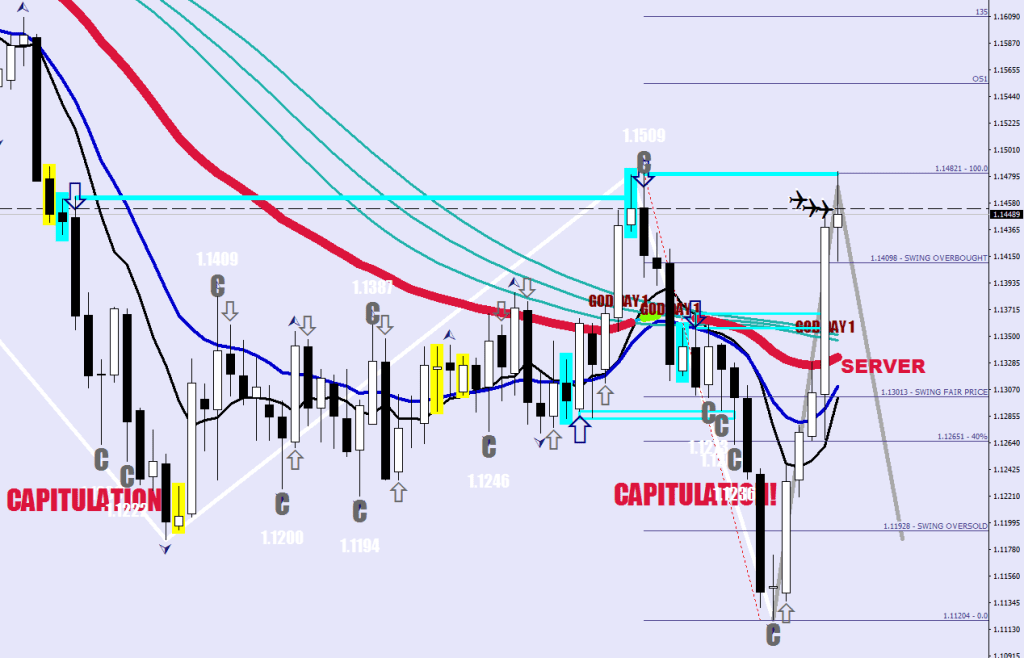
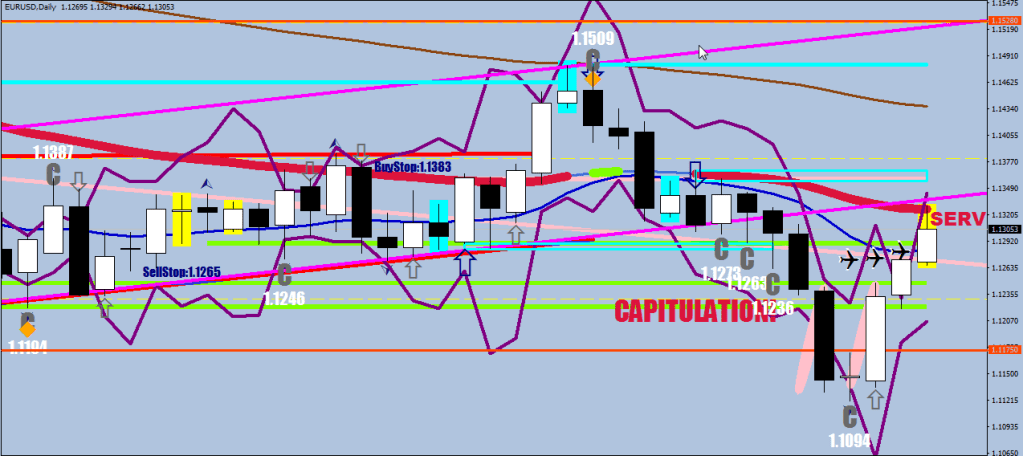
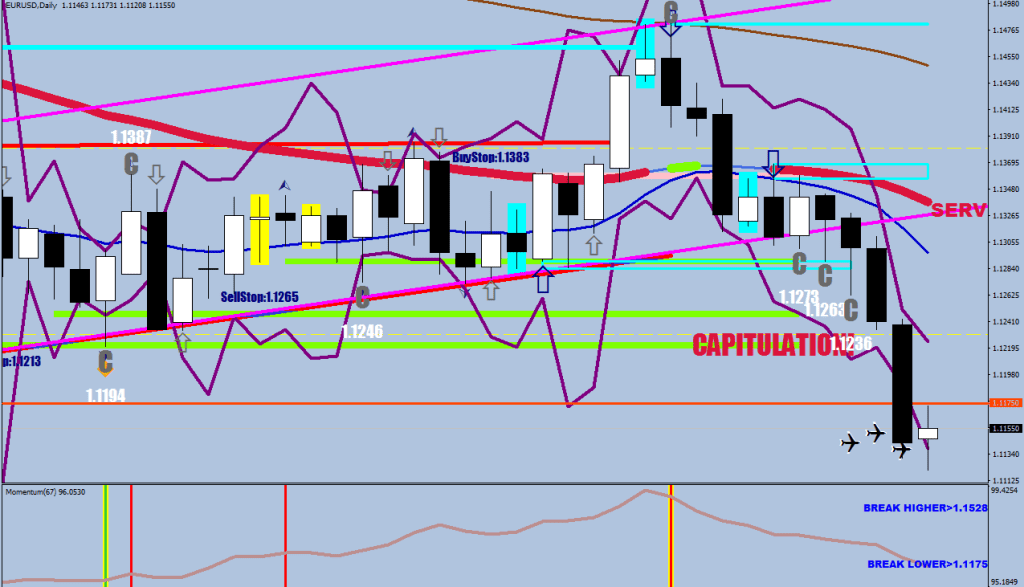
Look at all them Cover signals.
The current candle will receive its C on Sunday, it needs another candle to print first (cycle runs till 1 not 0), but you can already say it is a C because it is a 4-sample high that closed back down by more than 27 pips.
First rule of the cover candles: if the following day continues in the original direction of the momentum making a new higher high / lower low, but it does not close back 27 pips, you are looking at a Capitulation in progress.
Second rule: the displacement numbers in white are carefully chosen, 31 pips on the downside and 39 on the upside. Unless these numbers get violated, the Cap is considered intact.
When a cap is further in than the previous one, suspect some kind of a trendline forming.
Of course, if a new Cap gets printed further out in a sequence, that pushes the Cap moratorium out by the increment.
The gray arrows are independent of the C-s, but they often follow them up on the next candle. These serving signals are a 3-canle sequence with the middle candle sticking out and the 27-pip filter is active again. Plus there’s a pro volume filter to avoid crowding. The arrowed candle also surpasses the mid point of the prior candle and displays the color of the new momentum.
Now, let’s talk possible outcomes following a Cap candle up.
As per the image above there on the upside there are no back to back Cs on the upside, only on the downside prior to a Capitulation. This means, that if you get the the Cap extended come Monday, the odds would increase for a capitulation move being in place. Overall this bears very lowest odds.
Even lower odds still is that the new candle would make a higher high and would not close back by 27 pips by the time of the daily re-balancing confirming a Capitulation in progress.
We could say with high likely-hood that the next candle is going to be a black one. We could say that the low is going to be violated, but it may take more than one day. (In case of the rolling pin on the left, it took 5 days to cover the distance of 150 pips from the close to the low). In our case the close to low distance is 40 pips, this could fill in a sneeze. The recoils were 22, 19 and 19 pips on the previous examples. This would mean a lower high, as the current one is 34+ pips away.
Overall, a Cap on the upside (vs. the downside) is foreshadowing a sinister move on the downside in excess of 100 pips from the C’s close and could only be contained with either a momentum reversal (4-sample lower low closing back up 27 pips) or a serving day (gray arrow, discussed earlier). So watch out for a daily candle spiking back up more than 50% and having a Green color or look for a Cap print below the 1.1263 daily swing low, and in the meantime short the living lights out of this sucker.
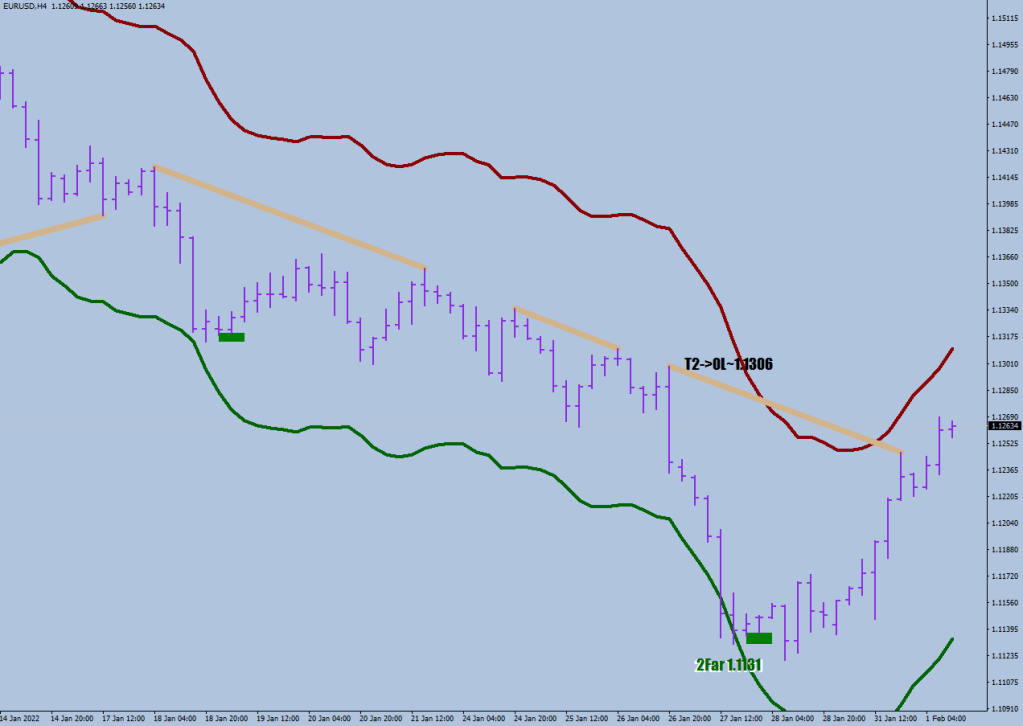
In case you are curious about what my Energy Bands are thinking of the moves of late.
& here’s how regaining the momentum would look like:
take out the low and close more than half way back up of the previous candle
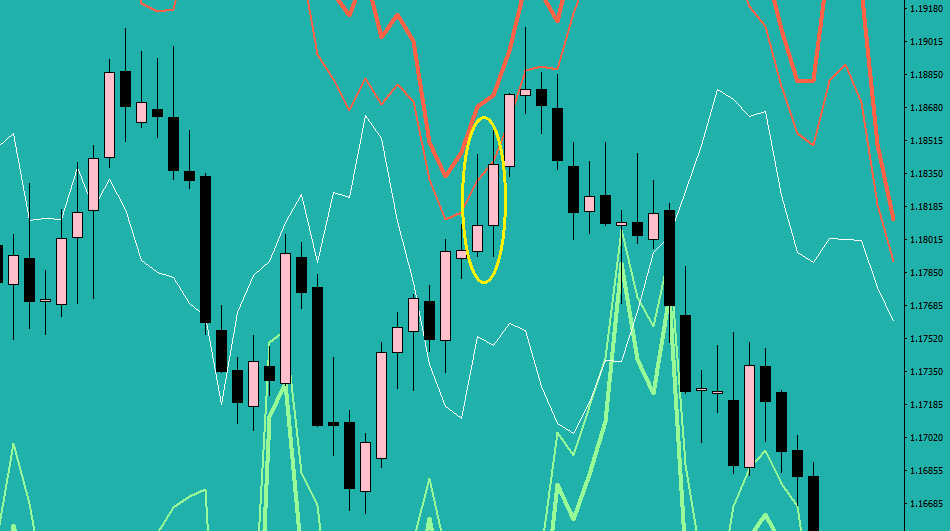
The channel. Murena Williams is not conscious of the upside yet, for there has only been 2 closes above God, not 3.Introducing momentum logic. If tomorrow makes a lower high, it would turn salmon. The Purple bands are a play on VWap. Full candle outside the bands on the left in yellow, then back in the bands, volume spike – followed by a lower close next day.
The structure is called an ‘Expanding” Flat if Wave B retraces between 105% – 138% of wave A, and Wave C ends anywhere beyond the end of wave A. Expanding Flats occur most commonly.
In case you still don’t believe that waves end in dojis, look at where support was found on Friday. At the 2-doji resistance line. Trapped between doji 2 and doji 3, printing a new doji.
I use 8-pips displacement for the 2 dojis, 10 for the 3 dojis and 16 for the 6 dojis.
When you are looking for the end of an impulsive wave structure, you are looking for 3 things:
strength having transpired (Stochastic RSI, blue vertical highlights)
a doji coming after
as well as a settled fractal
Where this approach starts to fly against conventional wisdom is where the actual wave terminates – for that’s never a swing high or a low.
Think of this as a confirmation system, where you are finished only when the all stars align. In case of a Wave one, these three items can be on the very same candle. There are no rules for if the fractal or the doji is due first, but you should only start looking after the key vertical signal. And of course you would prefer the doji and the fractal to arrive on an equal or further out end in the direction.
In terms of where are we at, that’s not very clear.
The white down move is an ABC move down, would pass for a Wave 5.
The possibilities for this up move:
It could be a Wave 1 if it took out the swing high, which it has not yet.
A Wave 2 cannot retrace 100% of wave 1 says Elliott, but I don’t think that the down leg was a Wave 1.
There is certainly out of whack swinging of the pendulum, to shake everyone off by the time the real move comes. The Effect caused a counter Effect.
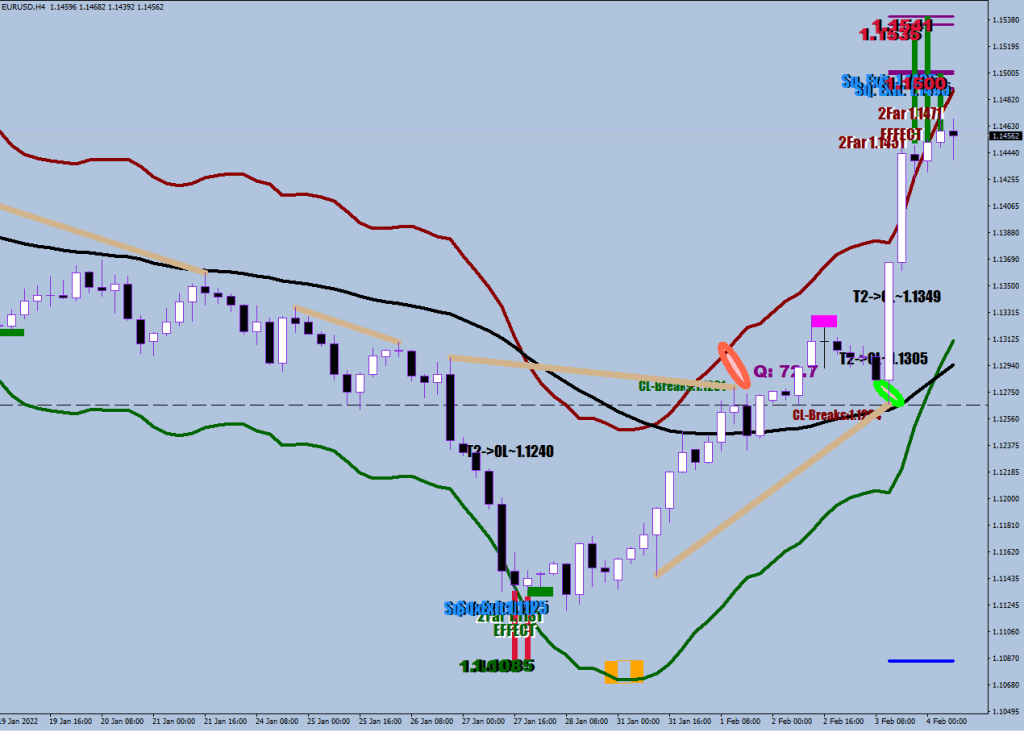
Looking at the image above I would say this is an enormous volatility whip, and from a slightly higher low a Wave 1 up could start.
This whip down whip up move steepened the angle of the axis.
Looking at this second image, the move up could be an ABC. This current move up has achieved 4.6x stretch from the mean. A real crash move could achieve a 9-11x stretch, and as the sequence goes, the downside is due for a spin. The counter move would be of similar magnitude, but (say 7-8x) but due to the distance traveled and the distortion of the angles this overall would take price much much lower even at the bounce high. Sorry, Mr. Hunter.
Last lesson: an end of a Wave may not mean the end of a Wave structure. Impulsive moves don’t end on strength, but on a reversal divergence. A “0” print on the RSI2 is a clue for you that you have not seen the top.
     if (RSI2[i]<87 && RSI2[i+1]>98){
         ObjectCreate("CTRYv"+DoubleToStr(i), OBJ_TEXT, 1, Time[i+3], 96);
                     ObjectSetText("CTRYv"+DoubleToStr(i), "NOT A TOP", 16, "Impact", DarkGreen);
      }

        if (RSI2[i]>13 && RSI2[i+1]<2){
         ObjectCreate("CTRYv"+DoubleToStr(i), OBJ_TEXT, 1, Time[i+3], 26);
                     ObjectSetText("CTRYv"+DoubleToStr(i), "NOT A BOTTOM", 16, "Impact", Purple);
      }
If today closes 27 pips below the peak (~1.1457), the reversal will have taken place.
The idea of putting Bollinger Bands at 1 & 2 standard deviations is to get help with finding buyable/sellable pullbacks & corrections. This of course can be a major help with getting the Wave Count right.
On cell phone this is quite easy. Set BBs on the “First Indicator”.
The Trading Masterclass #2 gave you ideas about how to spot a pending capitulation, the capitulation in progress and #3 talked about a possible sequence of targets and the best entry.
Now, let’s look at other factors such as percentages.
The swing back up scored between 40-50% of the fractal to fractal swing.
Less than 50% sounds like a continuation down, but not so fast, Mojo Jojo. A swing high was taken out making it even.
The question mark is on the rolling pin candle calls into question the wide range: 150-pip day from an instrument that is statistically projected to make 80% of 80pips 80% of the time?! That’s more than double.
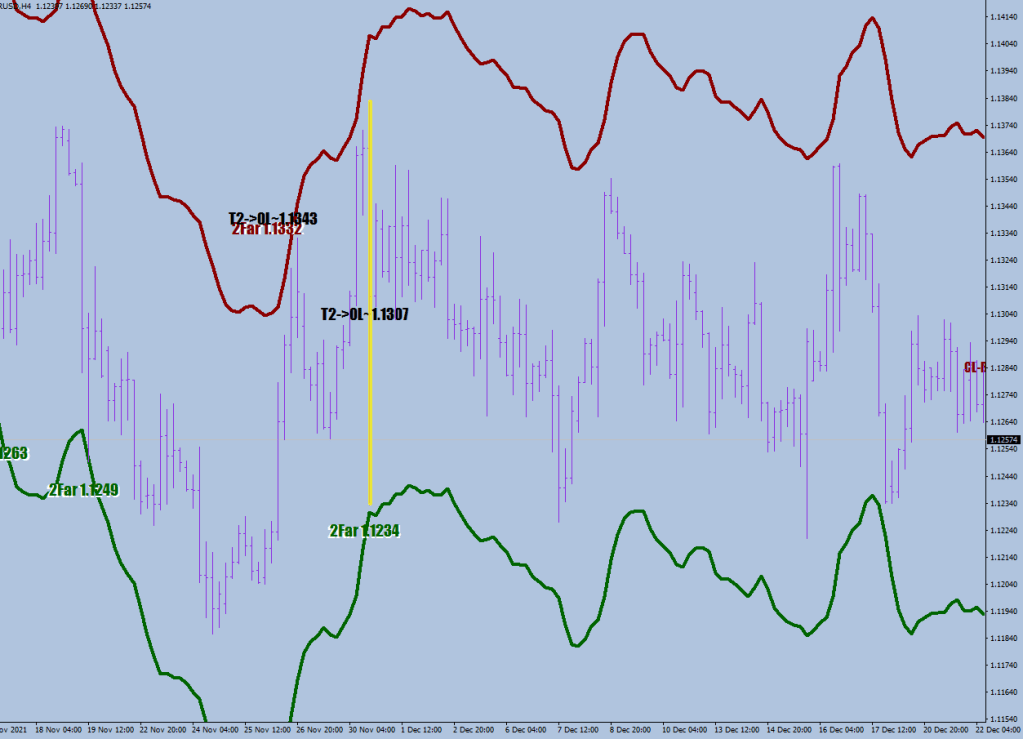
The actual move was in a 4-hour span, almost hitting the pendulum’s overdrive bands on both sides.
On 4h the pendulum’s axis is 32/4 = 8. Another not Fibonacci number.
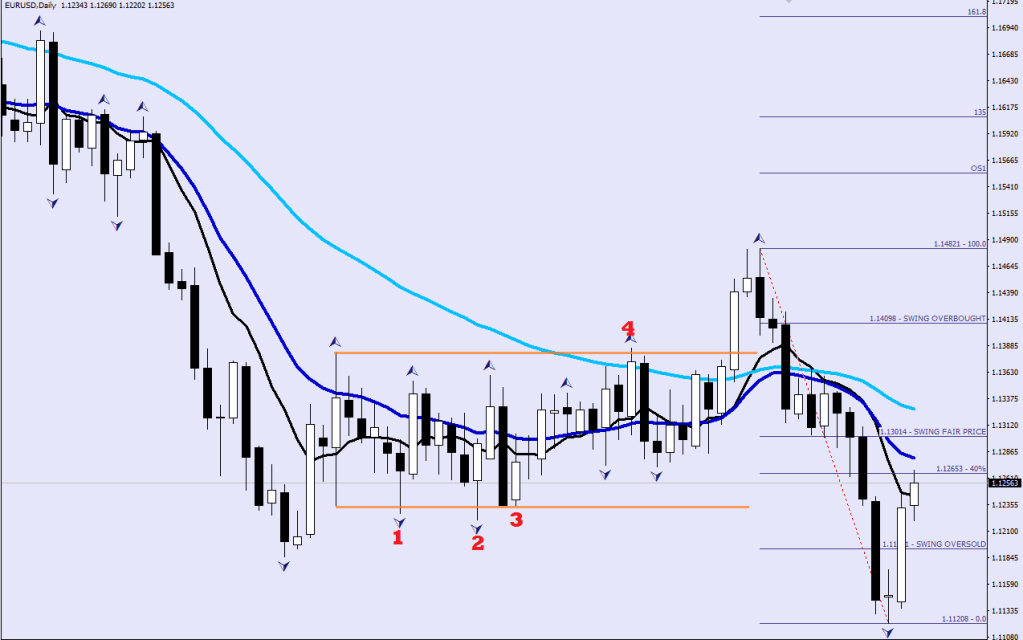
After the range got printed, the next 4 attempts of going outside were immediately thrown back in.
Now if the first move was a failed move, then the current direction is down, and this attempt back inside the range is going to get rejected – so goes the speculation.
The leg itself did not take out any daily swing highs and barely pierced through the 40% line. I think falling into a consolidation range could save the day.
Price is currently above the 2, the 3 and the 6-doji sample ranges: a break out that is going nowhere fast. Distribution?
I know, I know, the day is not over yet and life is not over yet.
The Doji walks into a Dojo and performs a quick self health check. Ama living in a box, living in a comfort box – he ponders away -, ama farting in a comfort jar – concludes decidedly.
I know, I set the bar too high with the last few blog entries, and since Richard Heart holds the Guiness World record of Best Man In Crypto, I had to default to Best Man Outside Crypto.
As a touch of nostalgia, let’s issue this piece that I had in stock already. Kind of.
A Doji is a Doji is a Doji. Dojis are not control functions, they are checkpoints.
For a 1-H plot program at the end.
If you are still with the belief that you can trade everything that can be charted the same way, the Psychiatry is on the left.
Now, let’s talk lakhsmi lakmus first.
The stethoscope ranges for health concern as per current settings are:
95 bpm – too excited, immediate concern
90-94 bpm – upbeat, doing just fine
4.5-12.5 bpm – hypoxia, serious concern
below 2.5 – ready for revival, overall a positive sign
///reds
           if (RSI2[i]<12.5 && RSI2[i]>4.5) dojir[i]=doji[i];
           if (RSI2[i]>97 && RSI2[i+2]>90) dojir[i]=doji[i];
           ///greens
           if (RSI2[i]>2.5 && RSI2[i+1]<4.5 && dojir[i+2]==EMPTY_VALUE) dojig[i]=doji[i];
           if (RSI2[i]<94 && RSI2[i]>90 && RSI2[i+3]>14 && RSI2[i+4]>16) dojig[i]=doji[i];
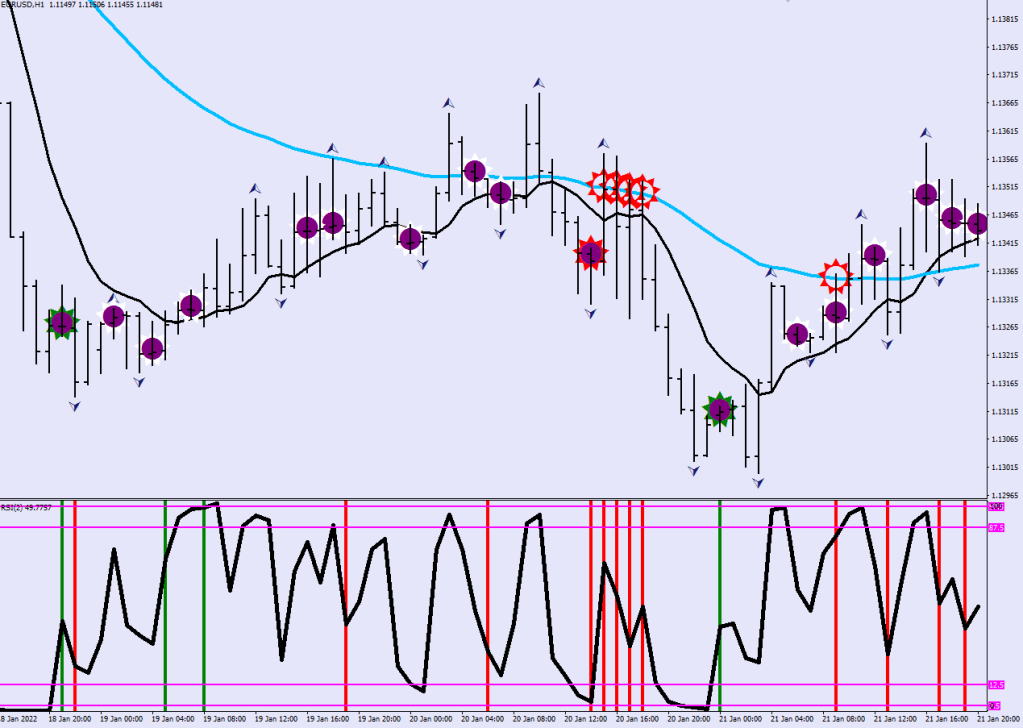
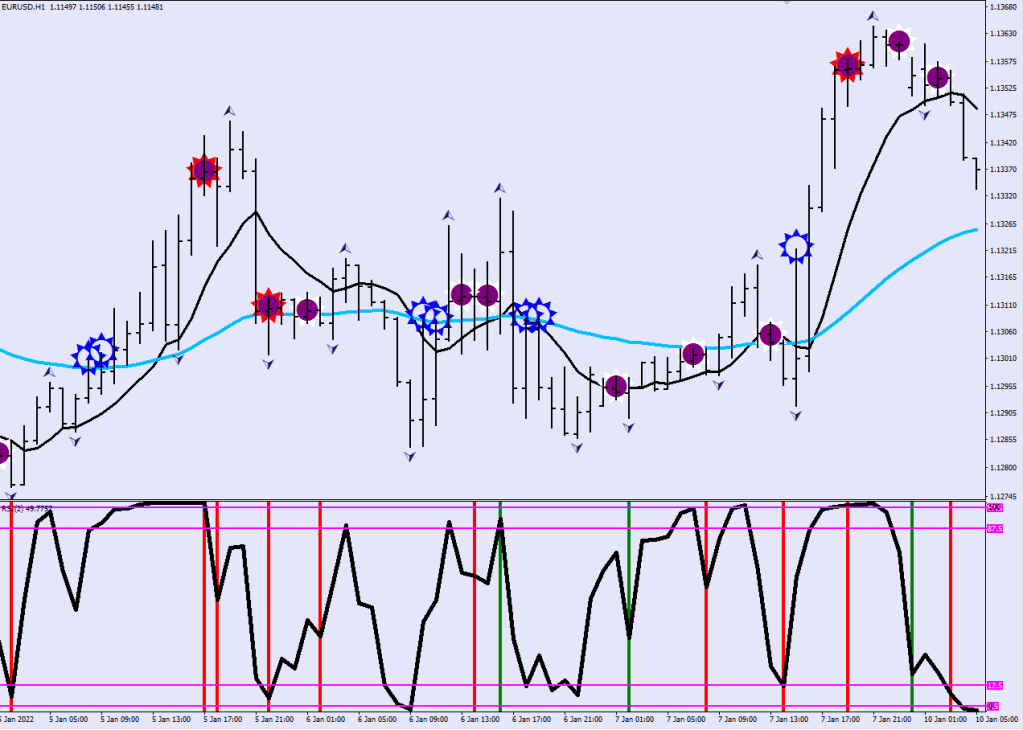
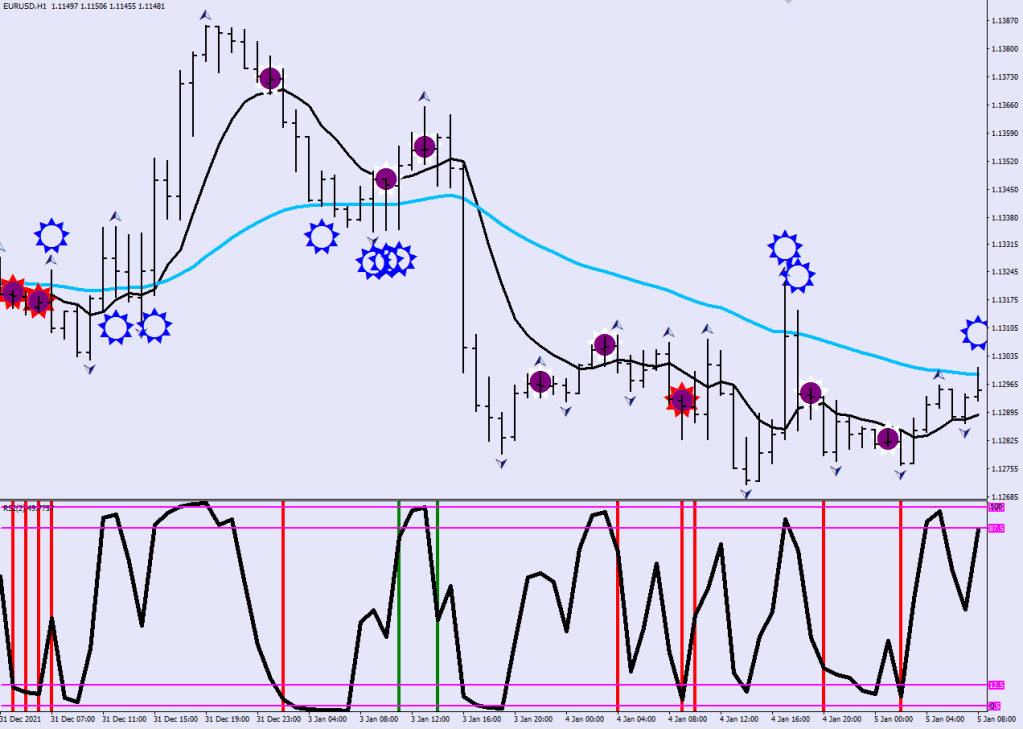
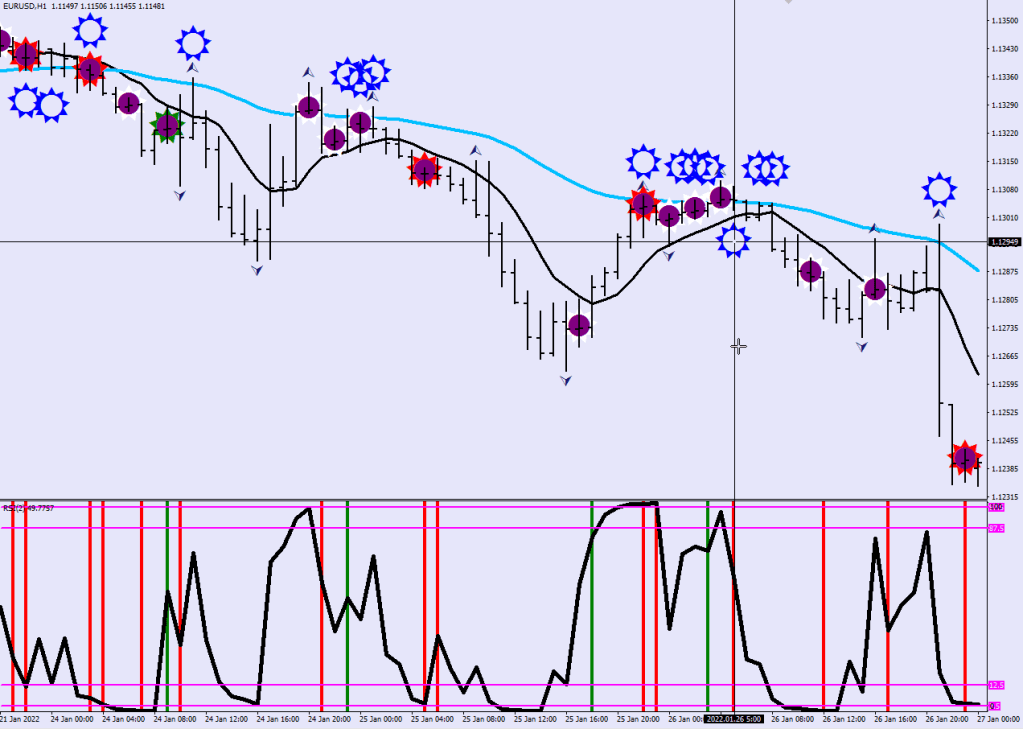
Secondly, re-visit the ideas about low close and high close dojis. Of course we are to examine the doji and its influence with the following candle’s close. These are spelled out as vertical stripes (like breadth ticks) over the RSI2.
Thirdly, the interaction results with the E-44 are the blue halos (nojis). They are highlights for potential break-out areas / they suggest stop / stop loss placement nearby. It was just an idea.
As you can see, the last stop loss is miles away. Interaction with the E-44 would bring one closer, but nothing says that it would not be broken.
Last minute change: 8-pips of displacement. These are accurate in terms of spot location because they are not text plots.
You know, I could put the last two digits next to them to eliminate having to count / measure…
Achilles Dent:
Give Me Your Love!
Here are my veins Take my blood too Before tomorrow dries up Before something gets cancelled I’ve become sick I’ve become your sick I don’t understand you when not touching you Are you outside? Are you inside? Am I eating or thirsting? I just want the best With you I just want the best For you
DJ Culture
Song by Pet Shop Boys
Imagine a war which everyone won Permanent holiday in endless sun Peace without wisdom, one steals to achieve Relentlessly, pretending to believe Attitudes are materialistic, positive or frankly realistic Which is terribly old-fashioned, isn’t it? Or isn’t it?Dance with me (DJ Culture) Let’s pretend Living in a satellite fantasy Waiting for the night to end (DJ Culture DJ D)Let’s pretend we won a war Like a football match, ten-nil the score Anything’s possible, we’re on the same side Or otherwise on trial for our lives I’ve been around the world for a number of reasons I’ve seen it all, the change of seasons And I, my Lord, may I say nothing?Dance with me (DJ Culture) Let’s pretend Living in a satellite fantasy Waiting for the night to end (DJ Culture DJ D)Now as a matter of pride Indulge yourself, your every mood No feast-days, or fast-days, or days of abstinence intrudeConsider for a minute who you are (consider/who you are) What you’d like to change, never mind the scars (change) Bury the past, empty the shelf (bury the past) Decide it’s time to reinvent yourself (it’s time) Like Liz before Betty, she after Sean Suddenly you’re missing, then you’re reborn And I, my Lord, may I say nothing?Wondering who’s your friend (DJ (DJ Culture) And I, my Lord, (une foix) (DJ Culture) May I say nothing? (deux fois) Living in a satellite fantasy Waiting for the night to end (DJ Culture)
Doji support and resistance break confirmation lines. They are blue until they get a close over. Afterlife of a doji tick. Easy to see where market is progressing where it isn’t.
deletetxt1("Ricky");
deletetxt1("Bacardi");

  for (i=lookback-1; i>0; i--){
   if ((doji[i+1]!=EMPTY_VALUE  && Close[i]<=Open[i]) || dojir[i]!=EMPTY_VALUE   )
   {
          ObjectCreate("Ricky"+IntegerToString(i),OBJ_VLINE,1, Time[i], 0);
         ObjectSet("Ricky"+IntegerToString(i),OBJPROP_COLOR,clrRed );
            ObjectSet("Ricky"+IntegerToString(i),OBJPROP_WIDTH,4);
            ObjectSet("Ricky"+IntegerToString(i),OBJPROP_STYLE,STYLE_DOT);
          ObjectSet("Ricky"+IntegerToString(i),OBJPROP_BACK,1);

    if(i<40){
           j=i-1;
      while (j>0){
         if (Close[j]<Close[i+1]-100*Point) break;
         j--;
      }
        if (j<0) j=0;
            ObjectCreate("Bacardis"+IntegerToString(i), OBJ_RECTANGLE, 0,  Time[i+1], Close[i+1]-90*Point, Time[j], Close[i+1]-100*Point);
          if (j!=0) ObjectSetInteger(0,"Bacardis"+IntegerToString(i),OBJPROP_COLOR,clrRed);
          else ObjectSetInteger(0,"Bacardis"+IntegerToString(i),OBJPROP_COLOR,clrBlue);
          ObjectSet("Bacardis"+IntegerToString(i),OBJPROP_BACK,1);
          ObjectSet("Bacardis"+IntegerToString(i),OBJPROP_WIDTH,3);
    }
   }

   if ((doji[i+1]!=EMPTY_VALUE && dojir[i+1]==EMPTY_VALUE && Close[i]>Open[i]+10*Point) || dojig[i]!=EMPTY_VALUE)
   {
          ObjectCreate("Ricky"+IntegerToString(i),OBJ_VLINE,1, Time[i], 0);
         ObjectSet("Ricky"+IntegerToString(i),OBJPROP_COLOR,clrGreen );
            ObjectSet("Ricky"+IntegerToString(i),OBJPROP_WIDTH,4);
            ObjectSet("Ricky"+IntegerToString(i),OBJPROP_STYLE,STYLE_DOT);
          ObjectSet("Ricky"+IntegerToString(i),OBJPROP_BACK,1);


          if(i<40){
           j=i-1;
      while (j>0){
         if (Close[j]>Close[i+1]+100*Point) break;
         j--;
      }
        if (j<0) j=0;
            ObjectCreate("Bacardis"+IntegerToString(i), OBJ_RECTANGLE, 0,  Time[i+1], Close[i+1]+90*Point, Time[j], Close[i+1]+100*Point);
          if (j!=0) ObjectSetInteger(0,"Bacardis"+IntegerToString(i),OBJPROP_COLOR,clrGreen);
          else ObjectSetInteger(0,"Bacardis"+IntegerToString(i),OBJPROP_COLOR,clrBlue);
          ObjectSet("Bacardis"+IntegerToString(i),OBJPROP_BACK,1);
          ObjectSet("Bacardis"+IntegerToString(i),OBJPROP_WIDTH,3);
    }


   }


  }
Blog Health-check
Not sure what prevented me from posting 2 more songs here, the Owner of a Lonely Fart and the Message in a Butthole, but you’re glad I didn’t.
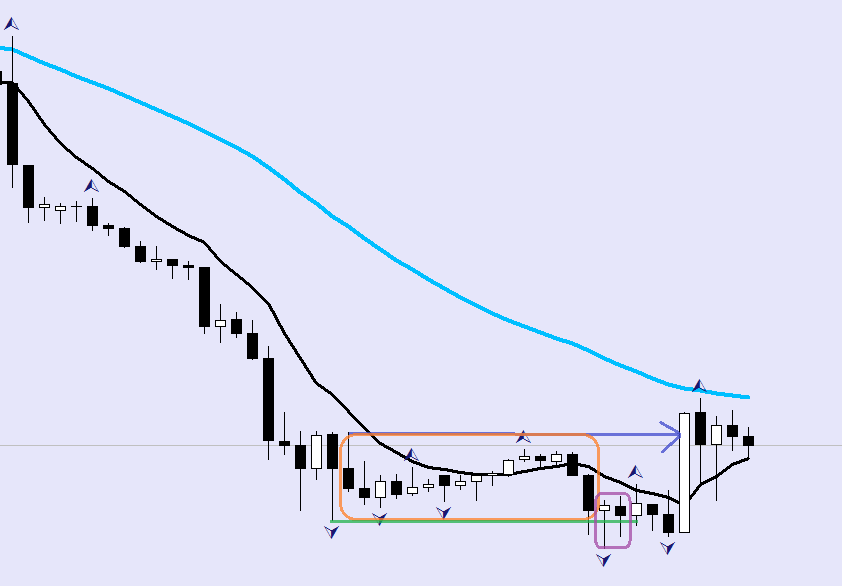
There’s always at least one good answer. Look at both images.
Is it true that you could have sold anywhere (with virtually any size that does not prompt a margin call within the next 30 pips) in the orange boxes after the first settled fractal’s print knowing that there was going to be a lower low printed?
– yes or
– yes
What was the reason that made a lower low necessary?
– Inertia. A boat cannot turn on a dime.
– Humphrey Bogart.
Where was the lowest risk entry for a reversal?
– Right after price came back up through the first fractal’s low and printed a positive close (green line).
– At the high that was printed right after the first fractal (blue line).
Pick a route the market may be taking from your carefully chosen entry!
– First E44 hourly, muted counter directional volatility of less than 32 pips (25 would be ideal), proceed to Daily E16, correct close to 100 pips, proceed to E44 daily.
– First E44 hourly, then counter directional move in excess of fluctuation size (32 pips), then continue trending lower.
For all the right answers you scored 3 tubs of sour cream, 2 tons of smashed potato and fake meat Blockwurst approved by carnivores, grrr.
Price is having a hard time with that 1.1175 break-down level. E44 has to come a it lower to finish the rendezvous.
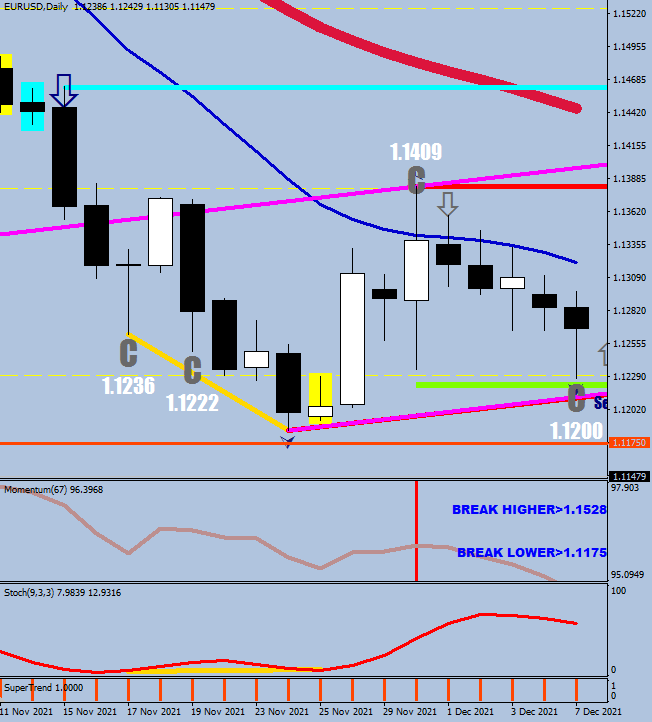
First thing to say is that capitulations don’t just come out of the blue. Your warning(s) are the previous days. Like we have already discussed here, the Cover lows/ highs are 4-sample daily highs / lows with 27+ retracement on the last candle. The Cover days come with a moratorium zone (white numbers) and moves up to these numbers are no break extensions. These displacements are also based on the fore-mentioned 27 pips. Give it another 6 pips tolerance to avoid some fake outs.
Based on this, the capitulation was narrowly avoided (prepped) by the previous day when the low that was set was at 1.12345, but when today the 1.1230 level was hit, the capitulation was on.
To compare this with the previous capitulation, you will find that that too had Cover lows setting up the stage & at 1.1216 (with the 6-pip add on) there was no question about what was happening. The cover low was first followed by a low, that did not retrace 27-pips on the daily candle. Dead giveaway.
The 1.1175 level was calculated with the last Money Flow divergence low and 46 pips additional distance (wanted to sick to the 8 multiplier table).
One interesting nuance is that if you measure the distance from the capitulation low to the previous large black candle’s closing level, on the second image you get 96 pips, whilst on the current example this is 111.
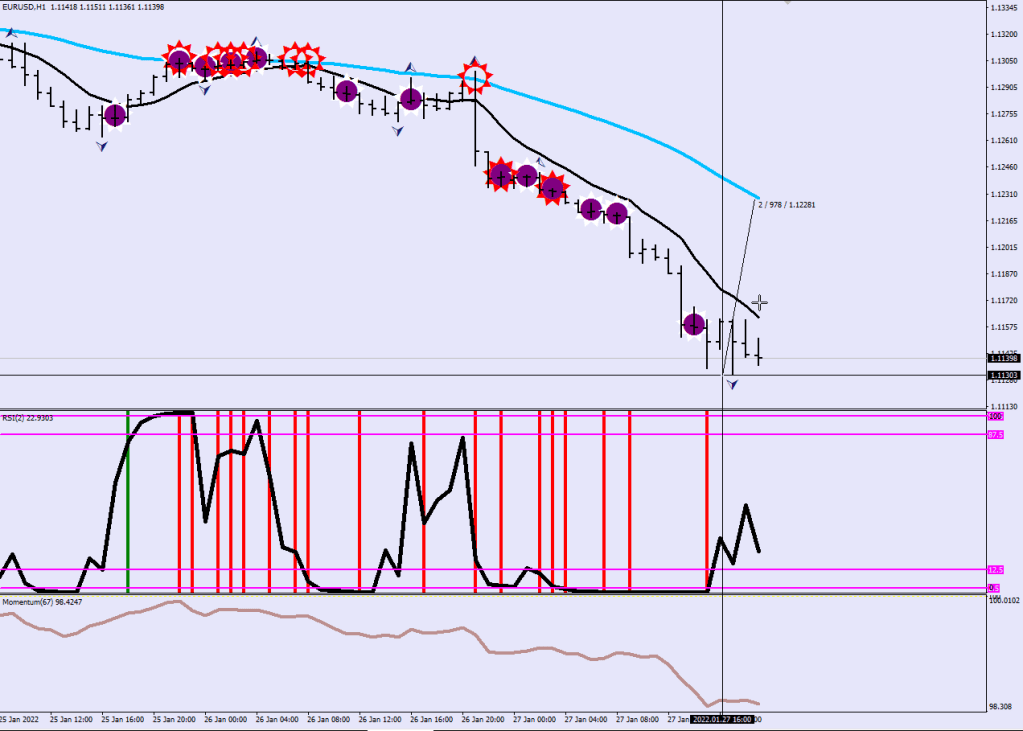
Another nuance to insert here is that I set up my 0-M hourly chart in a way that the first indicator row displays primary signals (vertical lines) and the second row has secondary signals. Obviously, secondary signals do not matter during a capitulation.
The capitulation went way beyond what can statistically be expected from a Wave 3 or a C without further consolidation.
Now let’s talk about how important it is that the ink dries on the hourly fractal when looking for the low.
The current fractal would be solidified in 20 minutes, when the current hourly candle settles. For a divergence you want to see two separate hourly fractals to compare, so if the divergence is only present between a fractal and a neighbouring non-fractal, that is less than desired
Now, let’s look at what happened with the previous capitulation. After the 67-sample momentum made a reversal divergence along with the RSI2, price went back to the E-44 within 24 hours.
Here is the latest example where the market made a major move that ended up being a sustained break-out for comparison.
As you can see, the descent wasn’t as vertical, there was a prolonged consolidation at/below the 8-EMA and when both the RSI2 and the momentum showed a reversal, the market ended up tagging the E-44 with a 27-pip lift, as by then the moving average managed to catch up with the price.
So, I presented you all the evidence; from the current swing low, the E-44 is almost a 100 pips away, and they are certain to meet again, the question is: which route shall the price take from here?
…
The deep M at the end of the rising wedge was of course still a sell for a lower low.


































 ForexFore - Internals, indicators, algorithmic trading