Be it brain or bloodline.
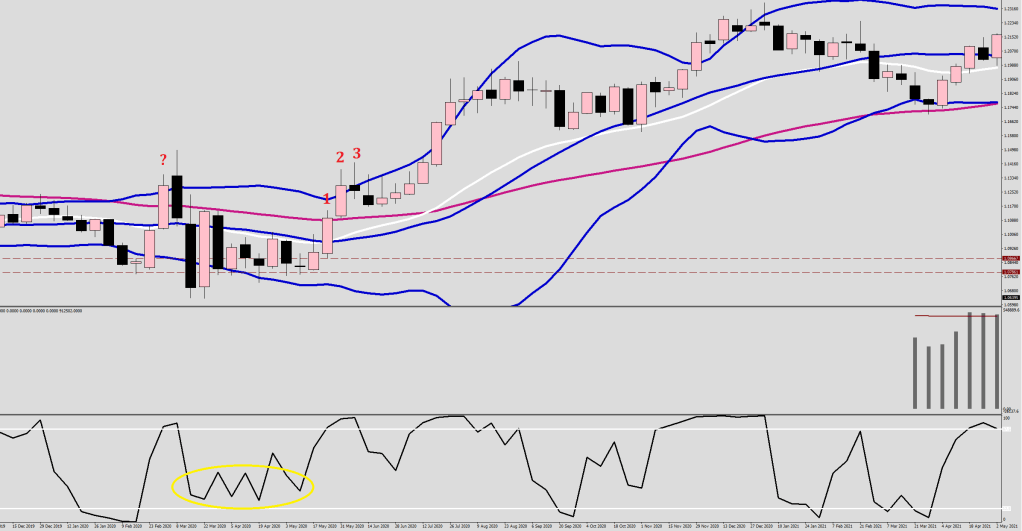
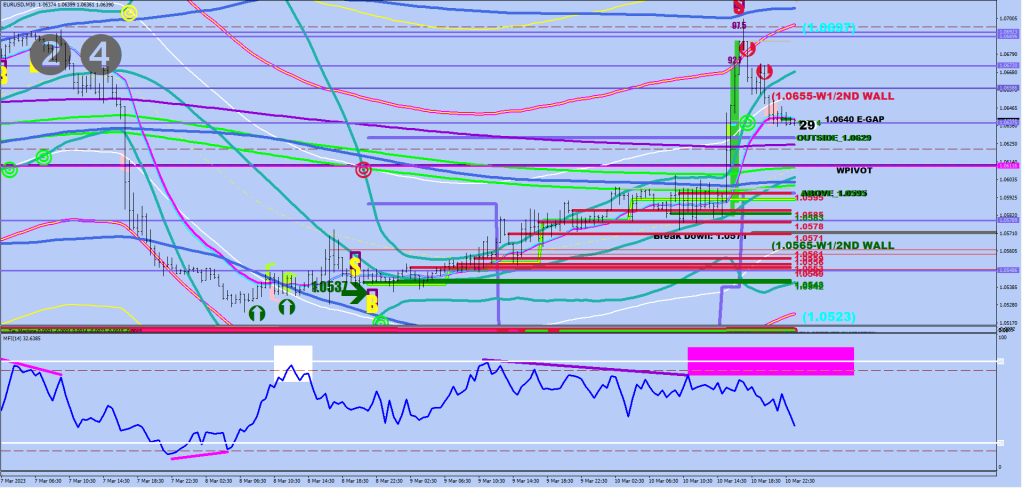
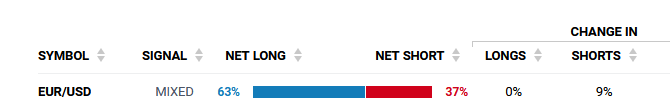
So, about the insitive buying.
I added this condition already, but there’s more.
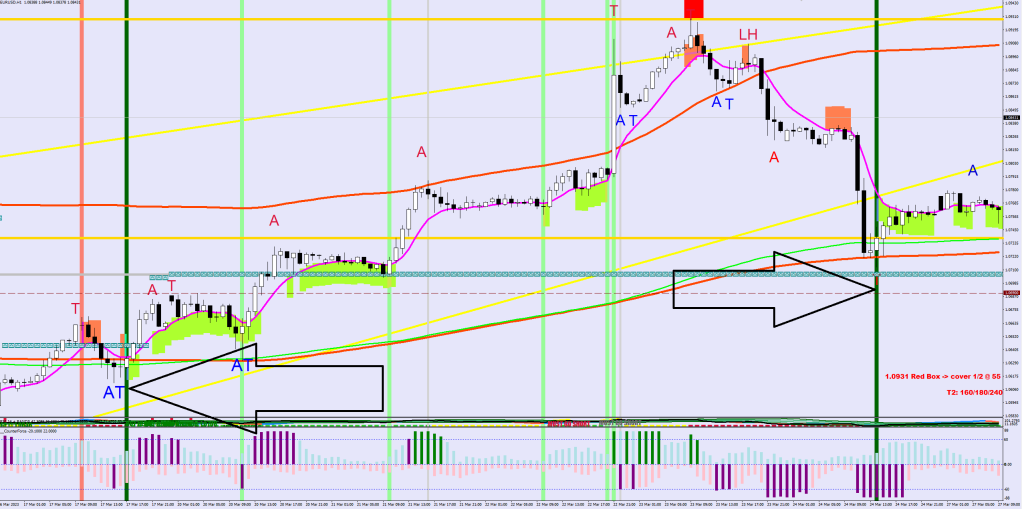
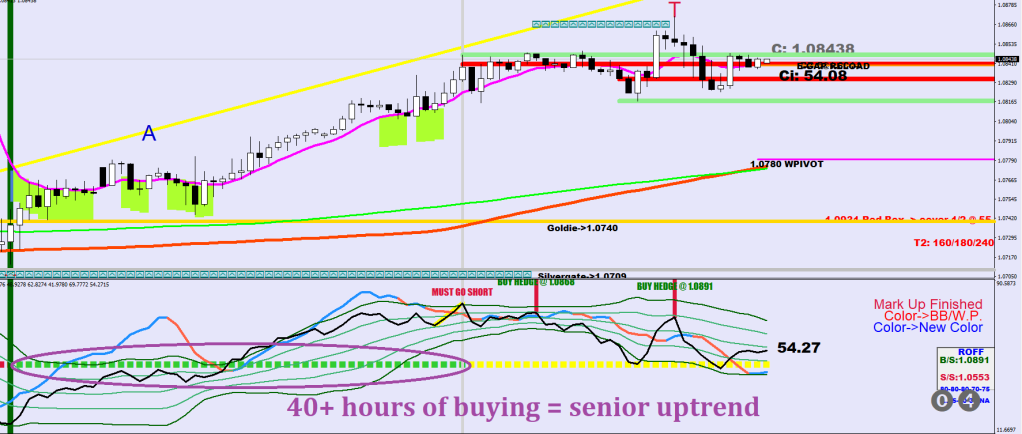
A yellow adjoining a senior uptrend (more than 40 hours of green) is an exension, by no means is a reversal. I’ll figure some implementation.
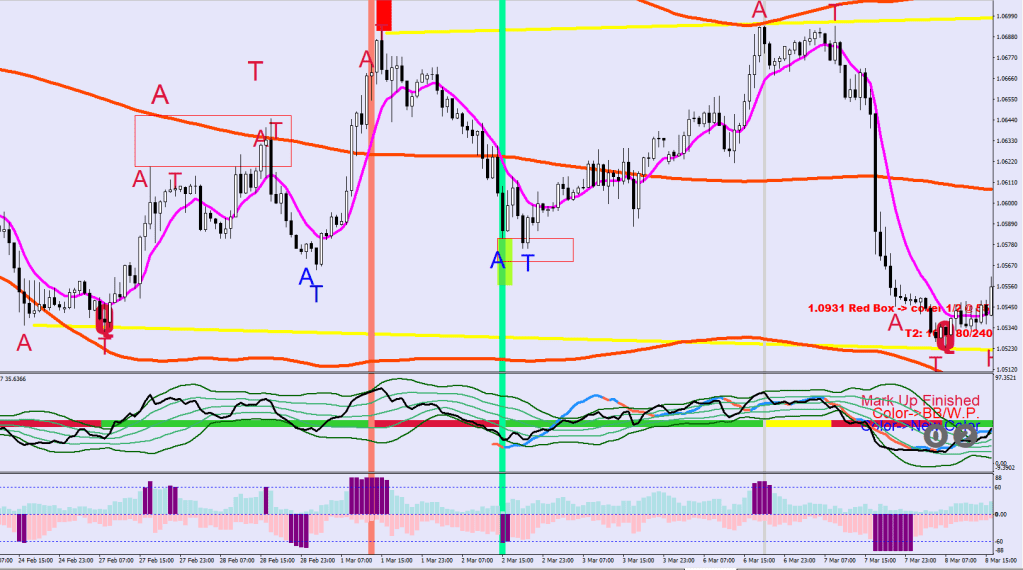
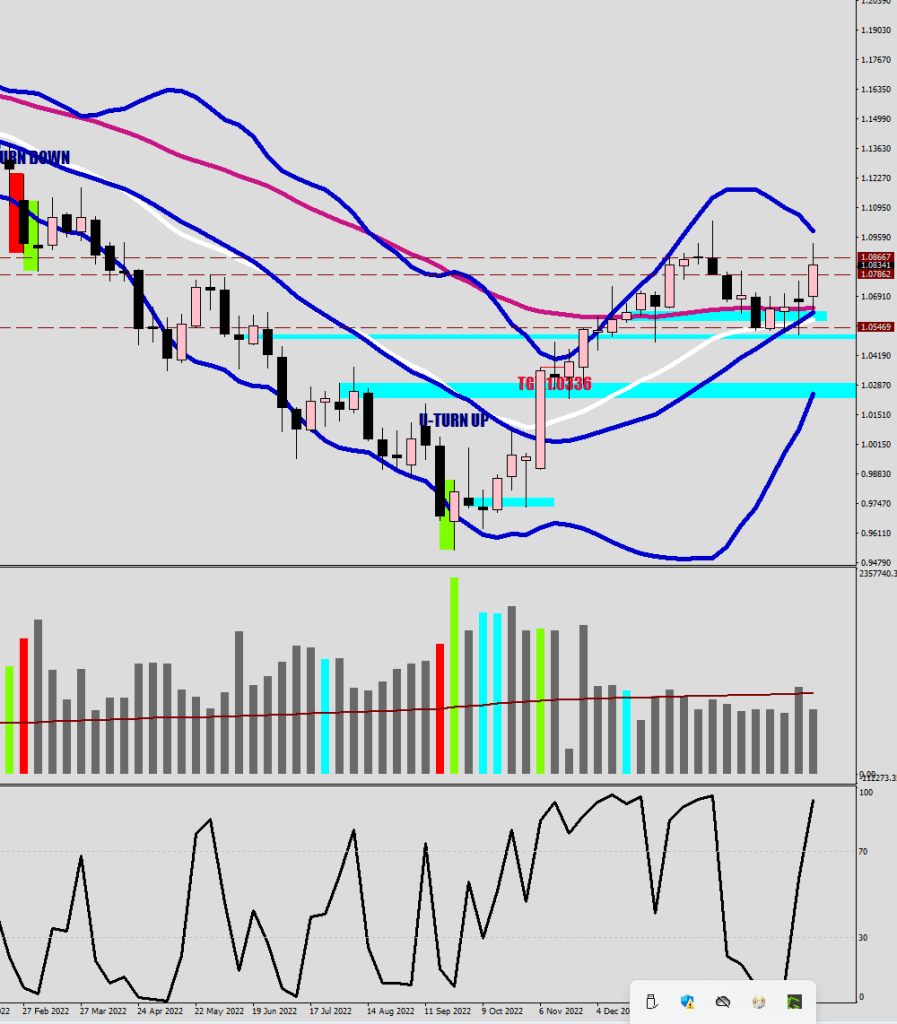
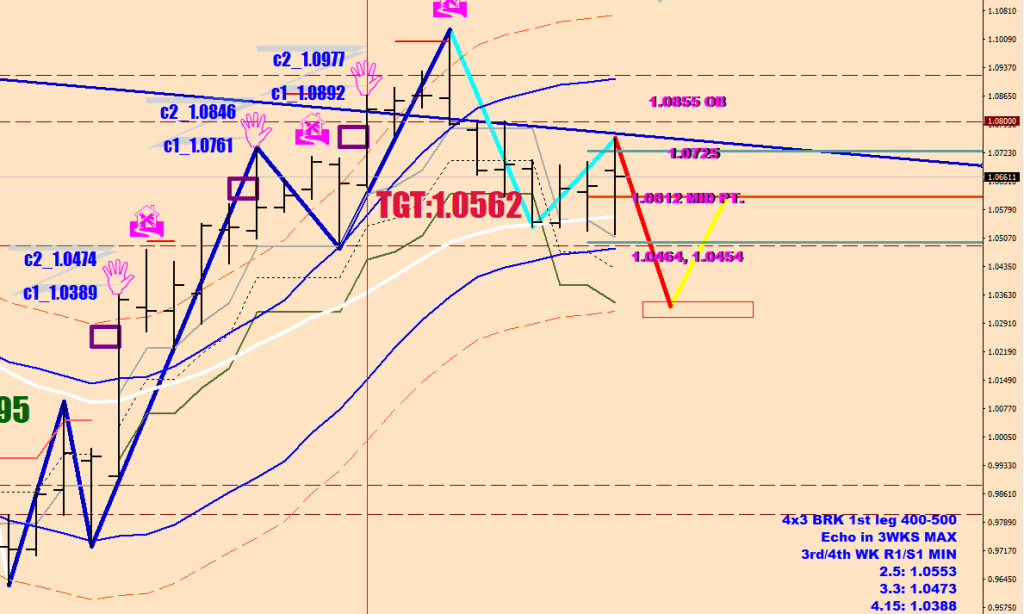
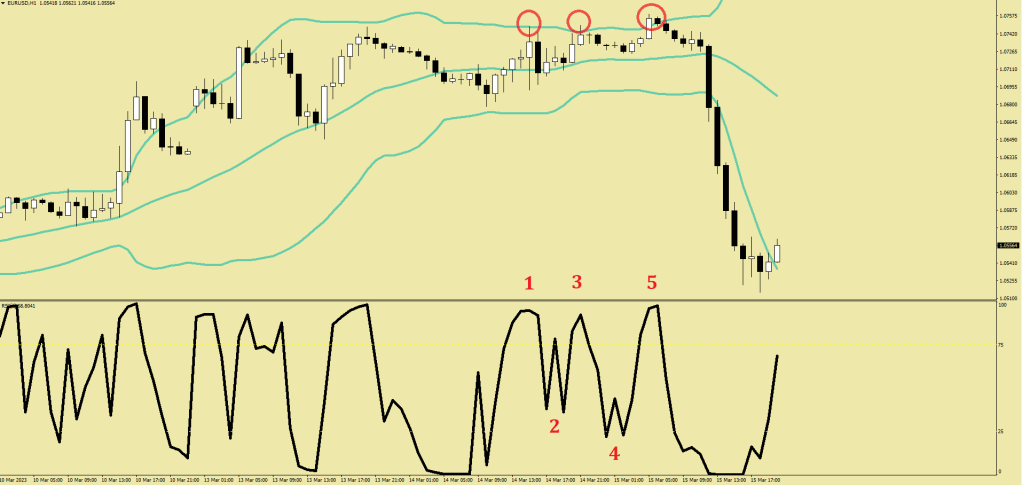
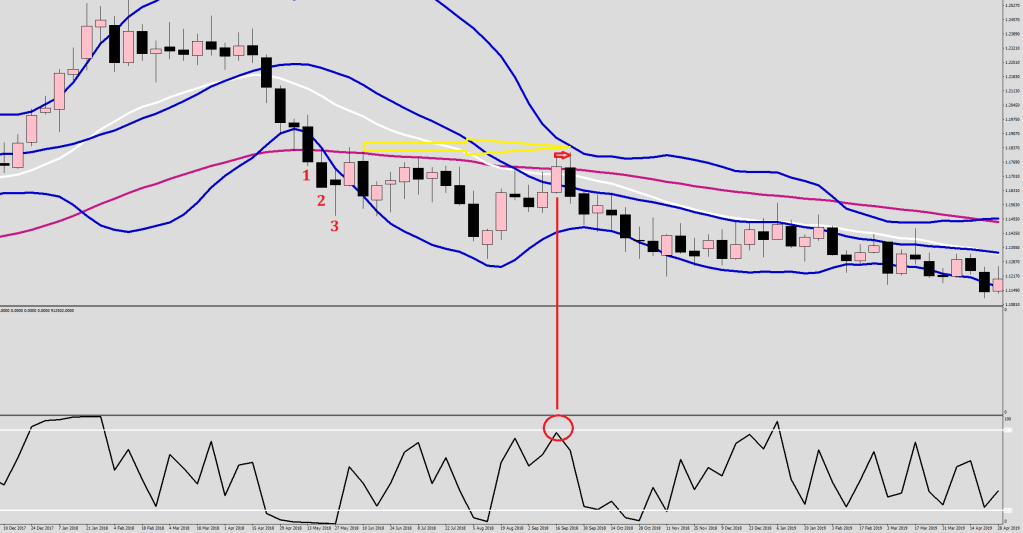
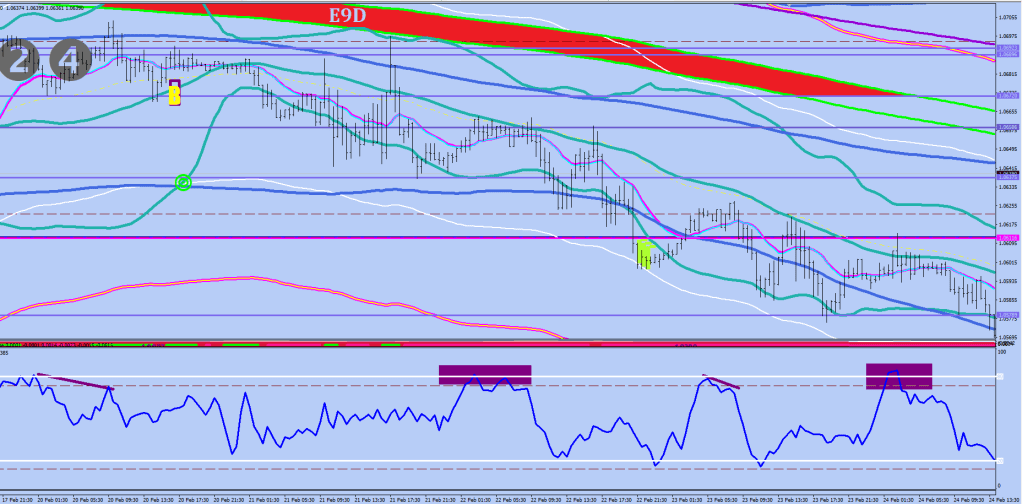
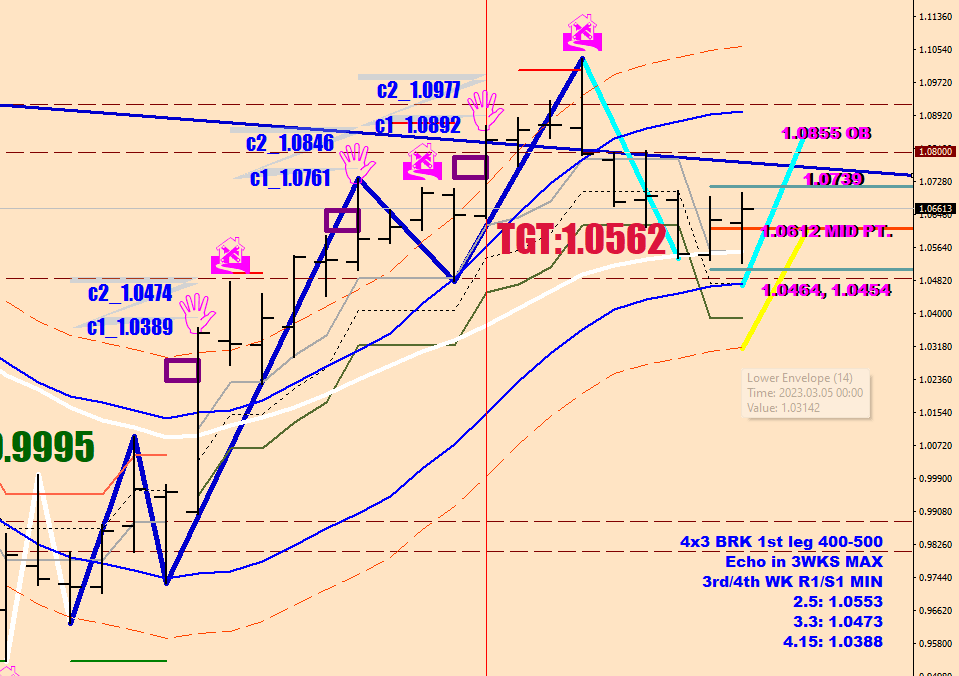
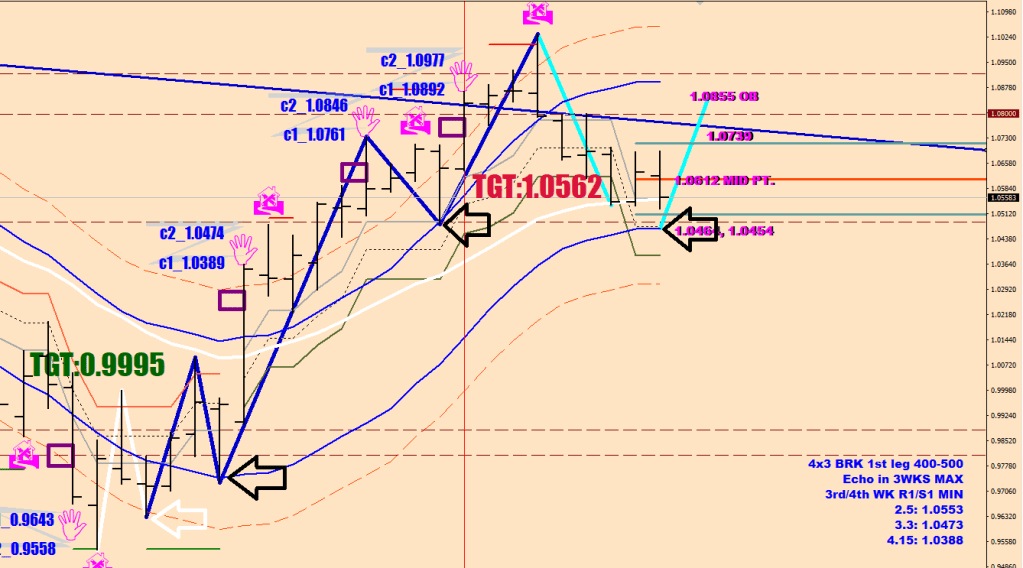
This was a not-so-obvious 5-wave structure up, buy you could had known when to enter for a Wave 5 if you knew what to look for.

Wave 4 ended when it set an RSI2 continuation divergence relative to the Wave 2.
But where would you expect the Wave 5 to end?
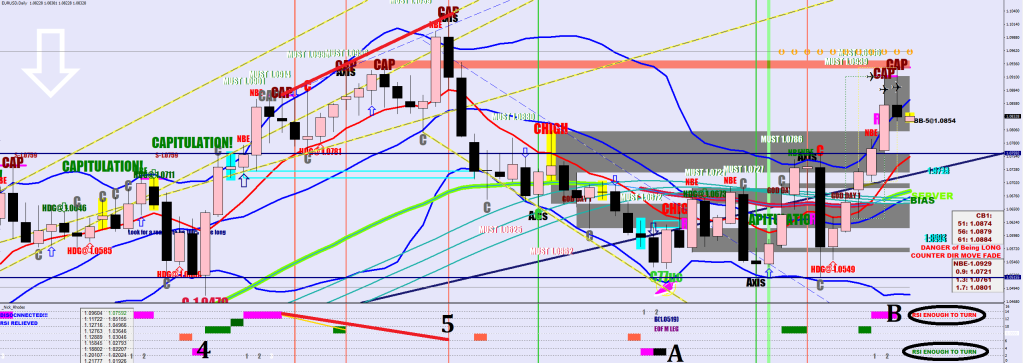
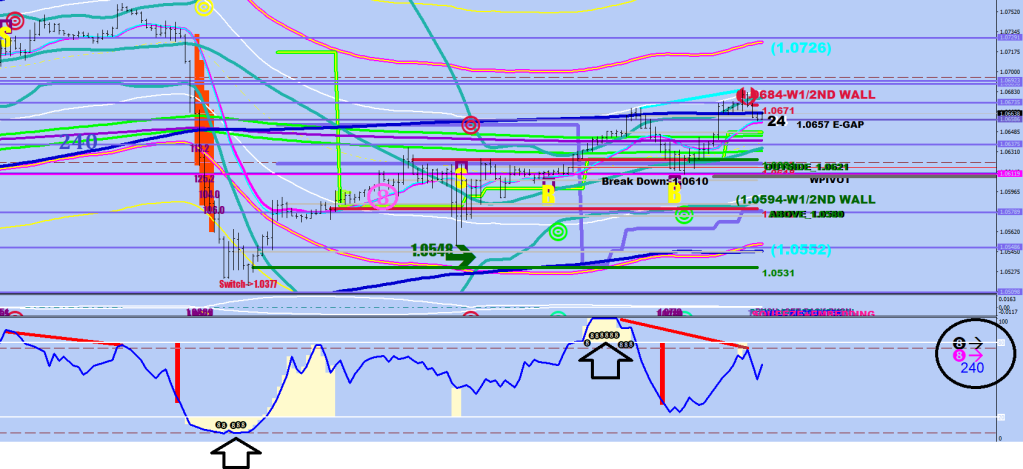
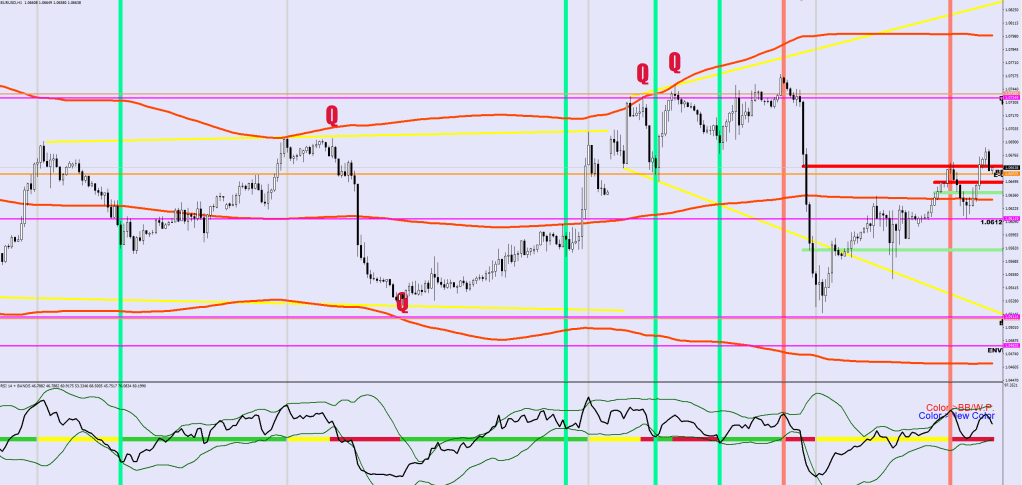
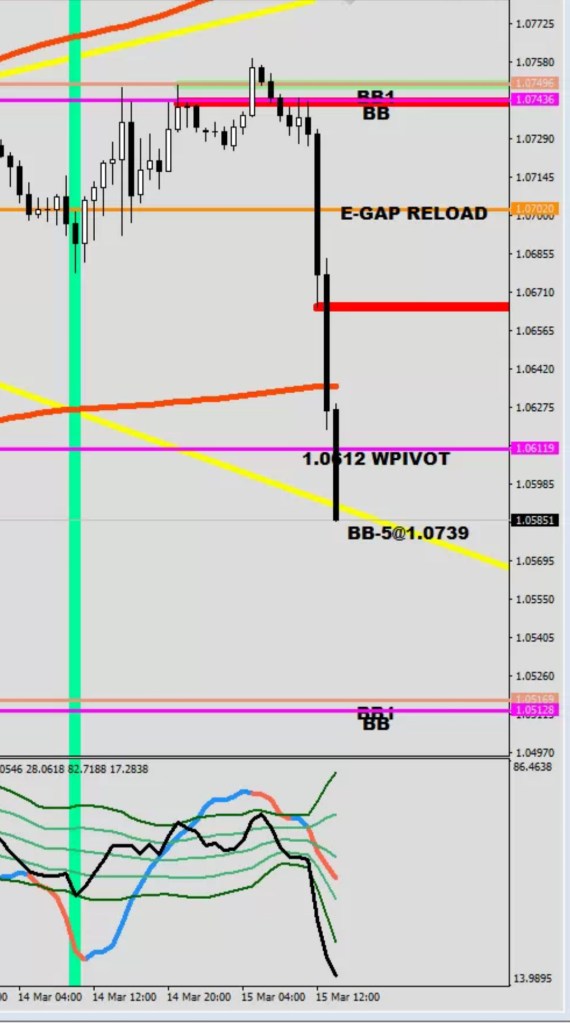
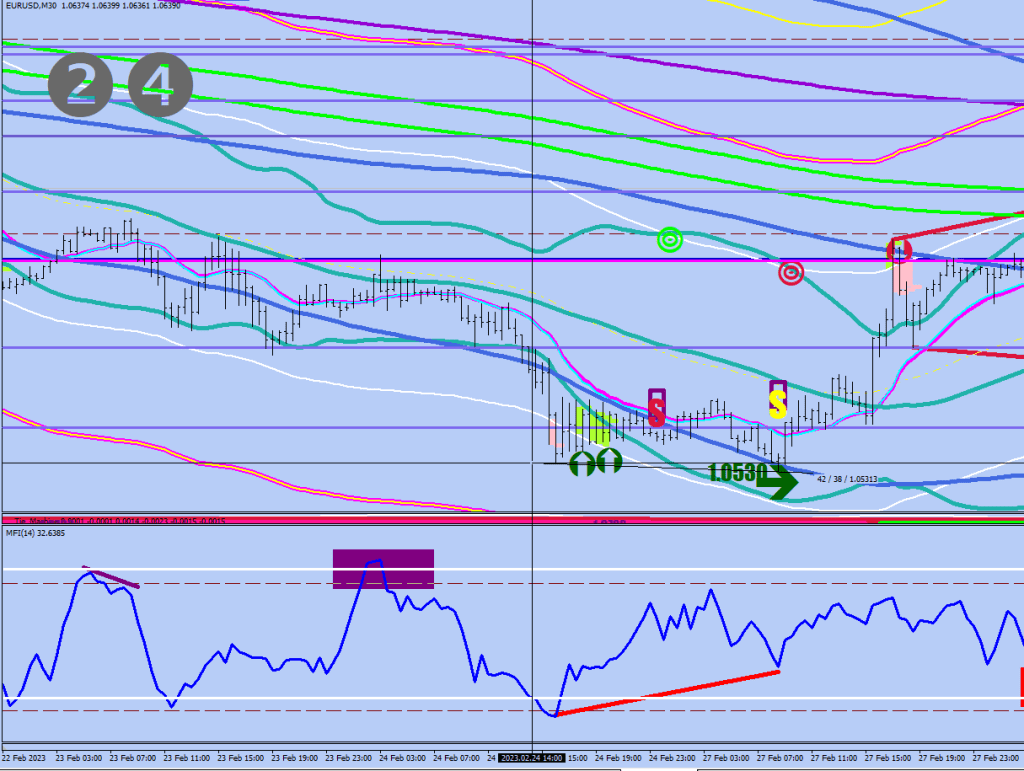
Time to discuss my take on the Risk Range.
I did not care to take on someone else’s existing system as per usual and made up my own from scratch.

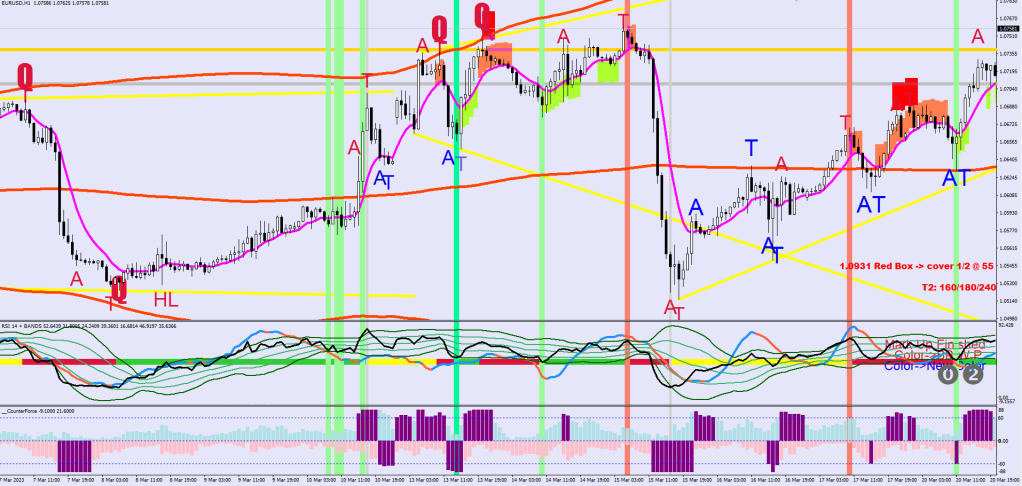
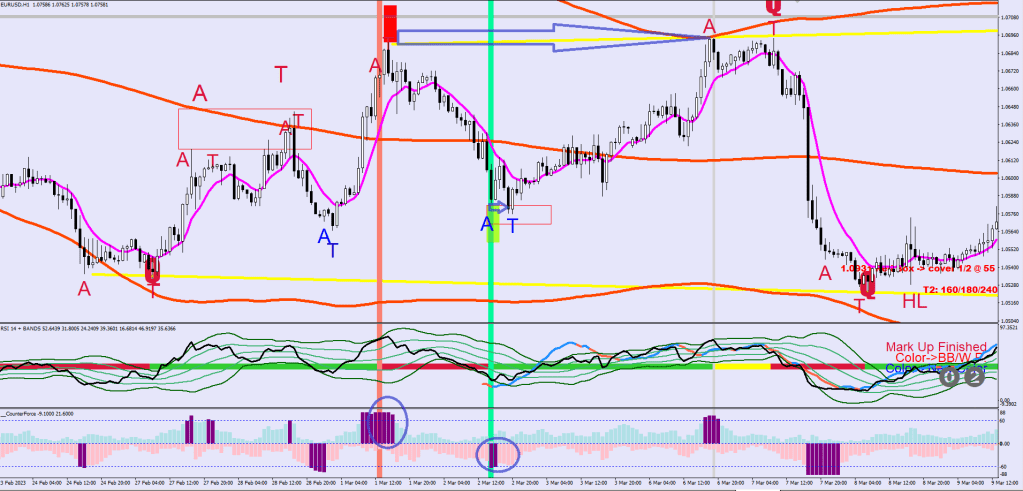
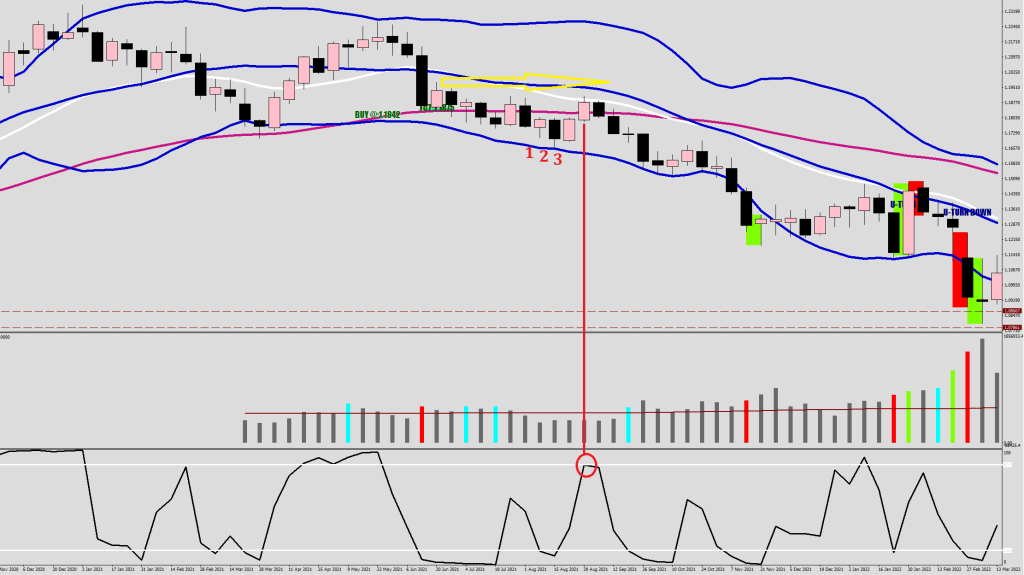
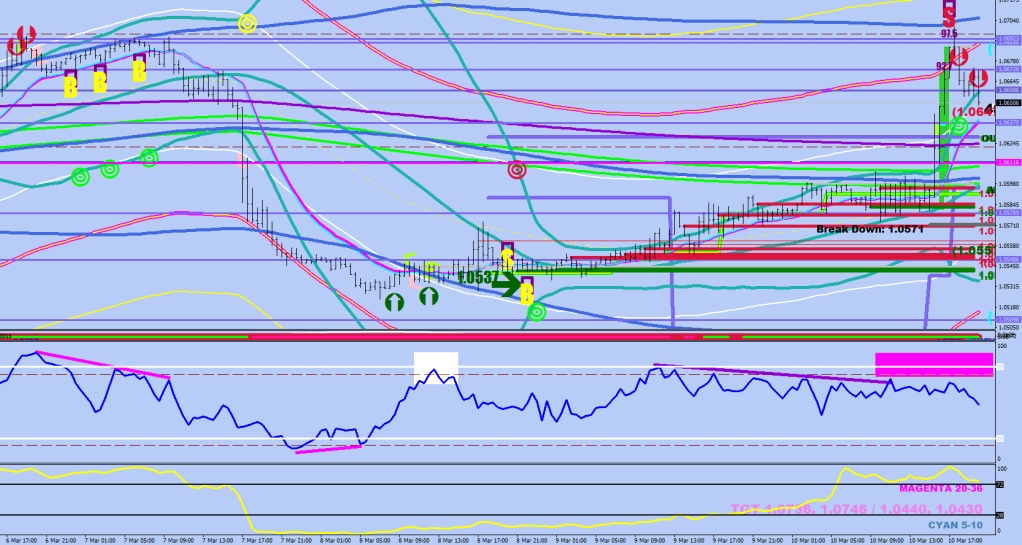
The violation typically happens in 2 steps. One 25+ pips stab into the displacement (20 pips from the trigger high / low) for a 45-pip fluctuation maximum proof. Then a pullback / dip back into the Risk Range for a Kiss Goodbye. I circled the adjustors below.
A lot of times you need to wait for a development to occur. If price is now back inside the risk range, what does that trigger in your head?
if (i>0 && (AVG[i]<AVG[i+2] || AVG[i]<AVG[i+1] || AVG[i]>AVG[i-1] || (AVG[i+2]<AVG[i+3] && AVG[i+3]<AVG[i+4]) ) && RSI[i]>RSI[i+2] && RSI[i]>RSI[i+1] && RSI[i]>RSI[i-1] && RSI[i]<upper[i]+2 && RSI[i]>main[i]+2 && Low[i]>iMA(NULL,0,8,0,MODE_EMA, PRICE_OPEN,i)-70*Point){
ObjectCreate(0,"TLine_1"+i,OBJ_TREND,indicator_window,Time[i],RSI[i],Time[i],105);
ObjectSetInteger(0,"TLine_1"+i,OBJPROP_RAY_RIGHT,false);
ObjectSet("TLine_1"+i,OBJPROP_COLOR,Crimson);
ObjectSet("TLine_1"+i,OBJPROP_WIDTH, 7);
ObjectSet("TLine_1"+i,OBJPROP_BACK, 1);
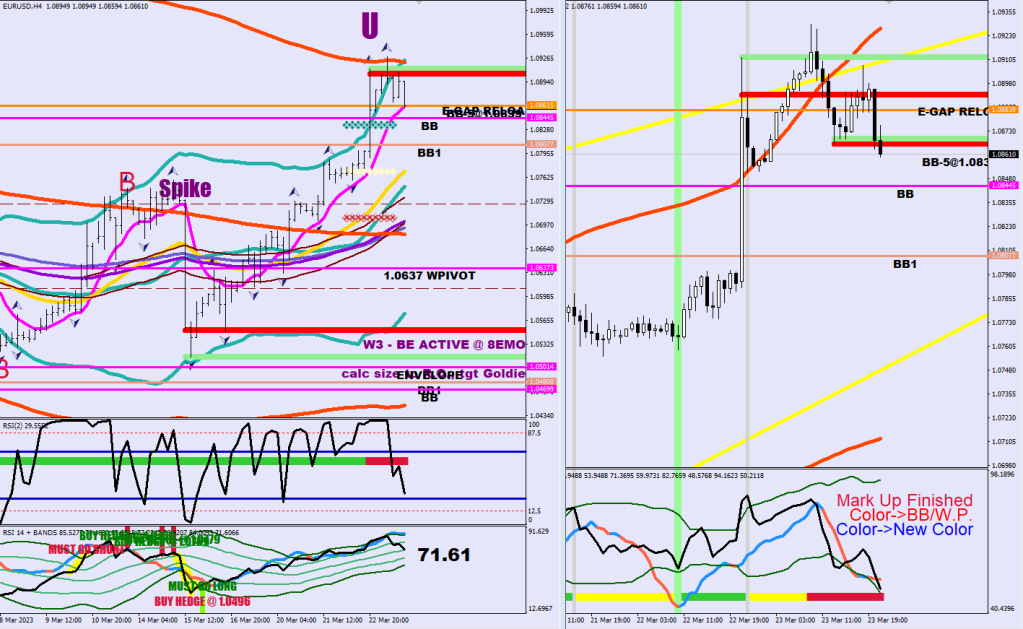
////Buy Stop Hedge
ObjectCreate("TLineyy"+DoubleToStr(i), OBJ_TEXT, indicator_window, Time[i], RSI[i]+19);
ObjectSetText("TLineyy"+DoubleToStr(i), "BUY HEDGE @ "+DoubleToStr(NormalizeDouble(iHigh(symbol,0,iHighest(symbol,0,MODE_HIGH,5,i))+200*Point,4),4), 13, "Impact", Green);
buyhedge = NormalizeDouble(iHigh(symbol,0,iHighest(symbol,0,MODE_HIGH,5,i))+200*Point,4);
Roffu[i]=buyhedge;
}
if (i>0 && (((AVG[i]>AVG[i+2] || AVG[i]>AVG[i+1] || (AVG[i+1]<AVG[i-1] && High[i]<iMA(NULL,0,8,0,MODE_EMA, PRICE_OPEN,i)+30*Point) ) && RSI[i+3]>RSI[i+1] && RSI[i]<RSI[i+2] && RSI[i]<RSI[i+1] && RSI[i]<RSI[i-1] && RSI[i]>lower[i]-2
&& ((RSI[i]<main[i]+2 && High[i]>iMA(NULL,0,8,0,MODE_EMA, PRICE_OPEN,i)-50*Point) || (RSI[i]<main[i]+1 && High[i]>iMA(NULL,0,8,0,MODE_EMA, PRICE_OPEN,i)-110*Point) || (RSI[i]<main[i] && High[i]<iMA(NULL,0,8,0,MODE_EMA, PRICE_OPEN,i)-140*Point))
&& (RSI[i]<30 || RSI[i]<lower[i] ) && Low[i]<iBands(symbol,0,30,2,0,PRICE_MEDIAN,MODE_LOWER,i))
||
(RSI[i]>lower2[i] && RSI[i+1]<lower2[i+1]))
&& Low[i]<iBands(symbol,0,216,2.5,0,PRICE_MEDIAN,MODE_MAIN,i)
&& Low[i]>Low[i+1]+30*Point
&& ((RSI[i+2]<lower2[i+2] && iStochastic(symbol,0,60,3,3,MODE_SMA,0,MODE_MAIN,i)>10) || iStochastic(symbol,0,60,3,3,MODE_SMA,0,MODE_MAIN,i+1)>35)
// && Low[i]>iBands(symbol,0,30,2,0,PRICE_MEDIAN,MODE_LOWER,i)
){
ObjectCreate(0,"TLine_1"+i,OBJ_TREND,indicator_window,Time[i],RSI[i],Time[i],0);
ObjectSetInteger(0,"TLine_1"+i,OBJPROP_RAY_RIGHT,false);
ObjectSet("TLine_1"+i,OBJPROP_COLOR,Chartreuse);
ObjectSet("TLine_1"+i,OBJPROP_WIDTH, 7);
ObjectSet("TLine_1"+i,OBJPROP_BACK, 1);
////Sell Stop Hedge
ObjectCreate("TLineyy"+DoubleToStr(i), OBJ_TEXT, indicator_window, Time[i], RSI[i]-9);
ObjectSetText("TLineyy"+DoubleToStr(i), "BUY HEDGE @ "+DoubleToStr(NormalizeDouble(iLow(symbol,0,iLowest(symbol,0,MODE_LOW,5,i))-200*Point,4),4), 13, "Impact", Crimson);
sellhedge = NormalizeDouble(iLow(symbol,0,iLowest(symbol,0,MODE_LOW,5,i))-200*Point,4);
Roffd[i]=sellhedge;
if (i>0 && RSI[i]<30){
ObjectCreate("Bacardix"+DoubleToStr(i), OBJ_TEXT, indicator_window, Time[i], lower2[i]+80*Point);
ObjectSetText("Bacardix"+DoubleToStr(i), "H @"+DoubleToStr(NormalizeDouble(iLow(symbol,0,iLowest(symbol,0,MODE_LOW,2,i-1)),4),4), 13, "Impact", Blue);
}
if (RSI[i]>lower2[i] && RSI[i+1]<lower2[i+1] && ((RSI[i+2]<lower2[i+2] && iStochastic(symbol,0,60,3,3,MODE_SMA,0,MODE_MAIN,i)>10) || iStochastic(symbol,0,60,3,3,MODE_SMA,0,MODE_MAIN,i+1)>35)){
ObjectDelete("TLiney"+DoubleToStr(i+2));
ObjectDelete("TLiney"+DoubleToStr(i+1));
ObjectCreate("TLiney"+DoubleToStr(i), OBJ_TEXT, indicator_window, Time[i], RSI[i]+5);
ObjectSetText("TLiney"+DoubleToStr(i), "MUST GO LONG", 13, "Impact", Green);
}(where AVG is the 5-sample average of a 14-sample MFI HL2)
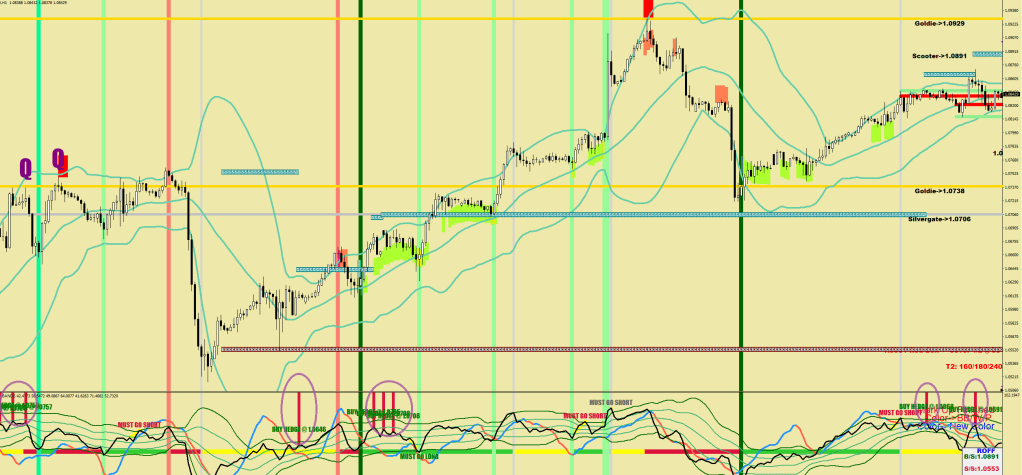
You are not going to have a whole lot of use gor the next part if you don’t use MT4, but I add some kitchen language interpretation too to give you some sense of creative data filtering. Symmetry is not the default. Whatever works is.
Examples:
Turning conditions
“2SD” RSI reading (plus minus 2) with absoulute value above 69 / below 15
Squeeze (31 wide) and RSI up to 5 over upper RSI BB
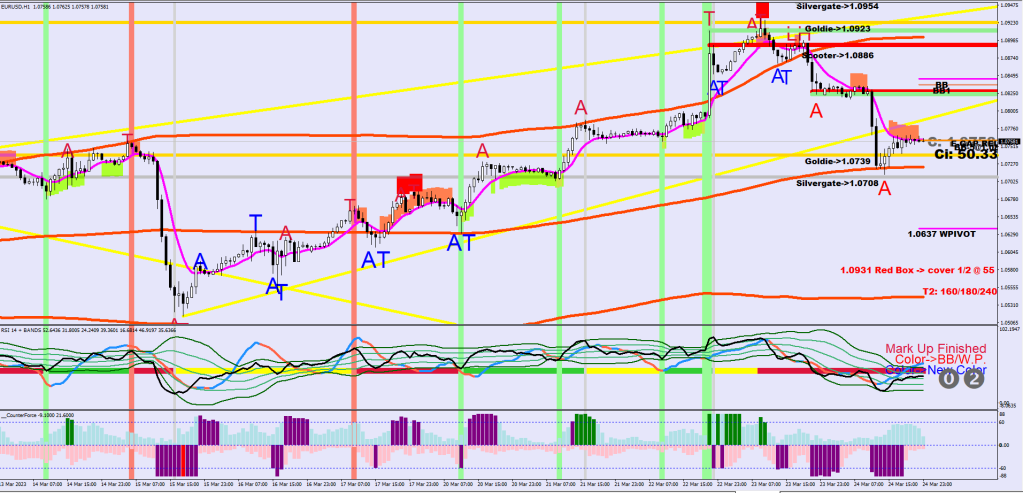
DARK GREEN 2HR MAX BRIEF BUYING BELOW 207L
High above 4H 216 BB 2.5, close back below (Scooter)
Positive acceleration during a nrgative episode (any length)
Max. 2Hrs of negative acceleration during a positive episode
The Highlighted part below is the Dark Green vertical condition.
if (Close[i]>iMA(symbol,0,207,0,MODE_EMA, PRICE_LOW,i) && Close[i+1]>iMA(symbol,0,207,0,MODE_EMA, PRICE_LOW,i+1) && Close[i+2]<iMA(symbol,0,207,0,MODE_EMA, PRICE_LOW,i+2)
   && Close[i+4]>iMA(symbol,0,207,0,MODE_EMA, PRICE_LOW,i+4) && Close[i+5]>iMA(symbol,0,207,0,MODE_EMA, PRICE_LOW,i+5)
 && Close[i+6]>iMA(symbol,0,207,0,MODE_EMA, PRICE_LOW,i+6) && Close[i+7]>iMA(symbol,0,207,0,MODE_EMA, PRICE_LOW,i+7) && Close[i+8]>iMA(symbol,0,207,0,MODE_EMA, PRICE_LOW,i+8)
  ){
  ObjectCreate("LOTUS"+IntegerToString(i),OBJ_VLINE,0, Time[i+1], 0);
      ObjectSet("LOTUS"+IntegerToString(i),OBJPROP_COLOR,clrDarkGreen);
      ObjectSet("LOTUS"+IntegerToString(i),OBJPROP_WIDTH,10);
      ObjectSet("LOTUS"+IntegerToString(i),OBJPROP_BACK,1);
      udir[i]=1;
}

 if ( RSI[i+1]>AVG[i+1] && (RSI[i+1]<lower2[i+1] || (RSI[i+1]<lower2[i+1]+2 && upper2[i]-lower2[i]<31)) && !(RSI[i]>AVG[i] && RSI[i]<lower2[i]) && Period()==60){
  ObjectCreate("LOTUS"+IntegerToString(i),OBJ_VLINE,0, Time[i+1], 0);
      ObjectSet("LOTUS"+IntegerToString(i),OBJPROP_COLOR,clrMediumSpringGreen);
      ObjectSet("LOTUS"+IntegerToString(i),OBJPROP_WIDTH,10);
      ObjectSet("LOTUS"+IntegerToString(i),OBJPROP_BACK,1);
      if (upper2[i]-lower2[i]<31) ObjectSet("LOTUS"+IntegerToString(i),OBJPROP_COLOR,clrPaleGreen);
      udir[i]=1;
 }
 else  if ( RSI[i+1]<AVG[i+1] && RSI[i+1]<lower2[i+1] && !(RSI[i]<AVG[i] && RSI[i]<lower2[i]) && Period()==60 && RSI[i+1]<15){
  ObjectCreate("LOTUS"+IntegerToString(i),OBJ_VLINE,0, Time[i+1], 0);
      ObjectSet("LOTUS"+IntegerToString(i),OBJPROP_COLOR,clrLightGray);
      ObjectSet("LOTUS"+IntegerToString(i),OBJPROP_WIDTH,5);
      ObjectSet("LOTUS"+IntegerToString(i),OBJPROP_BACK,1);
      if (udir[i+1]!=0) udir[i]=0; else udir[i]=1;
 }
 if (RSI[i]-5>upper2[i] && upper2[i]-lower2[i]<31 && Period()==60){
  ObjectCreate("LOTUS"+IntegerToString(i),OBJ_VLINE,0, Time[i+1], 0);
      ObjectSet("LOTUS"+IntegerToString(i),OBJPROP_COLOR,clrDarkGreen);
      ObjectSet("LOTUS"+IntegerToString(i),OBJPROP_WIDTH,10);
      ObjectSet("LOTUS"+IntegerToString(i),OBJPROP_BACK,1);
      if (upper2[i]-lower2[i]<31) ObjectSet("LOTUS"+IntegerToString(i),OBJPROP_COLOR,clrPaleGreen);
      udir[i]=1;
 }
 if (High[i]>iBands(symbol,0,864,2.5,0,PRICE_MEDIAN,MODE_UPPER,i) && Close[i]<iBands(symbol,0,864,2.5,0,PRICE_MEDIAN,MODE_UPPER,i)) udir[i]=-1;


  if (RSI[i+1]>69 && RSI[i+1]<AVG[i+1] && RSI[i+1]+2>upper2[i+1] && !(RSI[i]<AVG[i] && RSI[i]+2>upper2[i]) && Period()==60 && RSI[i+1]-5<upper2[i+1] && RSI[i+3]-5<upper2[i+3]){
  ObjectCreate("LOTUS"+IntegerToString(i),OBJ_VLINE,0, Time[i+1], 0);
      ObjectSet("LOTUS"+IntegerToString(i),OBJPROP_COLOR,clrSalmon);
      ObjectSet("LOTUS"+IntegerToString(i),OBJPROP_WIDTH,10);
      ObjectSet("LOTUS"+IntegerToString(i),OBJPROP_BACK,1);
      udir[i]=-1;
 }
 else if (RSI[i+1]>69 && RSI[i+1]>AVG[i+1] && RSI[i+1]+2>upper2[i+1] && !(RSI[i]>AVG[i] && RSI[i]+2>upper2[i])&& Period()==60  && RSI[i+1]>75){
  ObjectCreate("LOTUS"+IntegerToString(i),OBJ_VLINE,0, Time[i+1], 0);
      ObjectSet("LOTUS"+IntegerToString(i),OBJPROP_COLOR,clrLightGray);
      ObjectSet("LOTUS"+IntegerToString(i),OBJPROP_WIDTH,5);
      ObjectSet("LOTUS"+IntegerToString(i),OBJPROP_BACK,1);
      if (udir[i+1]!=0) udir[i]=0; else udir[i]=-1;
 }
   if (udir[i]<0 && ExtATRBuffer3[i]==EMPTY_VALUE && ExtATRBuffer3[i+1]!=EMPTY_VALUE && MathAbs(ExtATRBuffer2[i+1])>MathAbs(ExtATRBuffer[i+1])){
      ObjectCreate("Aterab"+IntegerToString(i), OBJ_RECTANGLE, 0, Time[i+3], iHigh(symbol,0,iHighest(symbol,0,MODE_HIGH,7,i+1)), Time[i], iHigh(symbol,0,iHighest(symbol,0,MODE_HIGH,7,i+1))+250*Point);
               ObjectSetInteger(0,"Aterab"+IntegerToString(i),OBJPROP_COLOR,clrRed);
               ObjectSet("Aterab"+IntegerToString(i),OBJPROP_WIDTH,3);
               ObjectSet("Aterab"+IntegerToString(i),OBJPROP_BACK,1);
               redbox = iHigh(symbol,0,iHighest(symbol,0,MODE_HIGH,7,i+1))+20*Point;
 }
   if (udir[i]>0 && ExtATRBuffer3[i]==EMPTY_VALUE && ExtATRBuffer3[i+3]==EMPTY_VALUE && ExtATRBuffer3[i+1]!=EMPTY_VALUE && MathAbs(ExtATRBuffer2[i])<MathAbs(ExtATRBuffer[i])){
      ObjectCreate("Aterab"+IntegerToString(i), OBJ_RECTANGLE, 0, Time[i+3], iLow(symbol,0,iLowest(symbol,0,MODE_LOW,7,i+1)), Time[i], iLow(symbol,0,iLowest(symbol,0,MODE_LOW,7,i+1))-250*Point);
               ObjectSetInteger(0,"Aterab"+IntegerToString(i),OBJPROP_COLOR,clrGreenYellow);
               ObjectSet("Aterab"+IntegerToString(i),OBJPROP_WIDTH,3);
               ObjectSet("Aterab"+IntegerToString(i),OBJPROP_BACK,1);
 }
Now you know where I got the idea for the Roff Trading logo.
Things are evolving still. I tried to cram too much into one post, I know & I’m sorry for that.

Somewhere, over the Brembo.
I’m undependable.
But I am convincible.
This was the Daniella can’t bone me show.
When the Media Ocean was moving to a different floor, they pushed the office printer into the shower. I felt bad for not taking a picture of it to send it to my daughter, saying “Printing in the shower.” I still do.