If you still have some faith in the idealistic Elliott Wave theories, abandon now or forever be entertained by this Rocky Horror Picture Show.
Wave 1 down is Wave 2 down.
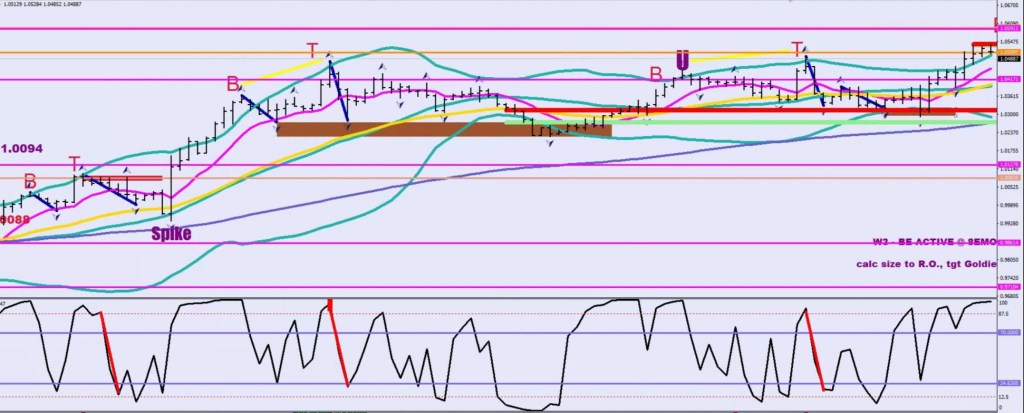
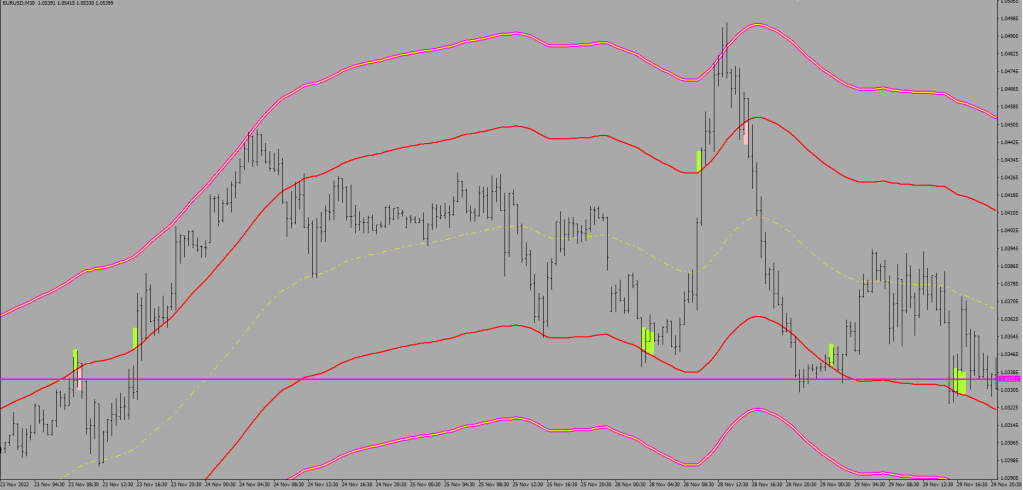
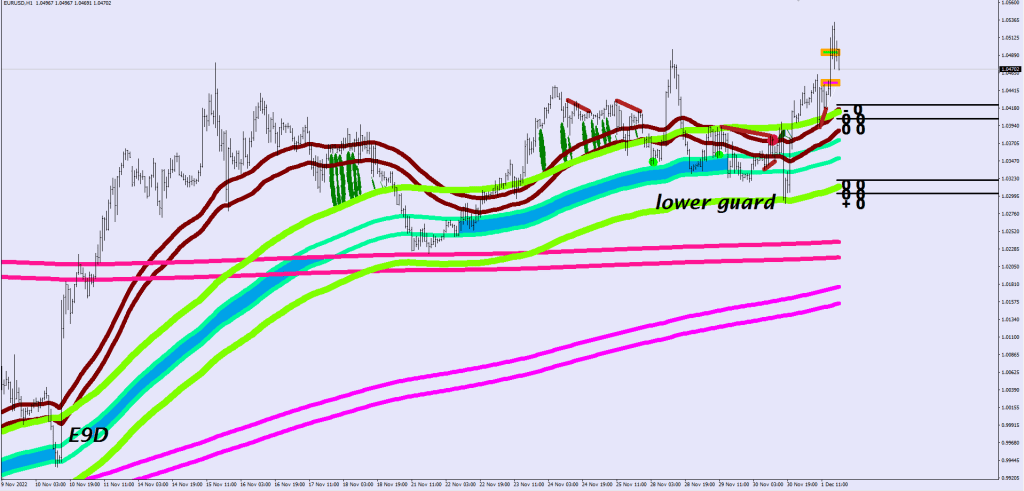
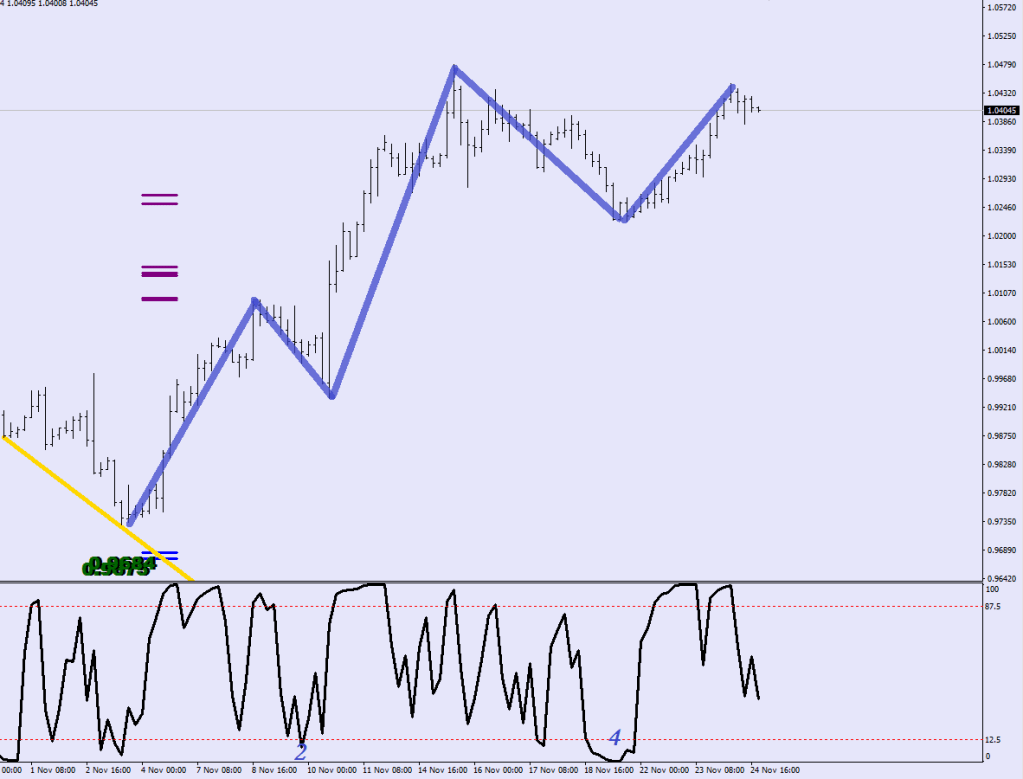
3 examples from this recent run up.
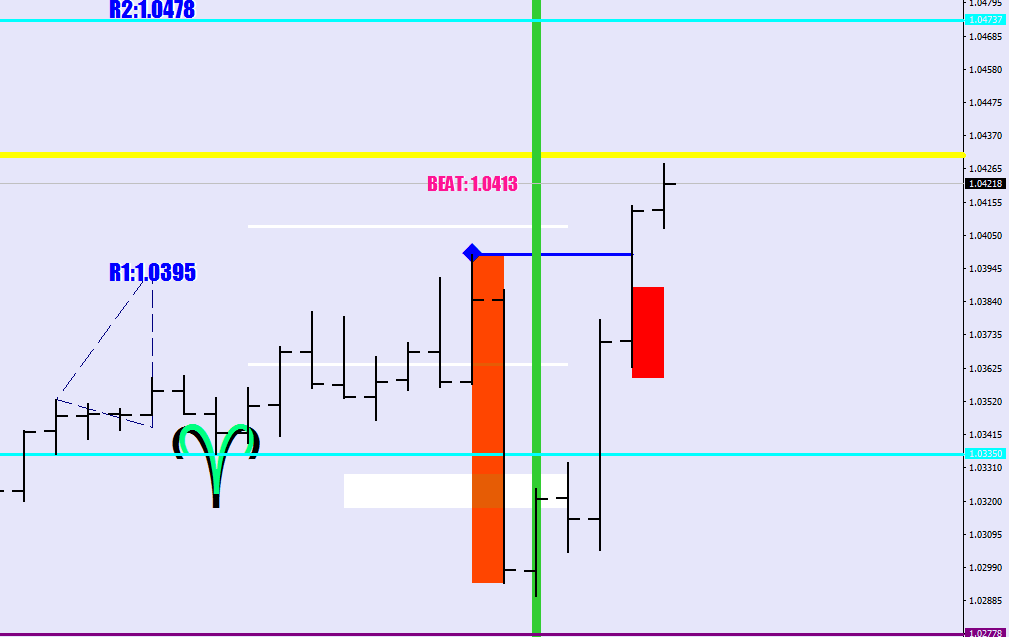
Meet the Baritonos & the T.R.A. voltage.
The Baritonos Beat at the knee cap.
The TRA voltage is a power surge.
Good eye, Septic! The last TRA did not make it outside the 30-samp BB. The front row is yours.
My mistake was trying to find a Wave 2 up when all Wave 2s were printing down.
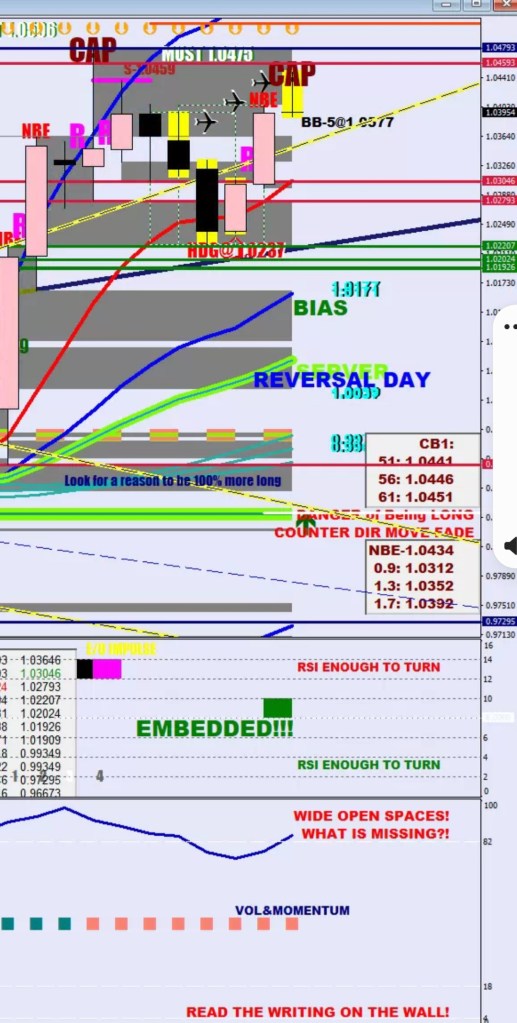
CAP means Capiche?! Wirklich!
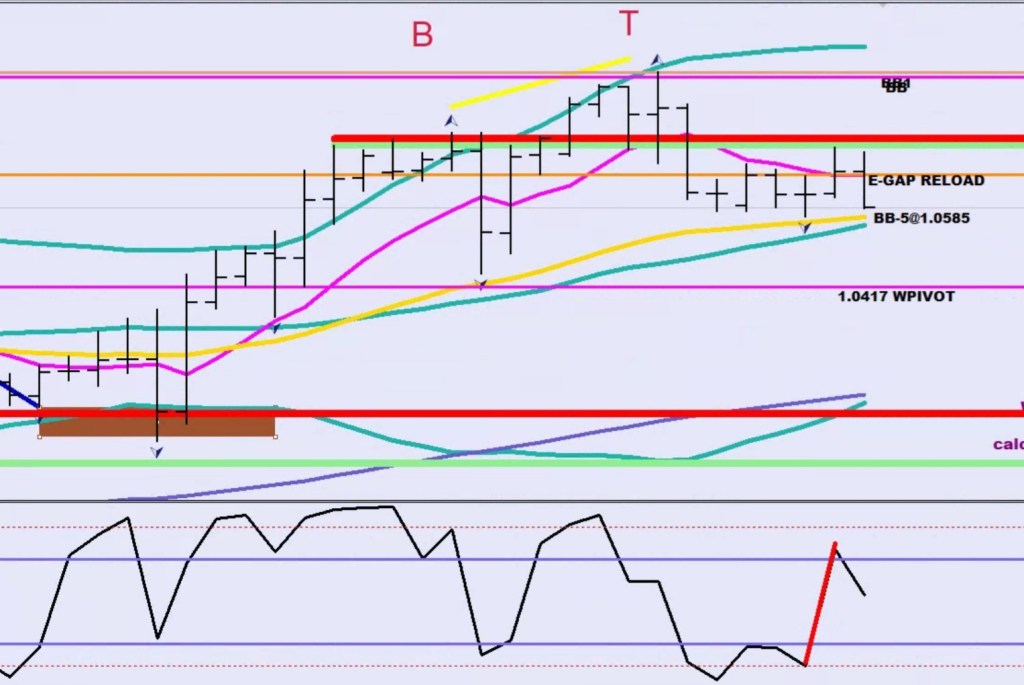
You ain’t seen nothing yet. Behold the market trending lower with a bullish wave count.
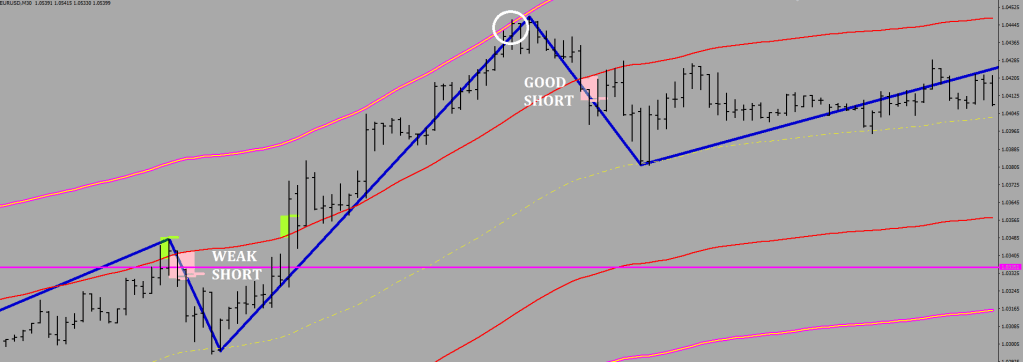
So let’s define the final thrust.
The FT is a Wave 1 attempt in the prevailing direction. It is a clash of volatilities, it is a contract for the rights of the movie sequel. The second part / the counter move (prospect Wave 2) gives or denies the approval for drumming up enough funds. The shooting starts when the dirt box arrives with a ton of cash raised from selling Puregold sculptures.
Cure? You knew it was coming.
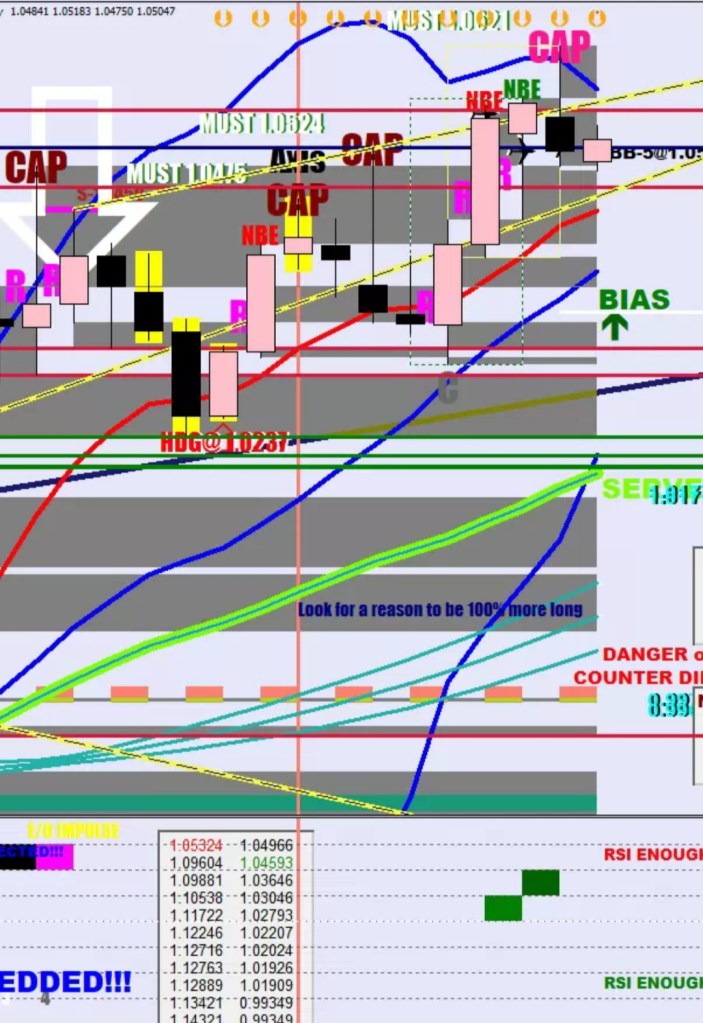
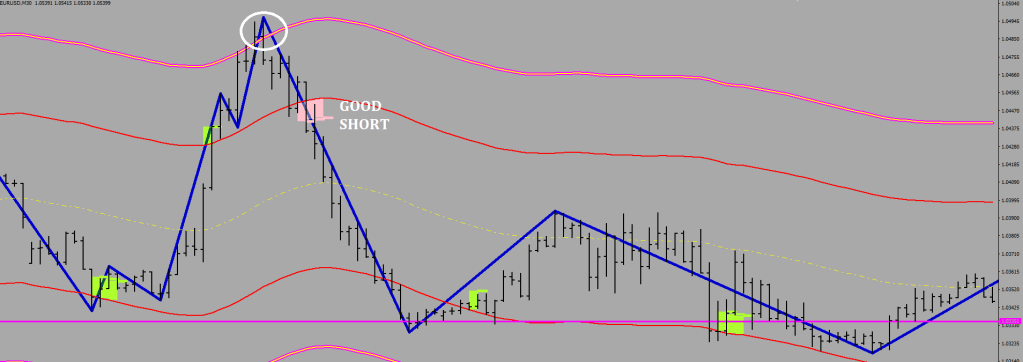
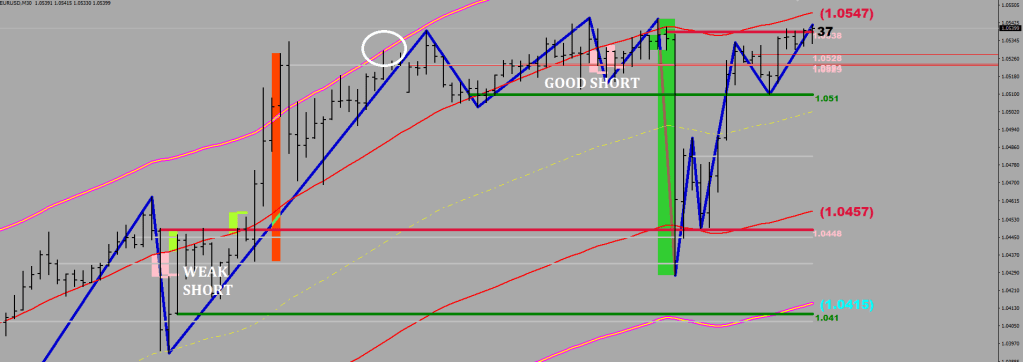
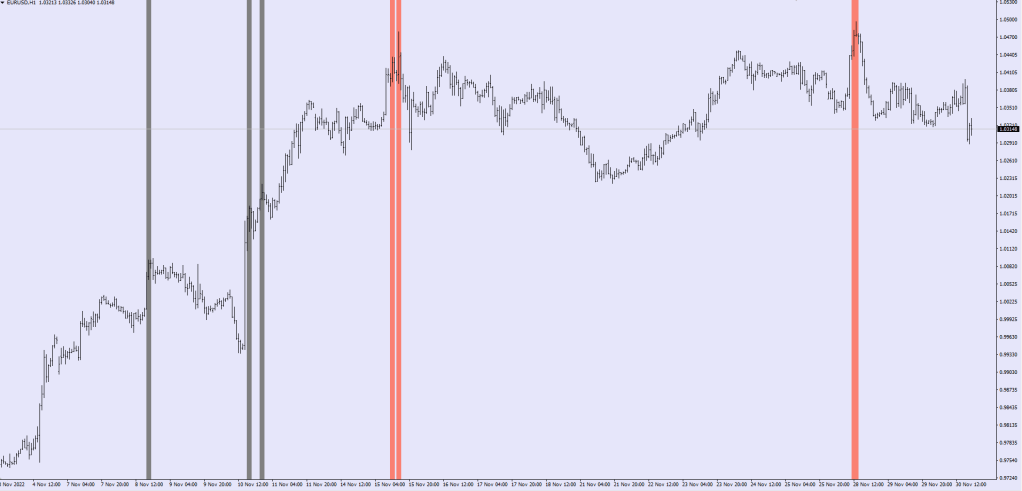
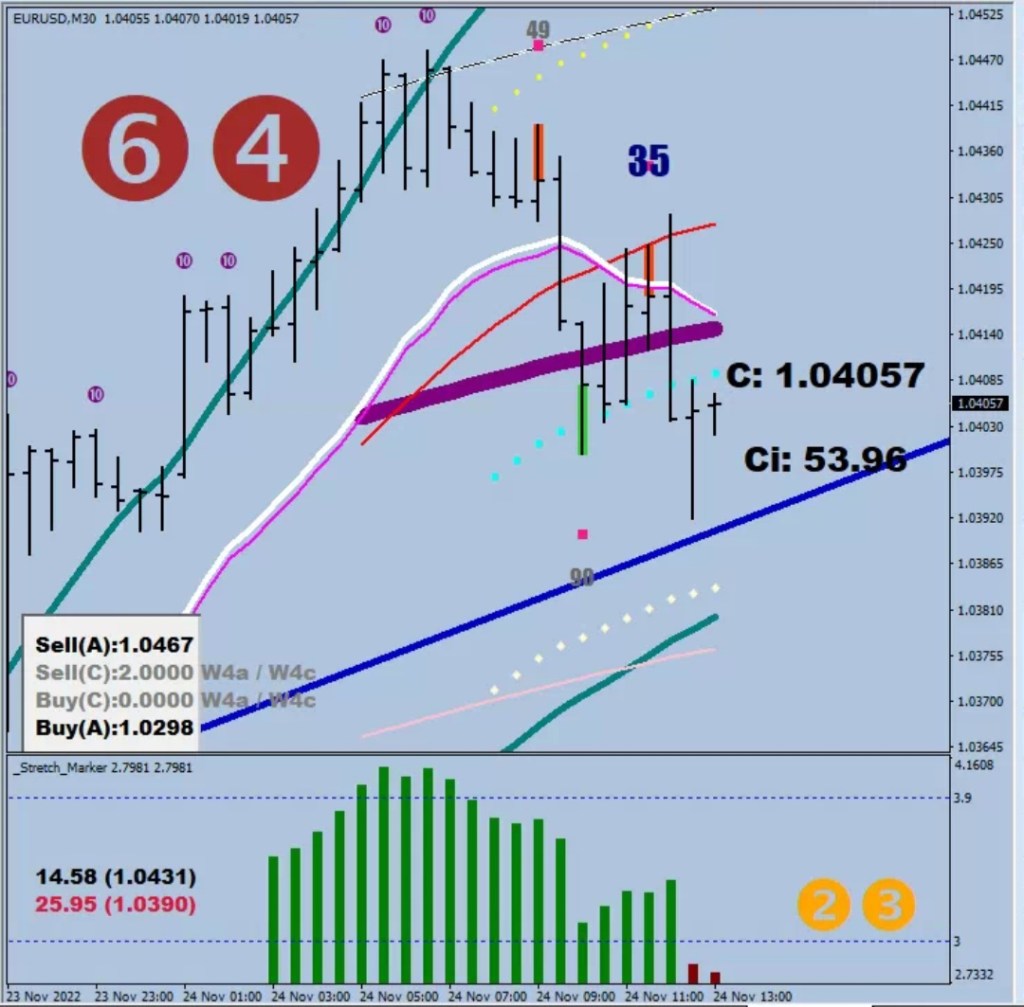
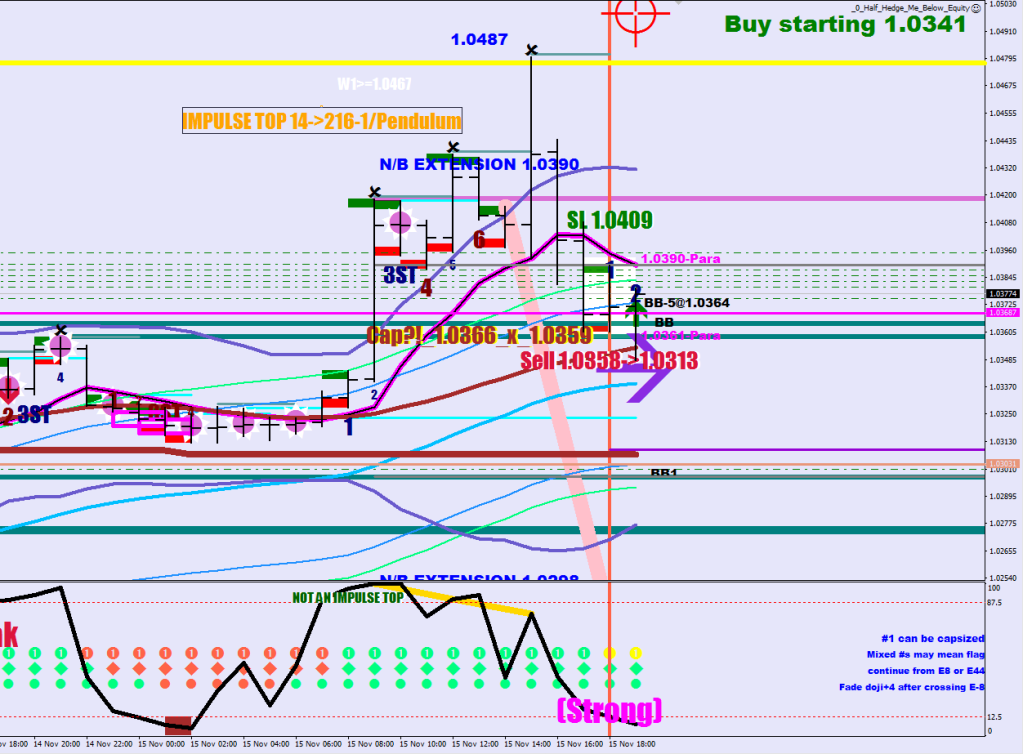
Just an interesting picture showing the buy triggers tripped whilst the sell trigger got rained on.
The way these operate is that the small wire gets tripped and up to 30-pips there’s a block for additional chunks to add. An accummulation box, yes. Nothing is guaranteed, but even the weakest signal should take price to the next Axel H line. E32 in this case.
Make it, or take it.
Santa Kraus is going to drown.
In a world, where you could be anything, don’t be a summa cum laude Pascal Programmer whom finished in 1992.
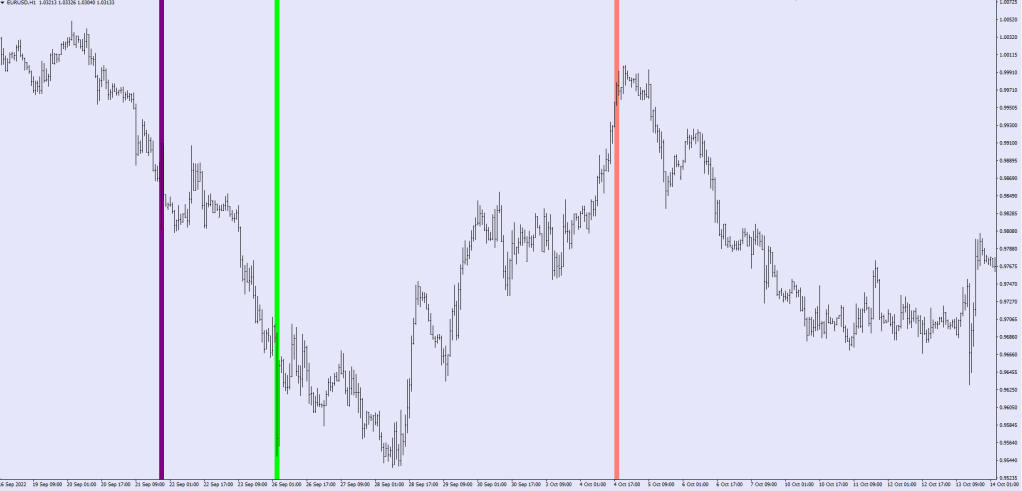
Could you spot the very first Wave 2 up since the 10th of October?
If I were a top notch trader, I would start reading what I write.
From Meet The 3000 – 04th of November>
From Commuter Market? – 13th of November>
50% target filled.
What makes the commuter market commuter? The long term commute. The train like behavior VS the pendulum like.
Notice that the market only achieves stretches on the upside (typically 4x), then returns to the mean and never gets below the lower guard rail, which is a 1x stretch.
So, better definitions first. Decisive move.
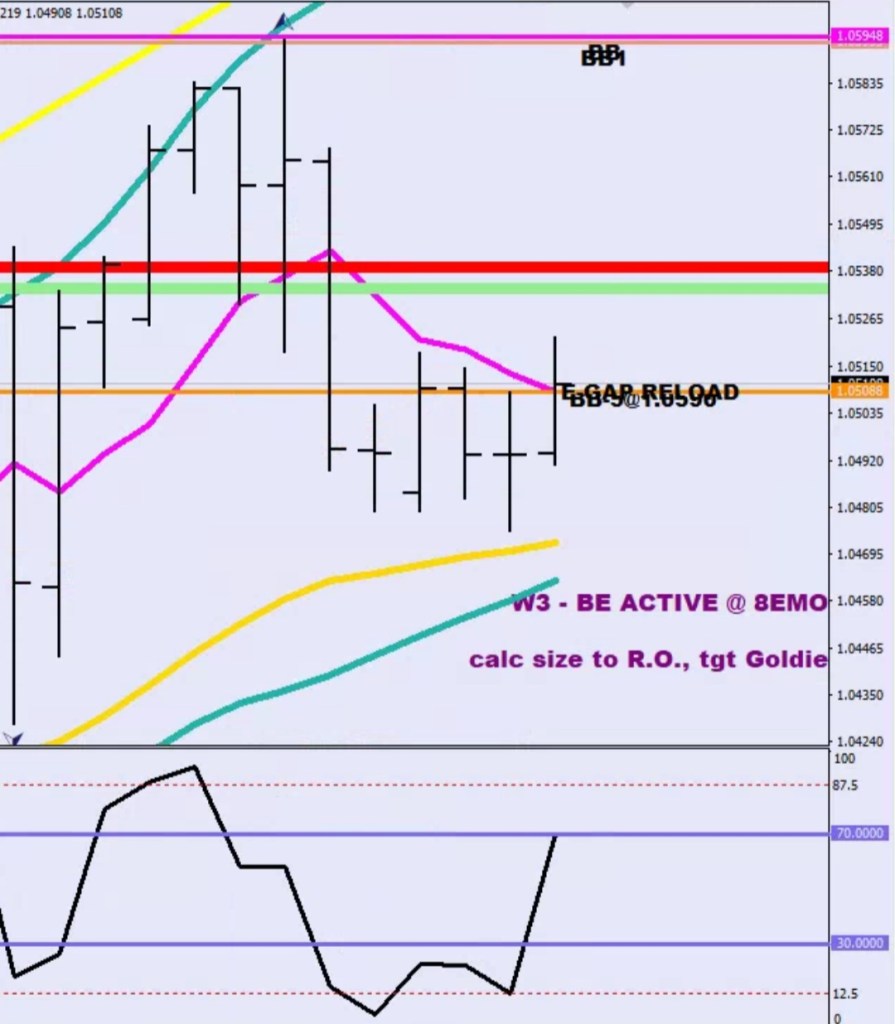
(Goldie Locks yellow for target)
I was on the verge of saying it right yesterday.
I mentioned that a Decisive move is expected to have a 35-pip kick back.
What I really should had said was, if you see a pullback greater than 35 pips, then the Decisive move is voided.
At 40 pips I should had invested in the counter move. Yesterday and today was not an opportunity to suffer a 5k draw down, but to make 8k on a hedge position.
If you know what is a must for hedging, then you know what is worth trading.
The expected kick-back on a mega candle is (160+ pips in 2 hours) is 55 pips
PRIMARY W1 IS AN RSI2 WEDGE – CONTRACTION W/3 HUMPS W1: FADE @ STRATOSPHERE, CH TGT, tgt E32 & S30 W2: RED TO BLUE 4H RSI2, 1.8SD ->2+SD 1H W3: NO COUNTER VOL RUN: BE ACTIVE, ADD & 8EMO, CALC SIZE FROM R.O. LEVEL W4: MEASURING LEG(V) + DIVERGENT LEG (V+) W4: RED TO BEAT OF W2 / RED TO RED W4: TARGET (NEAR MISS) W2 TERMINAL / H4-2SD-RSI / WPIVOT E4-32, TRAIL @ H4-EMO W4 HAS TYPICALLY 80-110 LENGTH A W4 CAN END UP BECOMING A 4H DRIVEN THRUST, SO ONLY START FADING AT 110 PIPS – PAY ATTENTION TO THE SQUEEZE BREAK OUT W4 DRIVEN THRUST (MAX VOLATILITY) 160-190 PIPS ANY WAVE5 CAN BECOME ESCALATED TO AN END GAME
///////////Downside Thrust

  if (Close[i]>iBands(symbol,0,30,2,0,PRICE_MEDIAN,MODE_LOWER,i)-100*Point && Low[i+2]<iBands(symbol,0,30,2,0,PRICE_MEDIAN,MODE_LOWER,i+2)-120*Point && Low[i+2]>iBands(symbol,0,30,2,0,PRICE_MEDIAN,MODE_LOWER,i+2)-960*Point && Low[i+2]<iLow(symbol,0,iLowest(symbol,0,MODE_LOW,95,i+3))
  && Close[i+4]>iBands(symbol,0,30,2,0,PRICE_MEDIAN,MODE_LOWER,i+4)-100*Point && iStochastic(symbol,0,60,3,3,MODE_SMA,0,MODE_MAIN,i+2)>2

// small decline of bands, 8EMA back 56-64 pips && daily stochastic greater than deeply oversold
 && (( (iBands(symbol,0,30,2,0,PRICE_MEDIAN,MODE_LOWER,i+14)-iBands(symbol,0,30,2,0,PRICE_MEDIAN,MODE_LOWER,i+2))<200*Point
 && iMA(symbol,0,8,0,MODE_EMA, PRICE_OPEN,i+2)+640*Point>Low[i+2]
 && iMA(symbol,0,8,0,MODE_EMA, PRICE_OPEN,i+2)-560*Point>Low[i+2]
 && iStochastic(symbol,0,60,3,3,MODE_SMA,0,MODE_MAIN,i+2)>9 && iStochastic(symbol,0,60,3,3,MODE_SMA,0,MODE_MAIN,i+2)<19)
 ||
// tight bands
 (((iBands(symbol,0,30,2,0,PRICE_MEDIAN,MODE_UPPER,i+2)-iBands(symbol,0,30,2,0,PRICE_MEDIAN,MODE_LOWER,i+2))<540*Point && Close[i+2]>iBands(symbol,0,30,2,0,PRICE_MEDIAN,MODE_LOWER,i+2)
// or oversold RSI14 and not deeply oversold stochastic (wave 3 beat)
 || (iRSI(symbol,0,14,PRICE_MEDIAN,i+2)<20 && iStochastic(symbol,0,60,3,3,MODE_SMA,0,MODE_MAIN,i+2)>10)


//or stoch coimg out of deeply oversold, above 8
|| (iStochastic(symbol,0,60,3,3,MODE_SMA,0,MODE_MAIN,i+2)>8 && iStochastic(symbol,0,60,3,3,MODE_SMA,0,MODE_MAIN,i+2)>iStochastic(symbol,0,60,3,3,MODE_SMA,0,MODE_MAIN,i+3) && iStochastic(symbol,0,60,3,3,MODE_SMA,0,MODE_MAIN,i+3)>iStochastic(symbol,0,60,3,3,MODE_SMA,0,MODE_MAIN,i+4) && Low[i+2]<iBands(symbol,0,216,2.5,0,PRICE_MEDIAN,MODE_LOWER,i+2))
)

// 8-EMA at least 19 pips above BB
 && iMA(symbol,0,8,0,MODE_EMA, PRICE_OPEN,i+2)-iBands(symbol,0,30,2,0,PRICE_MEDIAN,MODE_LOWER,i+2)>190*Point ))
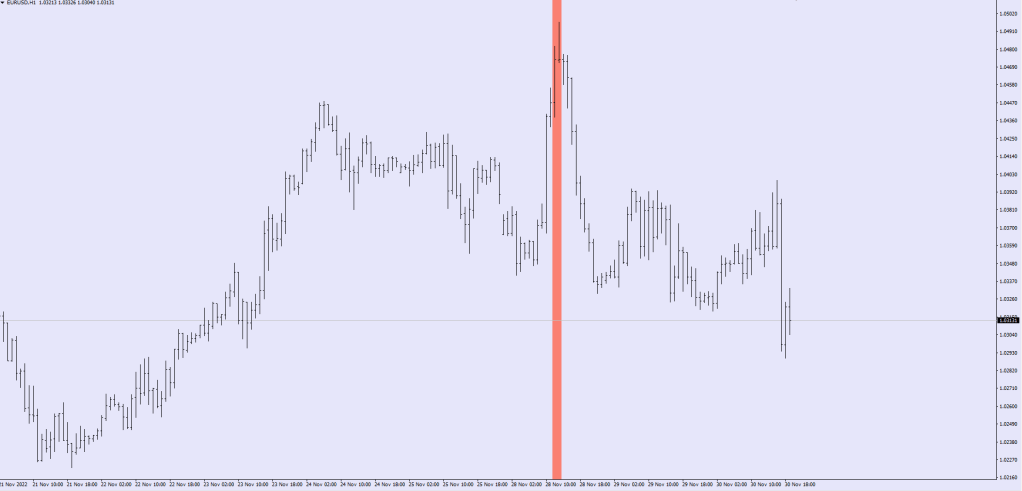
There is one thing that can interfere with a U print, and that is the wave count.
The C leg of the correctice wave up was still missing.
Lots of traps were set for maximum damage.
The gap down made people cover shorts.
The break of the low made people take a loss on gapfill attemot longs. The shorts initiated at any point got killed with the violent run up to beyond the swing high. For good measure those in the know added at the 8EMO and the upper stratosphere bow backs.
This year has been brutal and it is not over yet.
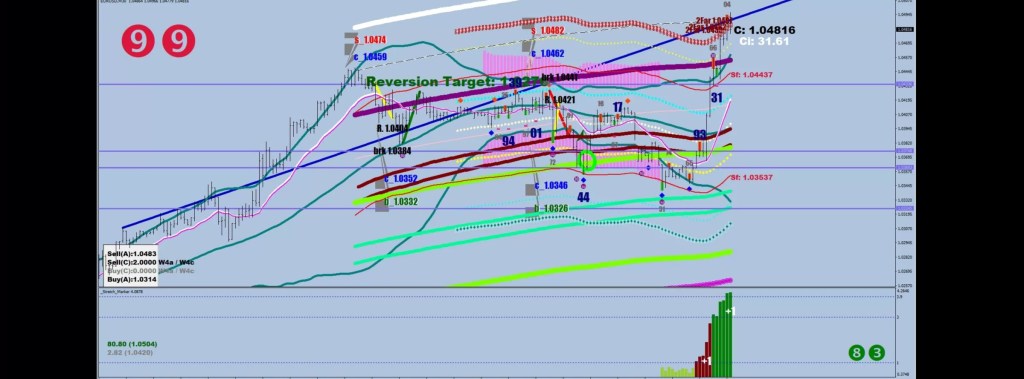
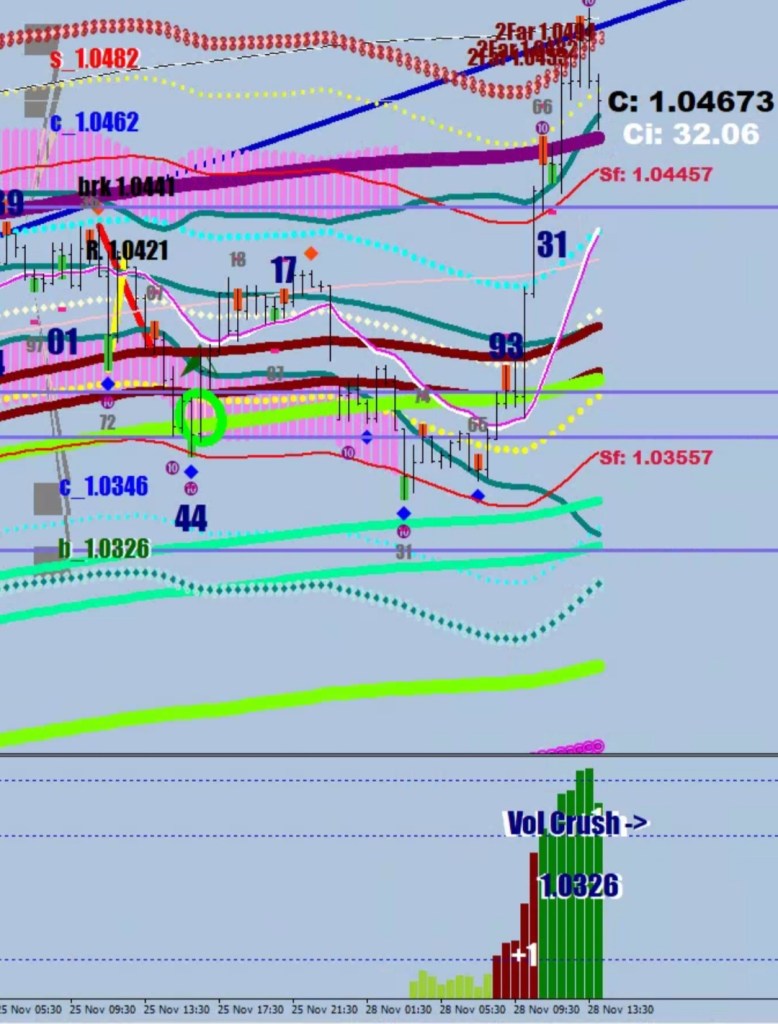
The blue trendline got its requisite re-visit and the 4x stretch from the E9D was achieved once again.
I was busy trying to spot a wave 2 up instead of paying attention to the c_ cover level of the cotrection.
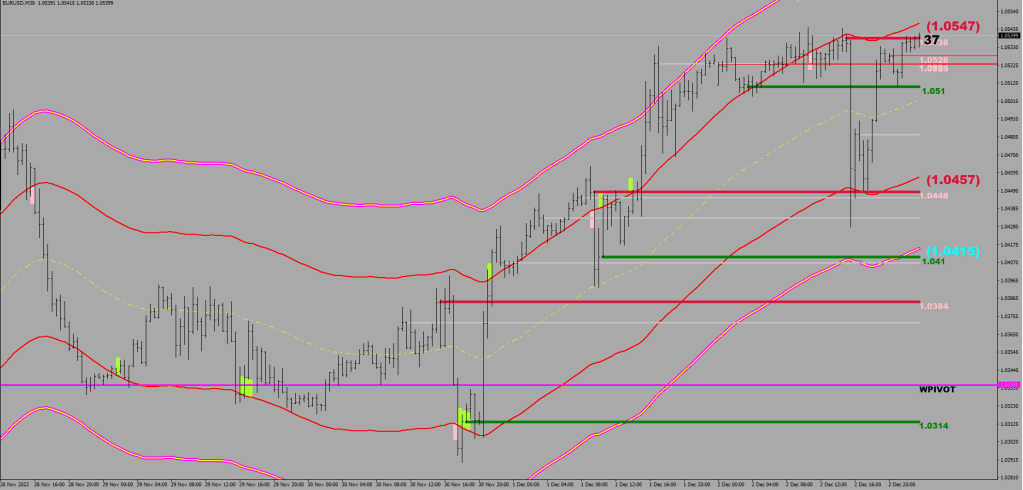
The s_ sell level was at 1.0482 – see image.
Sf = sztratoszfera, Sphinx = Szfinx
Look at how the slightest dip below the lower SF line was bought 2x
The U must arrive on cue or picture some moratorium when the print appears. 50 pips or so.
Until that Wave 2 up prints, the attrocities may not have ended.
Will insert some Pyramid images at home to add something in the title’s theme>
Projected distance of Wave A -> extension fill of Wave C
Communism. Rodolfo, the Hungarian illusionist is smuggling things through the custom by slipping them into the agent’s pockets for the tap down and stealing back them afterwards.
A primary Wave 2 takes the RSI2 from a Red to a Blue (or at least tries for 3 times) – in red.
Adolfo after putting things into the primary Wave 2 pocket and then with a primary Wave 4 returning to look at the scene of the crime from a close proximity. After walking off briefly if Dolfie changes his mind and decides to reach into the pocket, with the power of surprise, he can run off with a secondary wave count.
Interestingly, the secondary wave counts may come with the secondary Wave 3 becoming the furthest point and Wave 5 falling short of it, as the image ballustrates.
The brown bags are the dirt pockets. The secondary wave count ends in the Utmost condition. There is no tertiary wave count.
The dirt pockets can be 15-50 pips deep, but normally would cap out at 36. Of course you knew all this without my hilfe.
Let’s switch to the Marketing Research department.
Would you like some marketing?
Some driftwood maybe? It’s a Tokyo drift!
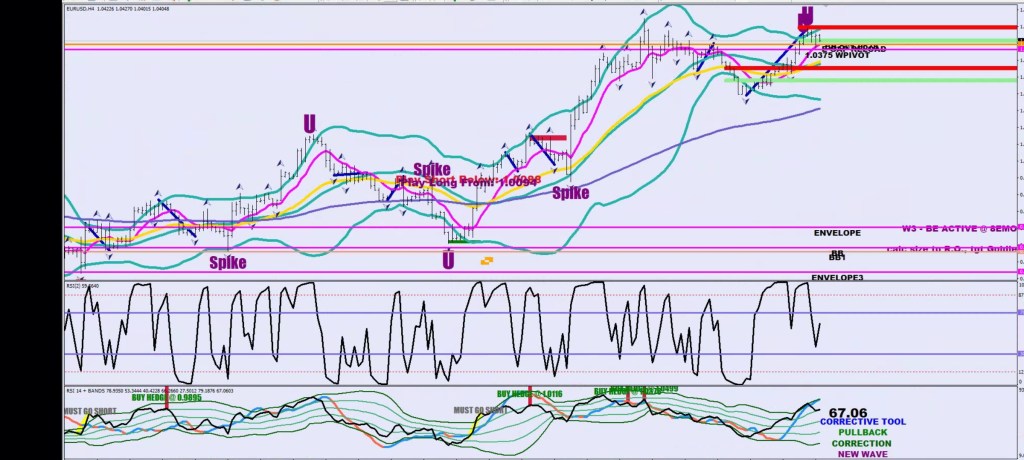
First thing’s thirst: the wave structure.
After a prolonged Wave4 down, a Wave5 corrective up, swimming against momentum with a driven thrust.
The momentum has been down since the CAP print. Counter momentum moves cap out in the low two hundred-X’s.
Conclusion: an End Game can get receive a temporary stop with a reversal divergence, but only the utmost condition seals the deal air tight.
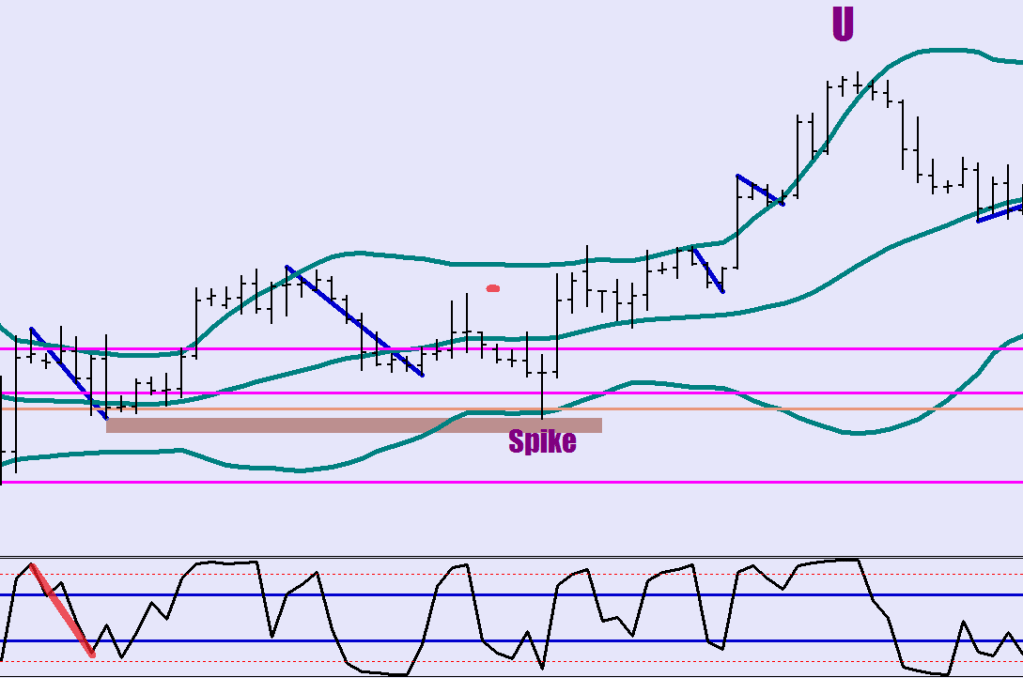
U, U and U Peter are the utmost ones.
You can bet on a higher high out of this Wave5, but I won’t be joining you on that one.
How can a corrective wave be made out of 5 sub waves?
There are two larger, increasing breaks in the counter movement volatility.
Gonna get drafted
Red, red line. Stay close to me.
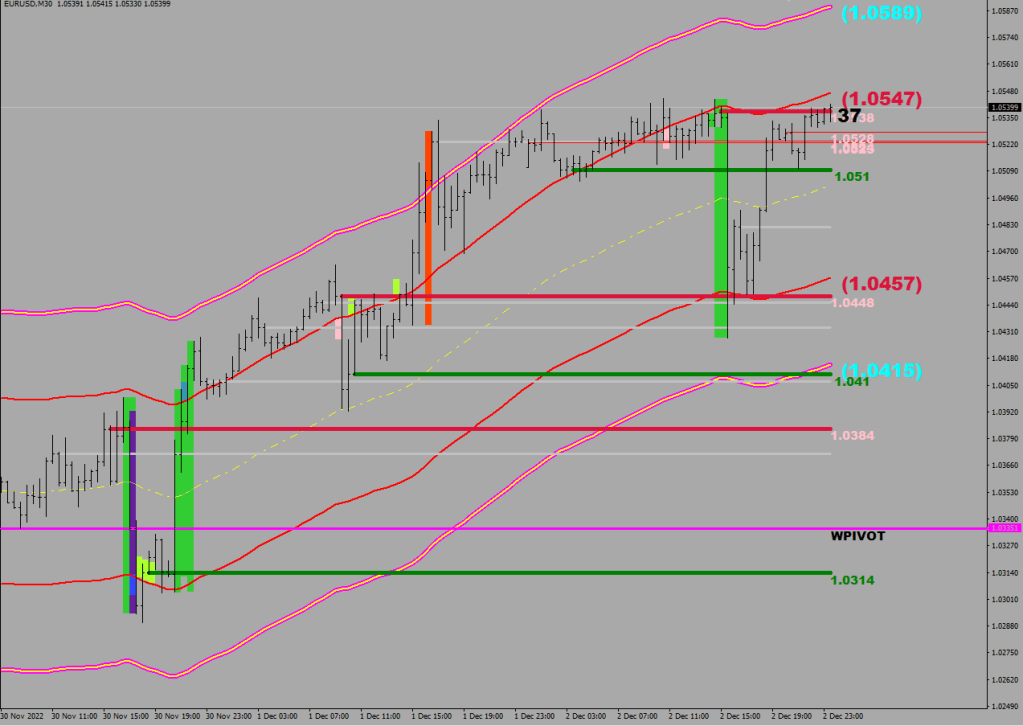
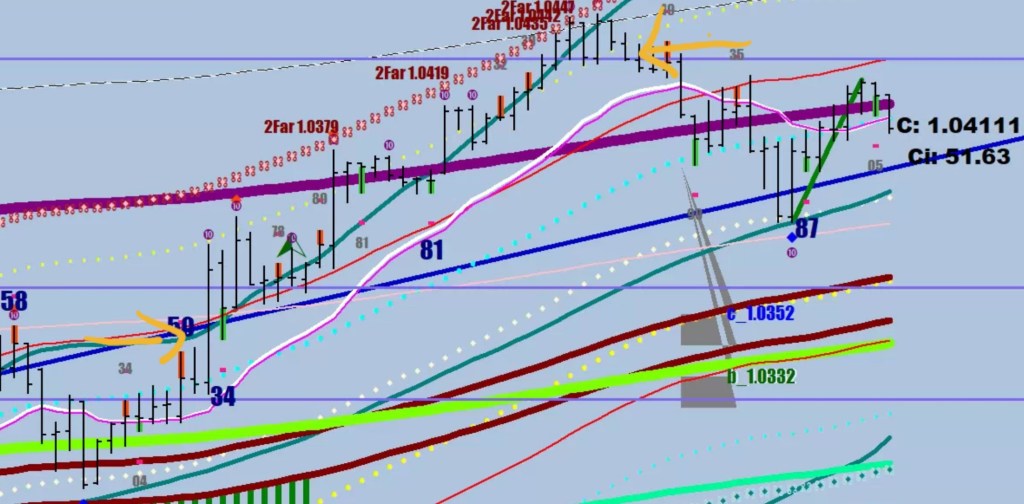
This, 45 pips displacement of the E32 is the separation in the sky. The stratosphere beyond and the atmosphere within. Image shows returning into the atmosphere & having no escaping speed on the way up. Wave 1 & Wave 3 are the stage 1 & stage 2 making sure that Wave 5 would be light enough to reach escaping velocity.
Below the first yellow arrow shows where at the beginning of wave5 of Wave5 the price gets lifted into the stratosphere, then the ride along the Grollier band comes to an end at the second yellow arrow after two 30-min closes back inside.
1st leg landed on the E32 precisely.
Novum / stretch marker changes:
The bottom left 10-sample max distance from the EMO8 and the bracketed perceived resistance & support levels based on this data. “Volatility/couter volatility”
deletetxt1("Libec");

i=0;
while(i<10){
   if (High[i]-iMA(NULL,0,17,0,MODE_EMA, PRICE_MEDIAN,i)>rou) rou=High[i]-iMA(NULL,0,17,0,MODE_EMA, PRICE_MEDIAN,i);
   if (iMA(NULL,0,17,0,MODE_EMA, PRICE_MEDIAN,i)-Low[i]>rod) rod=iMA(NULL,0,17,0,MODE_EMA, PRICE_MEDIAN,i)-Low[i];
i++;
}

  ObjectCreate("Libec"+4,OBJ_LABEL,indicator_window, 0,0);
   ObjectSetText("Libec"+4, DoubleToStr(rou*10000,2)+" ("+DoubleToStr(iMA(NULL,0,17,0,MODE_EMA, PRICE_MEDIAN,0)+rou,4)+")", 11, "Arial Black", DarkViolet);
  ObjectSet("Libec"+4,OBJPROP_CORNER,2);
    ObjectSet("Libec"+4,OBJPROP_XDISTANCE,20);
  ObjectSet("Libec"+4,OBJPROP_YDISTANCE,67);
  if (rou>rod) ObjectSet("Libec"+4,OBJPROP_COLOR,clrDarkGreen);
  else if (rou<.0010) ObjectSet("Libec"+4,OBJPROP_COLOR,clrGray);
   else ObjectSet("Libec"+4,OBJPROP_COLOR,clrBlack);


  ObjectCreate("Libec"+5,OBJ_LABEL,indicator_window, 0,0);
   ObjectSetText("Libec"+5,DoubleToStr(rod*10000,2)+" ("+DoubleToStr(iMA(NULL,0,17,0,MODE_EMA, PRICE_MEDIAN,0)-rod,4)+")", 11, "Arial Black", DarkViolet);
  ObjectSet("Libec"+5,OBJPROP_CORNER,2);
    ObjectSet("Libec"+5,OBJPROP_XDISTANCE,20);
  ObjectSet("Libec"+5,OBJPROP_YDISTANCE,47);
  if (rod>rou) ObjectSet("Libec"+5,OBJPROP_COLOR,clrCrimson);
  else if (rod<.0010) ObjectSet("Libec"+5,OBJPROP_COLOR,clrGray);
   else ObjectSet("Libec"+5,OBJPROP_COLOR,clrBlack);

}
The two digit distance in pips from the E-32 – bottom right.
deletetxt1("AverD");

int twodigits = NormalizeDouble(MathAbs(iMA(NULL,30,32*2,0,MODE_EMA, PRICE_MEDIAN,0)-Close[0])*10000,0);

//string tds = IntegerToString(twodigits);

int tens = round(twodigits/10);

int ones = twodigits-tens*10;

string stens, sones;

//Print("tens=",tens);
//Print("ones=",ones);


switch(tens)
{
case  1:   stens=CharToStr(140);
        break;
case  2:   stens=CharToStr(141);
        break;
case  3:   stens=CharToStr(142);
        break;
case  4:   stens=CharToStr(143);
        break;
case  5:   stens=CharToStr(144);
        break;
case  6:   stens=CharToStr(145);
        break;
case  7:   stens=CharToStr(146);
        break;
case  8:   stens=CharToStr(147);
        break;
case  9:   stens=CharToStr(148);
        break;
  default: stens=CharToStr(139);
      break;
  }

//deletetxt1("AverD");

switch(ones)
{
case  1:   sones=CharToStr(140);
        break;
case  2:   sones=CharToStr(141);
        break;
case  3:   sones=CharToStr(142);
        break;
case  4:   sones=CharToStr(143);
        break;
case  5:   sones=CharToStr(144);
        break;
case  6:   sones=CharToStr(145);
        break;
case  7:   sones=CharToStr(146);
        break;
case  8:   sones=CharToStr(147);
        break;
case  9:   sones=CharToStr(148);
        break;
  default: sones=CharToStr(139);
      break;
  }


string jointstring=stens+sones;

//if (Close[0]>plus[0] && buy[1]) jointstring=jointstring+CharToStr(66);
//else if (Close[0]>plus[0] && sell[1]) jointstring=jointstring+CharToStr(73);

//if (Close[0]<minus[0] && sell[1]) jointstring=jointstring+CharToStr(66);
//else if (Close[0]<minus[0] && buy[1]) jointstring=jointstring+CharToStr(73);

  //    ObjectCreate("AverD", OBJ_TEXT, indicator_window, Time[16], 1);

ObjectCreate("AverD",OBJ_LABEL,indicator_window, 0,0);

ObjectSet("AverD",OBJPROP_CORNER,3);
    ObjectSet("AverD",OBJPROP_XDISTANCE,20);
  ObjectSet("AverD",OBJPROP_YDISTANCE,27);

if (MathAbs(iMA(NULL,30,32*2,0,MODE_EMA, PRICE_MEDIAN,0)-Close[0])*10000<45) ObjectSetText("AverD",jointstring,40,"Wingdings",Orange);
else if (Close[0]>iMA(NULL,30,32*2,0,MODE_EMA, PRICE_MEDIAN,0))  ObjectSetText("AverD",jointstring,40,"Wingdings",Green);
else ObjectSetText("AverD",jointstring,40,"Wingdings",Crimson);
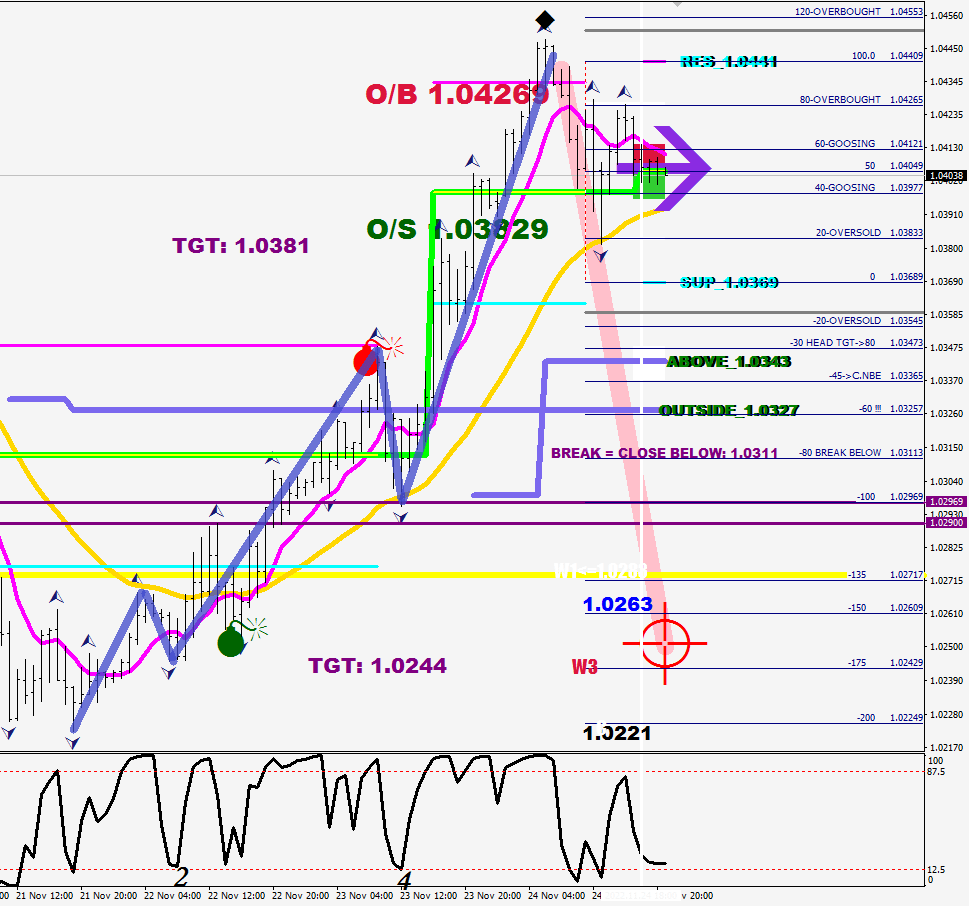
The end game is a Wave5 continuum arising from the undercut of the last 2 4H pullbacks, like a phoenix. Re-hedge upon 2 closes on the outside of the 8EMO after 3 inside closes. The end game can peak at an utmost condition or a reversal divergence (98-94) (2-10) The end game can end for instance in a 98-94-X hourly divergence Bet on this sequence happening and make the bet by adding on at every opposing 3rd leg, at every support (S1)
Back testing the other side of the E-67 band (Mr. Maroon) for a Wave 2. Next stop: mean reversion.
I want to ride my popsicle, I want to ride it where I like.
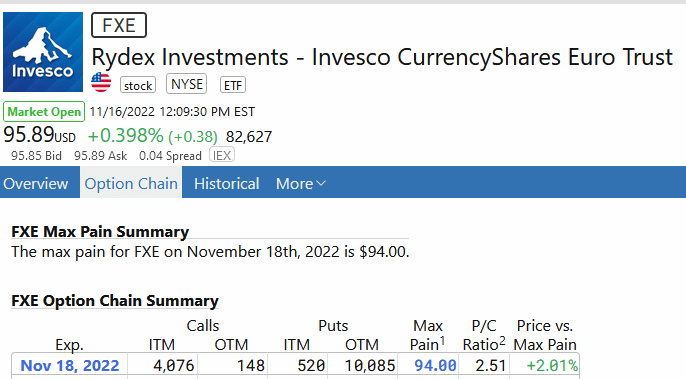
Holiday spirit, options expiration.
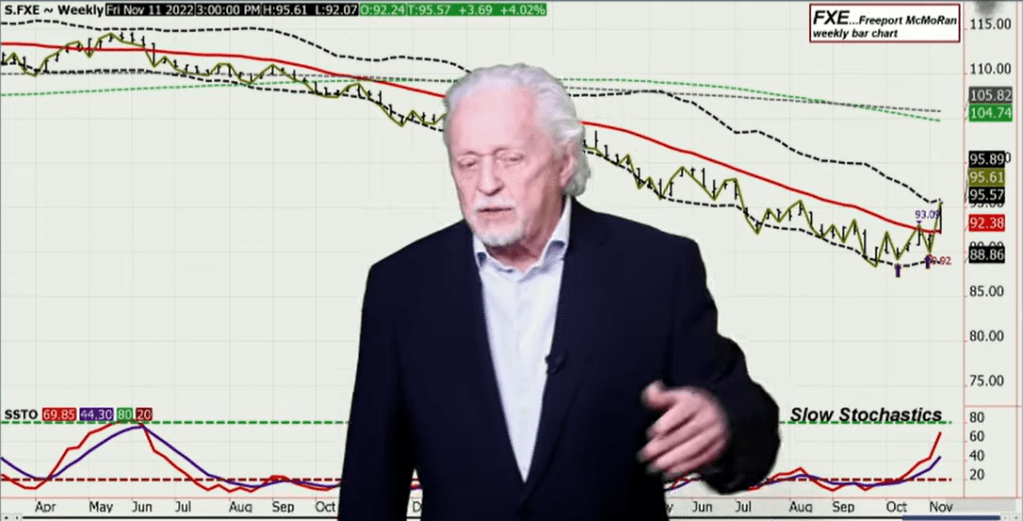
Freeport MacMoron has a max pain at 94 – 200 pips drop from here.
What’s the holdup? Who knows. Perhaps there is more money to be had with an indices peg. Let’s take some lessons!
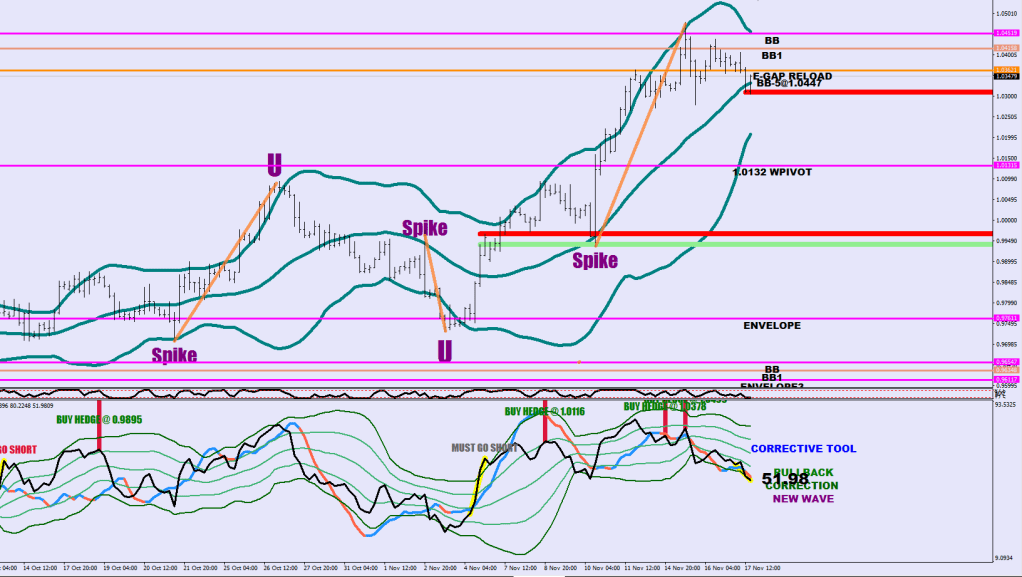
A new light for looking at Bollinger Bands as current volatility trend check points.
For instance, if price goes briefly outside the BB on a hourly fractal / tags it / falls just shy that means continuing volatility contraction.
In fact, many of these brief encounters never actually happened, only the reversal candle closed back deep enough to pull the BB closer for the settle.
This is why I don’t always target the Bollinger Bands, but when I do, I target 5 pips closer.
The end game is taking place away from the E9 & the S20 daily.
Optimal conditions include more distance = less draw. Think of this break like getting into the stratosphere. No gravity until price re-enters the atmoshphere.
The Game is usually kick started by trapping.
In terms of wave structure, you must already have seen 2 large legs away from the E9, so it would be a Wave 5 by counts, but it is not at all likely to stop at a single leg.
In fact, you would see increasing length swings in the prevailing direction until a 100 pips+ hourly swing shows up. Volatility increasing = less order density – air pockets.
Then price would have to make it back to the hourly 8EMO and close at least twice below it.
Yet, the whole thing can be extended again if the 8EMO gets closed back over twice (see my Hedge Hammer blog entry).
Other tools that may help finding the right spot are the 4H RSI14 HL2 Bollinger Bands and the hourly 18-sample slow stoch: for instance if you get a 98+ print on the upside then you could capitalize on the knowledge that impulse waves don’t end on strength, and a higher high is missing with a lower stochastic reading for a reversal divergence at the new swing.
For a reset after this outre whack move, aim for the daily S30. Add to the fade every time the hourly 8EMO catches up with the price.
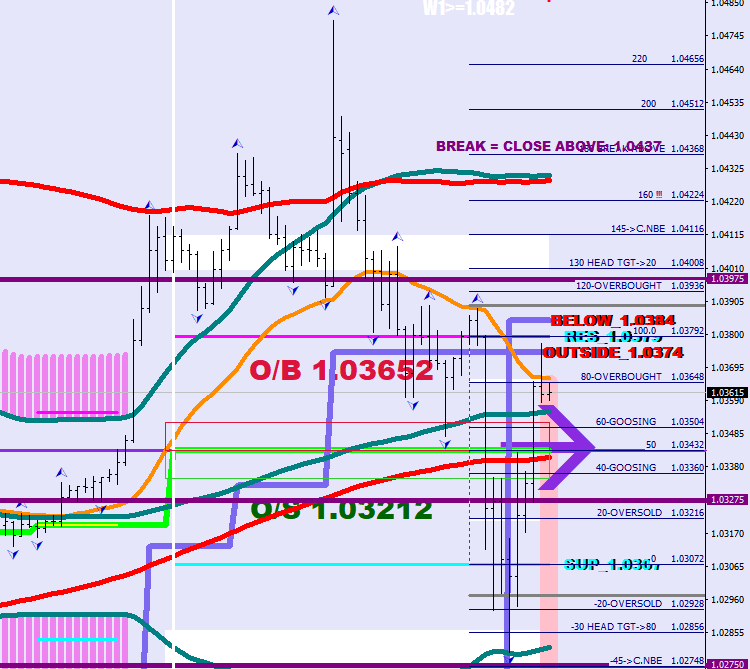
I drew the red line in the morning parallel with the white (5x) expecting that the thrust would fall shy of the line – it ended up touching it. The 8EMO is 18 sample on the 30-min. I found it to be more accurate when I was making the targeter.
Fractal evaluation: wave 5 of Wave 3 had 3 fractals, although 2 were not picked up by Billy W. Speed may be asynchronous with a given time frame, use your imagination, or go a frame lower.
Wave 5 printed 3 fractals.
Between w3 and w5 of Wave5 there was a PPI touchdown on the orange 8EMO. Interesting, not?
I would consider the separating line of the statosphere and the atmosphere to be 45 pips away from the Hourly E-32 HL2.
We may see a bow back within the first 14 hours following the thrust before the Wave 1 down.
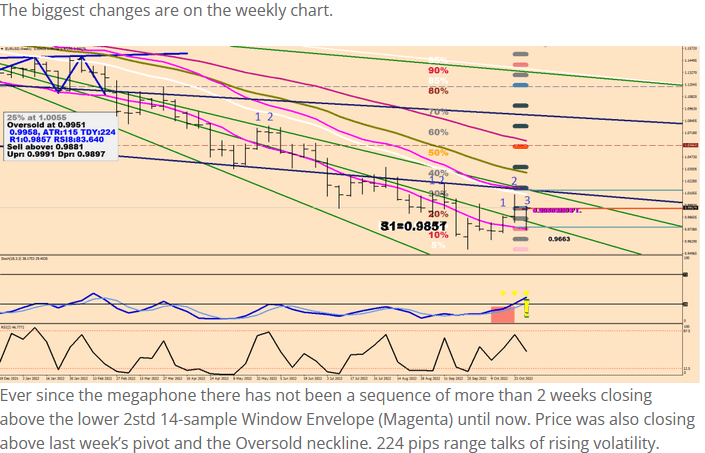
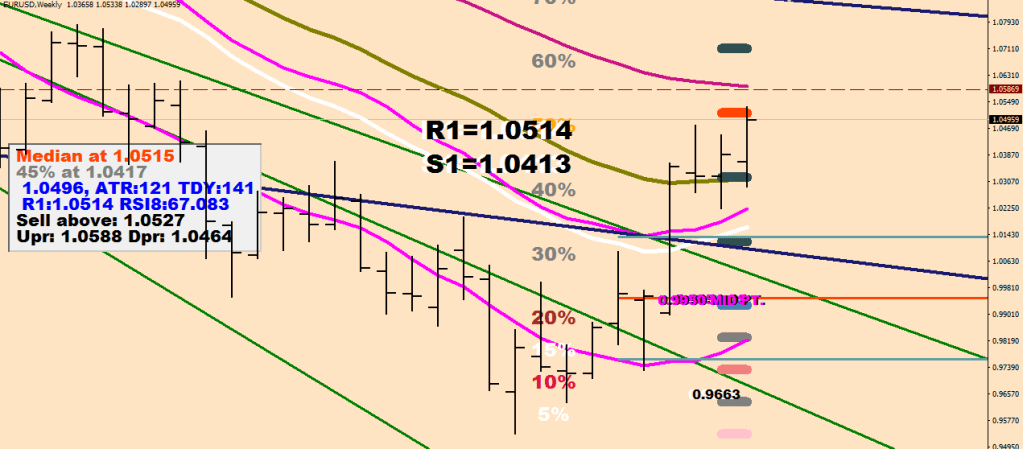
I’m scaling back in with shorts up to the 8EMO or so.