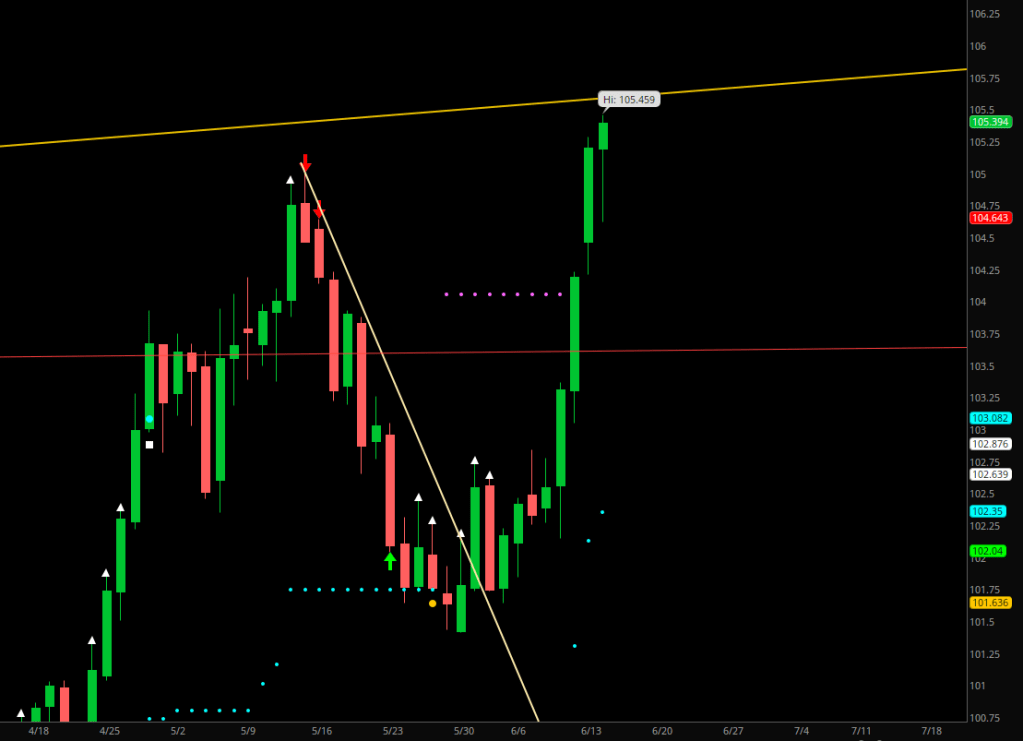
I have the right metrics for spotting a left shoulder, a head, a way of anticipating the end of the divergence under development and it is time for the definitions.
A left shoulder achieves a 45%-65% gain of extra distance beyond the parenting range.
A head fails to achieve what the left shoulder had managed to do. It is unable to get away from the current patenting range to the extent that the left shoulder could, thus setting up an end of impulse wave with a reversal divergence.
If a head gets violated more than 5 hours down the road, that is a break out and needs to be played/hedged.
A head would manage at least a zero print (and nominally would get further than the left shoulder, but not relative to the current parenting range), but would fall shy from the previous distance achieved by at least 25%.
What is necessary for the head is Full Contact. I think this much I can remember.
The move ain’t over till it’s over. Catching the head is the optimal entry. A rising/falling wedge has a sequence of a shoulder and a head.
I’m feeling slightly sad that I managed to get myself fully trapped by having no canes of knowledge, but constant uncertainties blowing at my head from a high speed fan.
Knowing where you need to hedge and until when makes a world of difference.
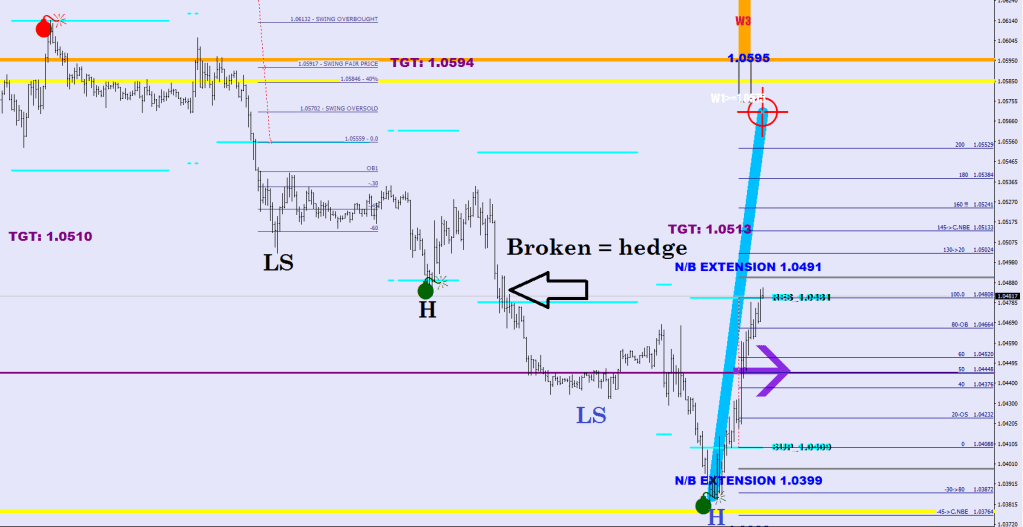
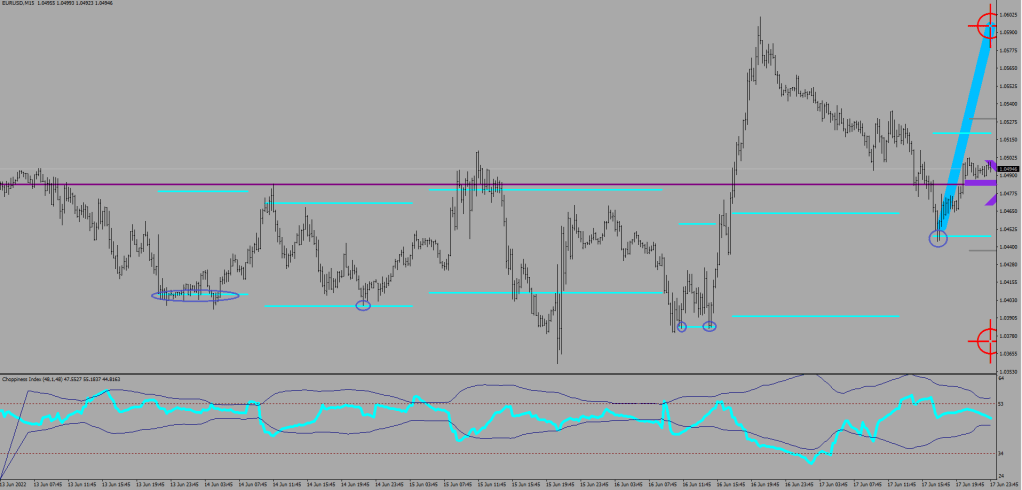
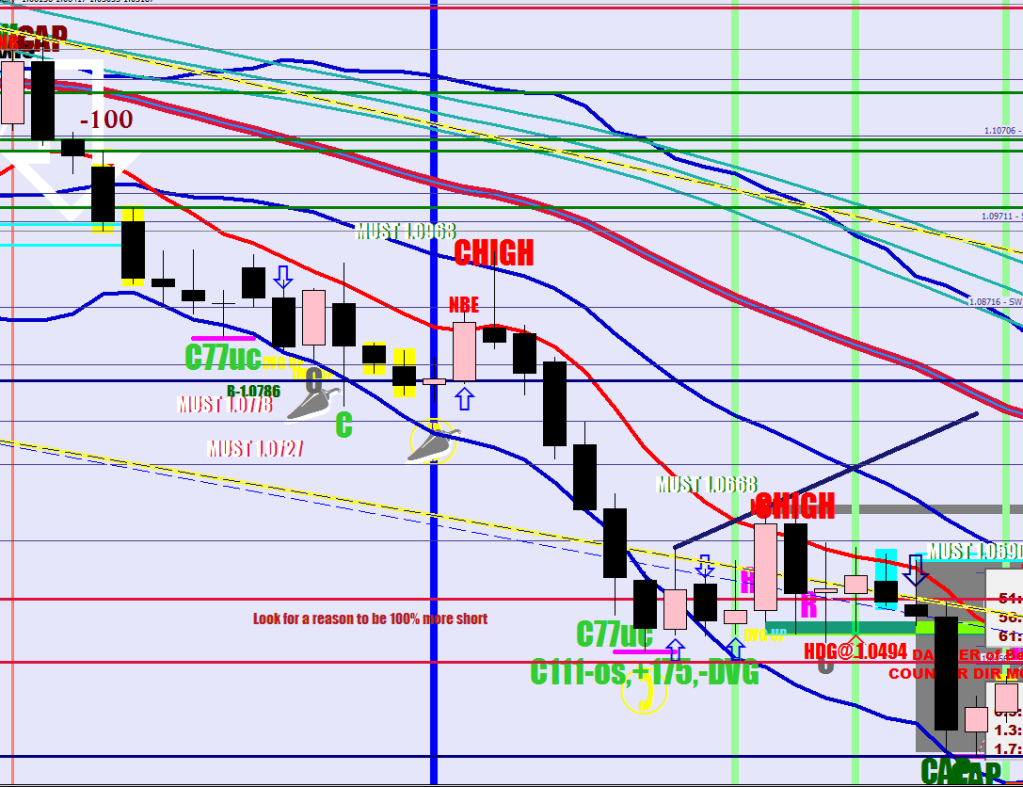
As for this counter trend move down was larger (230 pips) than the most recent largest (around 217 pips) this does not mean that I should be throwing away all of my ideas about the real direction.
Projected distance extension fill
No, not snail shells.
Now, who is singing songs in my head that I have never heard before?
OK. Grab some adult beverage & let’s go. We’ll be looking at counter moves and terminal waves.
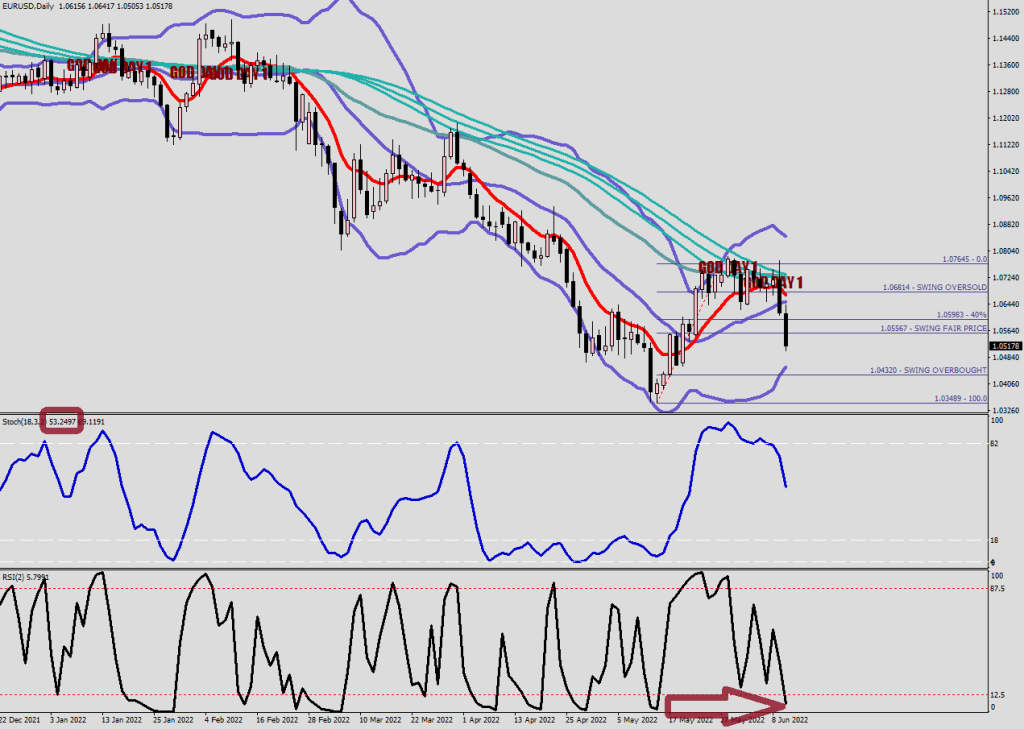
If you look at the big picture, the trend is up – despite of the 170-pip sell-off in the last 2 days.
See, the volume & momentum is still green, because the 18-sample stochastic hasn’t been taken to the extreme, because the pro volume did not happen with an RSI2 below 40, and the RSI2 was only temporarily in the “Enough To Turn” field yesterday, but not by the settlement. Kudos for the bears to be able to capitalize in on this window of opportunity in a big way.
With all this said, there are counter moves in every directional move, as you can see by the white highlights below:
These moves in case of this trading instrument cap out around 210-220 pips, but the 90, 130 and 170 numbers I picked due to wanting to get a fill, and the spacing is an intentional 40 pips. With me so far?
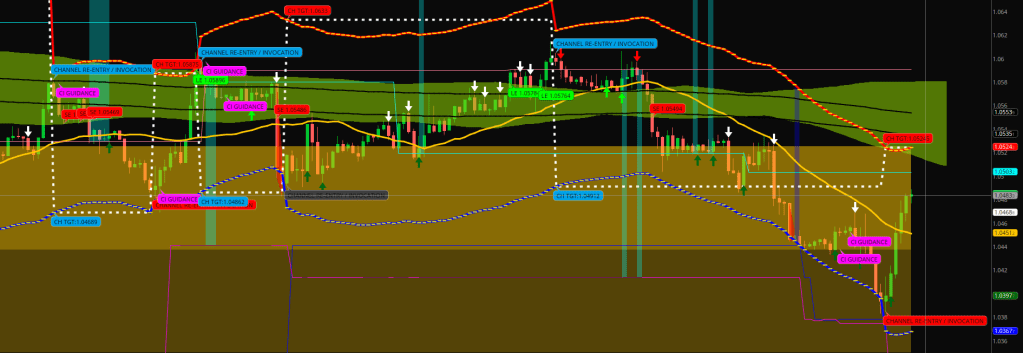
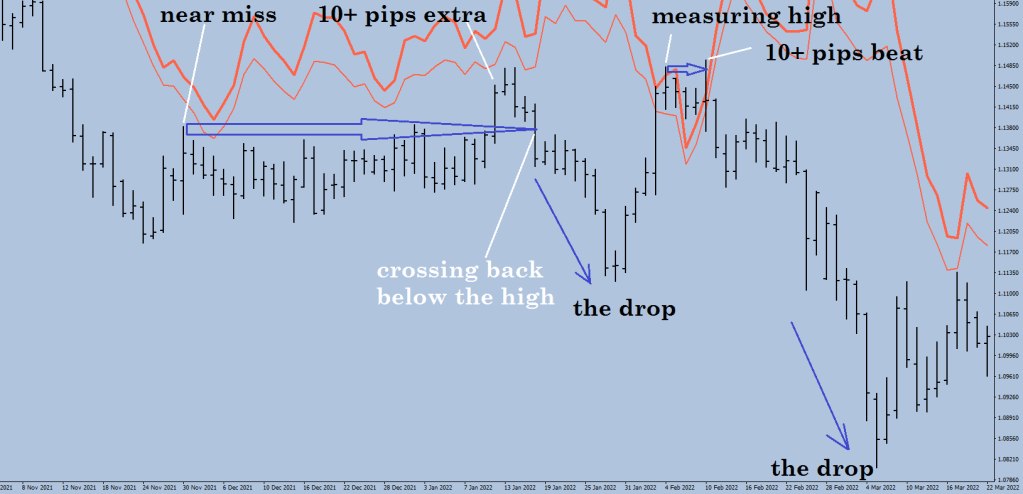
Normally after the green laser beam (first image) price would conquer the 20 SMA within 3 days and would challenge the E44 in 6. After 7 the move may be considered long in the tooth. Of course this run up felt like a not normal, lackluster rally.
Now, the following things we are learning together.
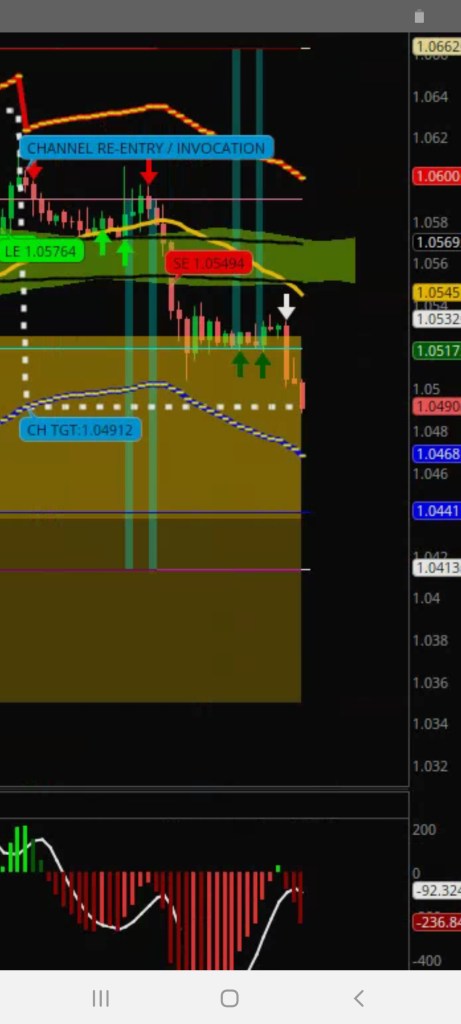
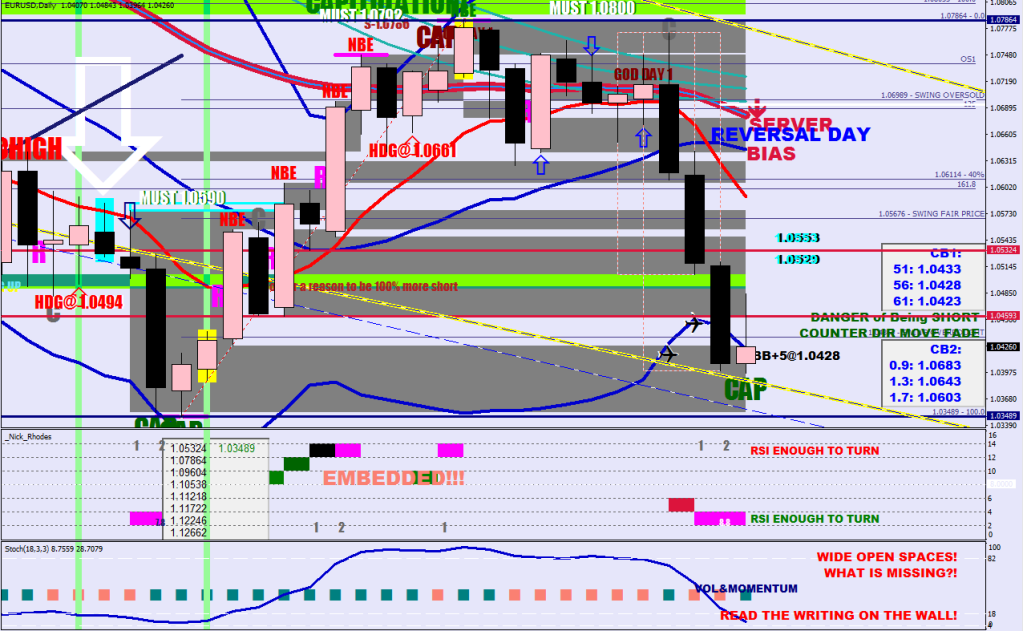
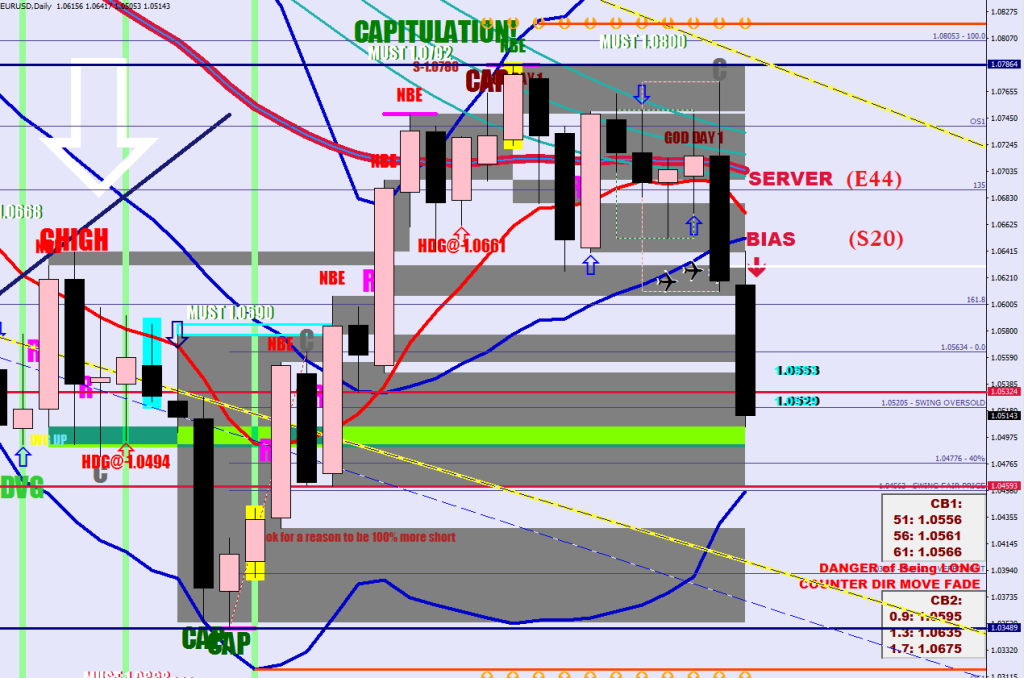
The cyan lines are the “Zero to Zero” range around the last consolidation weight.
After the “end of wave” print of 45, there was a back test of this level arriving at a zero print. This we’re going to call “taking a stand”.
That -45 block could be also read as a Zero to No Break Extension (10 pips lower) if we are using the previous range’s data.
What we are trying to figure out here is this flat-top-drop (trademark of Oscar Carbonara) of 3 domes at 1.06 why and how are still calling for a house on the peak.
As we gathered, the move can still be a counter move within the wave for a bit longer. What went wrong on the way down at the potential terminal area of growth (50% extra) is that the price went extra strong and violated the 60% or the 61.8314432% if you have this kind of a fetish.
As you can spot on the first image, the 170 pips discount comes in at 1.0444 and we are yo-yoing around the terminal 50%. I’m thinking the continuation divergence (higher low) is very close, especially if there would be no closes below the 60%.
This is an oversold, but not embedded weekly bear market. Oversold by itself does not attract new money. Pros target either the daily Bollinger Band or a Weekly Window Envelope to exit (whichever is more reasonable.)
No, I did not turn into Schindler’s fundamentalist all of a sudden, but there is something to be said here about them central plonkers.
The Spainard CP-Lie came in at 10.2 today.
This would leave the ECB with having to start tightening agressively.
Although the FED is already after a .25, a .5 and a .75 hike, Europe is to start from a decades long stand still. And they would have to do it at least twice the pace of the FED. It is not the nominal rate that matters, but the rate of change. Do you really want to be short the Euro before it getting a horse shoe?
Straight outta Compton nowhere.
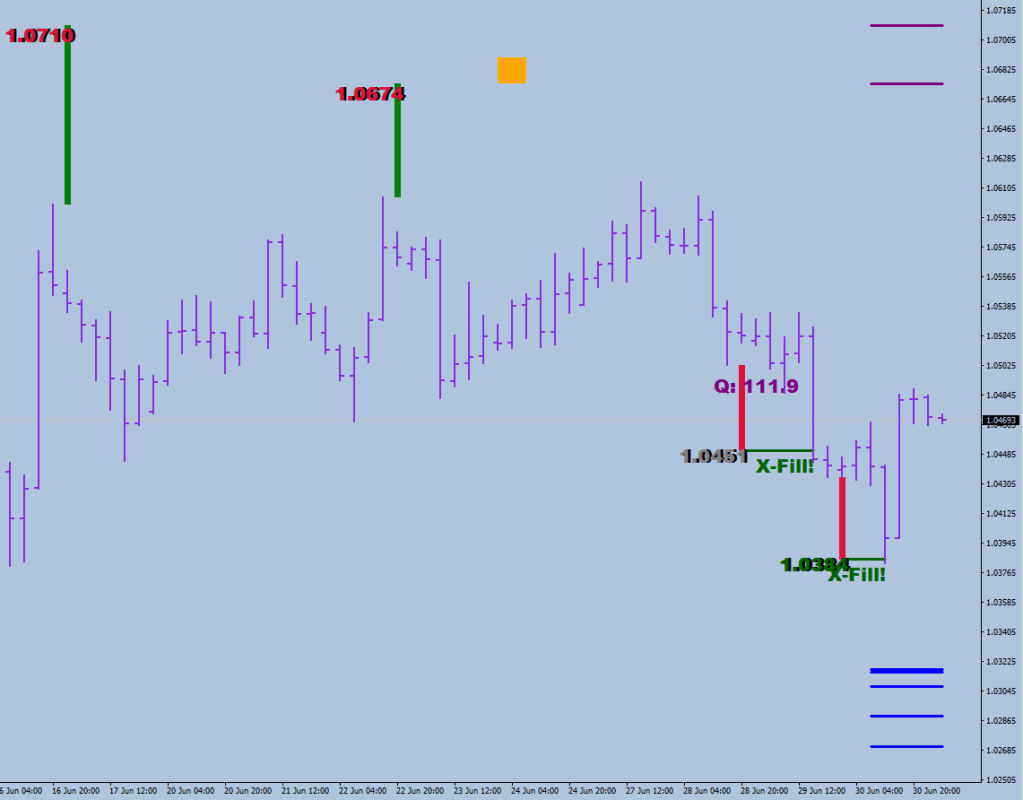
The sunset images I took at a summer Detasseling labor camp.channel target filled, bottom of channel made
After Projected Distance, what use does my CI Moat Dynamic have in the current Bear Market?
How about helping to spot a lower high for an optimal daily entry?
An image for warm-up.
The near miss took forever to be beaten and the drop wasn’t sensational either.
You get to label up the next one and take note of the higher low at the end.
I have nothing for sale any more. I closed my US dollar denominated account that was linked to the PayPal. Paying for this blog as long as I live. Never stumbled upon a meaningful collaboration.
I’m here to help you. I’m here to call you lazy, bigot religious fanatic.
The Peter-Noster is the concept of price stepping outside of the parenting range, that becomes the elevatror/building block and there would be new oversold and overbought levels in each direction i.e. at 120%, 180%, -20%, -80%, -120% etc.
The gray lines are the NO BREAK EXTENSION LEVELS, they would stop price in the wring direction, they are often seen at the very end of a Wave structure.
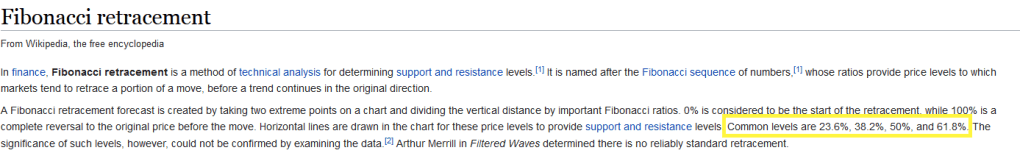
So, what is my problem with Fibonacci retracements?
There is nothing wrong with measuring things, there is nothing wrong with using percentages.
The problem is setting your mind on pseudo scientific things (meaningless fractions in this case) and attributing God-like status to them. This is a slippery slope and you should try to stay off of it, or you may end up believing in things like: God implanted dinosaur skeletons and fossils to challenge your faith & there was nothing before the creation. This type of behavior is always going to re-format the data to fit the narrative and there is simply nothing objective about that.
Change the settings on your scissor-tool to rational numbers before it’s too late.
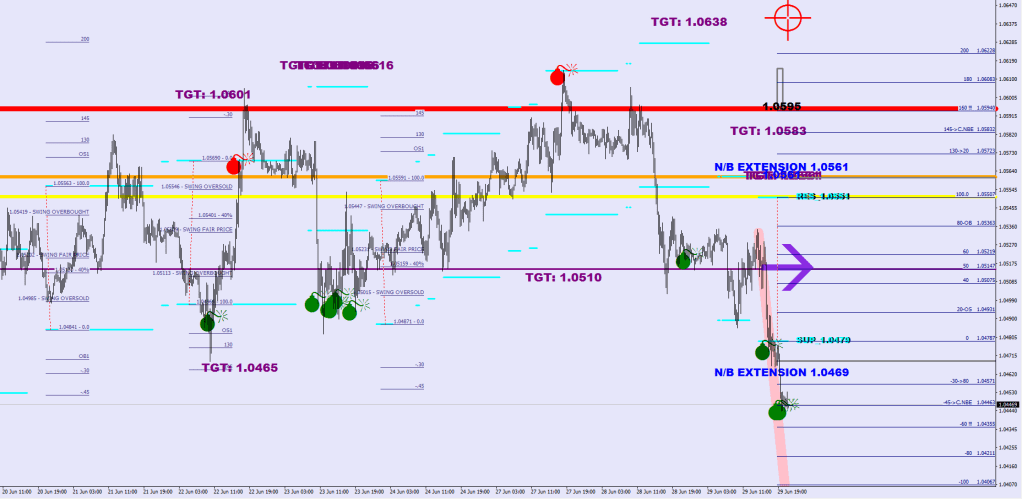
My take on the subject of future growth that it is a non-quantifiable outburst with the aim of an extra 50%, but as a probability I would point to 45% of the parenting size to be achieved as a high likelihood, for this is what charts are suggesting me (projected distance), and 61.81394521% (aka the garden ratio) is some made up, idealistic crap.
Let’s try to appreciate what is happening here.
You need to see a divergent leg scoring 50%+ extra, but less than 80% for a swing to be an end of a corrective wave. Look at what happened every time when the red 50% extension line got hit.
Having discussed the 45% you may start to appreciate looking for this telltale of growth, an indication of an end of a divergent leg (referencing the parenting range as measuring leg). This is what you need, the exit, the end of the move for a rotation into the other direction.
The lines on the right hand side are 50% extension of qualified moves that were not filled yet.
Where are the market profile people wrong? Not understanding the relativity to the consolidation mean and calling both a success and an excess an excess. Well they are, but there is a major difference between the two. Final vs temporary.
Now, let’s do modular music today on this wide array of healing frequencies.
On the subject of Sound Therapy. Does this sound InZane?
…that one day I would have a continuous version of the 15-Min ATR.
The thing about making new, previously non-existent indicators is that you may end up stumbling upon new ways of filtering stuff which ultimately may result in a completely new approach to trading. 36-pip displacements of the consolidation weights.
What is new here is not paying an attention to a weight change until it persists for 8* 15 minutes. For instance look at the last impulse move sandwiching itself through a window of opportunity. Neat. Them cyan lines are the perfect get out levels in the wrong direction.
…
The rest of this blog would be spent on some Hungarian cartoons, since I found some material.
After returning from Sweden I worked temporarily at the cartoon studio wearing his name. He himself was working on a stop motion at the time called Don Quixote with my room mate.
I was never part of the inner clique, and my name was not even mentioned on half of the Kipper cartoons I put together as a camera man. Not that the name itself meant too much after having been disowned by my father at the age of 17. I did not want to see it either.
What is supposed to happen upon the guest appearance of a laser beam?
You’re supposed to scale through the E9, the S20 and the E44 – and perhaps get a little extended time. Of course it does not always work out that way. 3 exceptions on one image:
# 1 – Price got to the second line, but had such a strong rejection that the same day closed back in the embedded oversold on the 18 sample stoch.
# 2 – Price went overtly oversold (prints below 4.4), the lift fizzled out at the first line & fell back.
# 3 – Pro volume completely took away the prospect of getting beyond the first MA.
The score is currently 0, but that is at once 100 more than -100.
People always talk about Permutation…
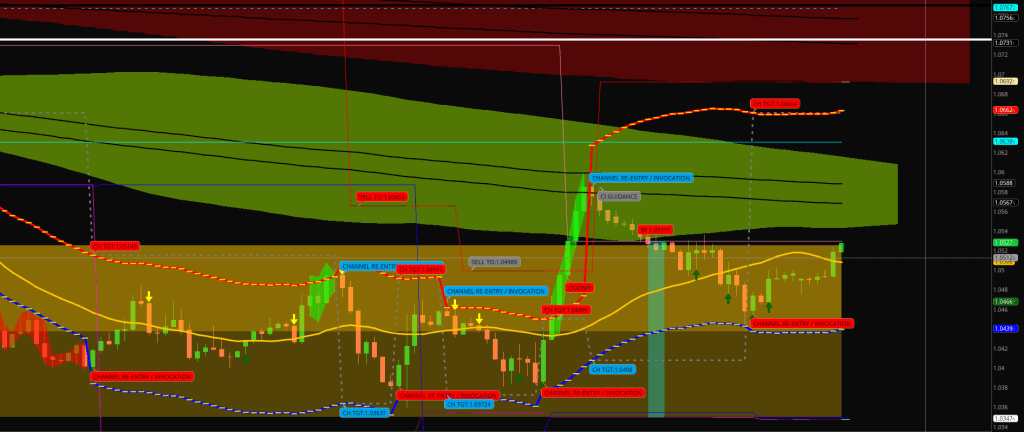
I drew those lines a good year ago.Skeleton Key #2 – the price crossing in / out of a channel around the 36 EMA based on ZigZag calls. The cloud around the price shows the period spent outside this E-36 Zigzag channel. Also check out the instant run into the LEMA bullseye.
Sell below yesterday’s low if it -wasn’t closing outside the daily BB -wasn’t a green C -wasn’t a CAP Sell if yest. was a cyan / pro volume bar (use C) Cover right before the close
Sell retracement after green C 75, 90, 130, 170
Barrelling down = selling 8-16 EMA field Confirmation: does price reach the BB30?
Ok. One by one.
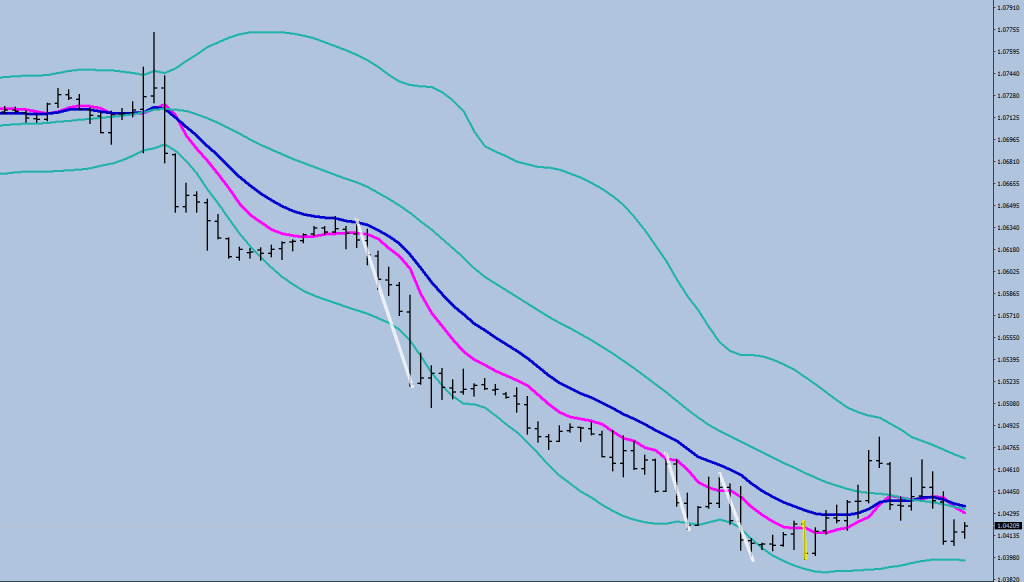
Let’s acknowledge this trending move down. Every time price pulled back to between the 8EMA of opens and the 16EMA of halves, they sold again and price moved below the 30-sample Bollinger Bands (white lines), until once it did not (yellow). That was the end of the leg.
That’s about the fastest sustainable move you could see out of a -100 market.
Second thing: it’s all about how the price settles. The re-balancing day is still working out its own gender.
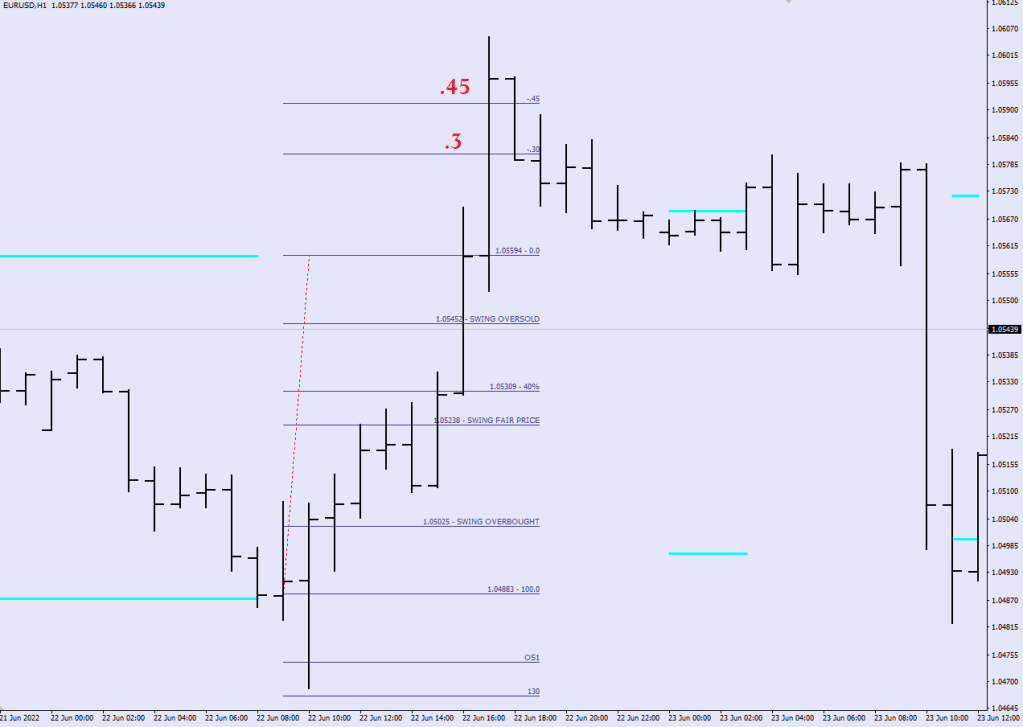
Admittedly I was not expecting the 18-sample stochastic that was embedded a few days back to get this oversold in mere 4 candles. This is why I said that a CAP print is not likely to be at the end of this Wave 2.
The 8.8 print in the magenta field is the qualifying stochastic reading (9.5-4.4: coloring is blue). Watch how we landed on the bottom of the yellow channel.
If the close would be off the low by 27 pips, this would have CAP printed below it. If the stochastic finishes above 9.5, it would have a green C (Bollinger spike & close back).
What do you get if you divide 389 by 440? 0.884. That’s pretty close to 86%. This can still be a deep Wave 2 that I have been talking about despite of what the Dollar seems to be doing against the rest of the other currencies in the basket.
Just that we are on the same page, here’s the Wikipedia Fibonacci entry that is wrongly listing 50% as a Fibonacci number and is saying nothing about 85.4 for instance.
Lastly, let’s admit it, I am only posting on this blog to share YouTube videos. No argument to be had with this one.
Barrel of a fun
RIP Fletch.
Two different invocations. Usually the last one gets the command & the previous is deemed out of time. May or may not the case here.
Like a sturgeon – hey – caught for the very first time.
You’ve got to come to know the truth: you’re living in darkness and this time it might be different.
Everything comes to an end at some point. The upside rallies are increasing in size – a volatility increase may be a sign of a tun underway.
That last one, the 440 is particularly suspicious. If that rally was a Wave 1 up, then this Wave 2 down does not have to end in a CAP for a change, but rather in a continuation divergence up.
This RSI2 print would do for a continuation divergence. The Stochastic would slip below 50 come the open.
Isn’t it always the story, that you figure out something, such as the -100 program and by the time the rules are cast in stone, when everything falls in place and fits like a love, it would stop working?
The Bollinger Band would also come closer, and if the RSI2 would dip below 5.3, that would put it into the reading int the “LOW Enough to Turn” category.
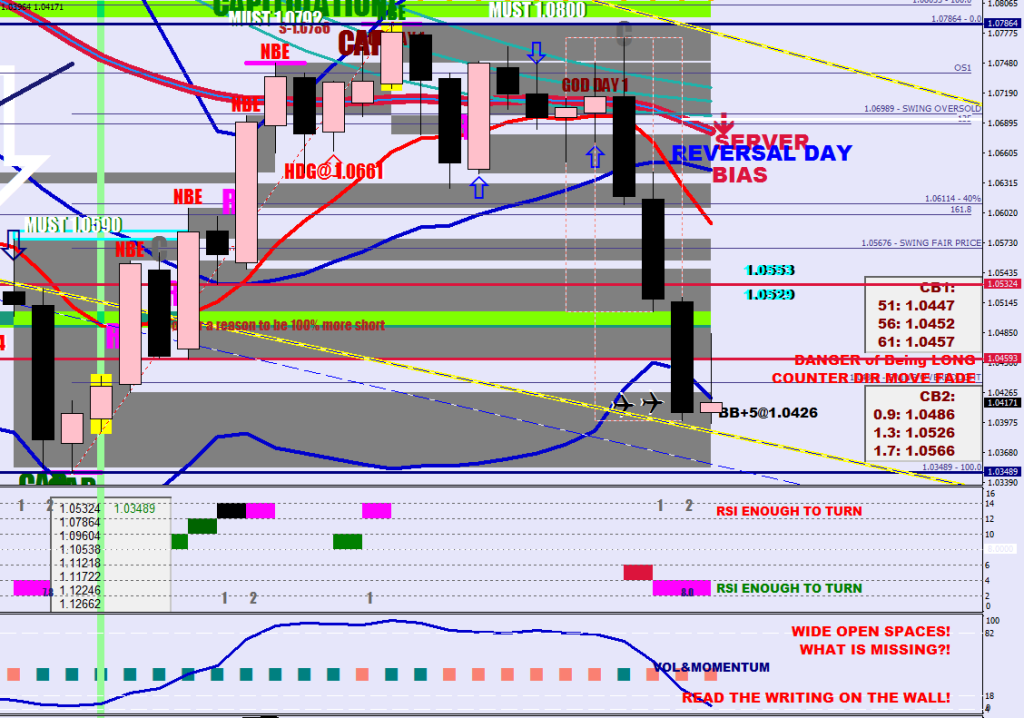
Now, let’s spot that Chartreuse, 16-pip line. I called it the golden divergence. It is merely an RSI2 reversal divergence with the starting leg in the magenta range. What is interesting here is the H&S shaping up right here. This divergence is being plotted as it is still within 92 samples.
The 20% level could totally be in the cards.
Let’s re-post what the Dollar is doing here.
Not this Dollar, the other one.The Dolla’ very much seems to be back testing the head.
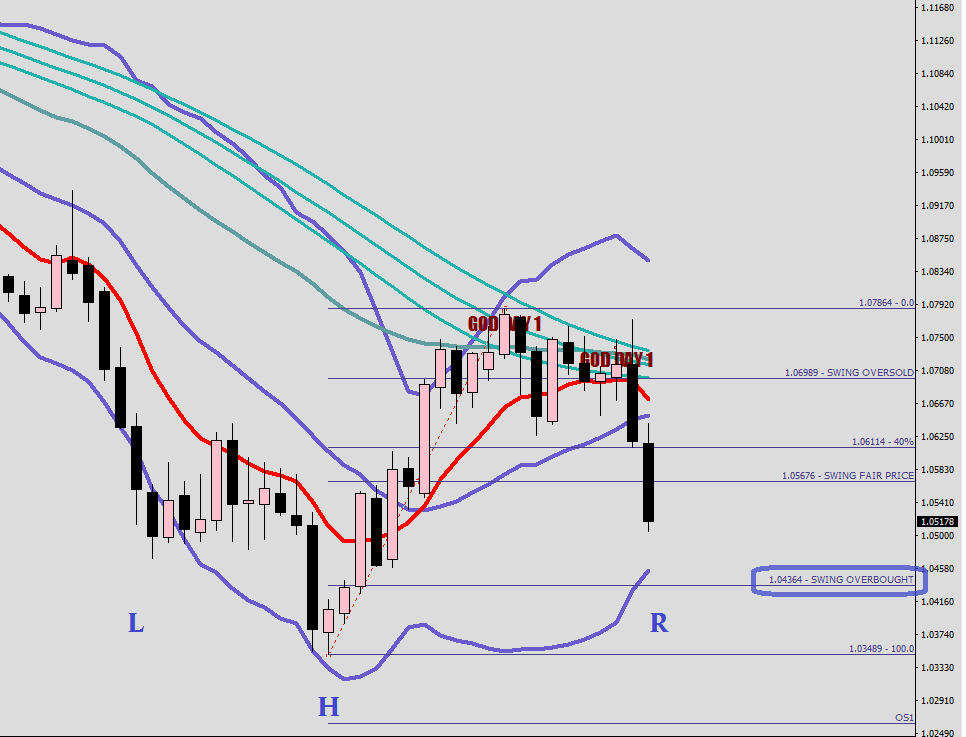
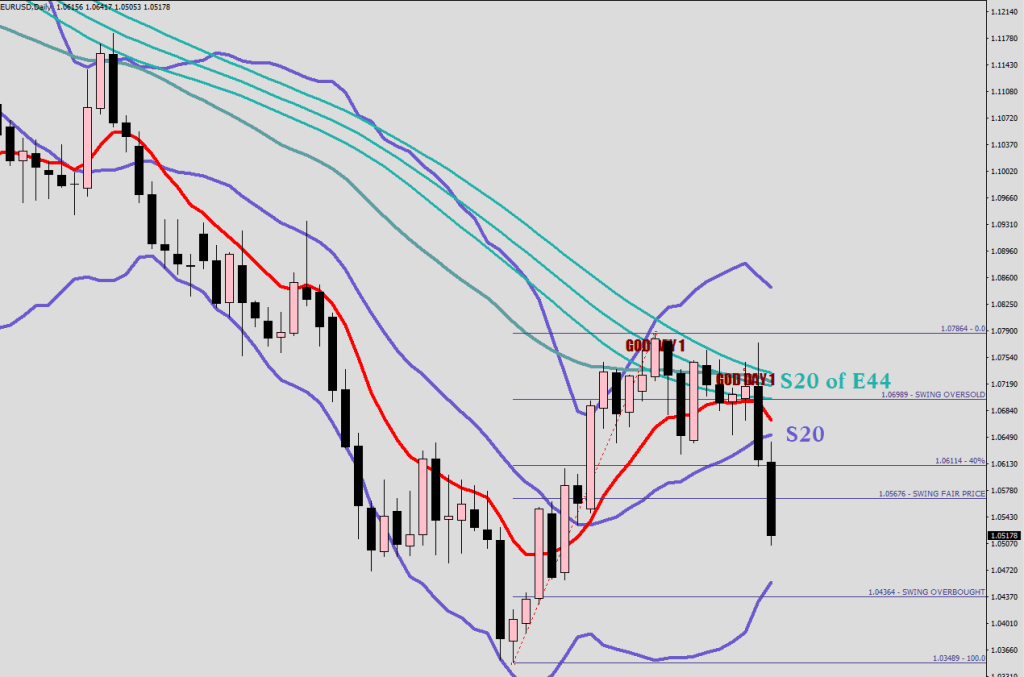
The fact, that the S20 and the S20 of the E-44 (middle Teal line) are currently sixty something pips apart from one other leaves you with the possibility of crossing both in a single day and flipping the market upside down for good.
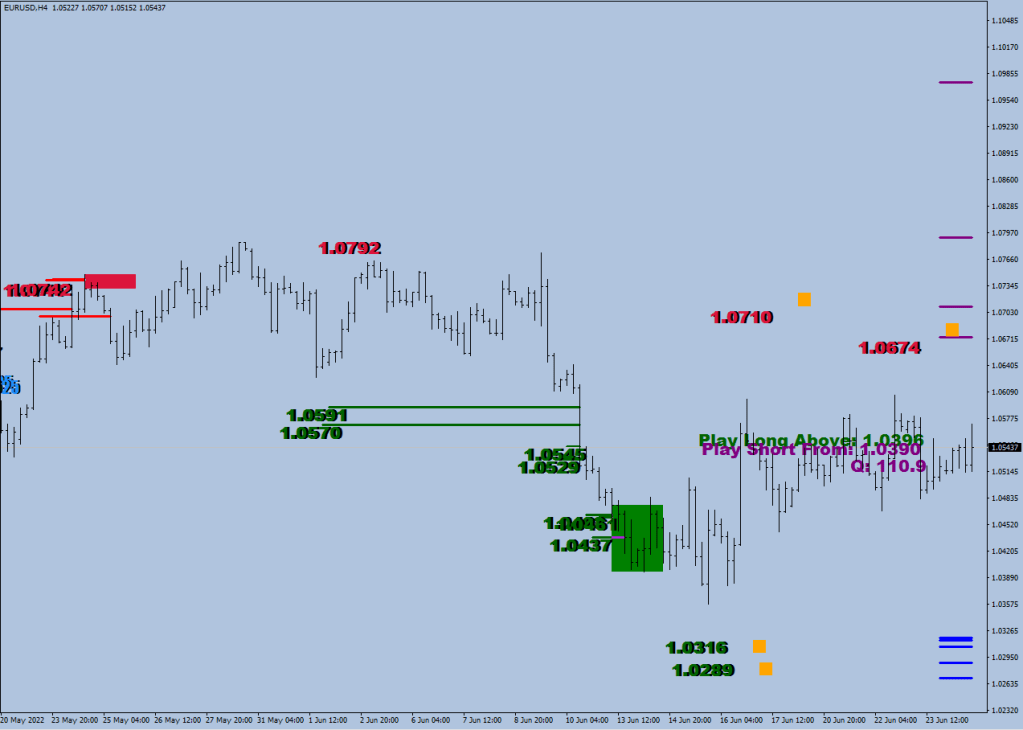
Once the S20 gets closed over, the -100 score would be reduced to -50, and after 3 closes above God (S20 of E44) the score would be 0. Zero head wind for a Wave 3 up. If you were to get above the CAP print’s high by 30 pips (moratorium @ 1.0792) the -50 would flip to +50 giving you a +75 (until God responds) or +100 print.
& now you know your ABCs. Price starting to close back above 1.0640 is a major warning size to dump the shorts Katie.
No more wicked people, what is left?
One Glove
What’s a glove has got to do with it?
Second hand devotion
One Love
Dr. Alban
No more wicked people, what is left? One Love
No more wicked people, what is left? One Love
Attention! Attention! My name is Albatjov
Mi come for tell you 'bout a thing called 'One Love'
We have a lot of jealousy, so you see
Today's friends are tomorrow's enemy
A lot of them are sleep a mi say lot of them are work
Jah know Jah know Jah know you have to reap what you sow
We used to be friends but now we go apart
We used to be cool but now we don't talk
Ask me why boy, I don't know
Maybe's jealousy between me and you
Maybe it's my progress nor is it my dollarsis
I've always been thinking that you are the chosen one
But your attitude problems I can't explain
I keep wondering how you can go so far
One day you might end up being having no friends
Count me out 'cause Jah Jah says so
One Love
Anything mi want to do mi do it one time, a mi say
Anything mi want to do mi do it one time
Mi no care what people say and mi no care what them chat
Mi just talk sense a say mi get pan the max
Them a wonder why I man get so far
'Cause their attitude problems I can't explain
Get up and stand up, get up and stand up
Stand up for your right, a mi say
Get up and stand up, get up and stand up, stand up for your
Mi say man mi no take no bullshit from anyone
Mi say man mi no take no bullshit from anyone
Anything mi borrow mi have to give it back again, a mi say
Anything mi lend mi have to get it back again
Go tell your friend a when mi come mi come again
Go tell your friend a when mi come mi come rough
Get up and stand up, get up and stand up
Stand up for your right, a mi say
Get up and stand up, get up and stand up, stand up for your right
What is it? One Love
What is it? One Love
What is it? One Love
What is it? One Love
One Love
No more wicked people, what is left? One Love
No more wicked people, what is left? One Love
Attention! Attention! My name is Albatjov
Mi come for tell you 'bout a thing called 'One Love'
You're loving money more than people
You'd be loving people more than money
If it's one God, one aim, one destiny
For the better in the world, for you and for me
You're living in darkness
You should be living in the light
Think if love was a thing money could buy
The rich would a live and the poor would a die
But since it's not it, and what is it
One Love
One Love, One Love, One Love, One Love
One Love, One Love, One Love
You're living in darkness
You've got to come to know the truth
You're living in darkness
You've got to make a sacrifice
You're living in darkness
You've got to come to know the truth
You're living in darkness
You should be living in the light, One Love
As a favor, I made a Nick Rhodes only snapshot and let the previous divergence block to print as well.
I have given you the CAPsize expression for the downside here a number of times, so with descriptive langue instead: it is a 4-sample lower low that closes back up by at least 27 pips with a settled 18-sample HL2 stochastic K reading greater than 4.4 and less than 9. A CAP print comes with a moratorium of an additional 30 pips. If a green CAP on the downside gets violated beyond the moratorium, the +50 reading would get flipped back down to -50.
With me so far?
So what would a program for the -100 reading look like in this Bare market that started in Aug, 2021?
Let’s fire up the observatory and make some observations.
Price can bounce if it spikes below the Bollinger Band and closes back above it (green Cs), but typically does not get further than the 20 SMA or perhaps would be chocked by the 9EMA (HL2) in red.
So far we have not seen a simple leg that did not end in a CAP condition outlined above.
The C-77 and other numbered c-s merely try to give an idea for the size of the bounce anticipated.
This green C wasn’t even enough to reach either MAs, but the bounce itself was almost 170 pips.
The recurring CB numbers I monitor for are 90, 130 and 170 pips.
It is noteworthy that the professional activities (cyan) seem to be in the direction of the -100, not against it.
THE -100 PROGGY
close all longs that are in gains
do not open any longs until right before the close when it is obvious that the market is closing back up from the daily low by 27 pips and has a daily stochastic reading between 4.4 and 9 or there was a Bollinger Band piercing and price is about the settle back inside – use trail stop
be net short
do not set targets or stops for your shorts
cover shorts right before the close if the requirements are satisfactory – see the two conditions mentioned under the second bullet point
consider re shorting in doses at 90, 130, 170 pips from the last swing low – rinse and repeat until you see the CAP print that immediately neutralizes the market: minus 50 (bias) plus 50 (for the CapSize) equals 0
…in the long term oversold on the Hourly Comfort Levels
Psar hit.
WordPress says this was my 500th blog post with them.