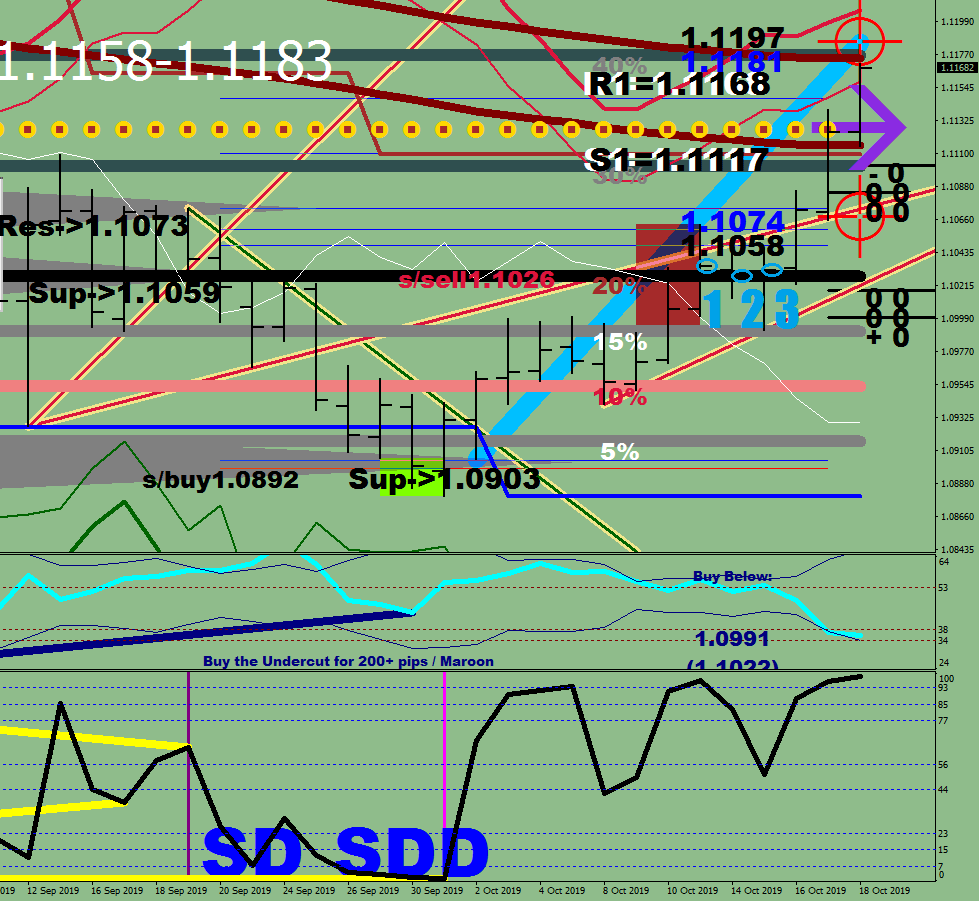
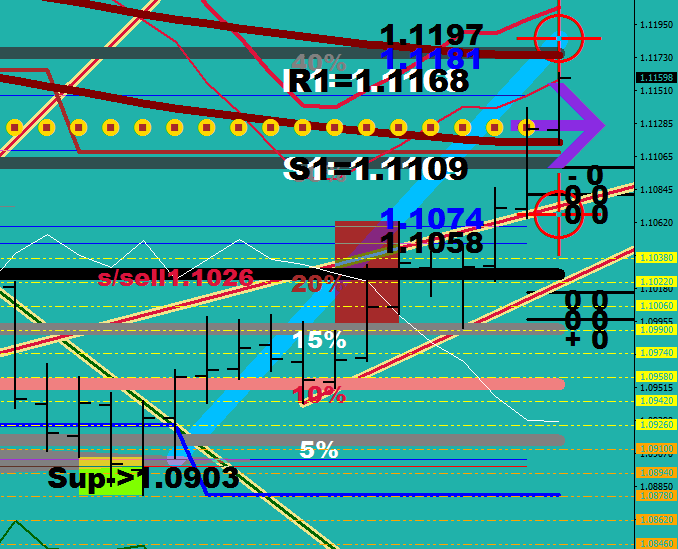
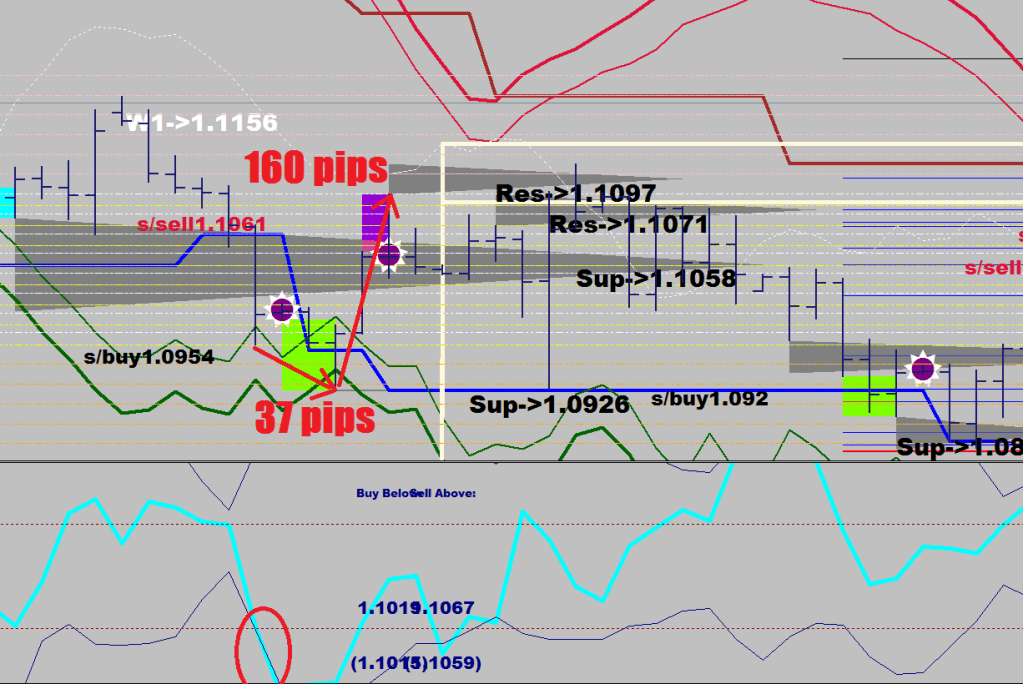
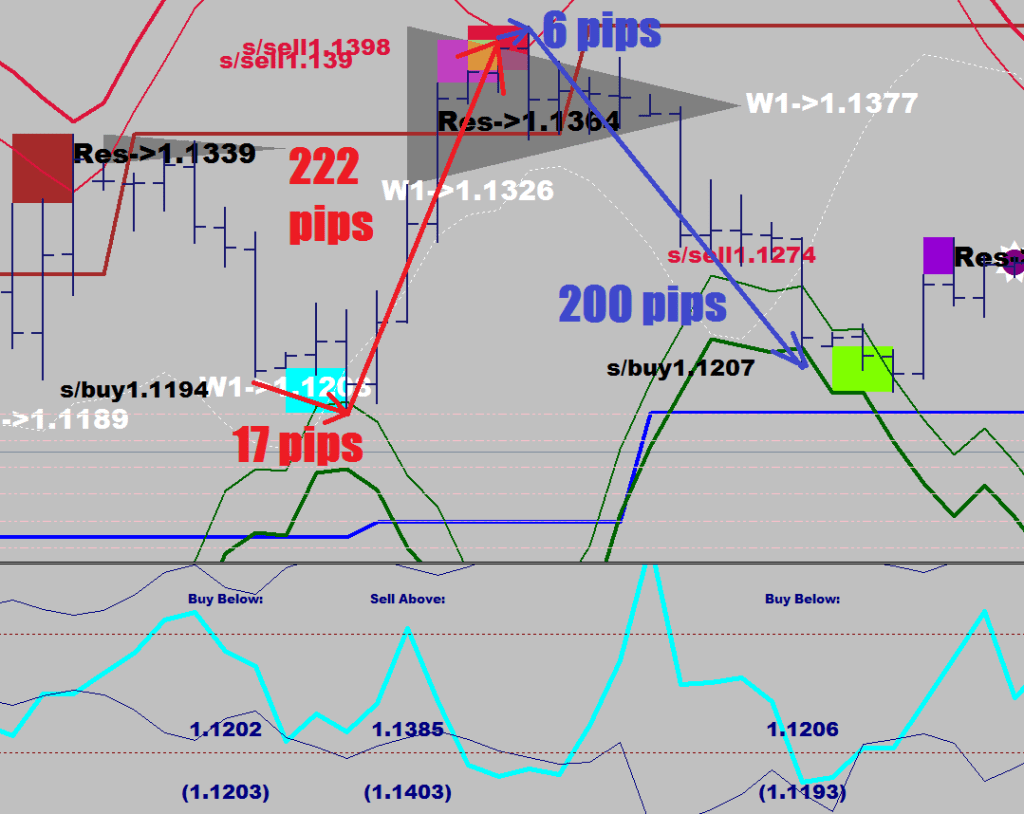
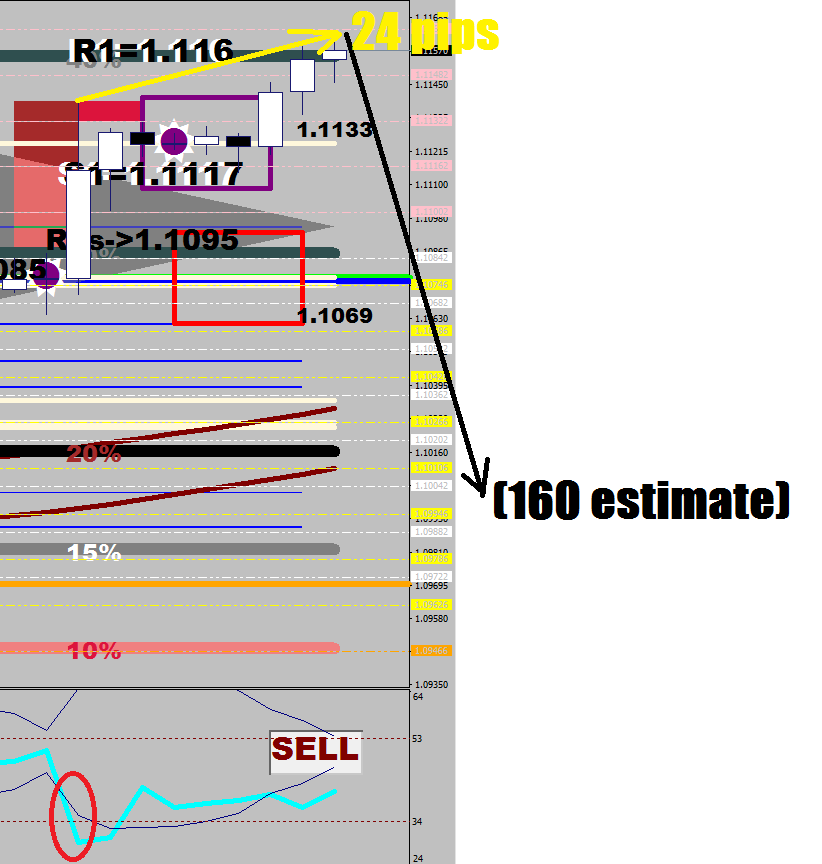
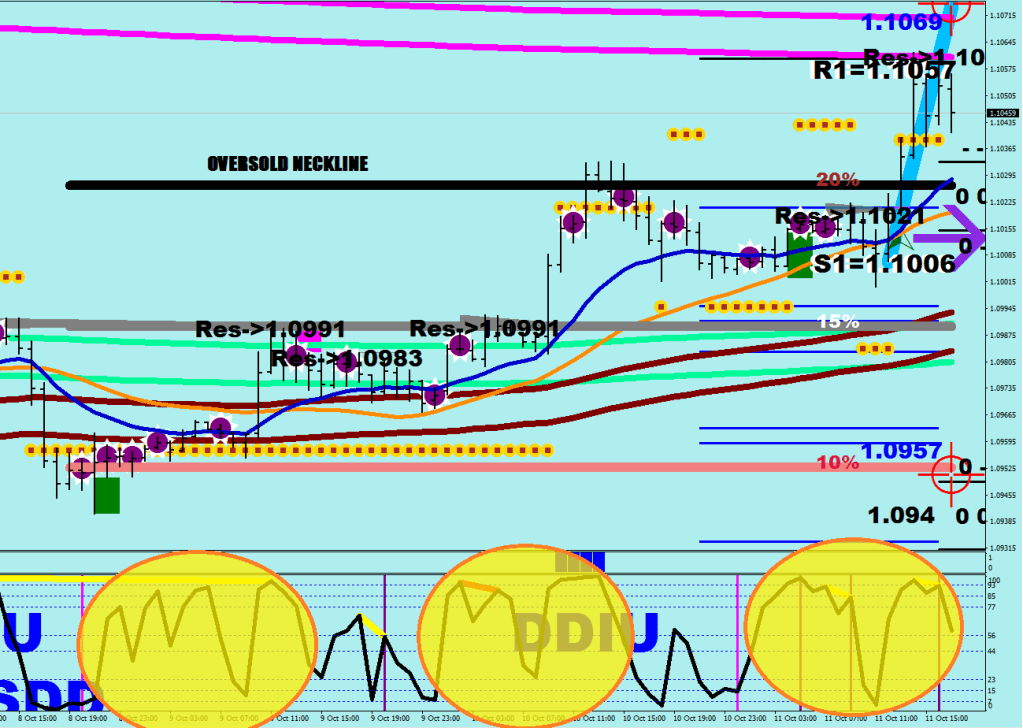
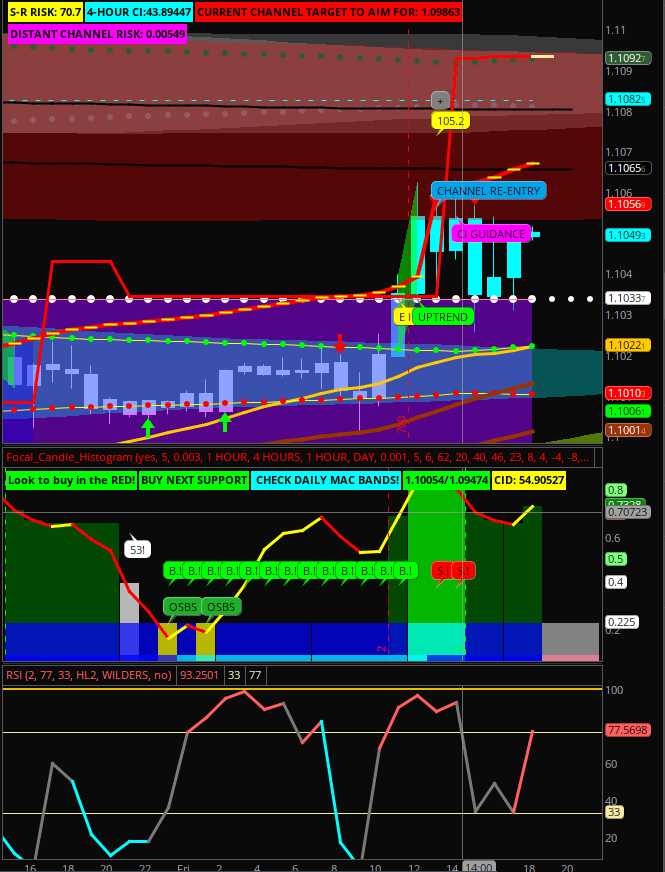
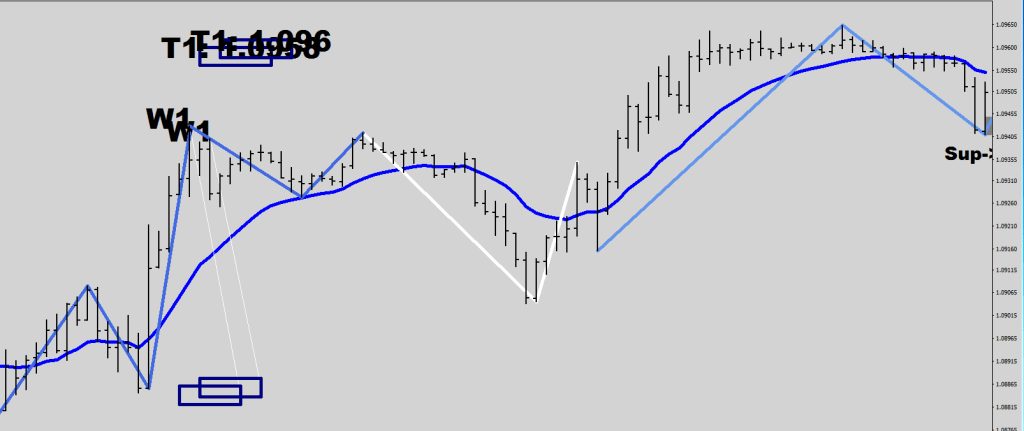
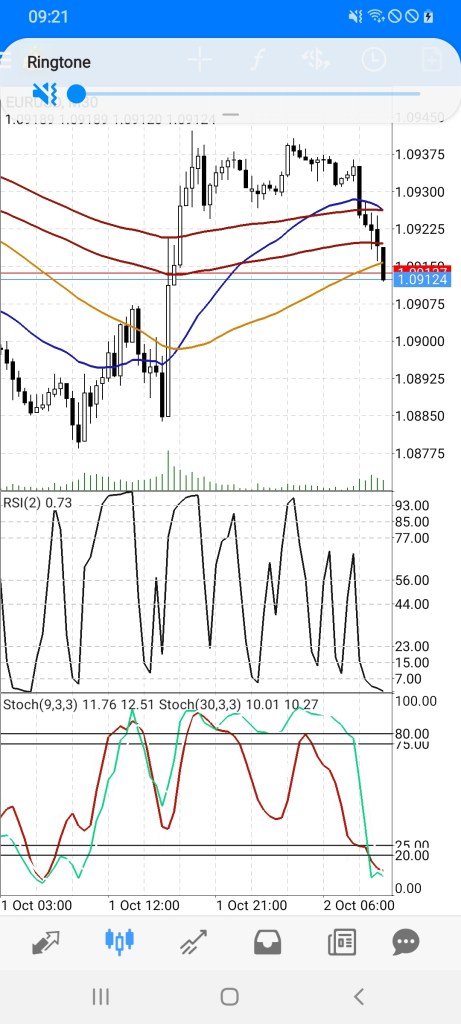
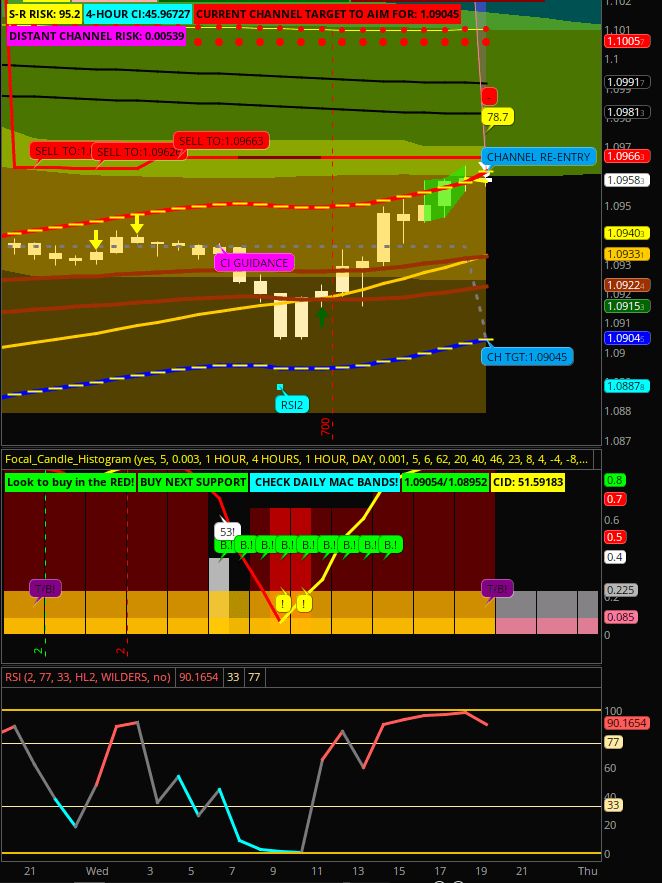
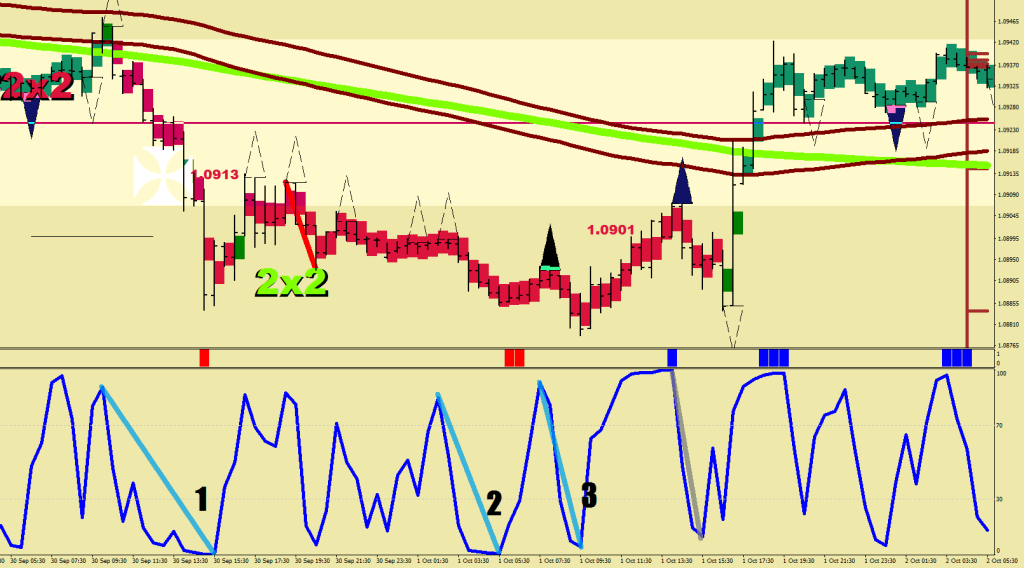
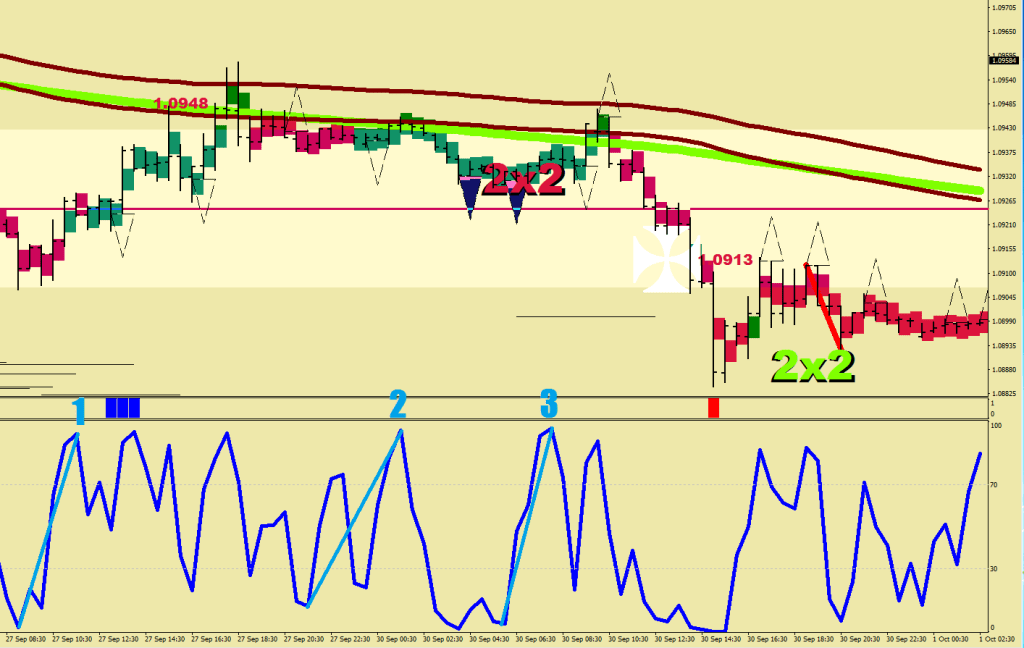
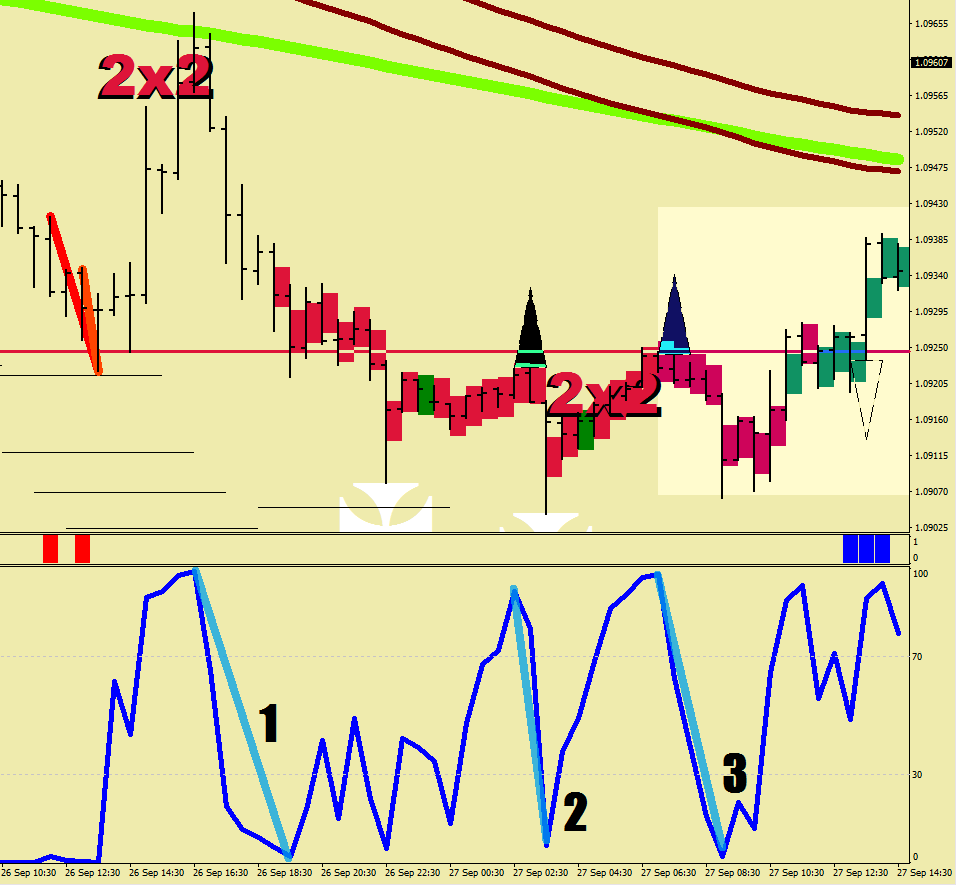
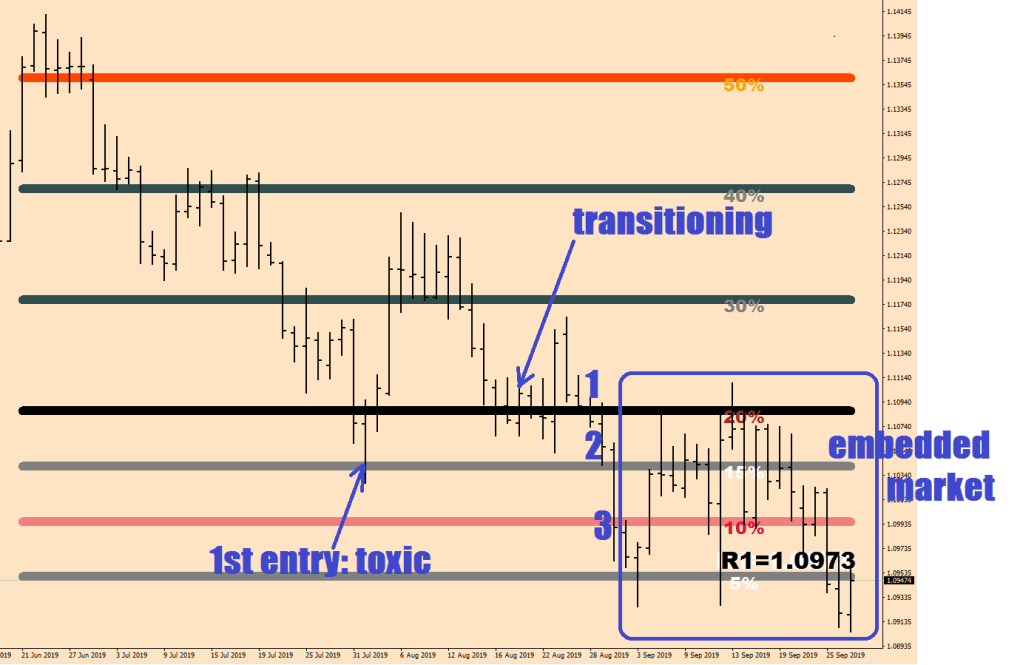
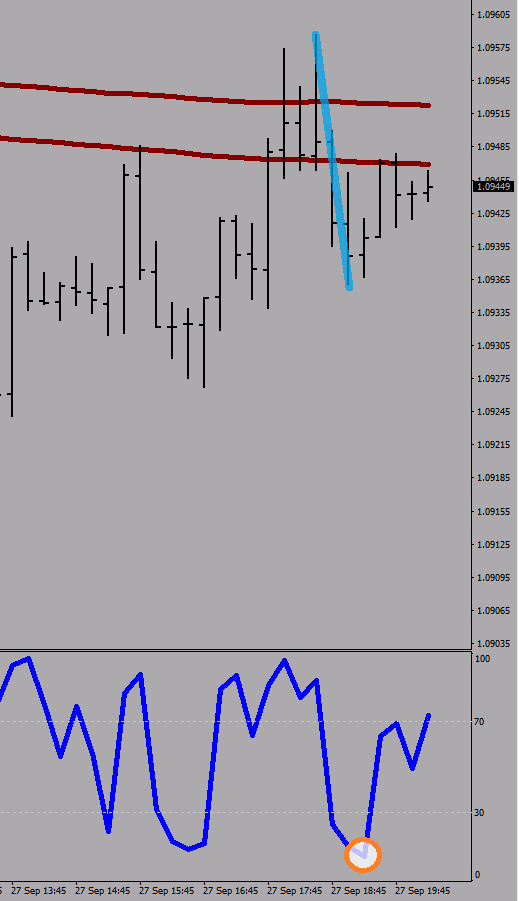
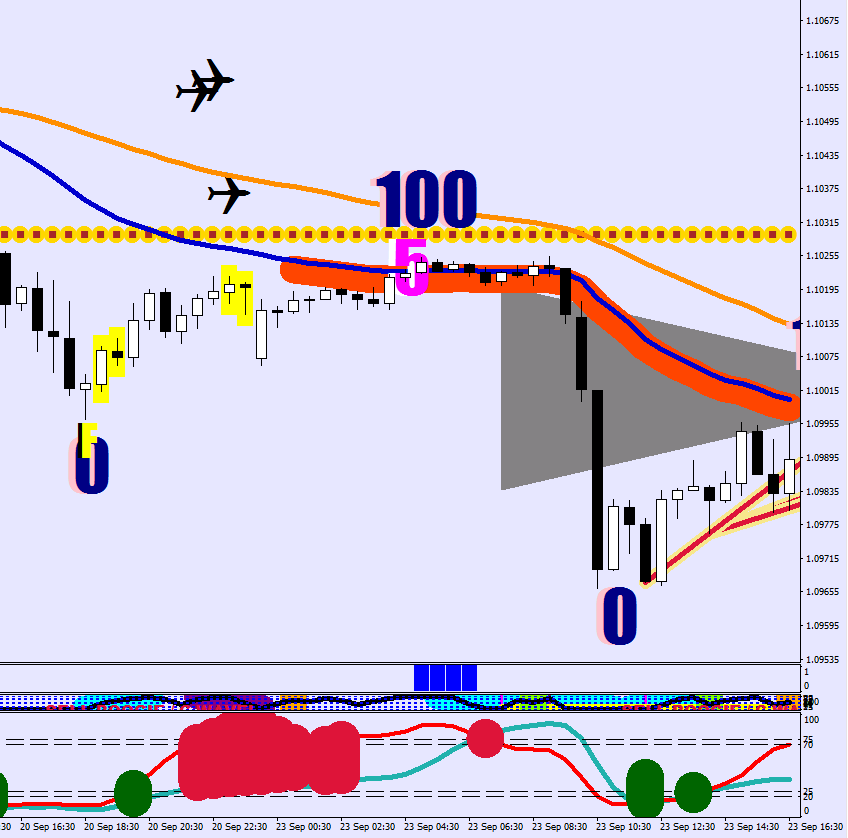
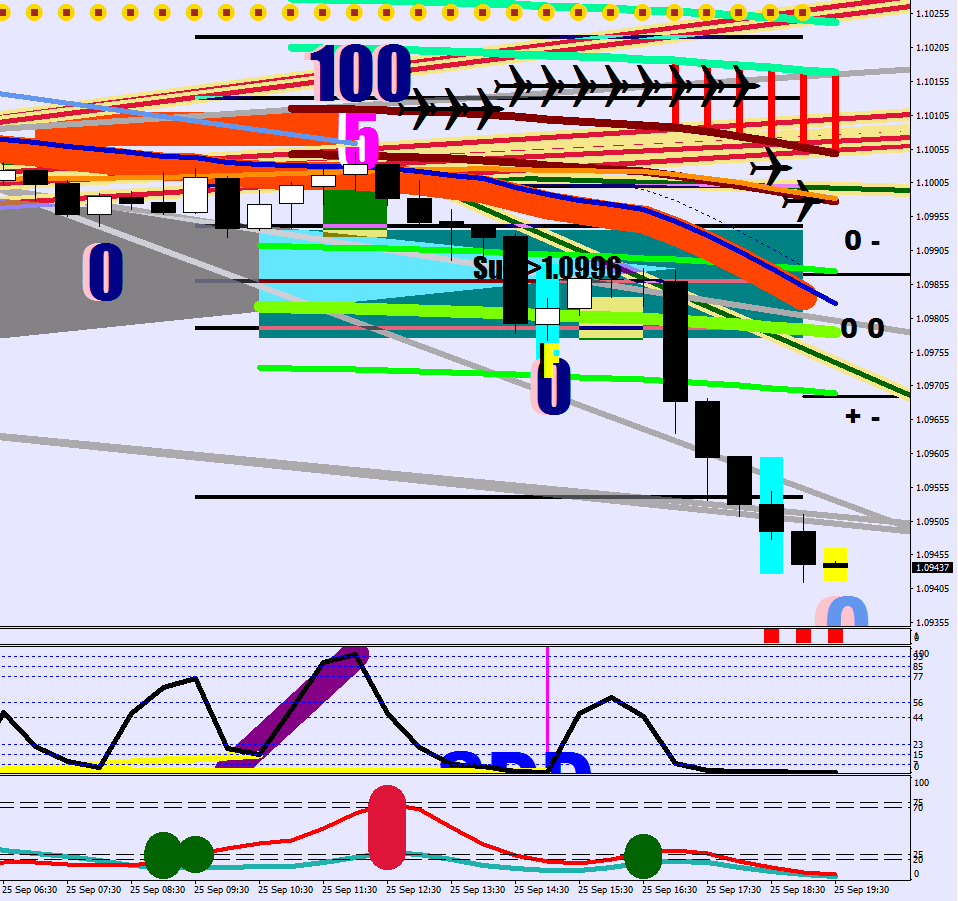
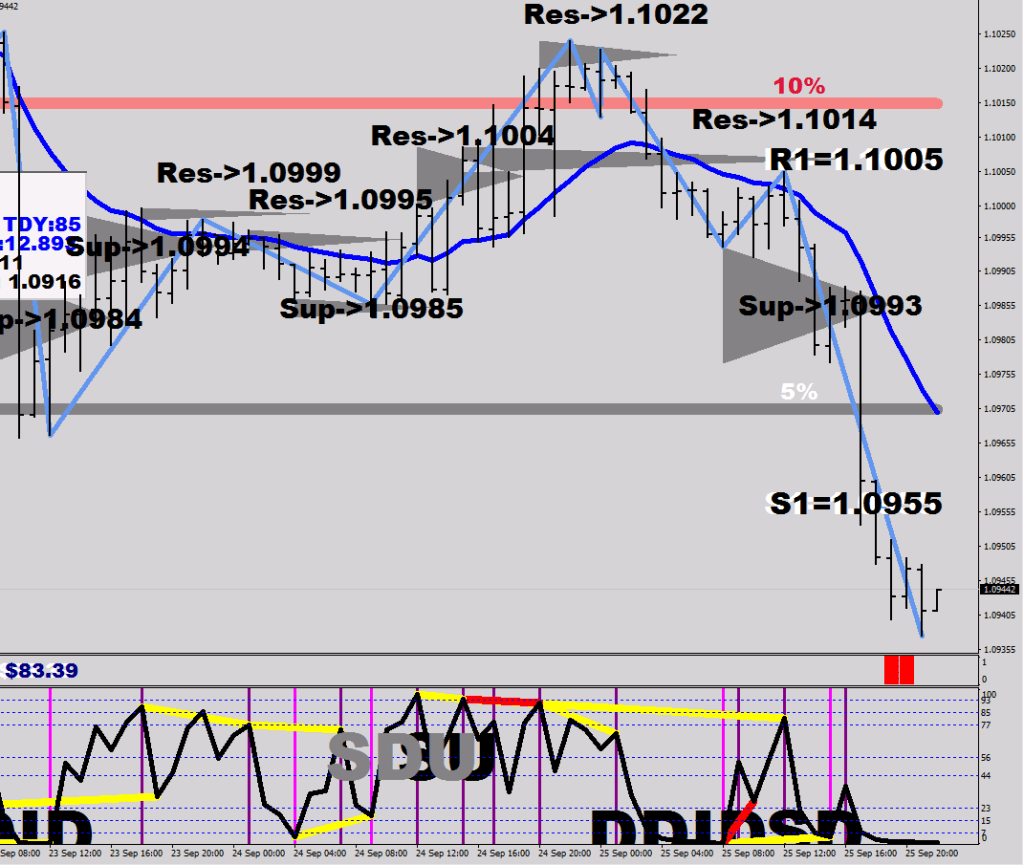
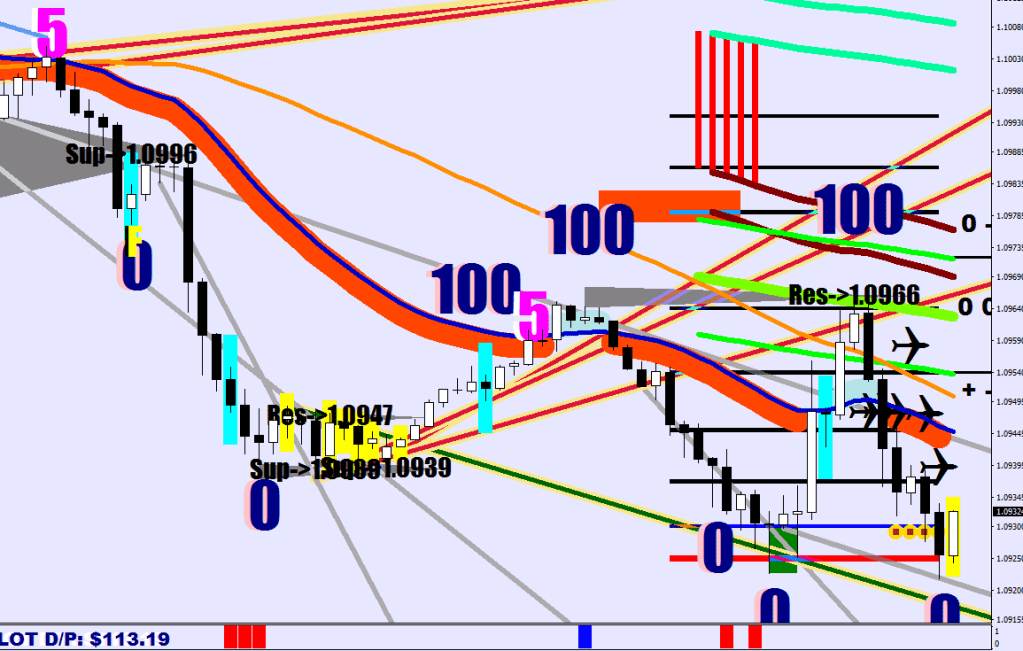
1, 2, 3 are the 3 daily closes outside the oversold zone -> stochastic embedding.
Where was the last broken trend line? What does that mean for the current direction?
How Far can you go in that direction? (Energy Bands)
How Far would the daily fuel limit support the move without trending?
What wave are you in? Whoop, Bam or Boogie?
Talk about the interactions with the comfort levels
How does the market behave around overbought / oversold? – does it stay embedded? = Trending
Was there any volatility breach on the CI? Has the outside value it been beat for a reversal to take place?
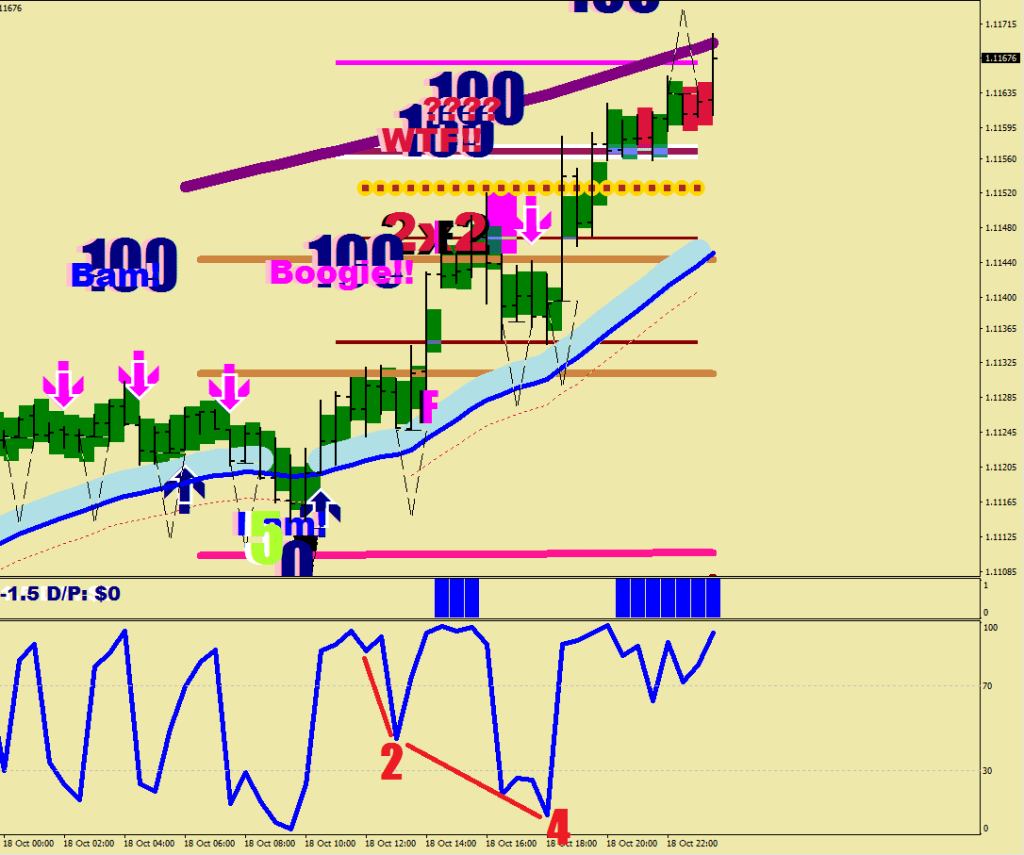
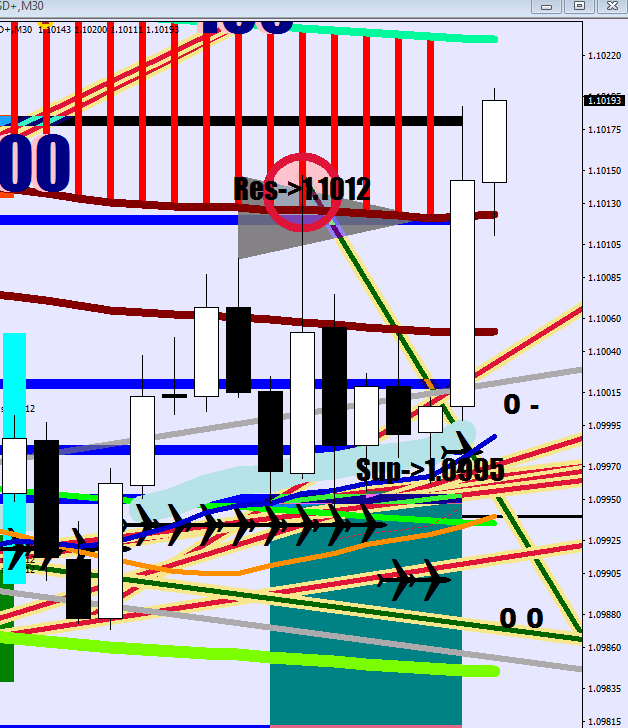
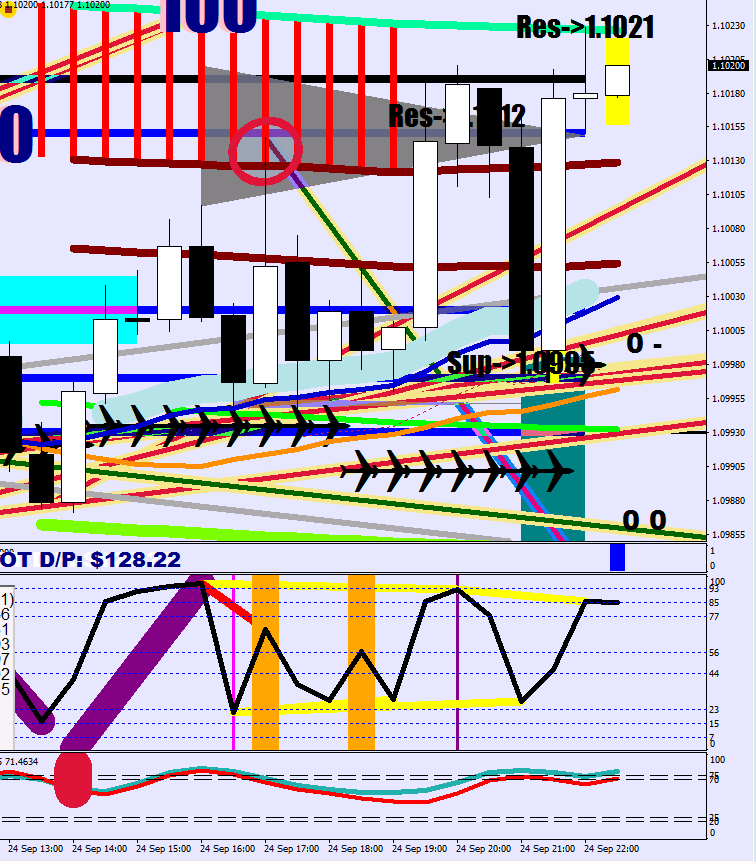
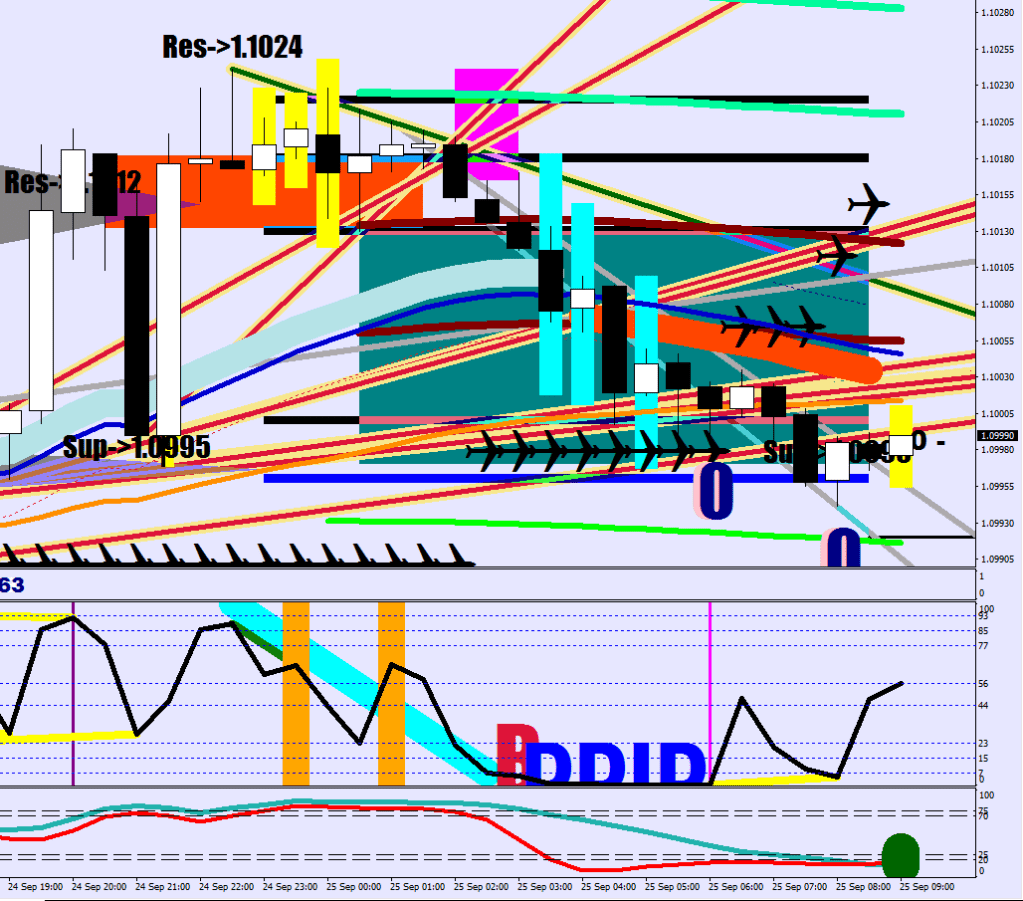
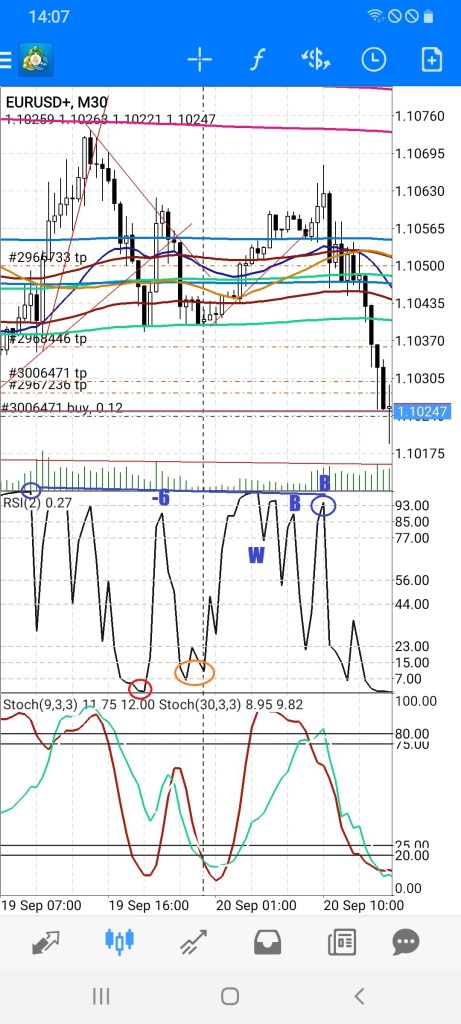
Pull up the 30-minute chart and talk about it
What market segment are you in? (Neutral, Bear Zone 1, 2 or Bull Zone 1,2)
If the market is trending or is in Bear / Bull Zone, you should fade the attacks on the E-16 if the Purple Haze hasn’t been attacked twice.
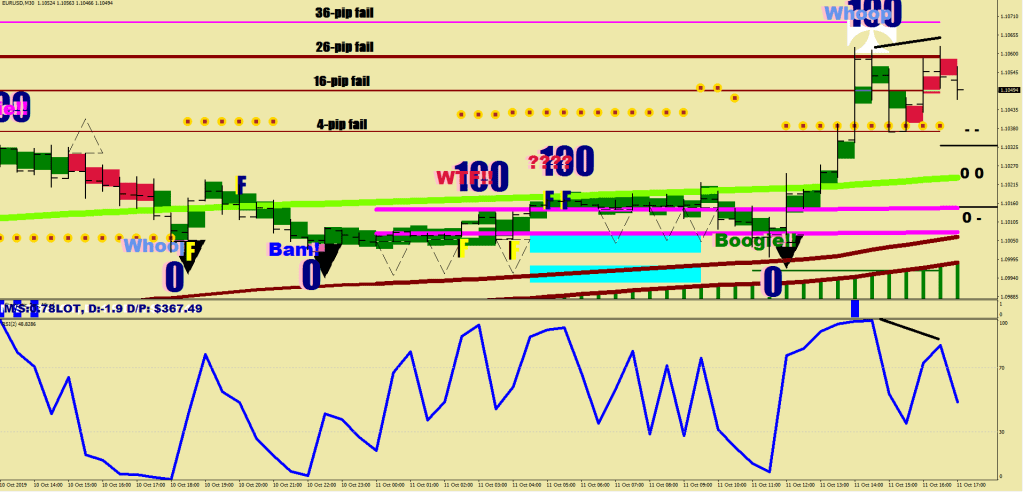
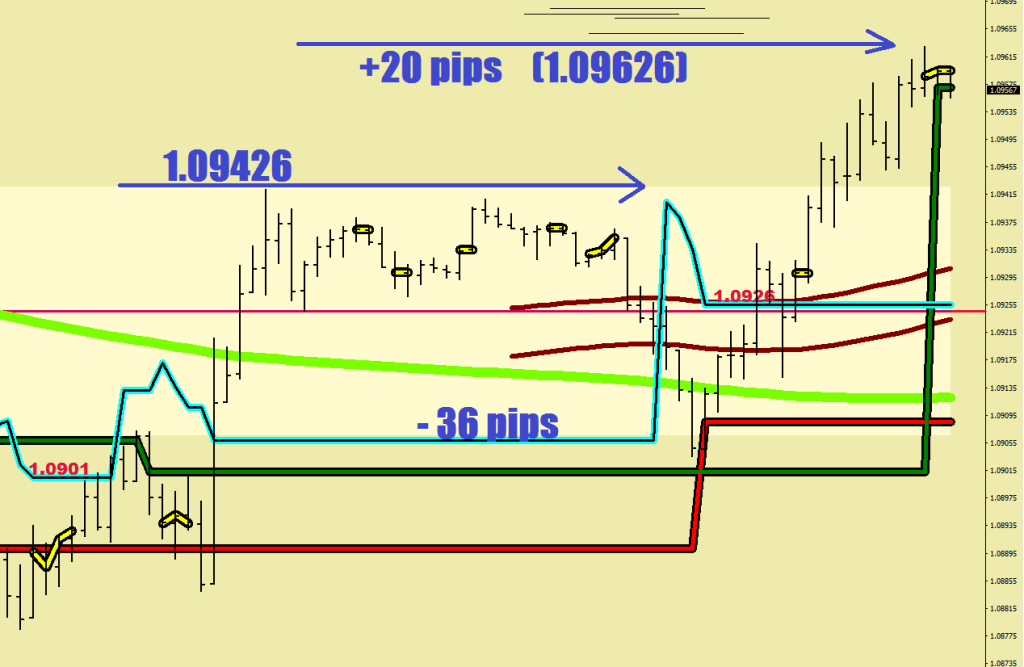
What are the last Boogie Fail lines (4, 16, 26 and 36 pips out)?
Stochastic bars… Do they show a head by not being present on the last run?
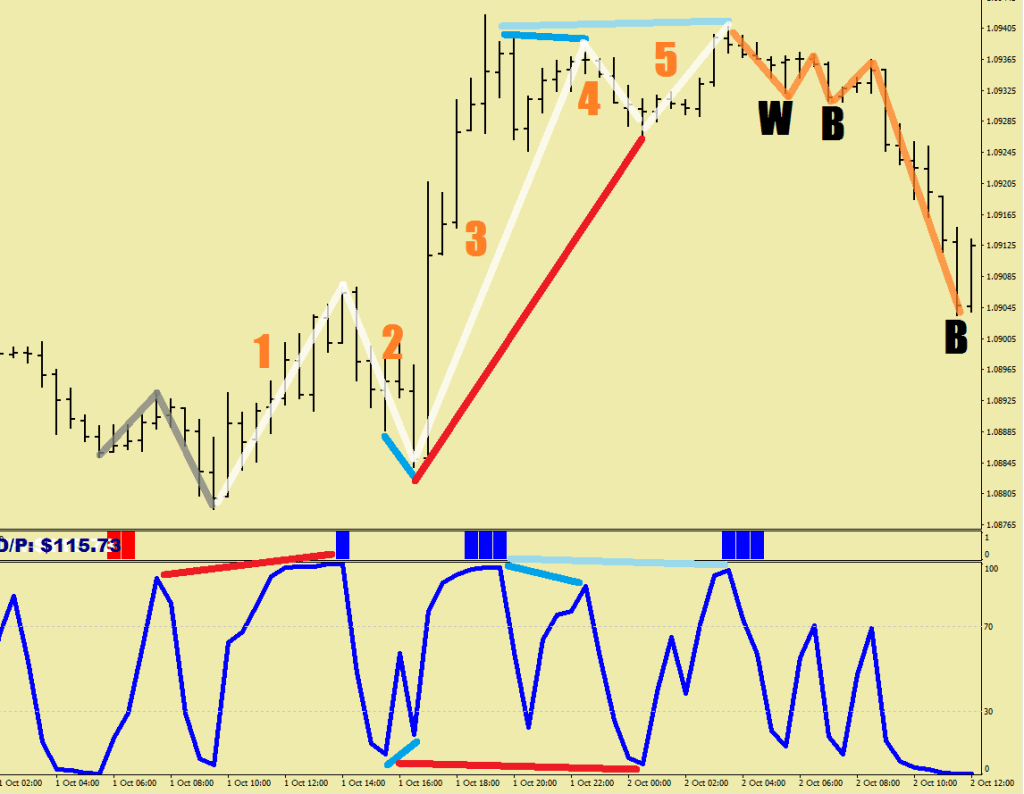
Can you spot the last two continuation divergences on the RSI2? Wave 2 and Wave 4 end points?
If you have holdings not aligned with the direction you must hedge / over compensate 2-pips above the high / 2-pips below the arrow of a counter-directional arrow and hold
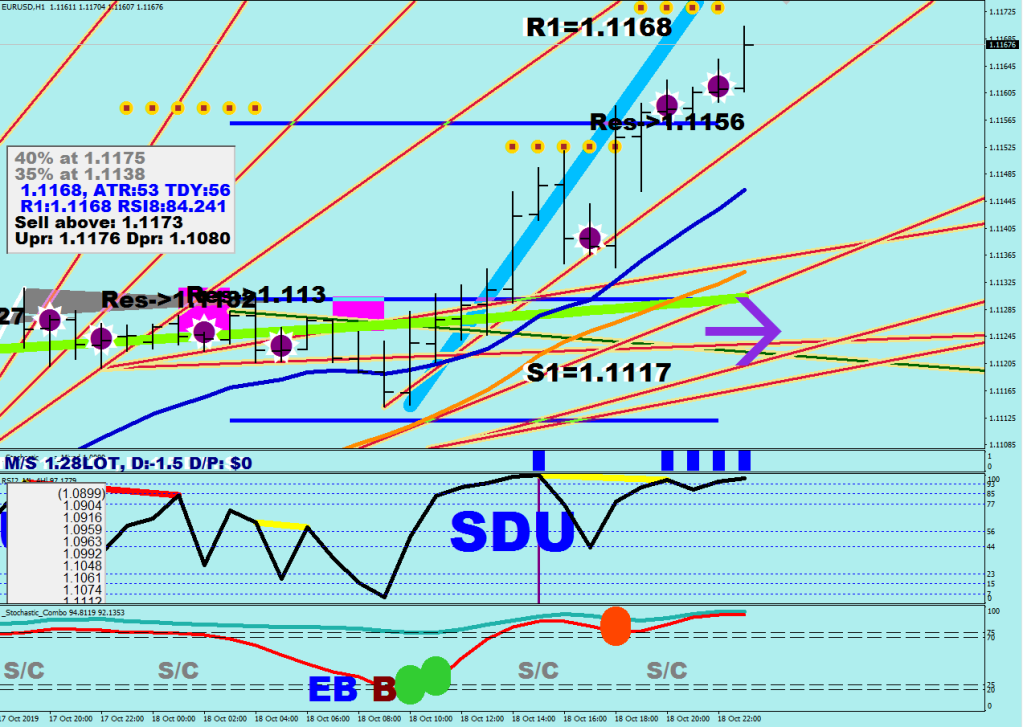
Pull up the hourly chart, and talk about it
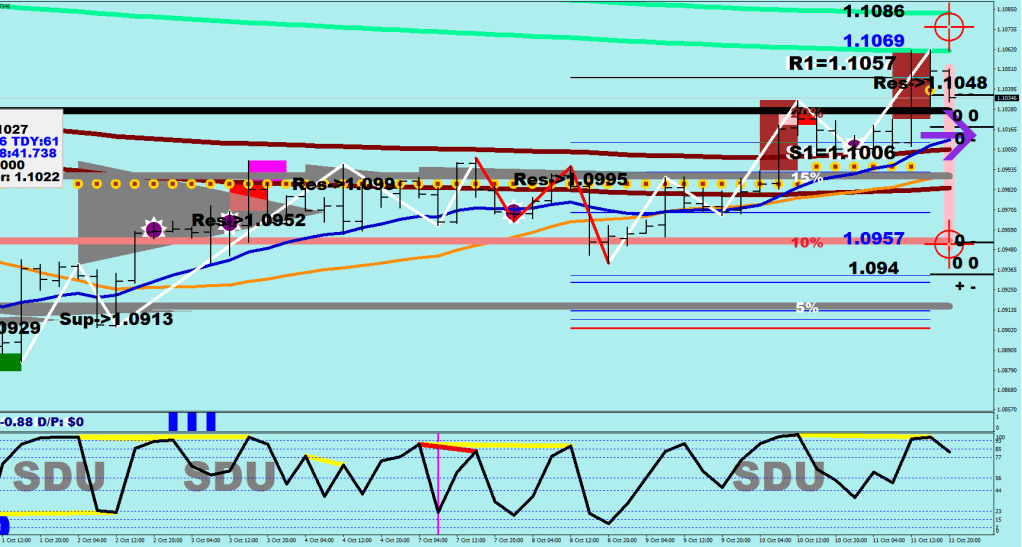
What are the 4H support and resistance numbers (Comfort levels)?
Are the mid-term memory support levels mostly above or below?
What is your suggested maximum naked risk size?
What is the current balance of your holdings?
The stochastic combo is your timer for getting in on the direction (is the 30-sample D embedded?)
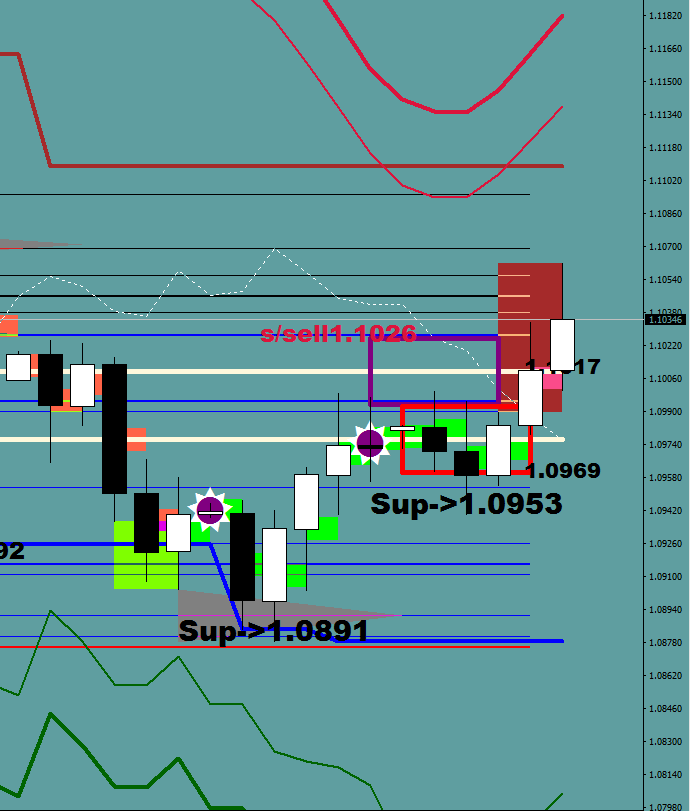
The conditional buys / sells (s/c, b/c) need fine tuning by the use of a 30-minute chart
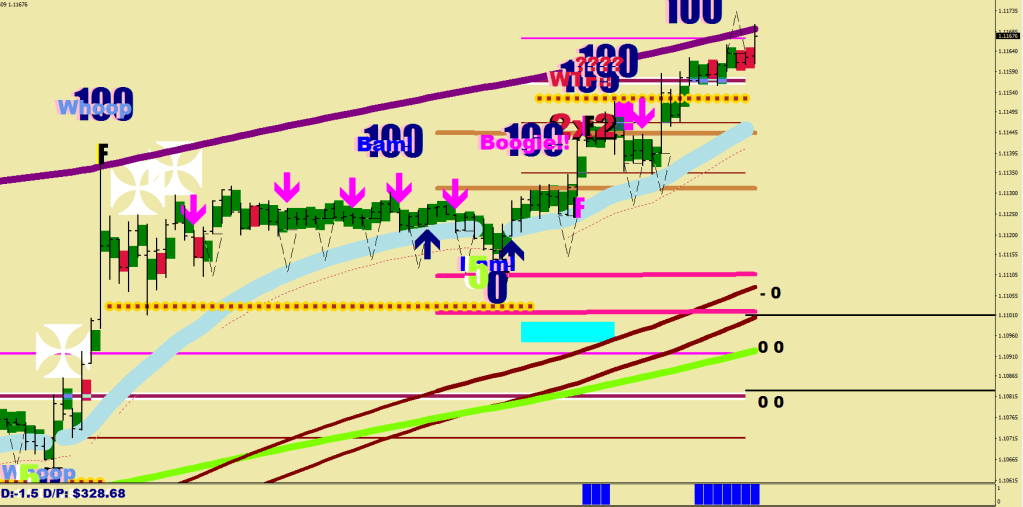
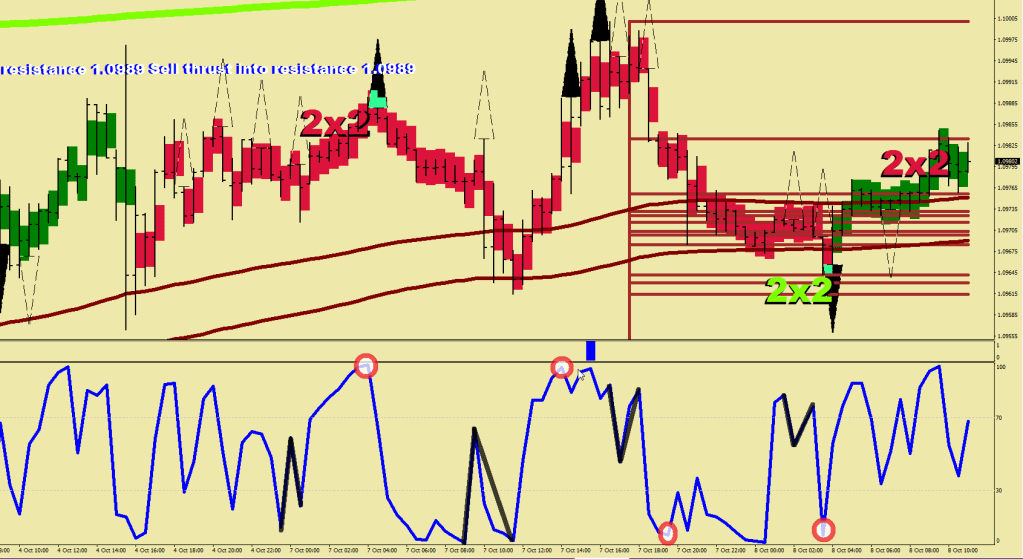
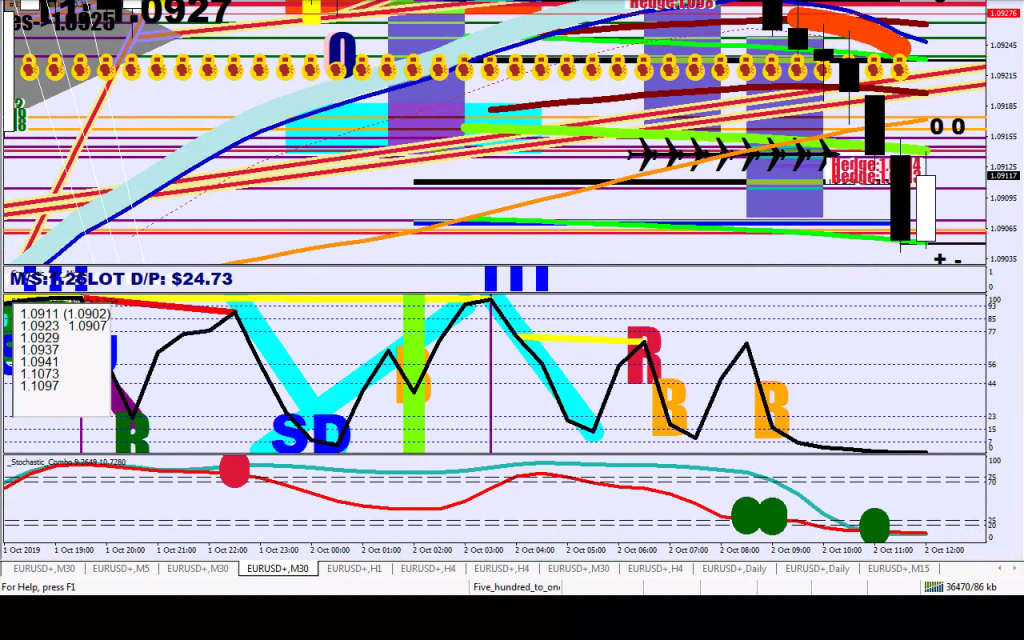
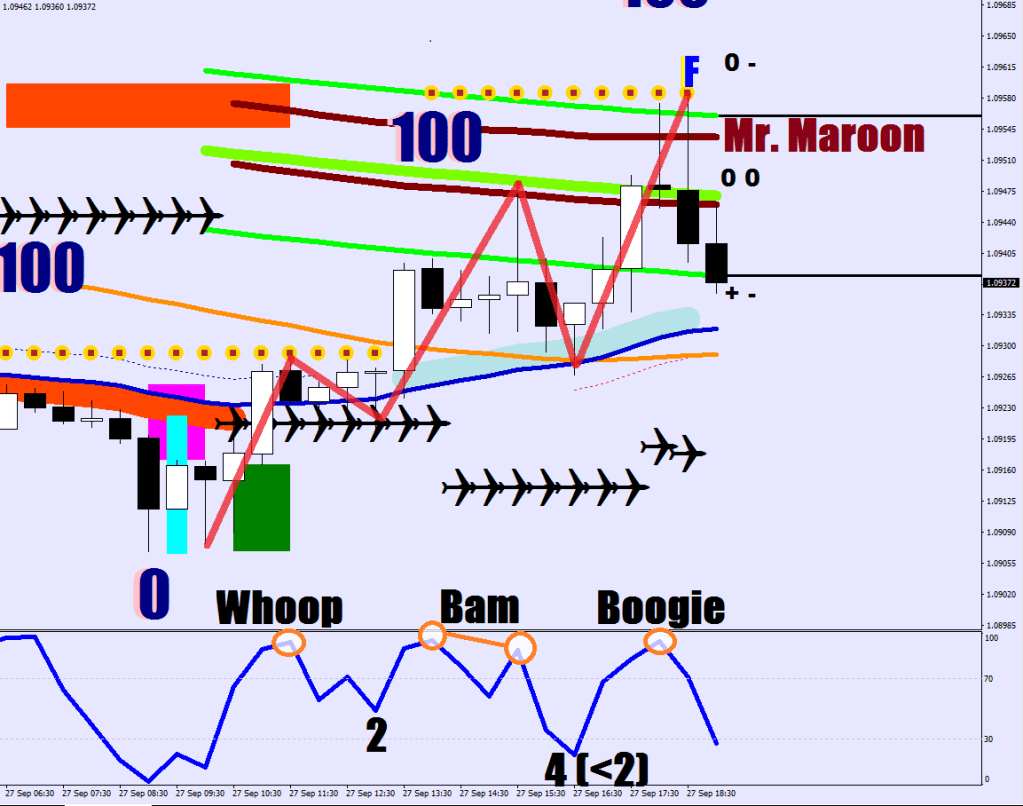
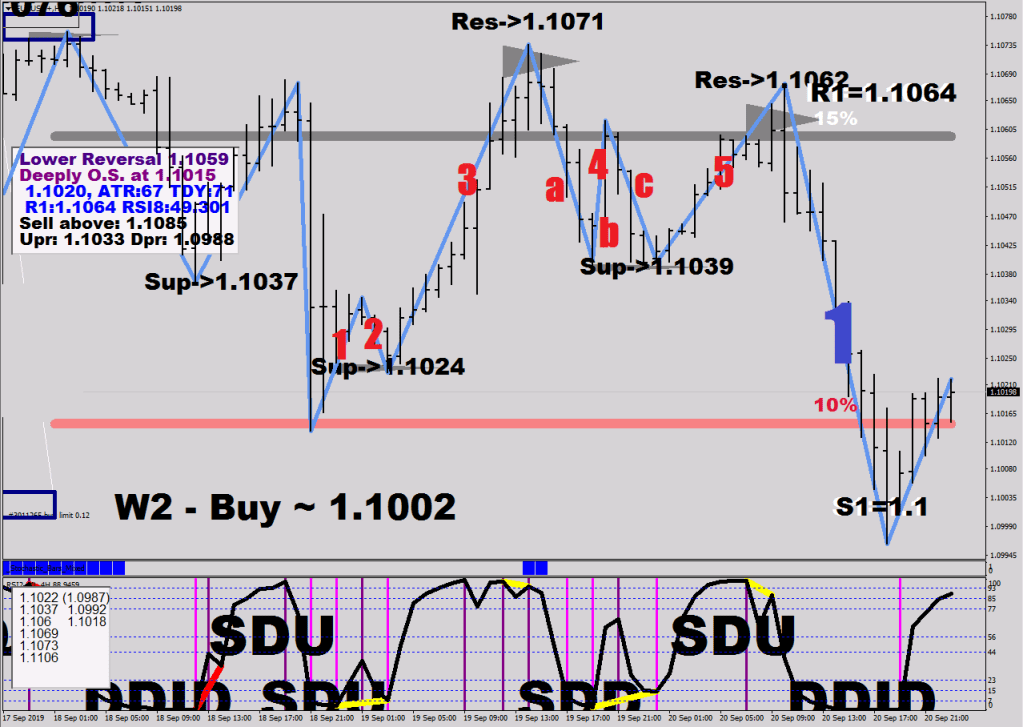
The last wave does not end on a high/low note, hence the back test of the top / bottom for measuring purposes. The divergence at the back test of the top is shown by the black lines. The failure lines are relative from the Wave 3 peak.
Whoop and Bam were the A and the C terminal of wave 4.
Admittedly, it was a little hard to separate the wave 4 from the wave 5 because of the undercut of the low, and 30-minute wasn’t the best for that.
So what exactly went down (beyond a possible fake out of the long term oversold neckline / bear market).
You’ve been getting these double humps for the impulsive waves that were characterized by letting the RSI drop to the lowest possible level to make for maximum umph length on the final thrusts up.
So what now? Being outside the oversold for one day does not change anything, it is called “saving” if the next day closes back in the oversold.
If you end up with multiple closes outside, the market would have transitioned to a balanced/commuting market where the bulls should be aiming for the median at 1.1250 as primary goal.
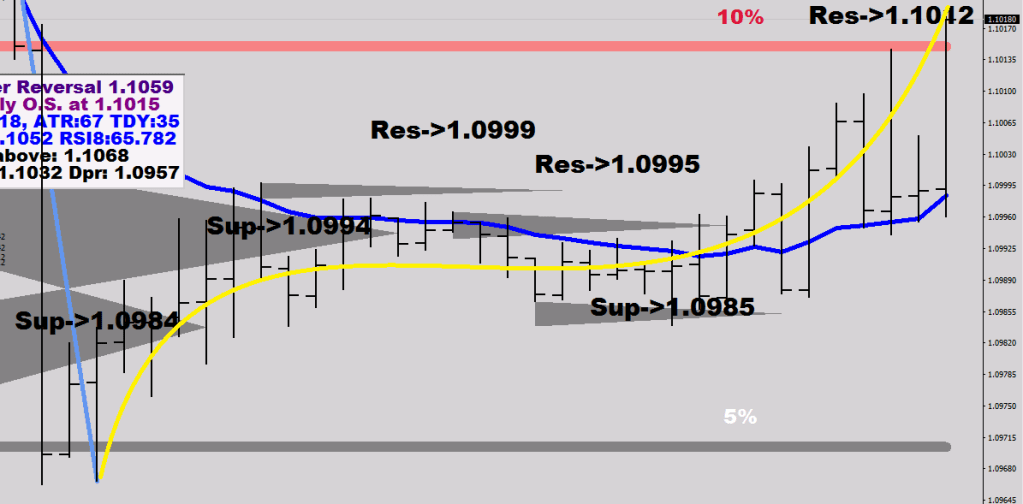
Most likely you shall see the long overdue ABC correction – usually 2 4H dojis lower for the hourly stochastic would have to go oversold twice. This would put price back below the 4-H Maroon at 1.0974 with a small, say 10-pip undercut for good measure.
However is all the selling that is about to take place would not be able to keep the price below the oversold neckline, the bear market would be over with until further notice.
It would certainly clear up the intentions to see where they place the price upon the Sunday open.
Bull zone 1 neckline (Upper Guard Rail in green) giving the first slam.
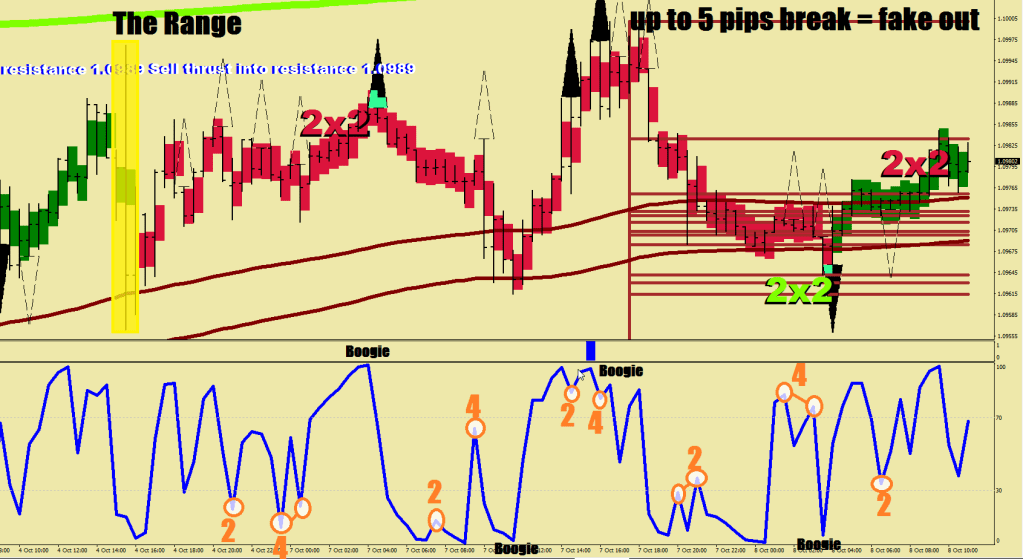
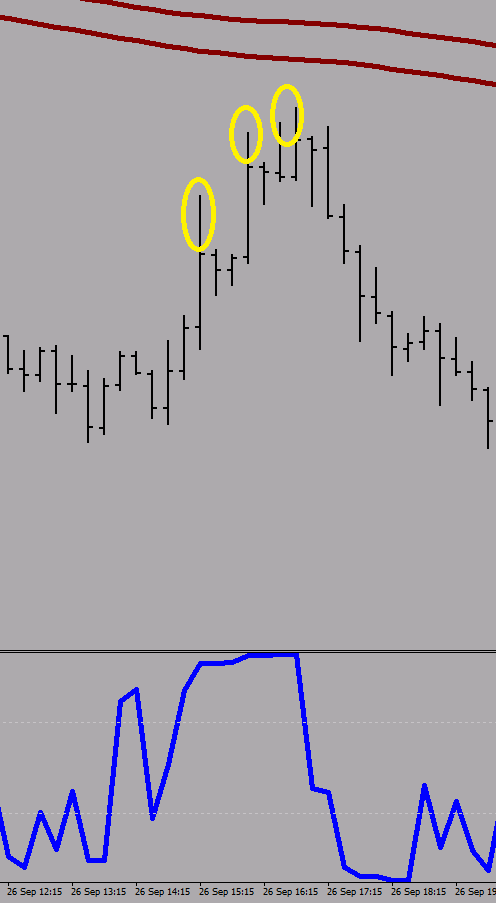
The next image shows how to find the Boogie hump – since these are not waves.
Once you found your hump 2 and hump 4 hooks, you know that you are in the Boogie leg. This is where you close the previous direction and roll into the opposite one.
As you can see, sometimes there is a second peak, mostly for 4-s, but sometimes for 2-s as well, what makes an echo-like peak a suspect is the close proximity in time.
On the way up the 4 would reach lower than the 2 and the opposite goes for the downside.
On the picture above you can say that you are in a hump 3 to the upside since a #4 hasn’t printed yet. You could also say that the market is potentially printing an inverted ABC.
So, let’s talk about another signal for catching a turn: the inverse ABC.
On RSI2, of course.
The inverted ABC (in black) comes from the oversold / overbought area and the C leg would fall short from the RSI starting point of A.
For exit you can utilize the nearest Peak (Oil) or one of the Boogie humps – that may or may not coincide.
I just made my usual line adjustments, posted this image, when I realized that the volatility whip is way more common than anyone would think.
It feels like they throw the ball up in the air, and which ever team takes hold of it has the right for the next wave sequence.
This was the tricky one, where the volatility whip got broken on the unexpected side for another 5 waves up.
Admittedly, it was terribly hard to get the wave count accurate on this section.
In conclusion, what can be said about the whips, is that you want to go with the direction that steps outside the V, with your stop loss beyond the other end, but also, that you should be giving some slack, i.e. 5 pips out to get excited.
Picture showing the pullback just missing the value at 5 pips out:
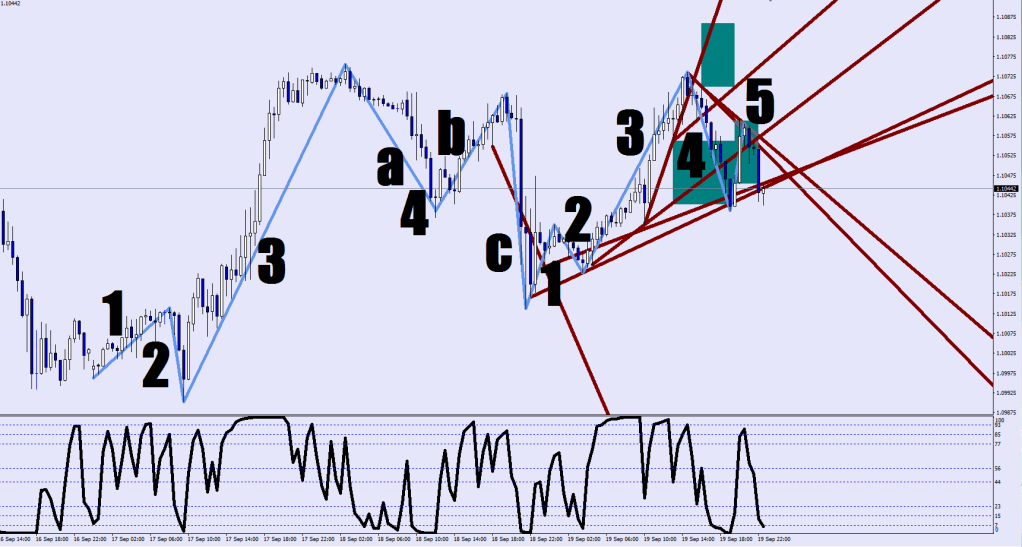
First let’s start with your exercise exercise in recognising waves.
Please show me the volatility whip that preceded the wave structure to the upside.
Show me wave 1 ending up with a continuation divergence to the vol whip.
Show me wave 2 ending in a reversal divergence
Show me wave 3 ending in a reversal divergence
Show me wave 4 ending in a continuation divergence to wave 2’s terminal RSI reading
Show me wave 5 ending in a reversal divergence to the peak RSI reading
Tell me what wave we are in, and if it has reached its target. Why? What structural support do you see for a confluence with the continuation divergence?
For plus points explain what effect did the volatility crush have on wave 5. What is the biggest enemy of volatility? What RSI reading would wave 2 up have to reach so that wave 3 down would can score its full lambda?
Now, for the 3 Full Lambdas
I count lambdas on 30 minute, maximum 10 samples reaching a span of 82 points.
For finding these quickly, without having to measure at all, you can utiliae the blocks I marked up on my RSI plots: if one end falls I an outer box and the other end touches one box in, price has made the span.
The next image shows 2 down full lambdas in cyan marker, but only the one on the right should be counted, for the other one was before the upside structure got completed.
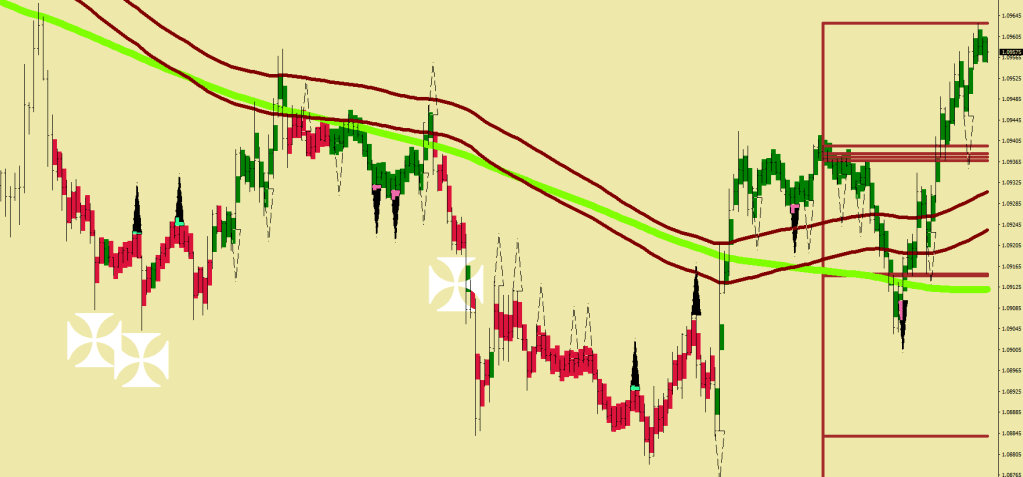
Wave 3 of Wave 1 down took out the sound barrier (brownknopf with sound ticks) – a feature of a Wave 3
I’m not at home yet, but I need to make one correction. After a Wave 5, you do not always get a Wave 1 in the opposite direction. At times, you would get a volatility whip – one I just pointed out earlier – the second, in the opposite direction just transpired. These no break extensions are follow ups to a volatility breach. See the 4h image below.
Check what happens when the consolidation line breaches the volatility bracket – you get an undercut / or an above cut that ultimately reverses the price. I insist that these moves aren’t waves, they are mere fluctuations.
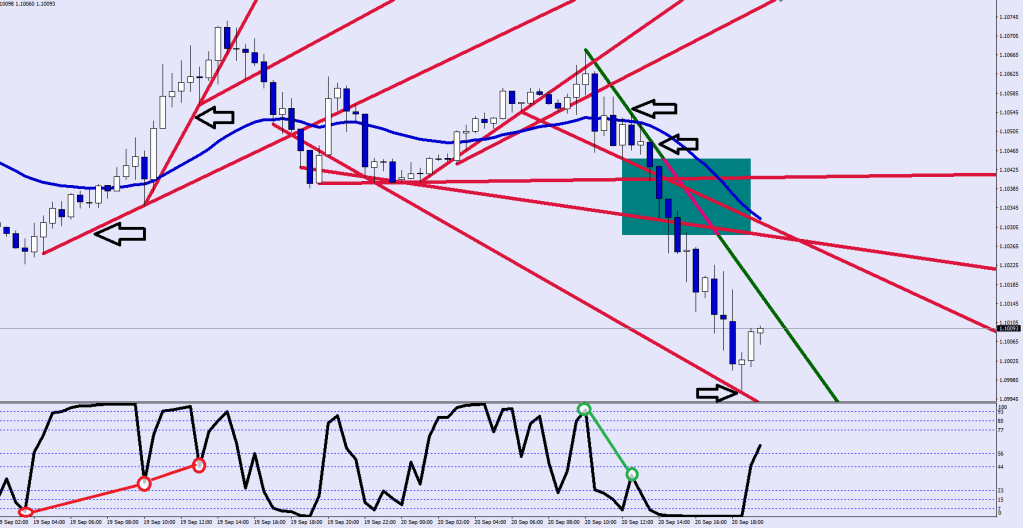
The divergences I was asking about
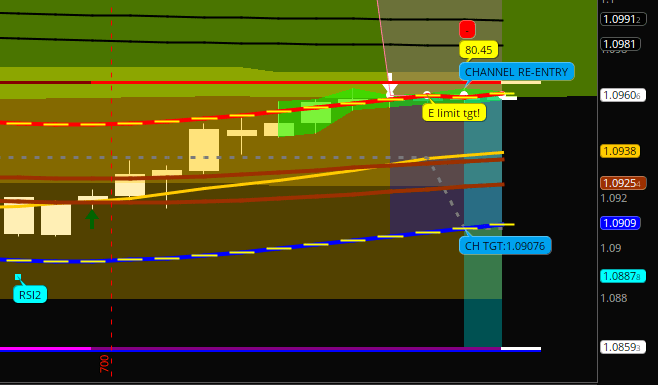
Current channel target reading
RSI2 Direccione
PKTE Boxes
Explanation of a no break extension: the price “fluctuates” around the recent outer value to recharge energy. The beat can be: 4 pips failure 16 pips failure 26 pips failure 36 pips failure
3 Full Lambdas 1
3 Full Lambdas 2
Check out the span “Bam” managed to muster it is a Wave 3 you are looking at during a volatility crush.
Let’s try to solve most of the problems you have been having with trading in one single article.
First, a practical example and then the theories later.
This bottom had developed by the morning:
This meant that the bears were spent for now. The red circles are the 3 largest wicks.
I was busy in the morning and missed out on the long entries, although I knew what the target was going to be. You see, there is no random stuff here, things happen methodically and with a reason.
There is a lot going on in this image, but what matters for now is that the target was the Fake Out of Mr. Maroon, and the wave structure is important as well as the wave 4 landing yet again on E-16 and the same time on the top of wave 1. Notice that the legs up tend to be about 2.5 hours long.
I put in some pending orders and traded on the fly while I was commuting home from work.
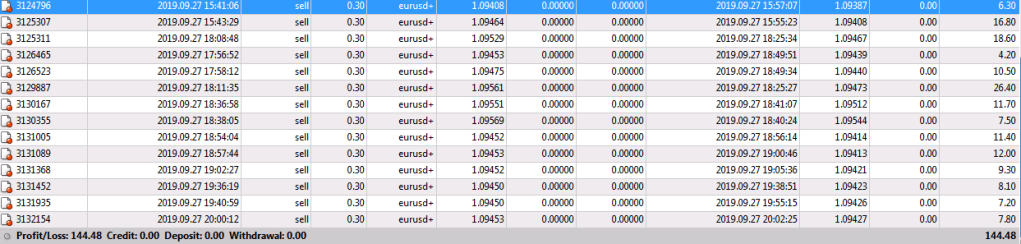
Knowing the things I know can virtually guarantee you daily 5-10% gains, and nominally this is more what a Plant Room Assistant makes on a daily basis – believe me, I know. This in on a 1k basis – I would be closing the week with 1,652.61.
So, what are the reasons behind the generic unconscious incompetence?
Not knowing / not acknowledging the type of market you are in. There are markets with edges, which are the embedded markets and markets with no edges / leveled play field.
When a market is embedded, that means that either the bulls or the bears have advantages over one another. This imbalance in the game rules results in bull or bear market.
Whenever people yell bear market on TV, they clearly do not know what they are talking about. 25% correction? Based on what? Price of the index/stock? 25% compared to the range top-range bottom in the last year? Losing the overbought status gives the opportunity to the bears to utilize their surprise/time advantage and make some major damage by i.e. taking the ball from the overbought court to the oversold one, but this move does not have to result in a bear market setting in: for the embedding to develop price not only has to go down, but also stay down for a prolonged period. Becoming freshly oversold does not give bears any advantages, it is quite the opposite that is true.
for more on this please refer to my articles based on my Comfort Levels indicator
Not understanding the rules of embedding.
Let’s discuss the EUR/USD that has been in bear market for a month. What rules apply here for the bulls? They are playing with handicap. In bear land, the objective of a bull is to score a Wave 1 out of the first 3 tries. Their time is restricted for each leg, they get less than 3 hours of try below E16. Once the 3 attempts are up, the bears get to go hard for 5 waves (3 pushes) down. The bears objective is to keep making lower lows.
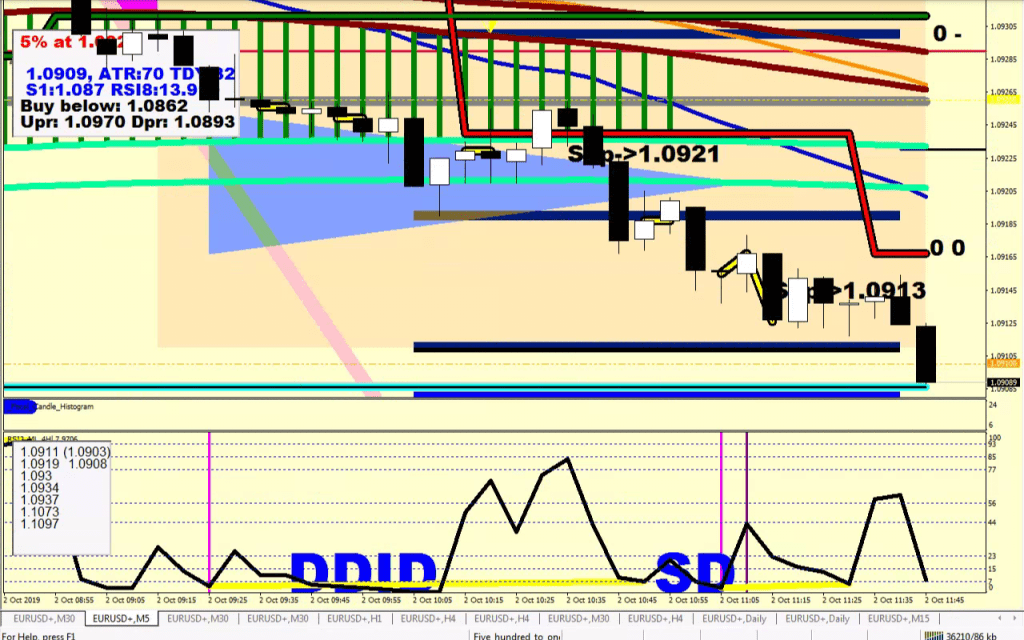
Let’s talk about what went down after the market printed an end of wave 5 of Wave 5. There was a strength/measure attempt. It did not qualify. Although this is not a wave that gets a count, it still has a wave-like structure to it.
You can’t see the Whoop-Bam-Boogie structure, not even on this 15-minute zoom.
The 5-minute RSI2 could help spotting this SOS print.
A Sign Of Strength is what it’s name says, a visible measure of buying, yet since it falls short from being able to fake out Mr. Maroon, it is a short term, immediate sell signal (all the attempts to the upside got broken 3 times in a row) for five legs down – which aren’t expected to get very far, after all.
Mr. Maroon is the 135 High and Low EMA pair on 30 min. A fake out on the upside is a hit between -3 and +8 pips of the High EMA.
What happens next? 3 opportunities for the Bears to try to push this down. The shallowest kind of pullback would merely do some faking out on the Low end of Mr. Maroon, and there would be the bulls turn again for Wave 3 up, all five legs of it. I don’t expect the E16 violated by much on the following 2 more attempts down, but we shall see. 3 pips below is the algo buy area. The Bulls have registered a right for a Wave 3 and a Wave 5 to the upside. And this time with the 2.5 hours per leg time restriction lifted.
This image shows the 3 Full Lambda moves down (cyan markers) plus how the red “R” that got broken became the green “R” – rebound – to buy.
In trading you need to outlive, outlast, outperform.
To stay in business, you must mean business.
There are things to grab on to in order to get the wave count right.
One of these things is the 1st return to the E-16 after a 9-sample separation.
If Wave 4 gets a kick in the face here, you would see a violent Wave 5.
I mentioned earlier about the Shape that it followed a Wave 5.
There you go, in nice magenta.
And today, another one?!
Wave 4 was a liquidity break – hence the purple stripe. When would this Wave 5 end? I mentioned it enough times, there should be a divergence between the measuring leg and the divergent one. Currently the measuring leg is printing.
There was a common thread, trending. That is what I store in the E16NRed array (thick orange on the plots). Empty=no trend.
Since it is a counter-move, the likelihood for its starting point is in Bear Zone 1 or Bull Zone 1, after a Wave 5.
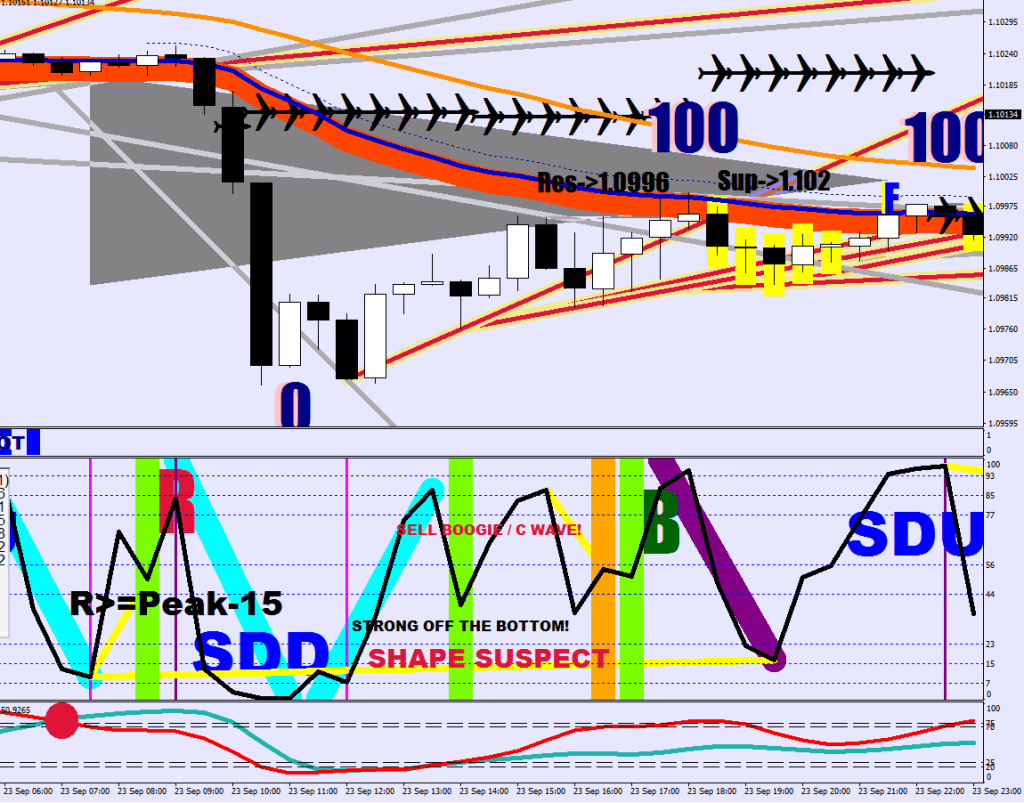
The shape develops as a result of a “Stong Off The Bottom/Top” move.
///Strong Off The Bottom
RSI[i+1]>RSI[i+4]*3.5 && RSI[i+2]<RSI[i+5]*3.5
///Strong Off The Top
RSI[i+1]<RSI[i+4]*.28 && RSI2[i+2]>RSI[i+5]*.28
///where RSI is an 8-sample HL2
The last cyan tilted line up is a shot over the bow / “full lambda move”. After a move like that, within reasonable time a deep pull back is to join in on (see red R earlier) or a B represents a break out.
The following image shows the ABC structure beneath the shape.
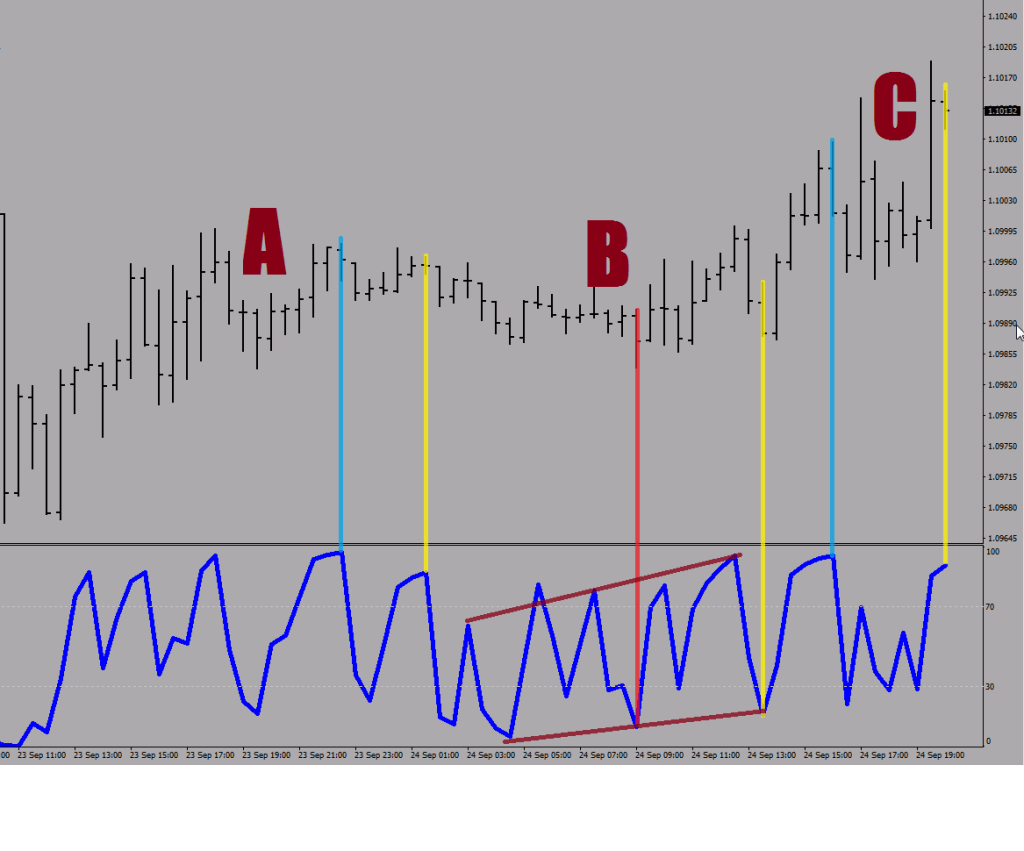
A, B and C waves each end up when they have printed a measuring leg (blue/red) and a divergent leg (yellow) that makes a (near) higher high / with still overbought/oversold RSI2 reading, but with a rather divergent value.
As you can see, the pullbacks are very muted, and throughout the whole structure it is virtually suicidal defying the shape’s direction (during this 5% correction), for the maximum holding time of a short was less than 1h on average. The long wick on the spike up did not register an overbought RSI, but it did clear orders out of the way making way for the last thrust up.
The last image shows the reaction that occurred from the spark zone, the subsequent trend line that was printed by the pullback and the break that was to happen in this current, trending state.
So, how is this market gonna reverse after all of this?
Measuring leg + divergent leg closes down leg C
You would see a full lambda move down
a) that would provide an entry either upon the break of the low or b) upon a deep pullback (>65)
When the sequence does not play out like this, you may end up getting liquidity breaks followed by more pronounced divergences (higher highs) on new divergent legs.
Second time in a row I get tricked by a Wave 4 to believe that it was over already. Needless to mention, this throws off the wave count.
I made this image yesterday.
I put a #5 where I should had put a “b”.
And that previous Wave 4 with its a-b-c was also longer than anticipated.
You see, Wave 2’s RSI2 extreme is the reference to the end point of Wave 4. Since Wave 3 has a tendency to expand on volatility, Wave 4 may end up showing up as three legs while the volatility starts contracting again.
The red circle shows the end of Wave 4’s A leg beating the reference reading of Wave 2, but also maxing out. At the same time, E16 (in blue) was deeply undercut (by more than 9 pips). The Orange Oval are the ending, divergent thrusts of the C leg of Wave 4. Wave 5 used the reference point of Wave 3, but it also went out on a limb by maxing out on the first try (Whoop). The “within six” reading should arrive in the right rhythm: on Boogie.
From what I see here, I can say that if the Wave 4 ends up violating E16, then you can expect one more leg out of it. One sign, that a follow-up is likely, that the RSI2 hits its limit on the pullback (0 or 100 on RSI2 30 min).
Another symptom of the 3 legged correction is that the 3rd leg takes a lot shorter time to print, because most of the orders already got filled on the first leg in the overlapping area.
In closing, I would like to share a few things about trend lines.
Avoid connecting the maxed out RSI2 readings
2. Using two colors can help you grasp the following thinking: when price is above the red line, it is in break out mode: trading above resistance. When price is trading below the green line, it is trading below support.
3. Trend lines can keep you in a trade longer, so it is beneficial to plot them.
4. Why don’t you make the plots automatic?
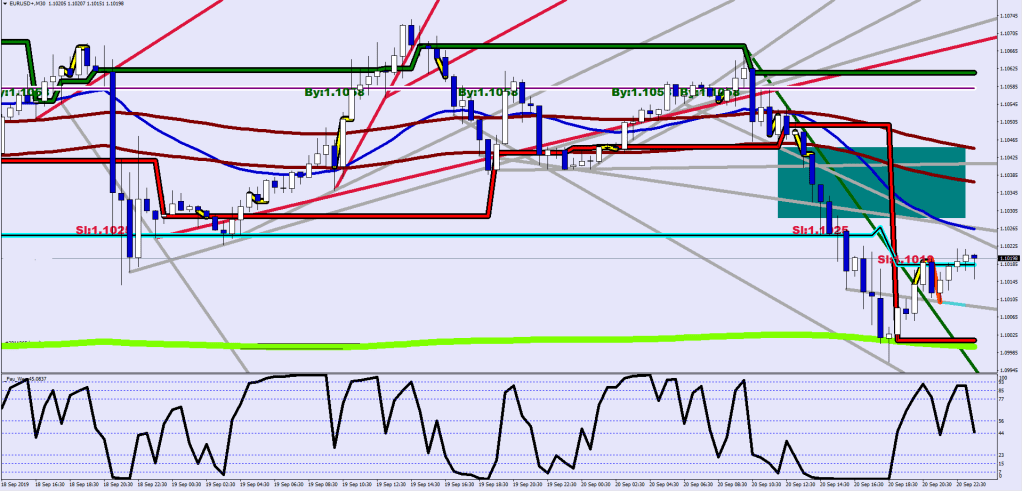
The gray ones are not “valid” trend lines, they are time out ones, which means that there were only 5 trend lines were printed in the last 3 days.