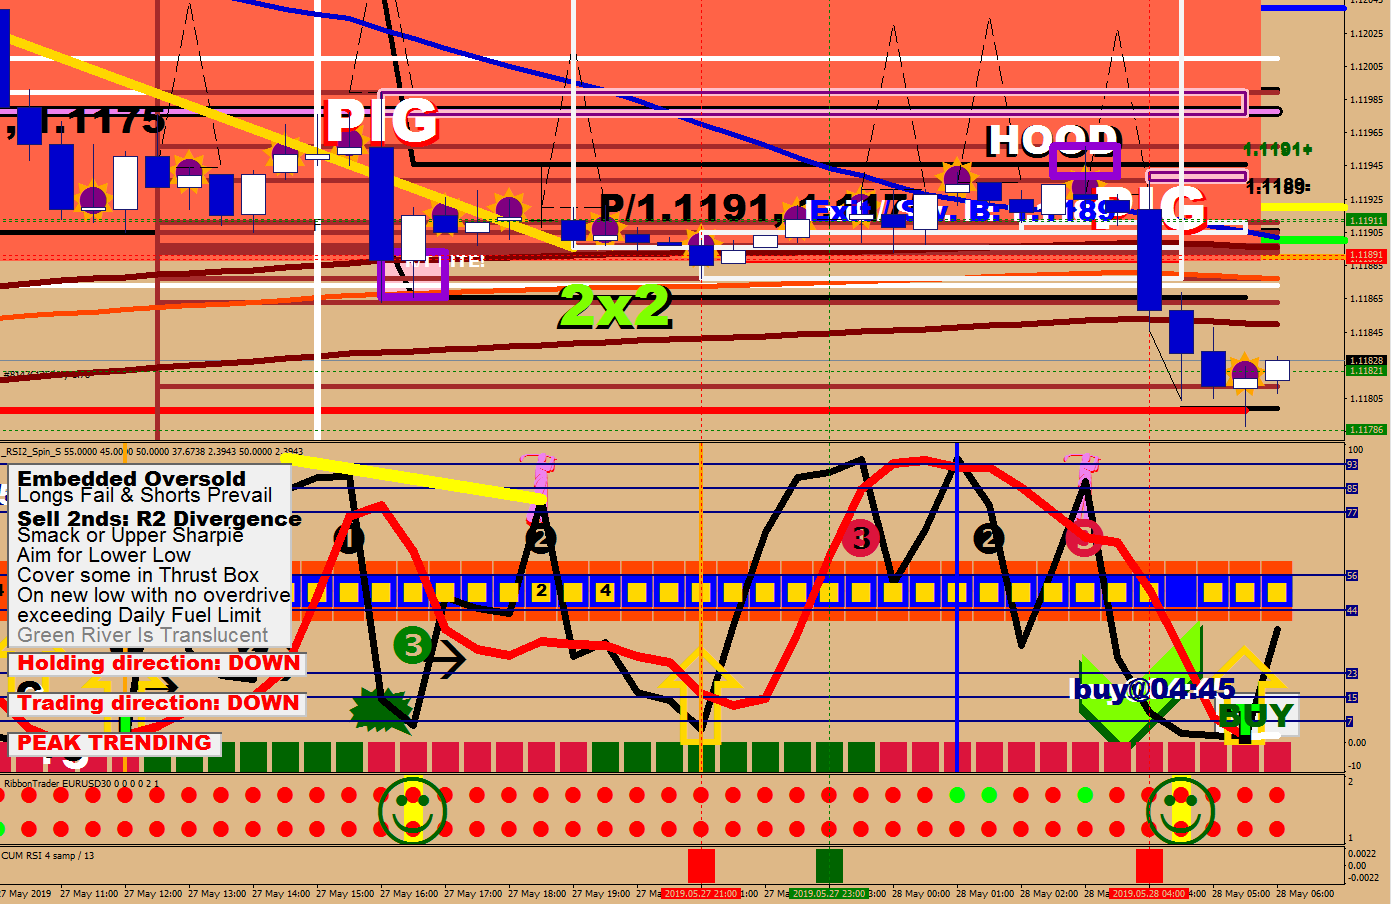
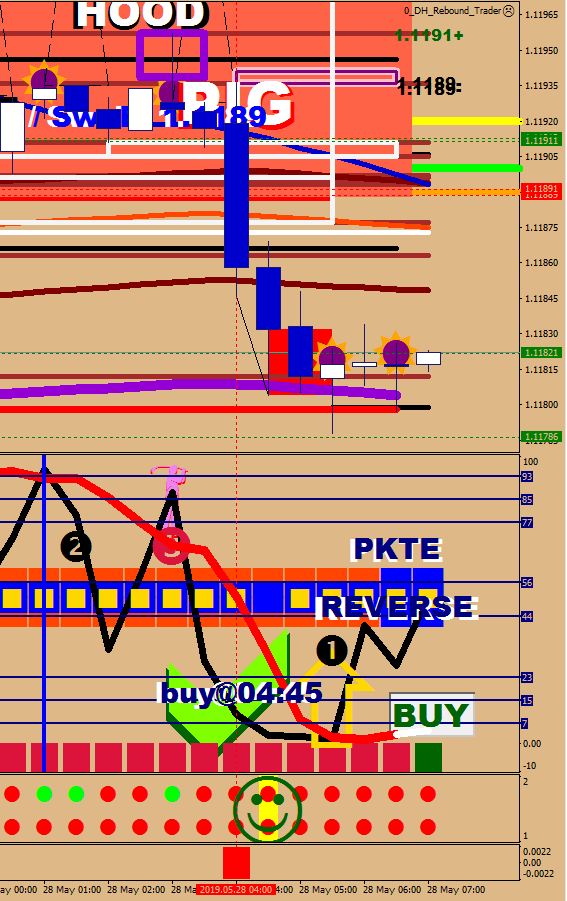
The Best Trade Set-up

The best trade set-up starts when wave 5 of the wave 5 ends.

Without going into details, there is nothing beyond a Wave 5, this wave simply lasts as long as it does.

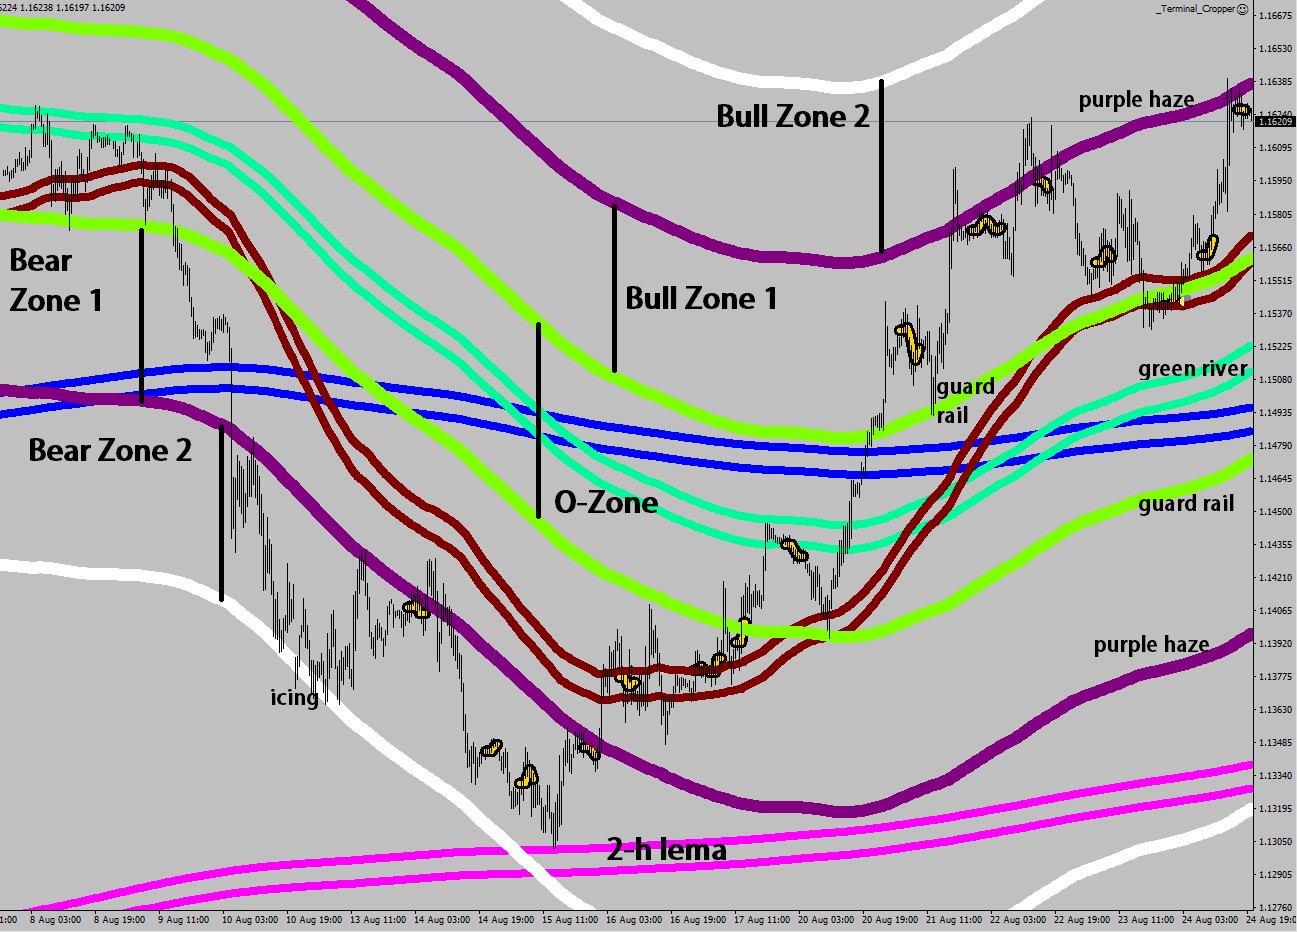
The Swan Sings in the Bull Zone 1 or a Bear Zone 1.

T1 would be 8-pips shy of the Green River’s closer end and
T2 would be 2-pips shy of the Green River’s further end.

Your entry:
1. The right configuration – E-16 closer than Mr. Maroon, separated.
2. Red tail made: price making a 3-4 candle run away whilst being separated from the Water line (E-16) for the last 9 candles.
3. Price makes a 46 sample high on the upside or a 26 sample low on the downside.

Load up & enjoy the run!

As for automated trading, when you need multiple puzzle pieces fall into place for a trigger combination, here’s how you can do it:

Store the Red Tail Switch in an integer array (I named it pkdir) – initialize it with zeros, and if you have a red tail to the upside, change the value to -1… and of course keep on copying the last one.

Now, once you have the pkdir in negative mode, you would be looking for a 46-sample highest high to make the switch in the other array, which I called pkcol (same, integer kind with -1 or +1 or 0) sometimes these two would coincide, other times they won’t.

For additional sophistication later you may decide to make a switch back up the color-direction to keep the opening on the right side.

if (ChoppinessIndex(7,i)<38 && ChoppinessIndex(7,i+1)>38 && pkcol[i]==-1 && Close[i]>iMA(symbol,30,39,0,MODE_EMA,PRICE_HIGH,i) && iMA(symbol,0,32,0,MODE_EMA,0,i)>iMA(NULL,0,135,0,MODE_EMA, PRICE_HIGH,i) ) pkcol[i]=1;

This image shows a switch back up, so that the EA does not try to short at the wrong place.

The image below features multiple directional logic, that are basis of my auto trading routines.

By the way, if your thinking is in the right place, then having the direction wrong temporarily may not result in losses:

If you are trying to open at extremes, there should be large enough rebound from your level, that would the trail stop would be able to apply the preventive 1-pip stop loss:

The EA took small profits on the misfires, thanks to the broker having low enough commission (and virtually no spread) and to the well thought-out smart trail stop routine.

The program did not try to open for the 3rd time, for the opening condition subsided by then. You can however shorten the opening window even further for example by comparing the 15-minute open and the 30-minute one.

I’m Taking Notes

Wave notes

wave structure to the up side from from the top of Bear Zone 1 + 9 pips

Wave 1 up – goes from consolidated state to exhaustion <34
ends with RSI2 settling below 97

Wave 2 down – it recharges the energy by taking price accross Mr. Maroon
starts afer energy crossing back above 38
ends with extra high level of consolidation and
RSI2 below 7

Wave 3 up – it starts as soon as wave 2 ends (RSI2 < 7)
and ends with a short exhaustion 41-45
RSI2 drops below 97

Wave 4 down – it quickly recharges energy and gives volatility a boost
it may start from E-16
it may take out the low of wave 2
it takes RSI2 back below 15

Wave 5 up – starts as soon as wave 4 ends
it ends in exhaustion
it ends in RSI2 crossing back below 96
it ends in a 3 or 4 piece ending tail

folling this: fluctuation may happen

wave structure to the upside from the Green River

Wave 1 up – if it starts from high level of consolidation
it ends in an RSI2 divergence:
measuring leg first!
2nd leg has RSI2 drop below 96
it may exceed its first thrust box up

Wave 2 down – it may take out the starting point of wave 1
it takes price back accross the Green River to the spark zone
energy stays outside the bands = volatility boost
RSI2 would tank to 0
ABC look possible
it may miss its thrust box down

Wave 3 up – it starts from around the Green River with high level of consolidation
the head start comes from energy crossing back into its bands first
RSI2 may not drop below 35, 50
it goes deep into Bull Zone 1
it end in RSI 2 divergence that has a higher high
measuring leg(s)!
possibly in a shape of an extension 10-16 pips higher
it ends between 46-41 short exhaustion

Wave 4 down – it takes price back down to the border of Bull Zone 1 (+10 pips) Remember: their weakness is your strength

it should fall short of Mr. Maroon
it may show a H&S divergence energy gets on the high side
it may have an ABC look to it
RSI2 < 7 is a buy

Wave 5 up – starts where W4 ends in the RSI2 divergence, close to Bull Zone 1 + 9 pips
it ain’t over till it’s over: ever increasing RSI2 divergence
thrust boxes can get exceeded
final thrust unable to settle RSI2> 93
Wave 5 of Wave 5 would come from below the oversold line and below E-16
energy bands narrow in

ABC correction down from Bull Zone 1 – the Shape

Wave A downs – starts with the final thrust of Wave 5 up
A ends with the 2nd return within the bands
possibly at the other side of Mr. Maroon

Wave B up – the shape has a prolonged flat move up that stays below the thrust box
it ends in an RSI2 divergence – measuring leg first

Wave C down – the thrust happens in the wrong direction as a no break extension
It may exceed a thrust box a bit
other side of Green River for maximum surprise

wave structure to the upside from the Green River variant

Wave 1 up – if it starts with high level of exhaustion
it would have to hurry to make the high:
sound barrier may mean the cap over the initial thrust (+36 pips)
the wave would end in an RSI2 divergence
but the second high may be lower than the first
RSI2 would drop below 93

Wave 2 down variant – it may stay in the overbought (embedded)
it would likely miss its thrust box
it takes back price to the other side of Mr. Maroon close to the Spark Zone
after RSI2 divergence – measuring leg(s)!
the trigger to wave 3 is CI crossing below 53

Wave 3 up variant – it starts from around Mr. Maroon with RSI2<15
it has bottom left dojis for features
it may muster a thrust beyond the Purple Haze
RSI2 divergence – measuring leg!
no break extension for divergent leg 16-20 pips excess
thrust box may be violated a bit

Wave 4 down variant – trickle down wave 4

it takes price back down to the border of Bull Zone 1 (+10 pips) Remember: their weakness is your strength

it should fall short of Mr. Maroon

disregard divergences until below E-16 and strength shows up:

shot over bow = RSI2 print above 80 – the next divergence shall live

Wave 5 up – starts where W4 ends in the RSI2 divergence, close to Bull Zone 1 + 9 pips
it ain’t over till it’s over: ever increasing RSI2 divergence
thrust boxes can get exceeded
final thrust unable to settle RSI2> 93
Wave 5 of Wave 5 would come from below the oversold line and below E-16
energy bands narrow in

ABC correction in Bull Zone 1

The correction takes price down to a major, obvious support such as the Green River.

The correction goes oversold twice (stoch)

If an A ends in a deep exhaustion, look for the pair of it to call the correction over with (plus a no break undercut).

A leg down to the other side of Mr. Maroon setting up the measuring leg

B leg is a big fat churning in a fluctuation’s bandwidth (can be as muted as 20 pips or less)

If nothing seems to be doing anything much, chances are you are in a B wave

C leg down washes out the money that was injected in at the beginning of the move – and could inflict maximum pain as well

However, the last move is still only a no-break extension, merely from a lower high printed on the back test of the previous PKTE box (failure)

After a Wave 5 of a Wave 5, price makes its way back to the Green River

Tell-Tail of the Ending Wave

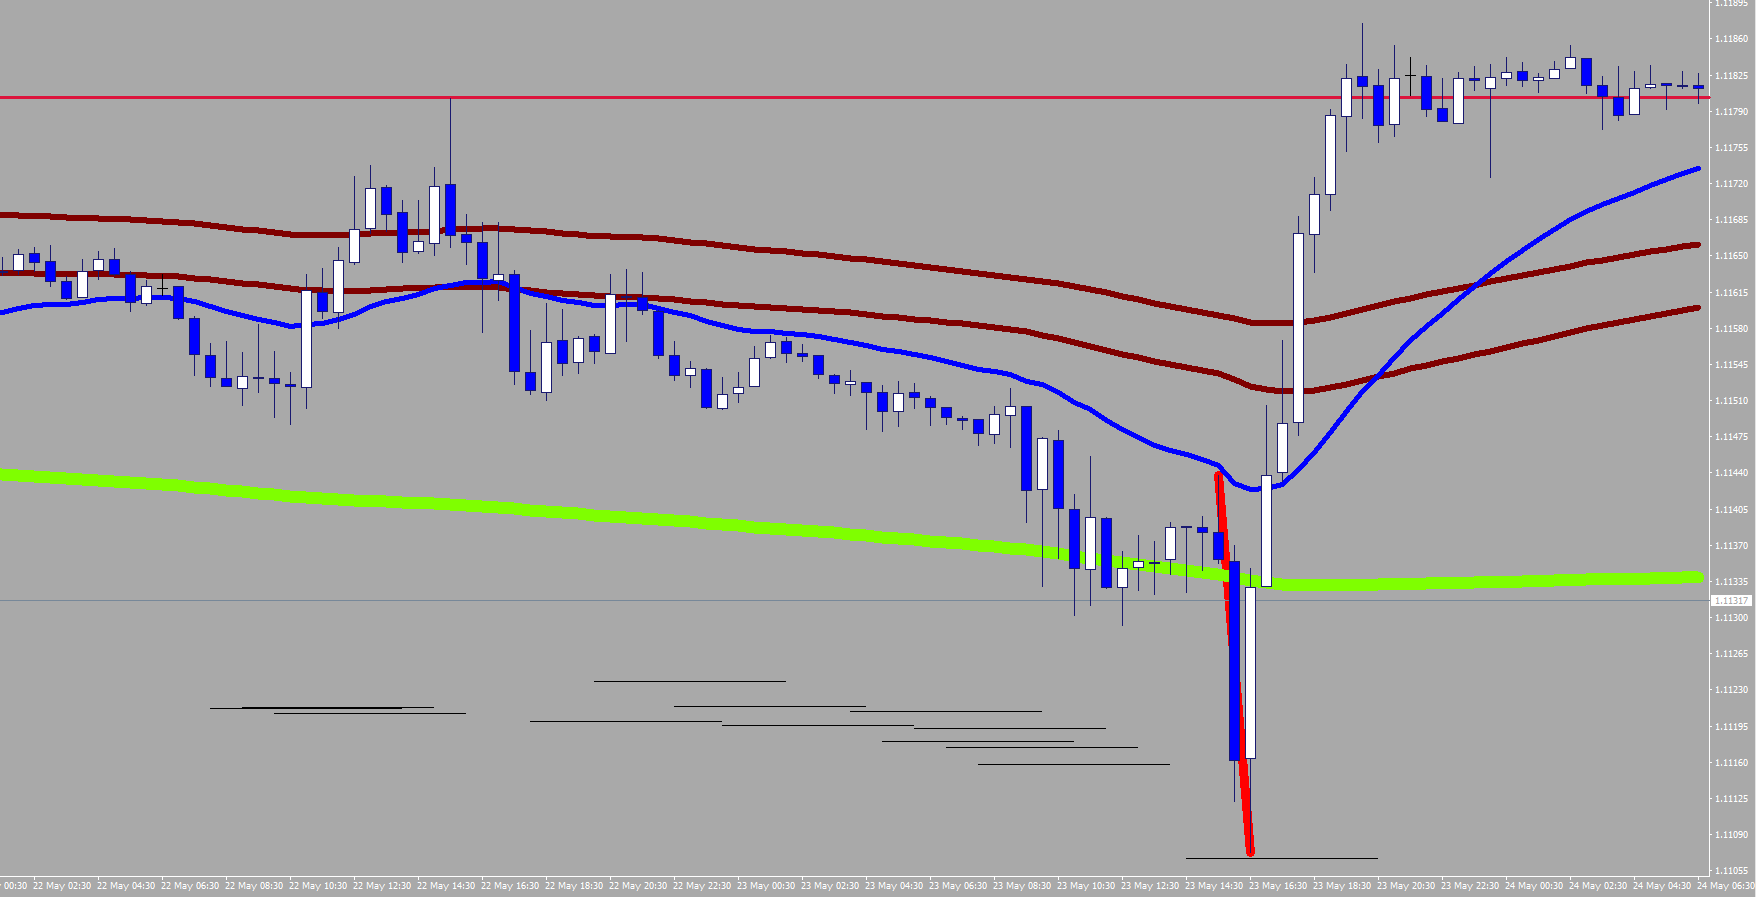
The following images would show you something tuned from impossible to possible.

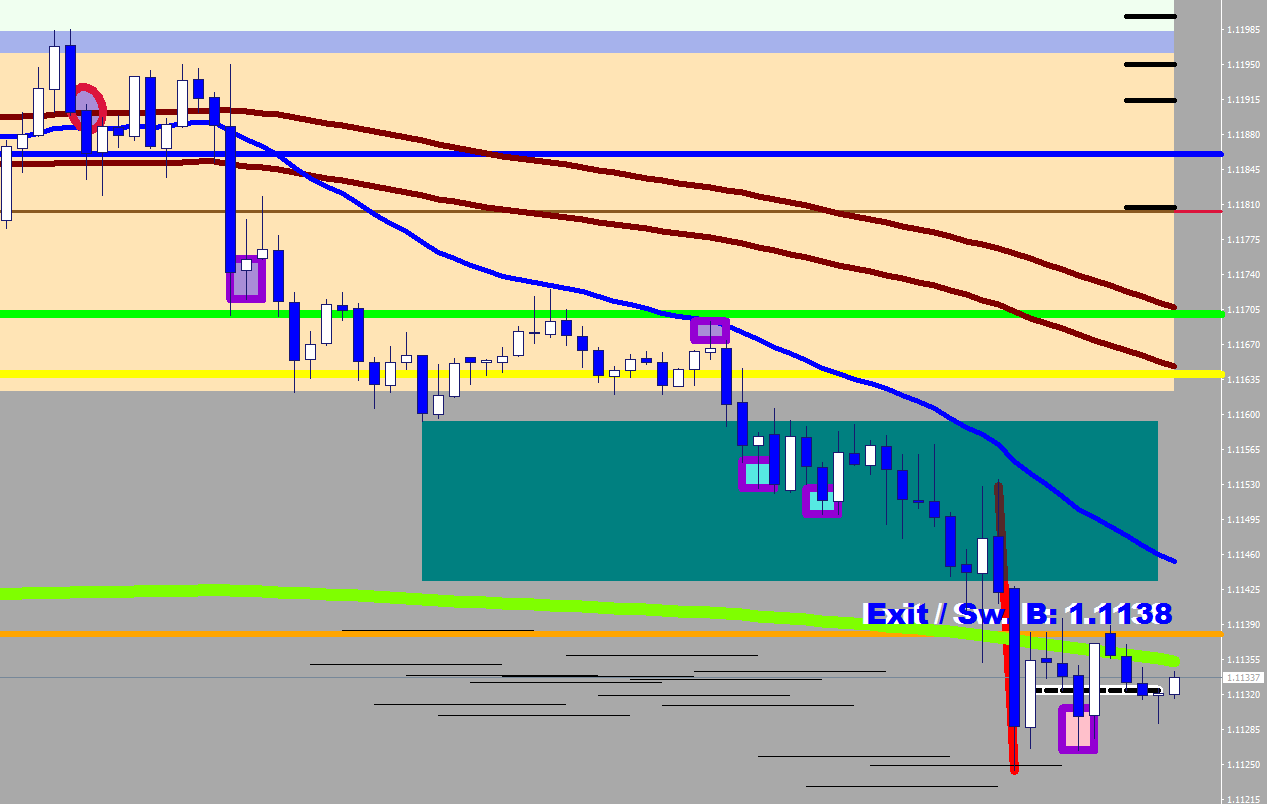
In descriptive language for those who can code – to find the red tails / final burns:

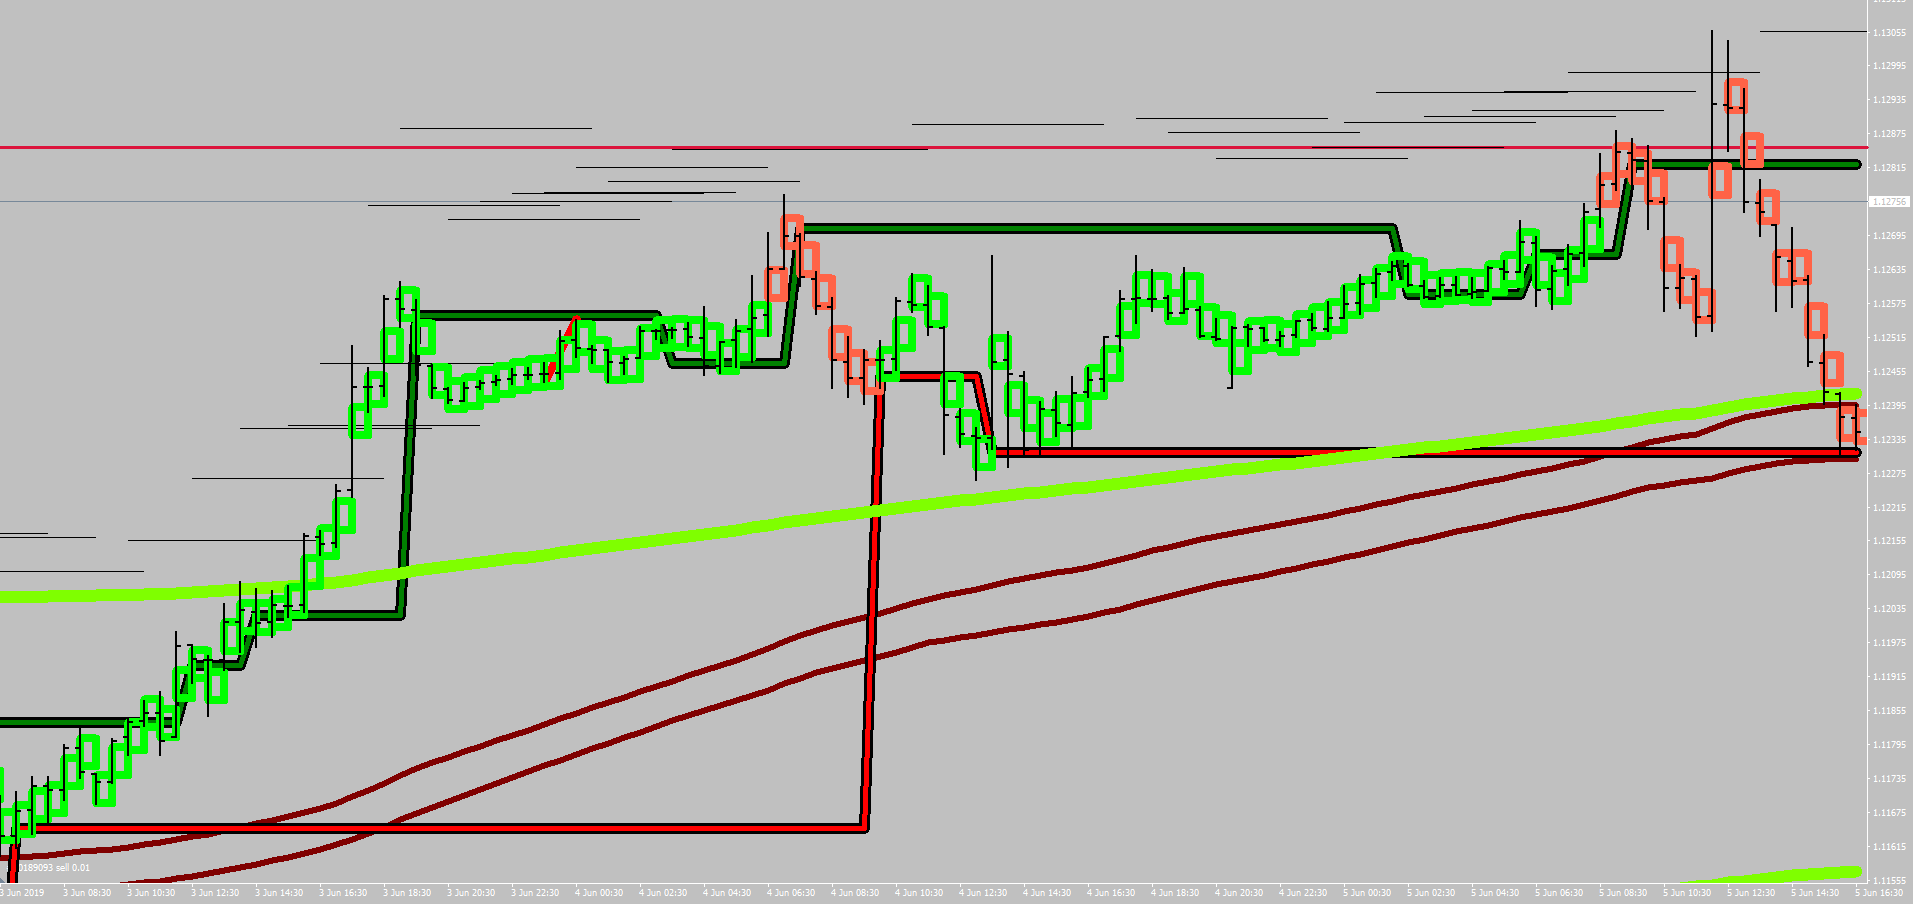
You are looking for a 2 to 4 30-minute candle sequence in a wave 5.

A Wave 5 start falls short from Mr. Maroon (E-135/30 min), and the Water Line (E-16/hourly) is in the direction of the Wave 5 relative to Mr. Maroon.

Filters: last 10 opposing wicks all falling short from the E-16.

The 7-sample fractal energy readings are filtered with a section.

See, how simple this is?

The black, terminal wave doji projection lines are made with 1/2 fluctuation size displacement with the right configuration from dojis that have their wicks falling short of E-16 by at least 2 pips.

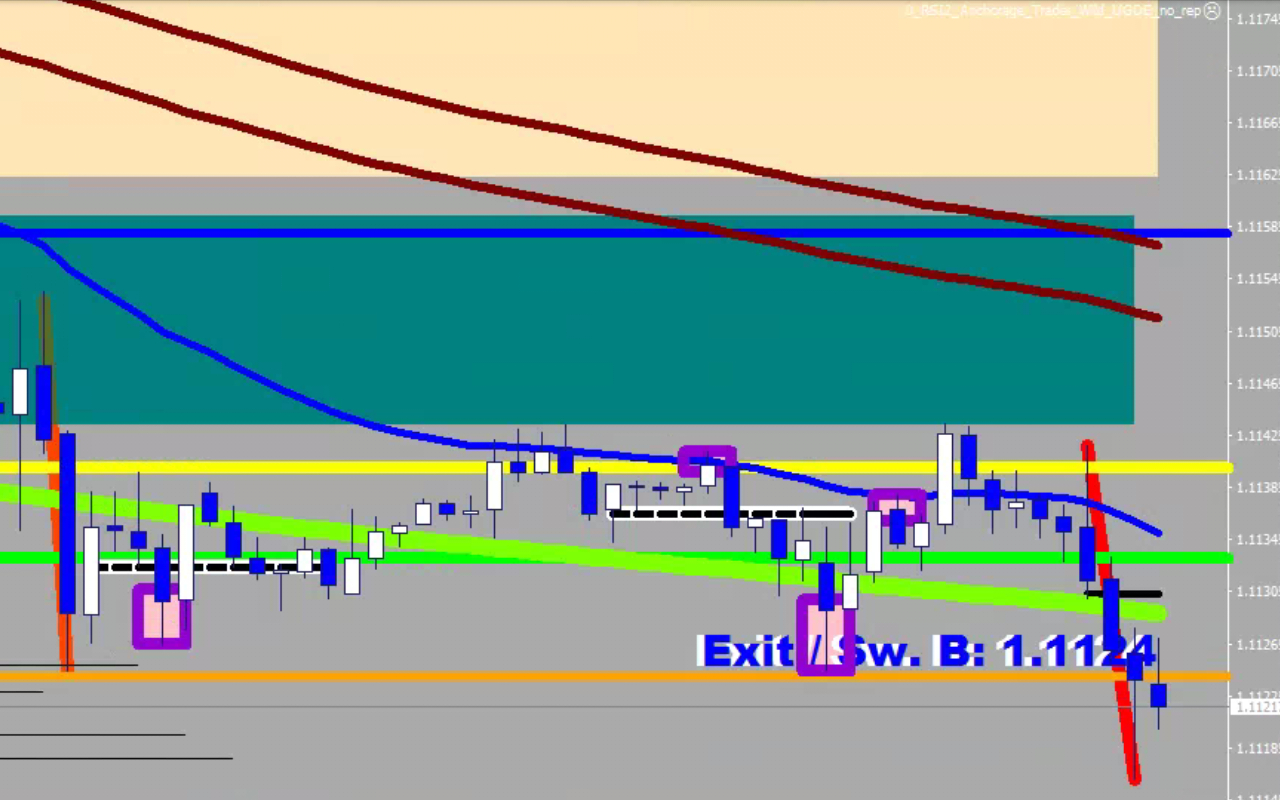
…a tiny bit of modification after press hours:

I was reluctant to acknowledge 2 bars as final burn; it seemed too fast, too eager and it even crossed a black line – the market wanted lower still.

I downgraded the two-bars tail to orangered, so that the right one may shine over.

PKTE Reversal / No Break Extension

I’m going to make one last attempt at trying to explain how an extension / terminal move is made during peak trending conditions.

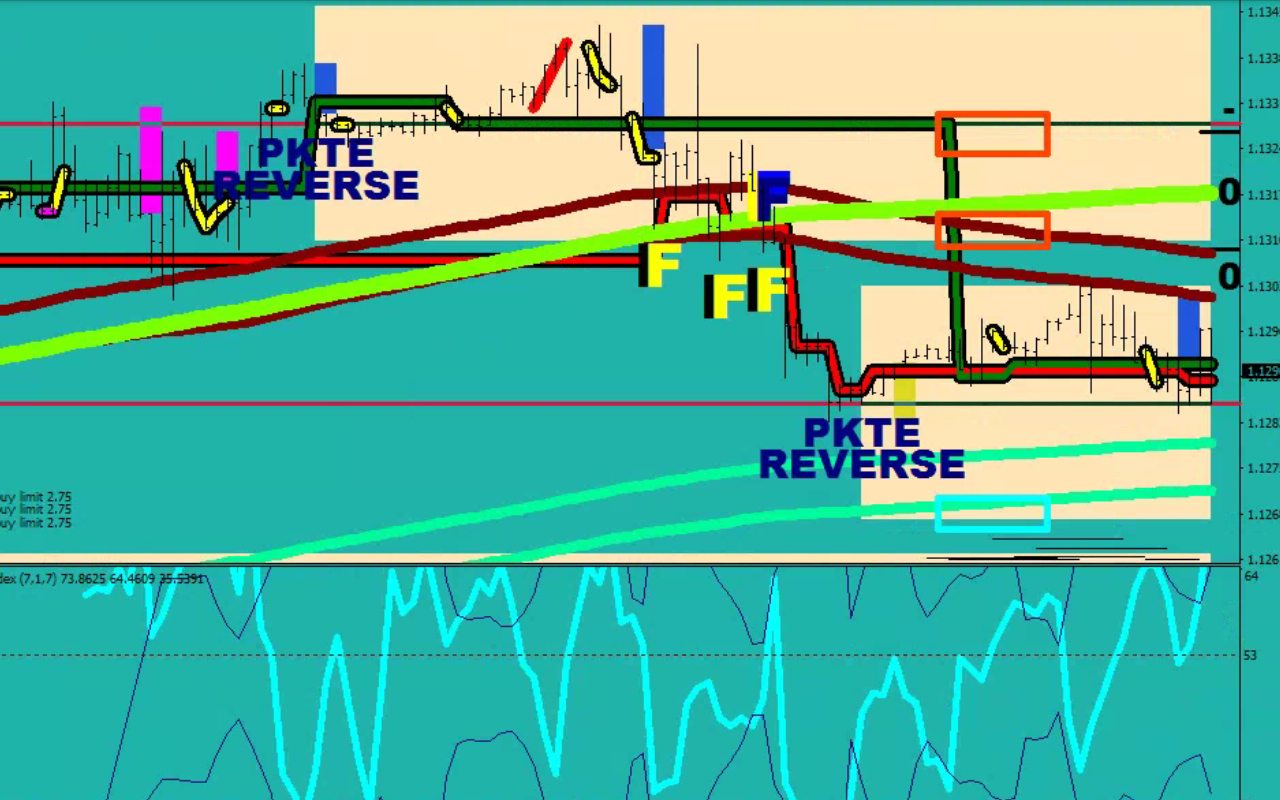
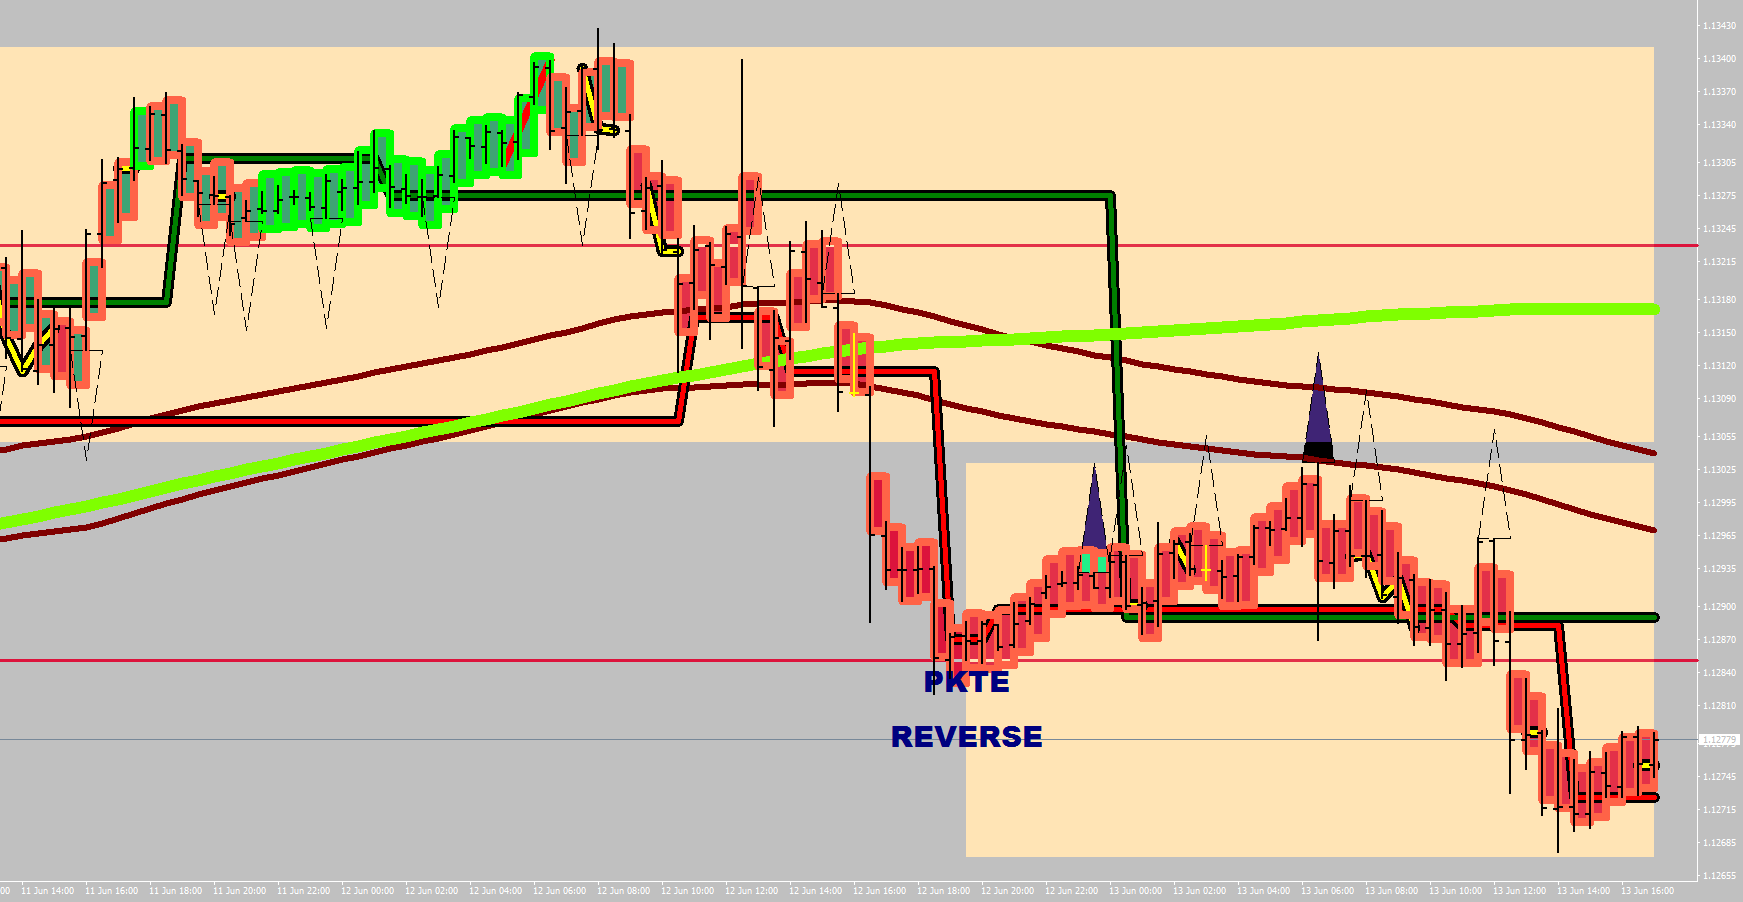
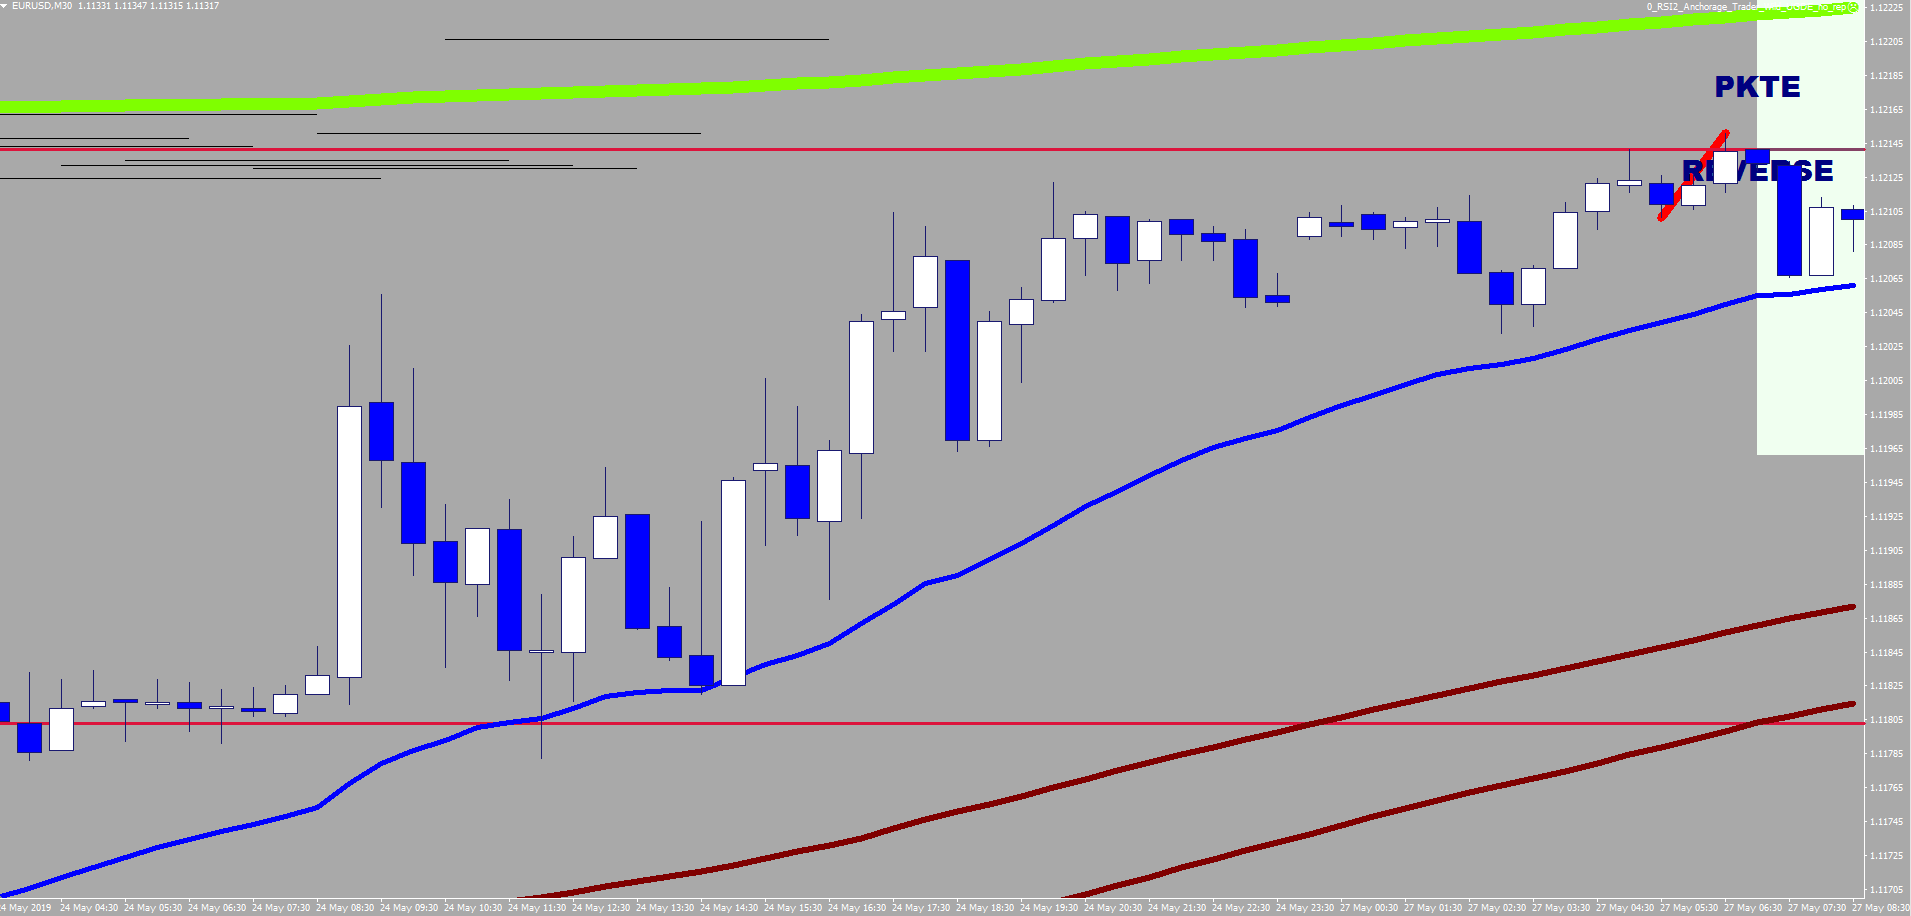
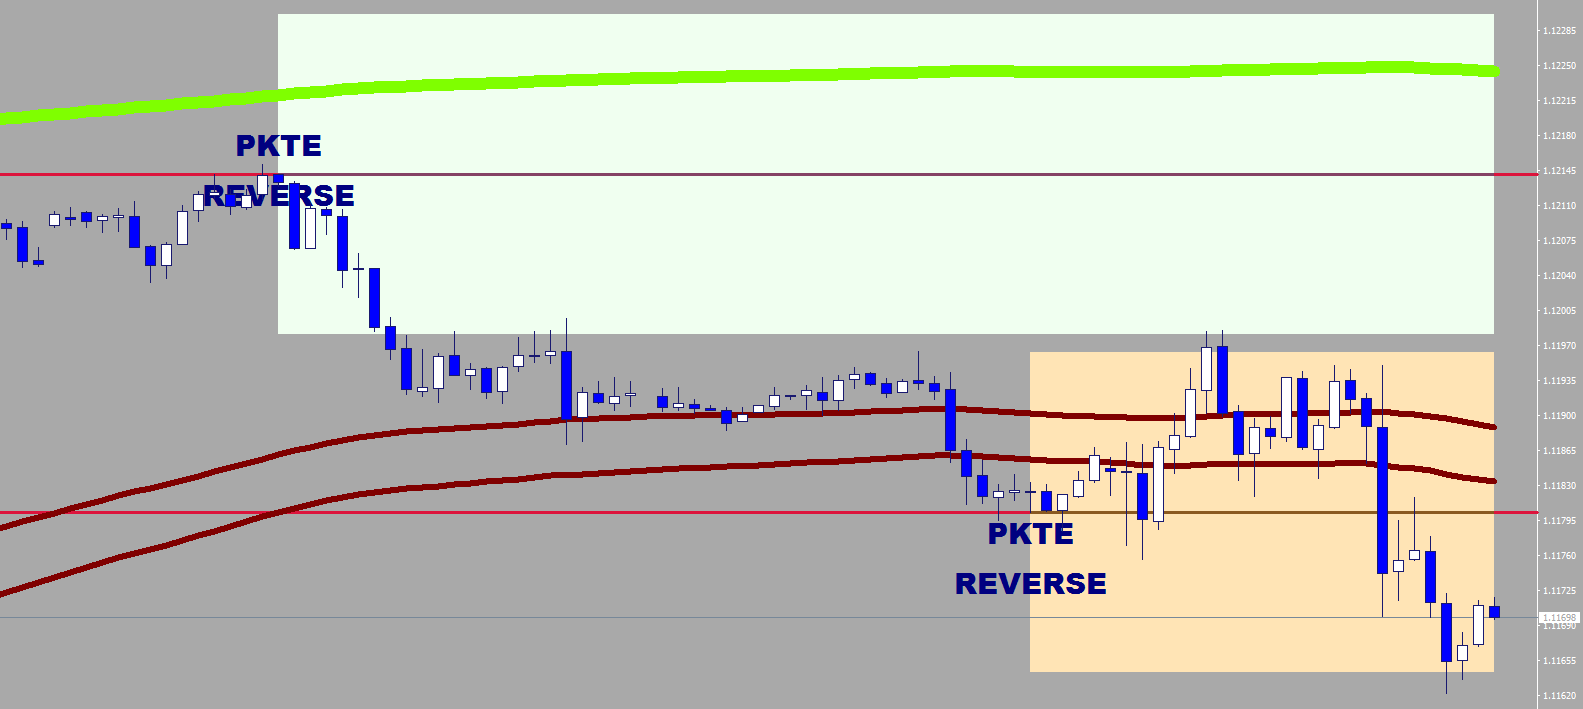
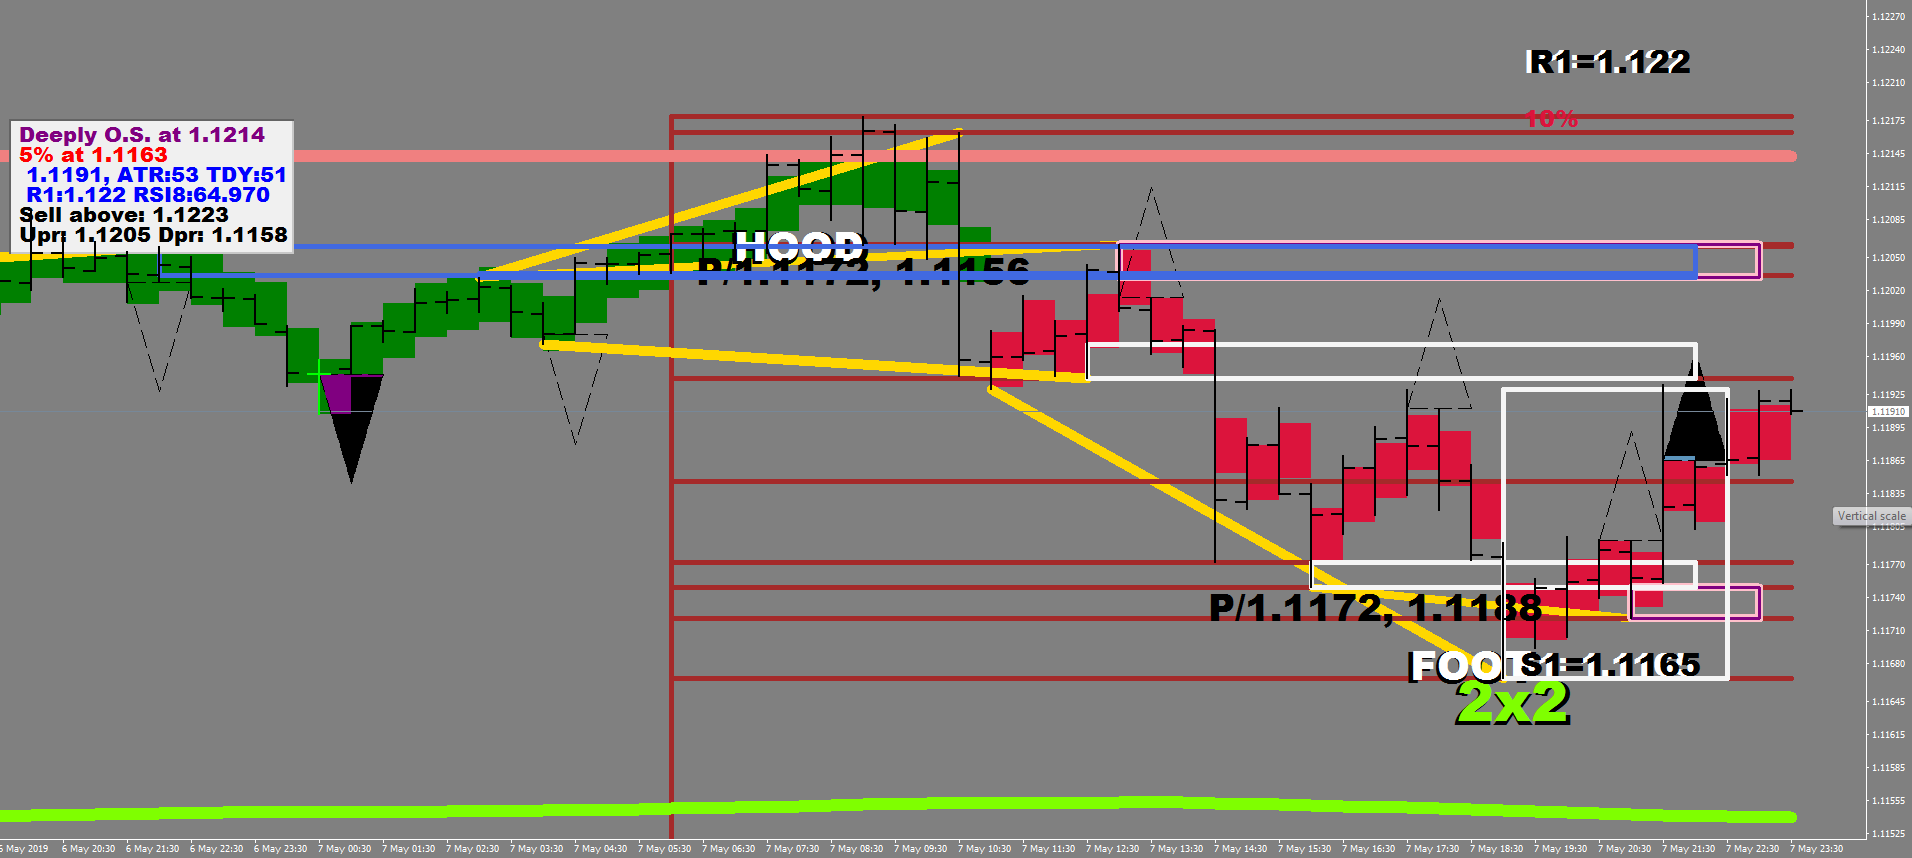
The image below shows two different shaded rectangles.

During peak trending, if an exhaustion is made, the trend turns on itself and reverses. The PKTE REVERSE texts and the crossing point of the vertical rectangle line and the horizontal red lines are highlighting the 30-minute high and the low where the 7-sample exhaustion had its relief. These axles are the mid points of the rectangles that have two equal halves, 1/2 Fluctuation size each.

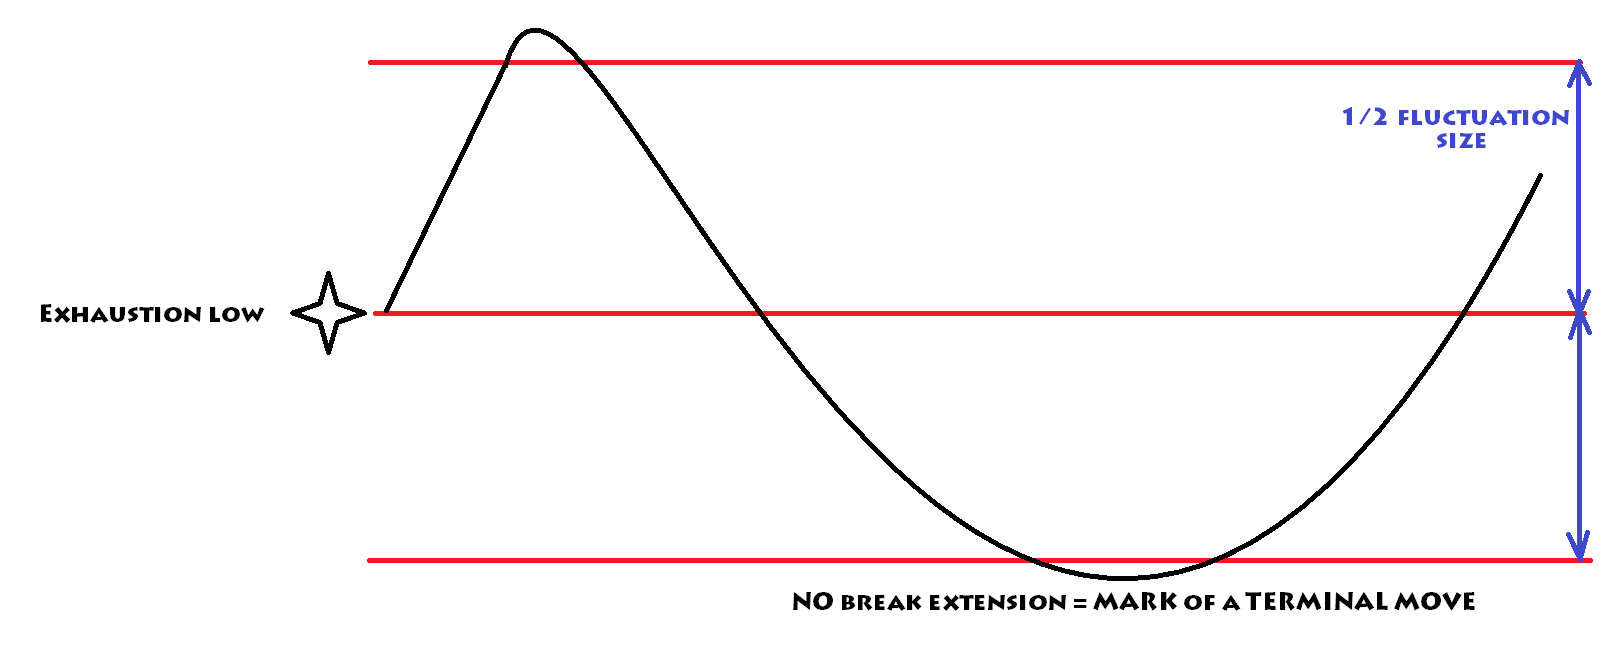
When the exhaustion axle is made, one option for the price is to start wrapping around it, to recharge its energy, and in the process it may rake up additional distance in the direction of the progression, but overall it would not leave the fluctuation sized consolidation field.

This is how it is possible to make a lower low and failing to break lower at the same time.

Hence I call these moves No-Break Extensions.

If You Were an Institution…

…what would you be buying?

I don’t know about you, but I would be buying at 90% discount.

90% discount is the deeply oversold level = 10% on the comfort levels.

Why not at 95%? Because 5% from the low almost all players are under water and the easier play is the lower low (path of least resistance) to squeeze them beyond their tolerance.

To maximize your odds, one final touch is to lag in into the keel back to the desired level. Remember, you need to accumulate gradually, and your price would be an average of all the buys.

Why?

1. Not to immediately move the markets.

2. To be able to accumulate the most possible volume.

Institutions do not need much fine tuning beyond the commitment to the percentage levels, but for you a tell tale of their presence is

  1. Trending, peak trending-exhaustion
  2. Short term wave counting becomes useless

Your best tools for spotting them therefore are

  1. Consolidation indicator (CI) sample size 7
  2. Monitoring for peak trending

I talk of peak peak trending after the 4th open above overbought / below oversold.

During peak trending the trend can turn on itself (i.e. wedge), there may not be a thrust / beat occurring.

As far as institutions go, they don’t care about wave counts, they care about the numbers and they would be holding until the trade would be feasible to let go of.

What does this mean on the gauge? They would roll in and out on a 15% span at the very minimum to have an average of a 10% move. Again, the measurement is the long term range.

They would need to get buyers interested, so they would utilize the “out of oversold” level for the roll out. That is, if they do not have longer term goals with the currency – if they do, then we are talking 30%, 50% and 70% travel holdings. They might let the price drop to their desired level multiple times if they need to purchase more.

Rinse and repeat.

Wave 1: Smart Money Buys

Wave 3: Institutions Buy

Wave 5: the Retail Buys

PKTE= peak trending exhaustion

15-min Mean Reversion

What does mean reversion really mean? How does it work (for real)?

Mean reversion kicks in when an overly extended condition finally lets go. Much like the rubber band that reverts to slap your skin.

What is the mean? There are different means for different time frames, but the one I am using is the 15-minute LEMA. This means 828 sample, but since I have 30-minute charts open, I use 414 EMAs pulled on the highs and the lows. This band gets re-visited 3 times per month on average with the certainty of death VS a 200 day MA that may not be seen back for years.

It can be stated that all mean reversions start from Bull Zone 1 and Bear Zone 1.

I define these zones being 1-3 fluctuation maximums away from the individual bands of the mean.

Sort term bulls/bears would manage to stretch the price not much further than the 1x fluctuation maximum, whilst middle weight, better capitalized players would cover about 2.5-3x fluctuation maximum away. Anything beyond this level of stretch would be an institutional buying: constant accumulation is needed to keep up the overstretched condition.
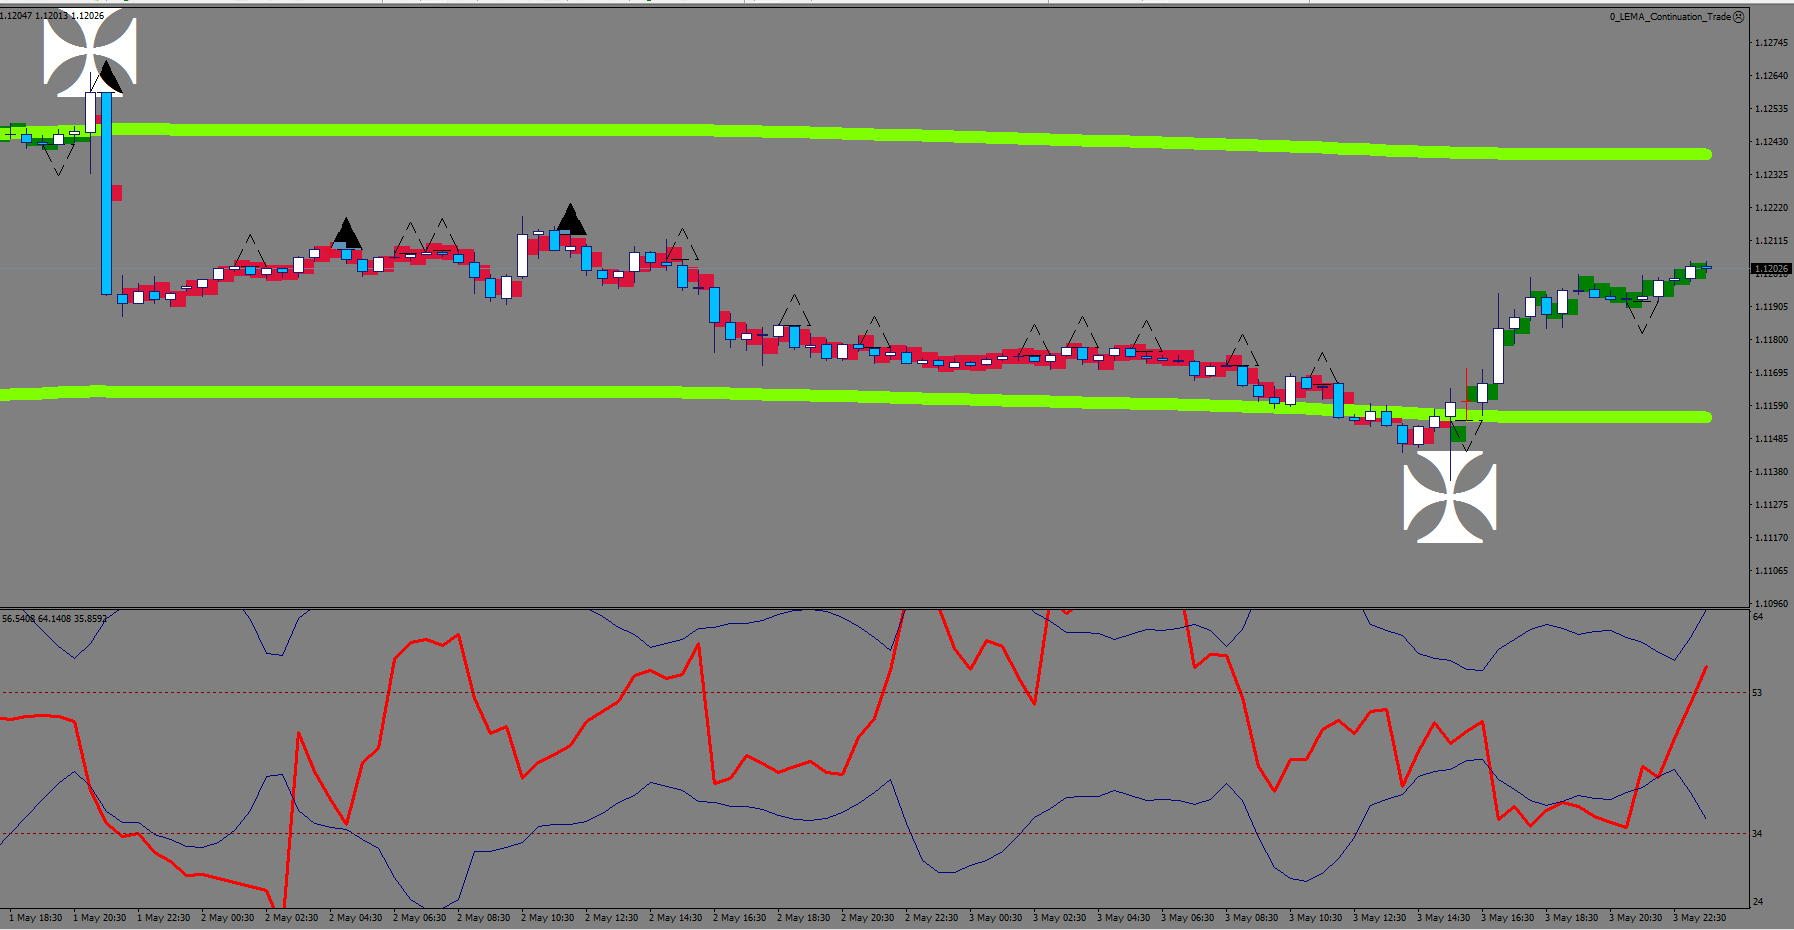
A valid let go thus occurs in the Zone 1 and a sharpened stochastic bars can help you find the spot.

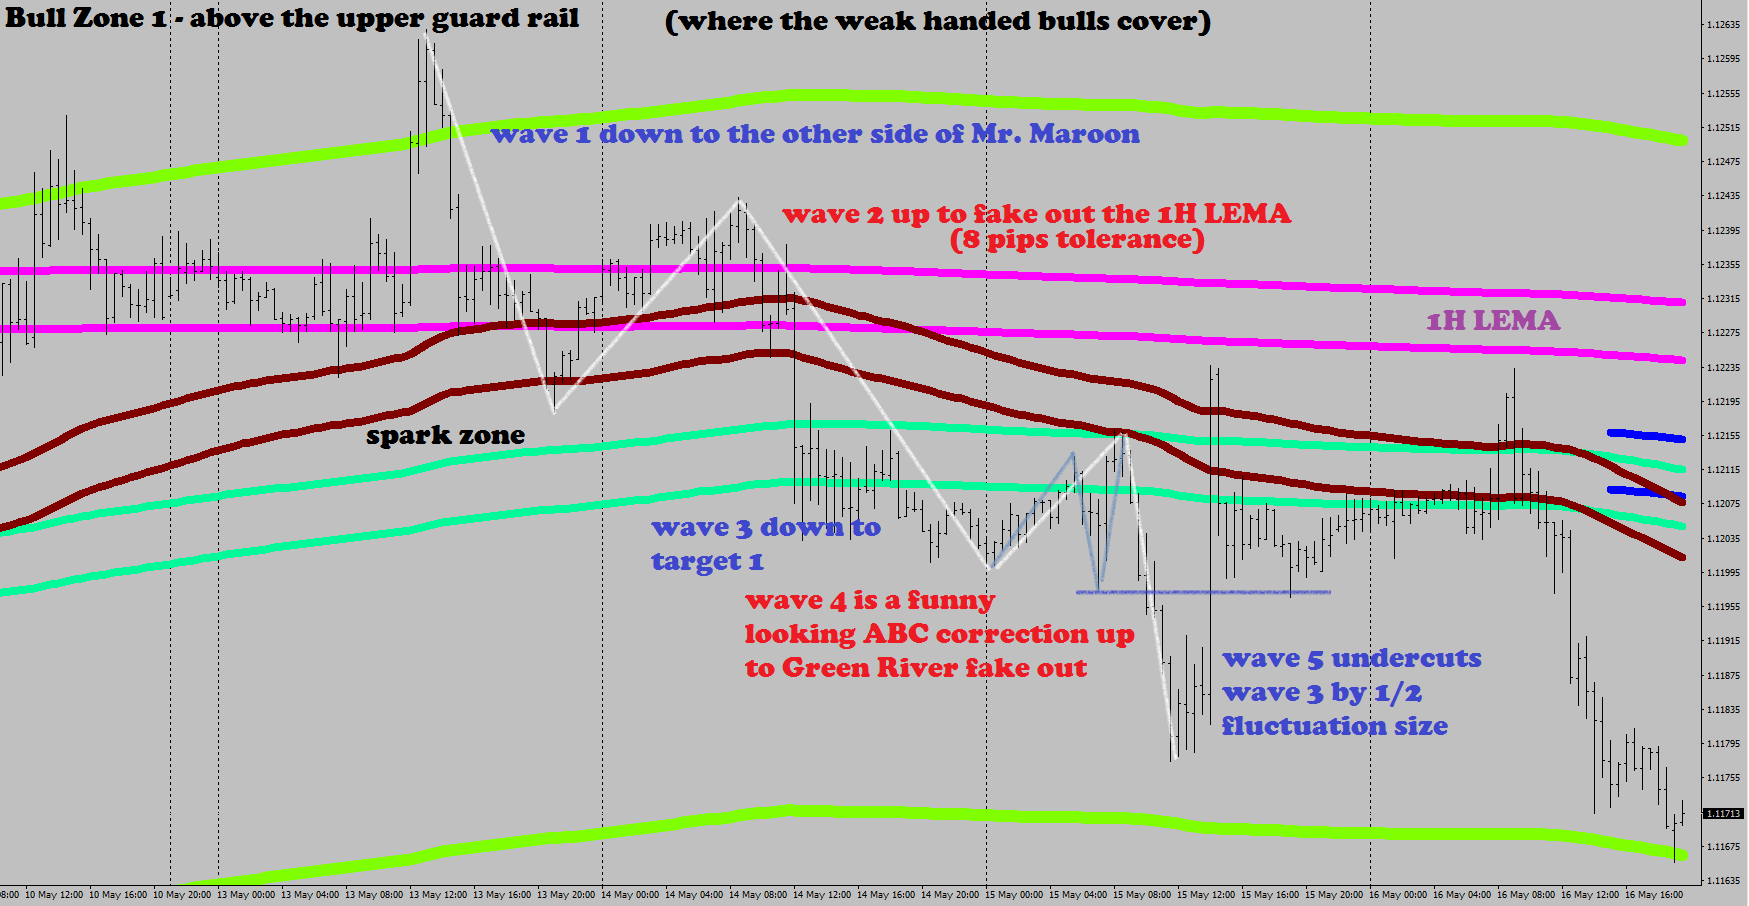
What happens next is an impulse wave structure (5 waves) that would take you back to… where the mean was at the time of the trigger (end of wave 3), and an extension on top of that (wave 5).
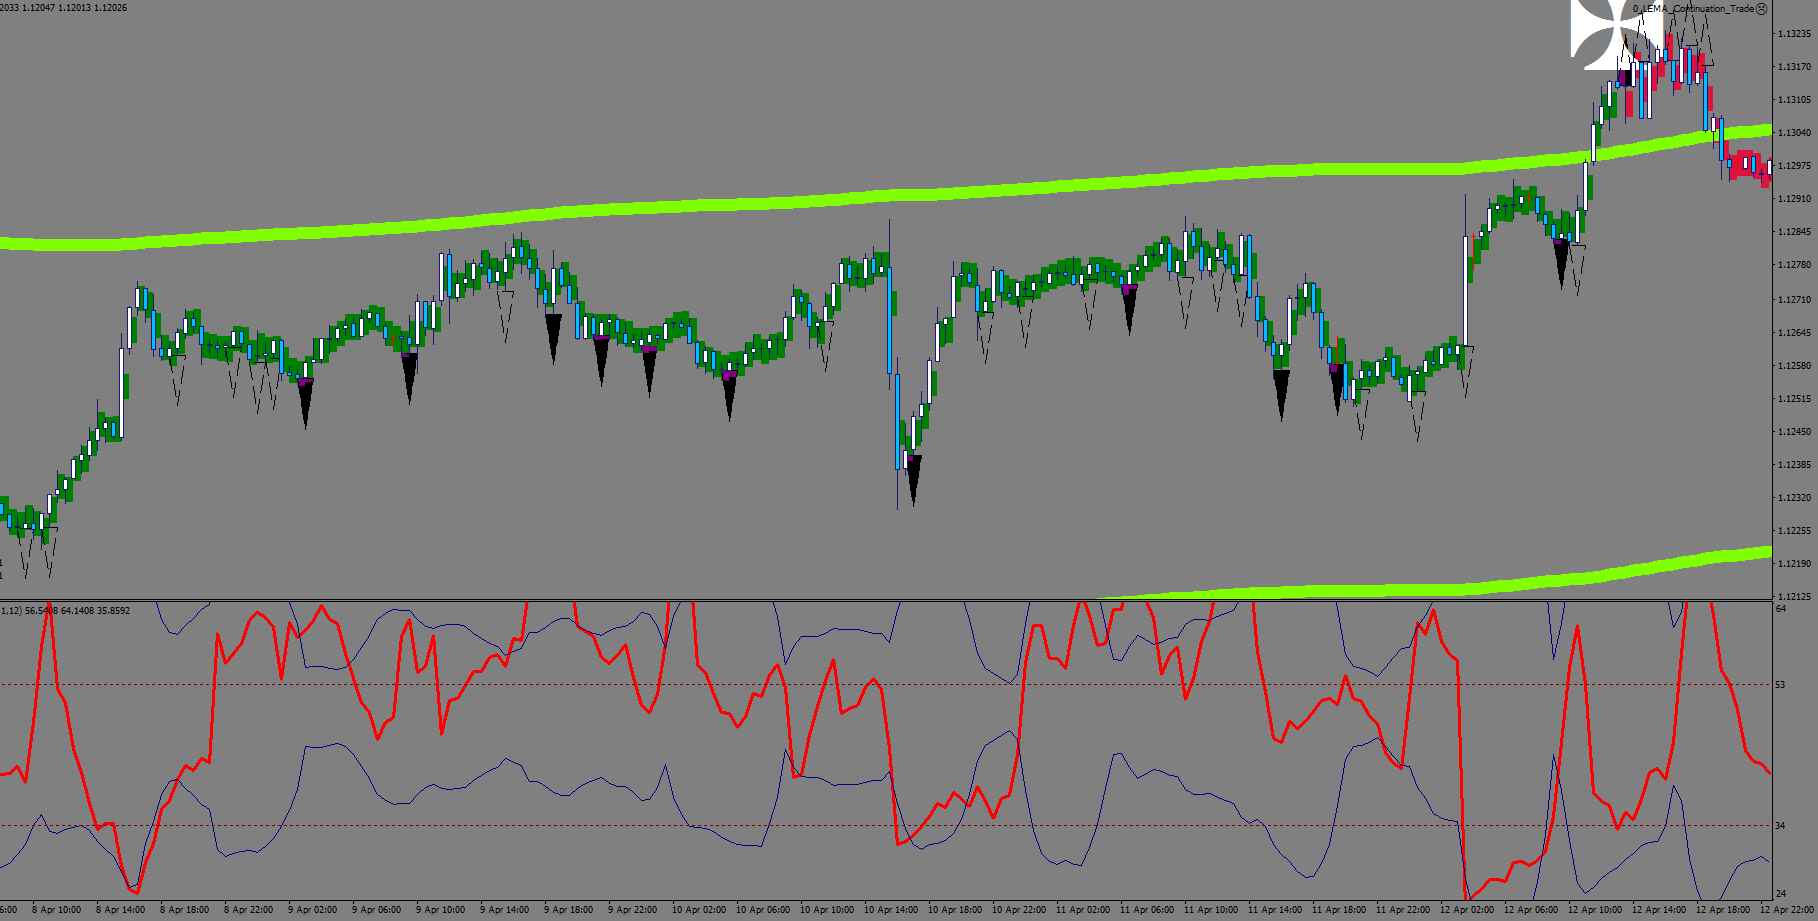
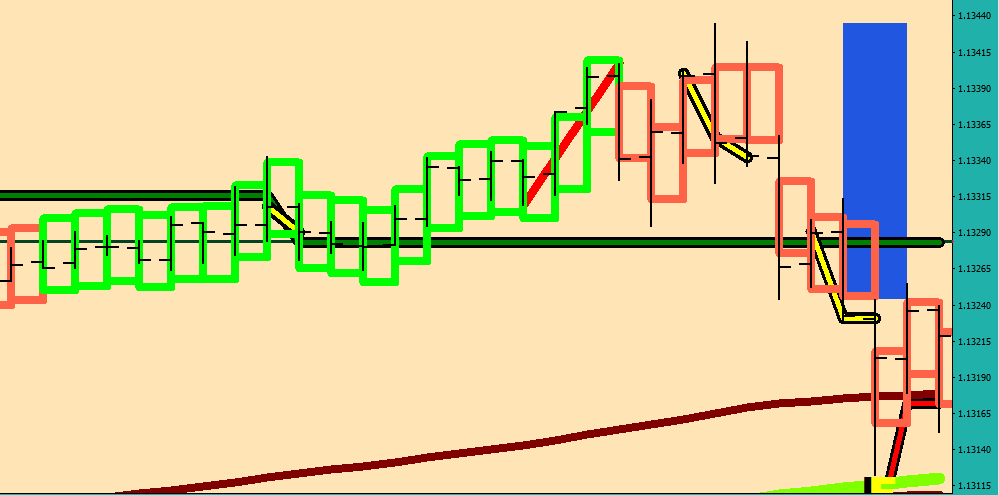
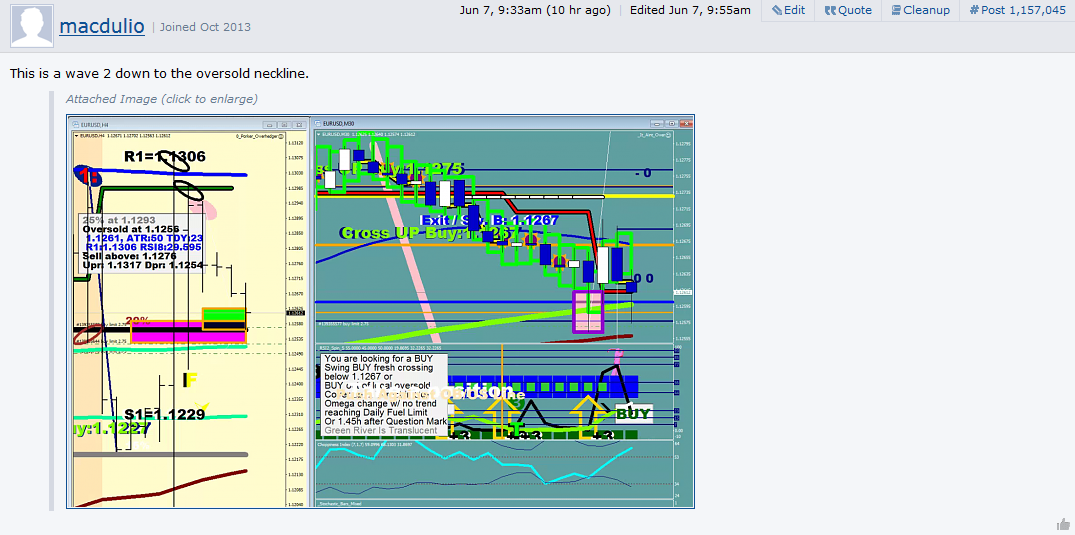
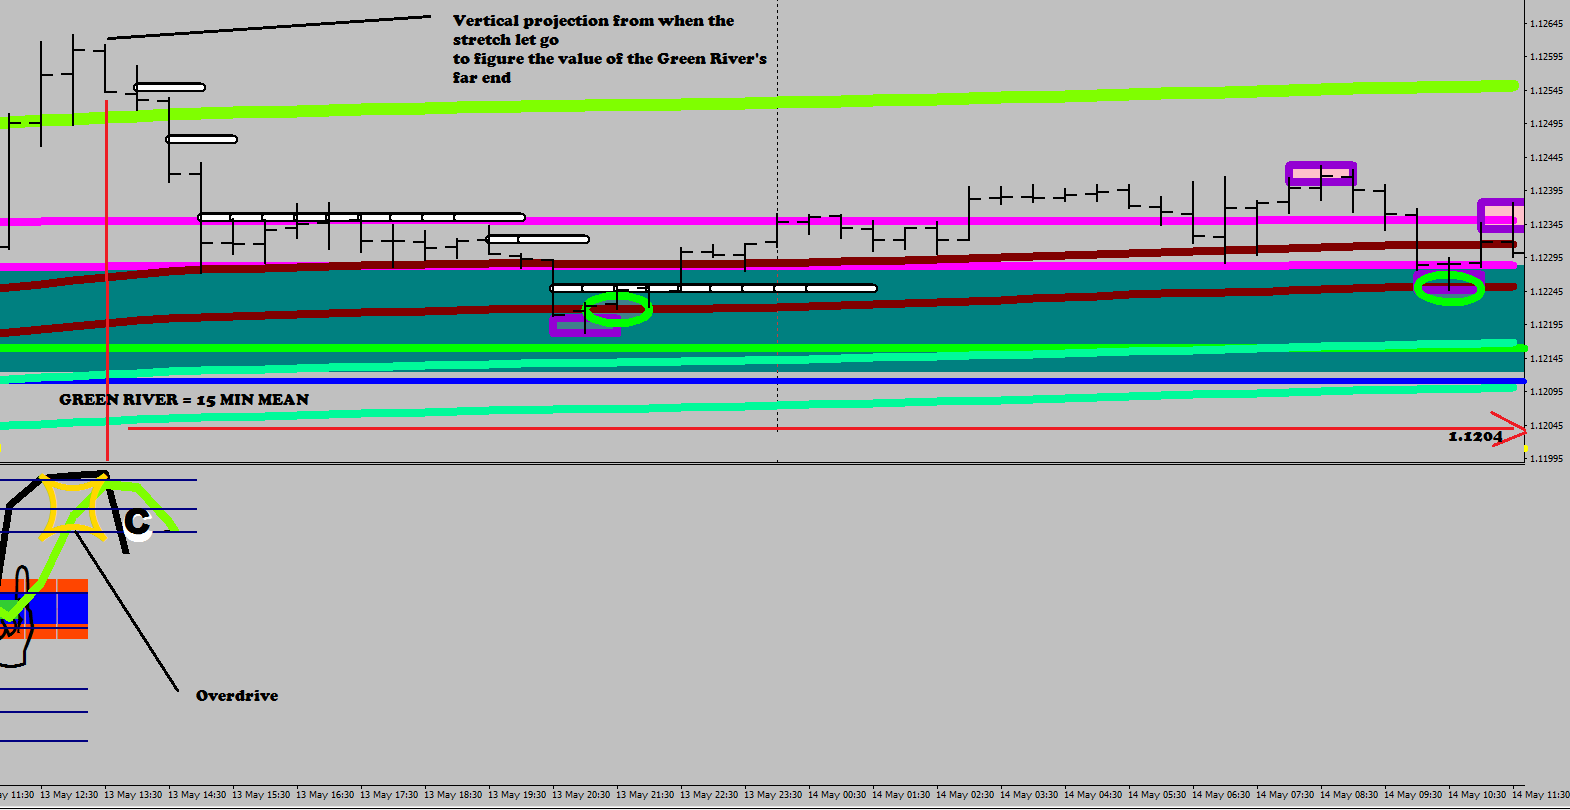
Figure shows the (wave 3) target at hand.

Wave 5 would normally beat the touch down by 1/2 of the fluctuation size to fluctuation maximum.


In this particular instance wave 2 was brought on by price hitting the spark zone, but as a General guide you should be thinking of the possibility of a fake out at the other side of Mr. Maroon.
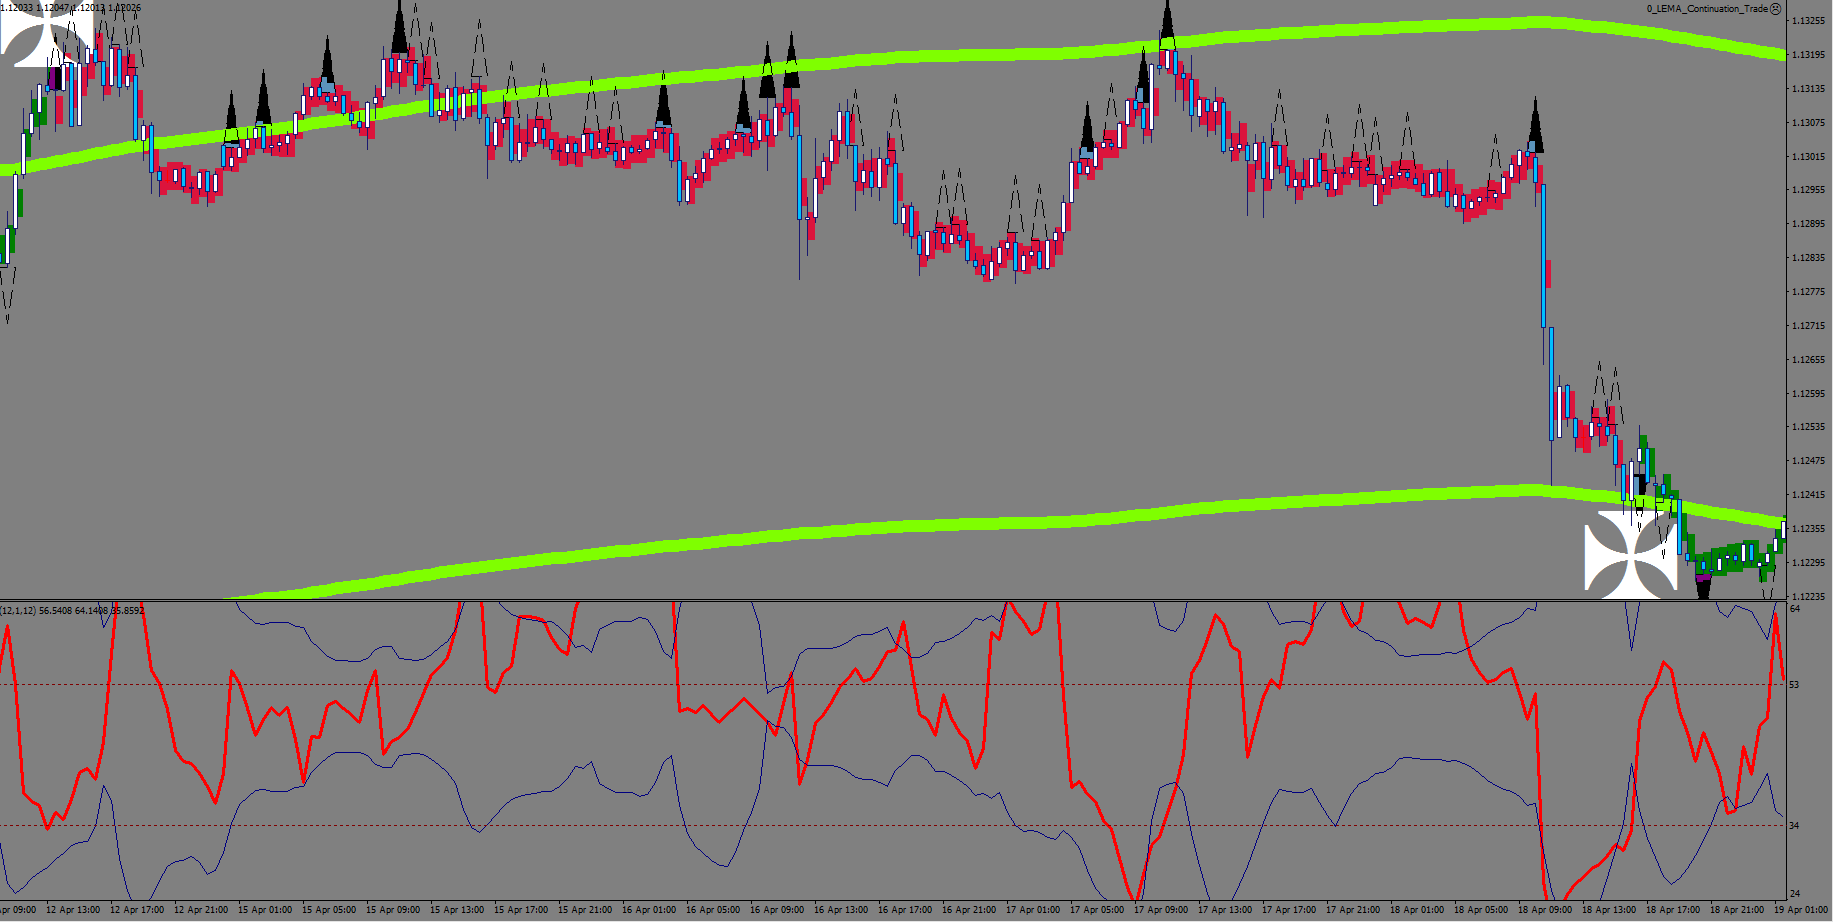

Wave 3 started upon a fake out of 1-hour LEMA.
Fibonacci Who?

The move back up and the fall back half way after the wave 5 target was reached, was the settlement, the reset, not a wave of any sort, this is something that E.W. can not account for when wanting to call every move a part of a structure.

This is everything you need to be able to make a killing in Forex.

I did not learn any of the above from anyone, these are my own findings.

The lingo traders use helped me with what to look for. Being a Hungarian I am very much used to the language passing down thinking logic.

The above version of LEMA30N can be obtained gratis when purchasing a copy of my book.

Stochastic Bars Mixed can be downloaded freely from this blog.

Everything You Always Wanted To Know

..but never dared to ask about trading.

What is risk in trading?

Number one: you die without ever making any money.
Number two: you loose all the money on the account.

What do you need to speed up money making?
Leverage. A broker can give you leverage on your money (500:1 is accessible). If you want the most volume of fish, you’d better be fishing with dynamite.
You can get leverage on your time by making the computer trade for you part time (automatization).

Why do you trade Forex?
Because the ability to hedge at no extra cost means the possibility to take losses on your own terms.
Why do you trade EUR/USD?
Because you can make 1.5 pip net from a 2.2-pip move in your favor.
The second cheapest instrument would cost you twice as much in commission and spread (GBP/USD).

It is possible to make 50%-100% gains in a week. In 2 weeks the account can be doubled.
High leverage means that you can keep your own risk low.
If you put up 1% of your net worth, and you would take this money back 2 weeks later, your risk from then on would be 0. You see, everything is relative. The only money that is yours, is what you have taken out of the trading account. If you loose one time a 1% account, and by then you would have multiple one percents lined up ready to open a new account, your loss would merely be time: a couple weeks of no productivity.

This wasn’t the risk management the academics were pushing on you?
Nobody would become the richest person in the world by doing everything the same way others do.

Which part of this is not sustainable?
Well you do need a good understanding of what is happening.
There are only two fundamental things in trading: people want to make money, and fear is stronger than greed.
I do not follow any of the news. To make 2.2 pips on a trade they have 0 relevance.

Of course you can also speed things up by gaining proper understanding and read on what is happening.
For instance, knowing where the spark zone is, where the Bull Zone1 starts and what is happening there is already more than all the “knowledge” you managed to obtain to date.

If you learn mean reversion well, you can be the king of the traders.

Math.

If you want to use a mathematical formula in trading, here it is: if you make $100 ten times, you just made $1000.

Pips.

You cannot express gains in pips: it is meaningless if you do not disclose your multiplier (position size).
On the trading floor there was Sebastian sitting behind me (the only other older guy). He said: 10 pips a day will make you rich – and he spent all his efforts seeking out the smallest bodied candle up to a year back – like this was what trading was about.
How about 70 pips a day then out of 2-pip trades and virtually no losses. Could that make you rich? (EUR/USD does not even move 60 pips on most days.)

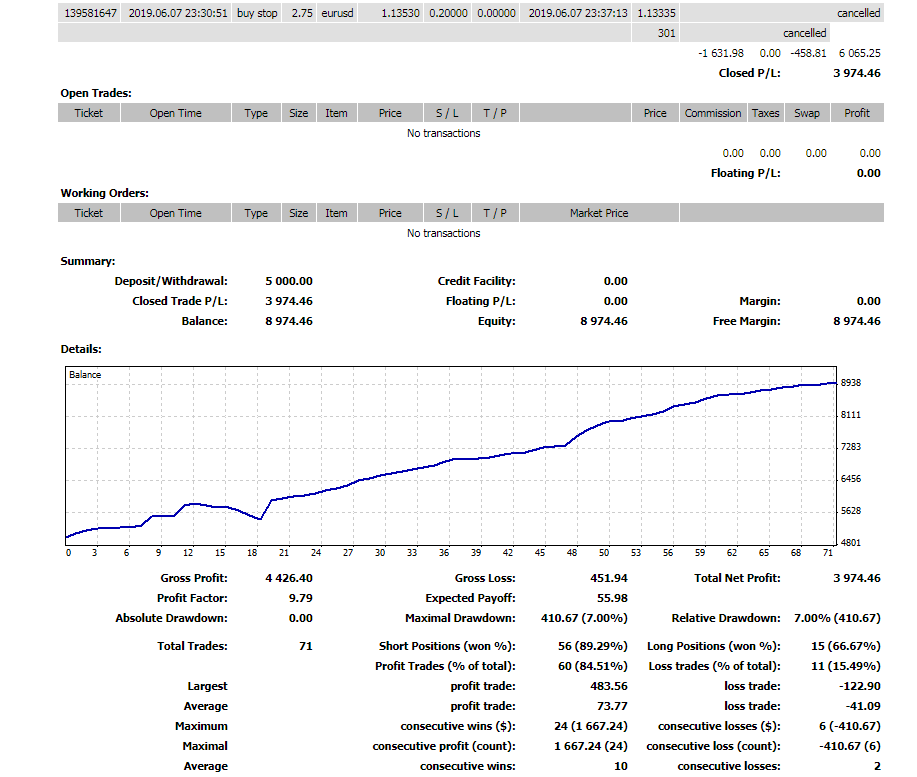
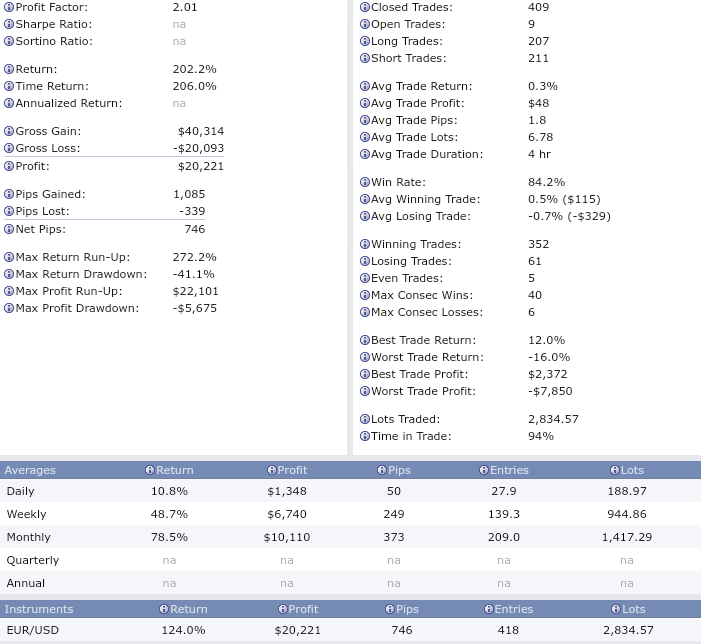
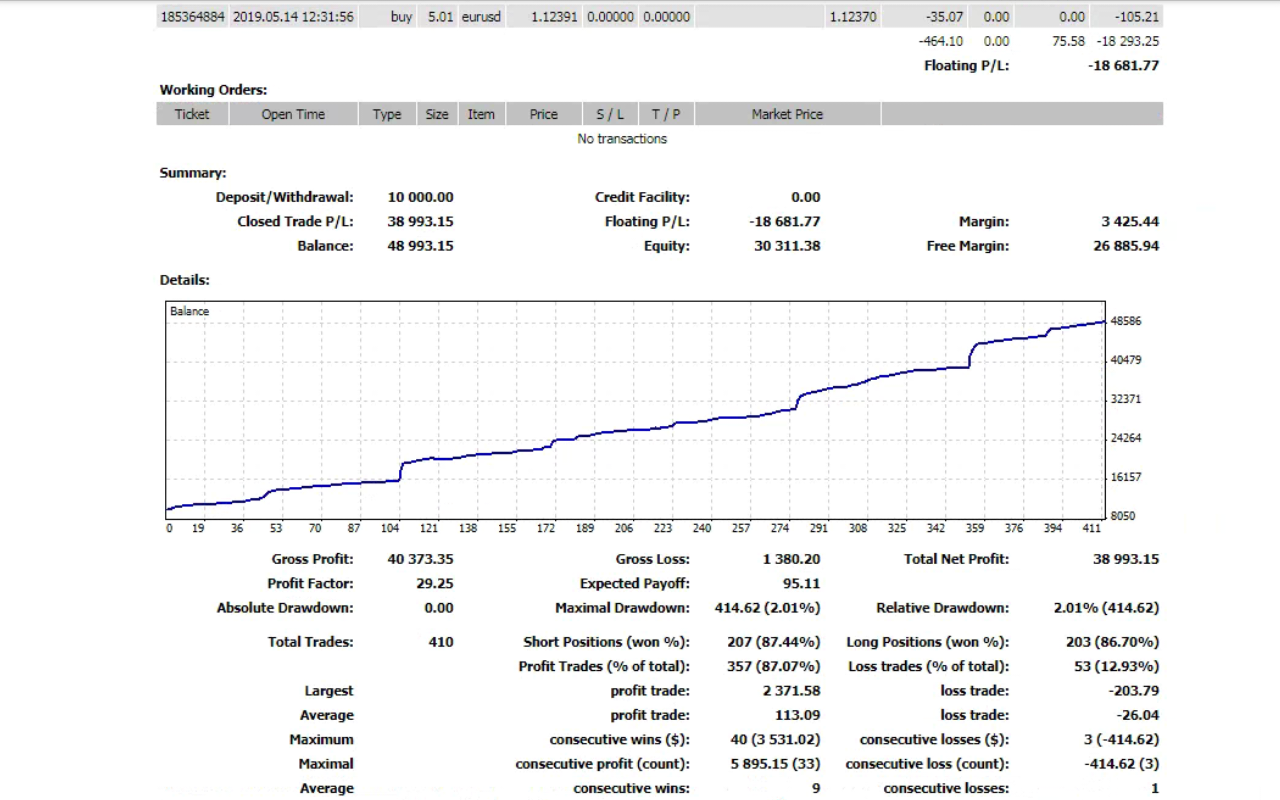
As you can see the lump sum if I was to cash in after 2 weeks is 200% gains.

The pips division is a bit off: you should not factor in the days when there was no trading; the 746 pips total has to be divided by 10, not 14.

I have done 415% before in 3 weeks (475% not factoring in the open positions), and now you know, if anyone would crack 1000% gains trading Forex in a month, that would be me.

Here is a video about what a difference the right person can make.

The original title of this post was intended to be Clubbed to Death

& another video to put our insignificance in perspective.

Oh yeah, if I haven’t mentioned yet, I am furnishing these numbers while holding a full time job.

1 Answer

So, you can learn from Scott Barkley that there are only two reversal patterns: a wedge and a head-and-shoulders, and all other patterns are continuation patterns.

Then you might decide to educate yourself further, and start reading my blog to find out, that there is only one reversal pattern, an RSI2 reversal divergence. The difference between the two patterns mentioned earlier, is that the wedge comes with a the RSI2 divergence between the last two fractals while the H&S has an RSI2 divergence between the right shoulder and the left shoulder.

Even Better Than The Real Thing – Pigging Out

In short, I had to come up with a better logic for hedging than anything before. (I had both my D-Day Hedger and the DDI Turn routines open positions in the wrong direction the other day while I was trying to trade in the proper direction – and all of this happened right after the RSI2 Hedger wasn’t supposed to open a hedge.) Since my RSI2 mania hasn’t been subsiding for about an eternity, I decided to use the pig in the attic and the pig in the basement for a change of direction. Interestingly, the reversals down seem to overwhelmingly happen in the Bull Zone 1 – when the bulls cover and tip the scale – and the reversals up, you can guess after this. A pig would get called off upon a re-visit of its block, and in general the price has the first 30 minutes available for it to leave for good.

Among the filters I am looking for a wick that is larger than 5.5 pips and an RSI2 sharpie sequence.

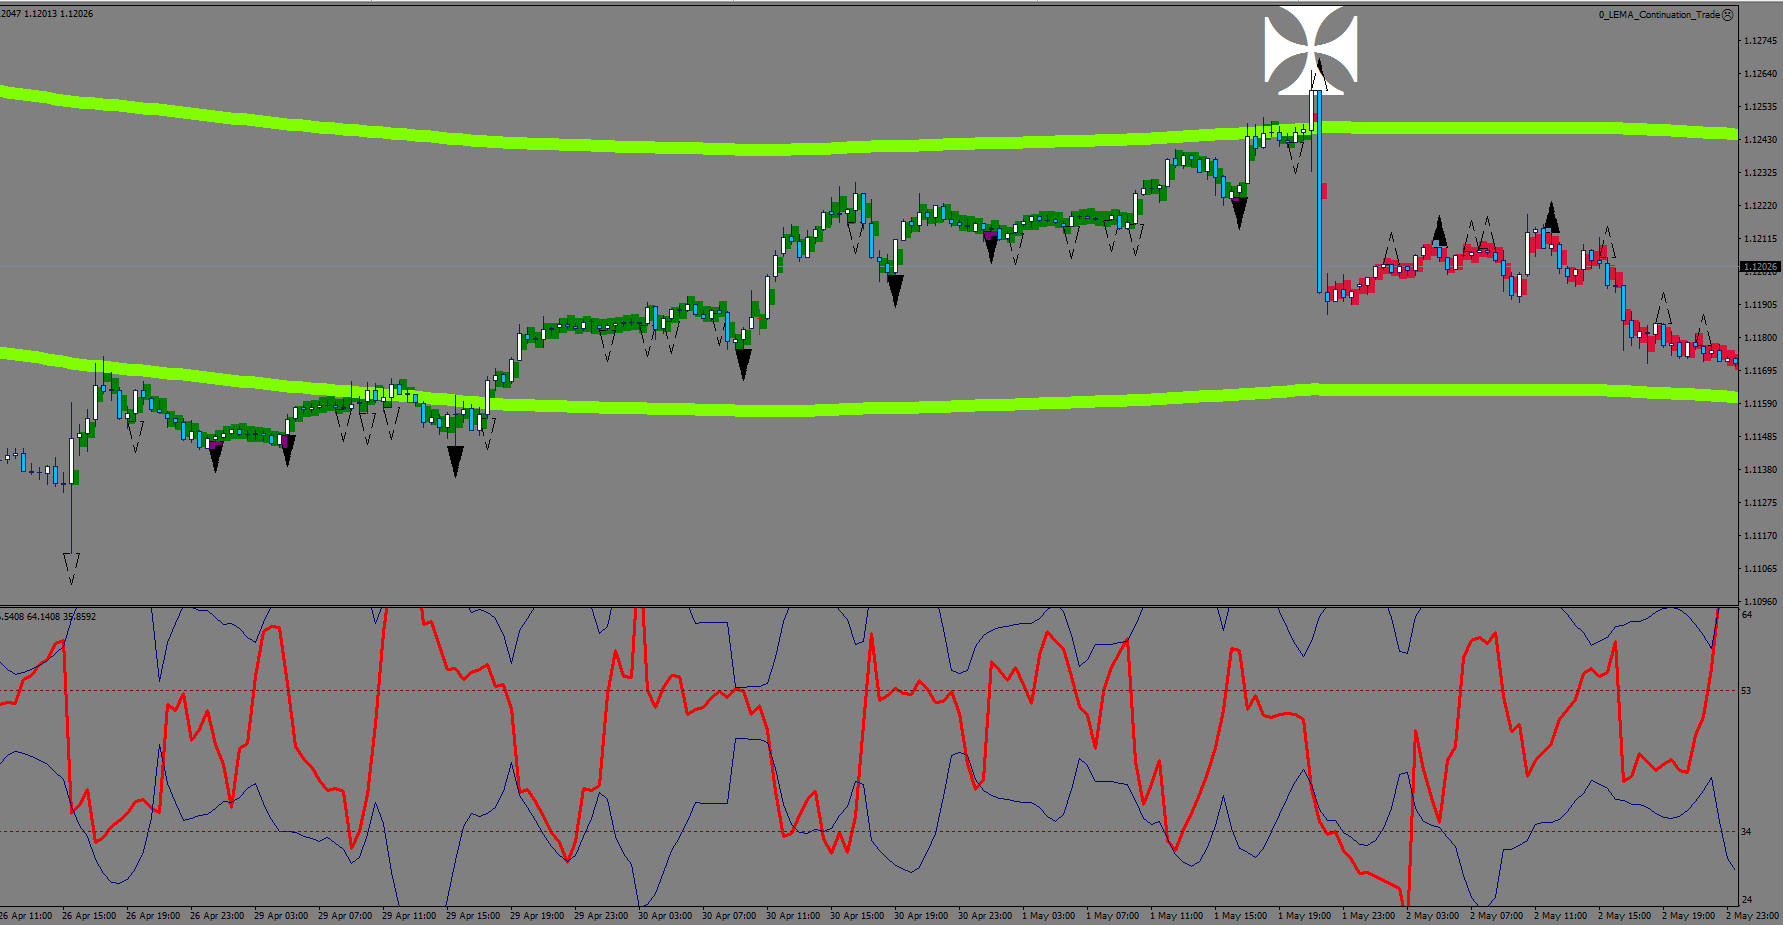
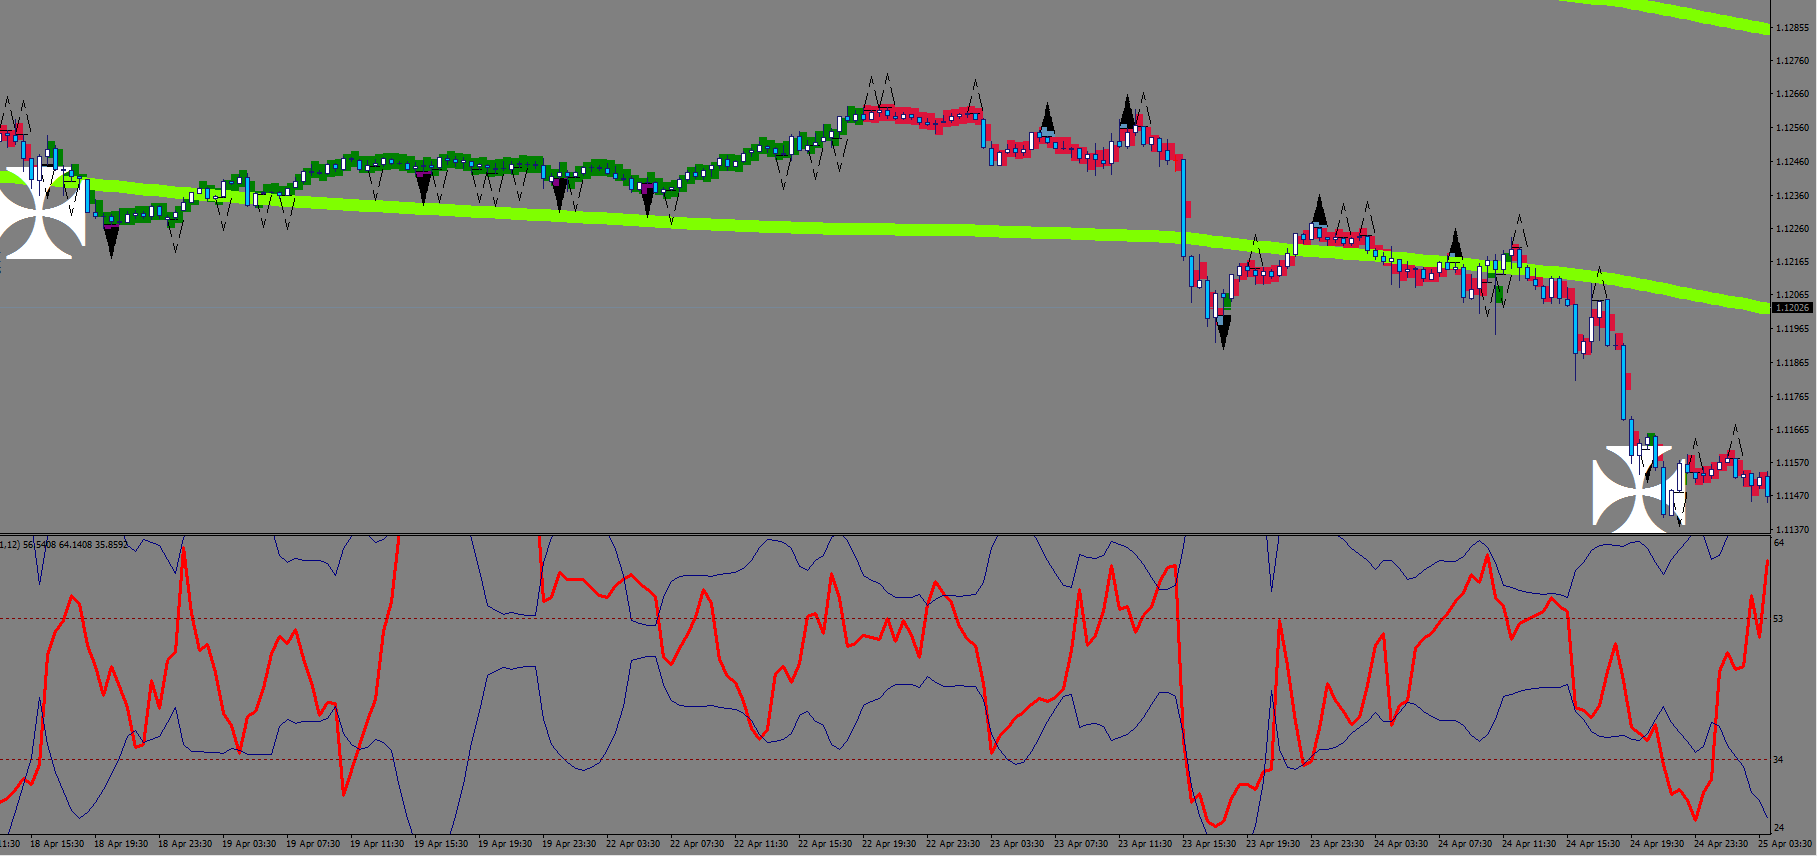
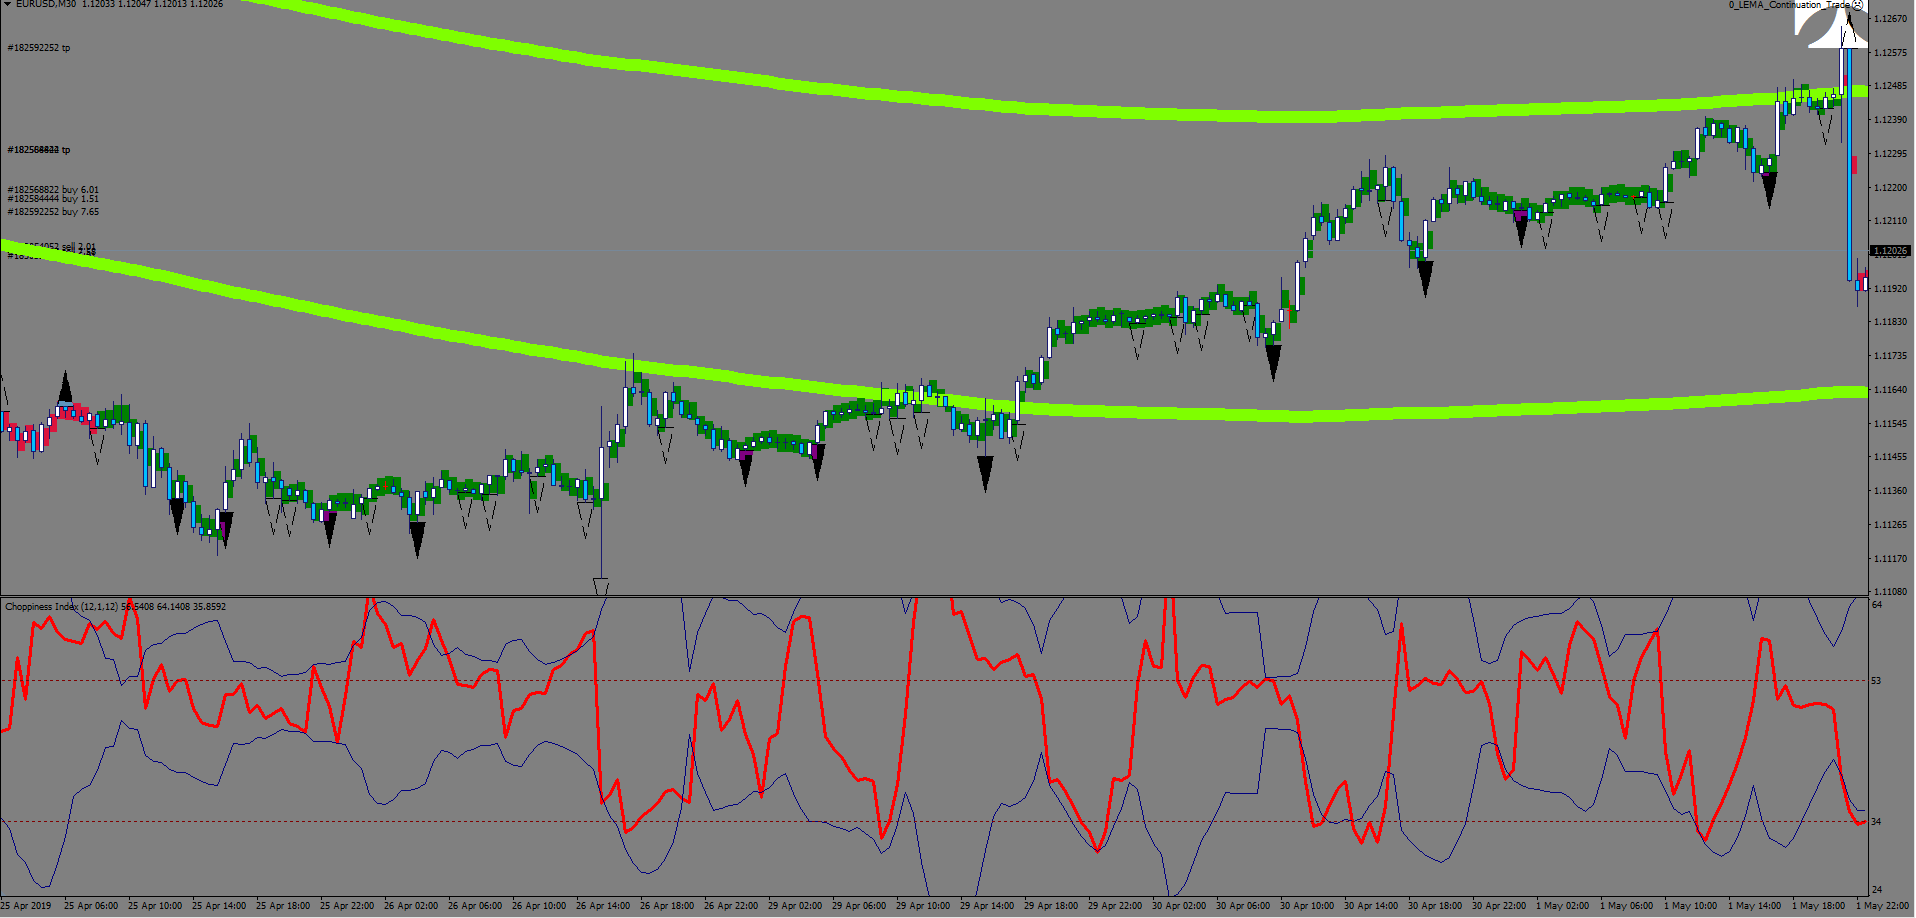
The black, filled triangles are the primary entries, the black triangle outlines are the secondary entries, and the white admiral cross marks the exit condition. To better understand, primary means quality = put plenty of the fire, the secondary means to throw a log.

As for an additional deciding factor, I started plotting again a 12-sample choppiness oscillator – I intend to measure bull/bear strength with it.

I do realize that I may need to add further filters in the future, but this is not at all a bad start. See for yourself!