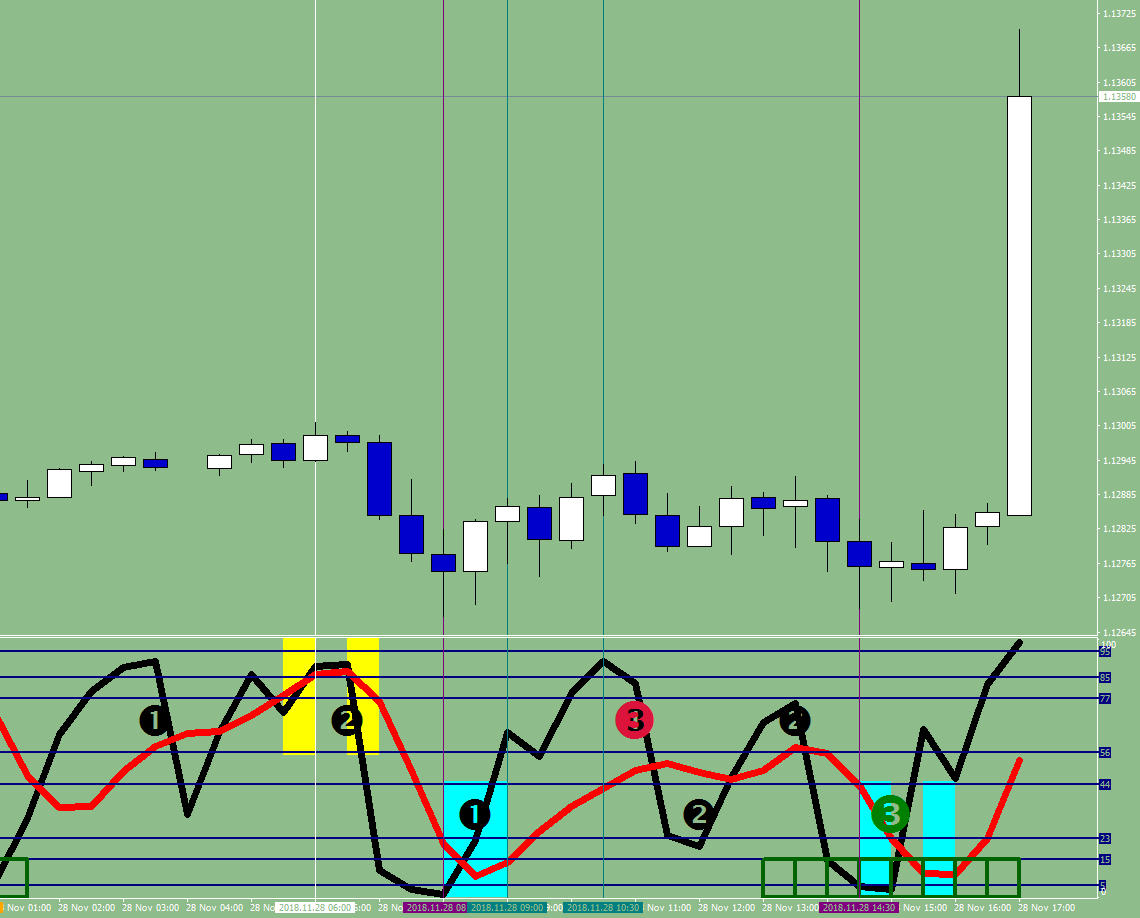
2. Open positions based on the indicated color – red or green
2a. Play one direction only, the color changing stochastic line is your main guide
2b. Fine tune your entry with the RSI2 values (black line).
On a green background, open buy when the RSI2 is below 23.
On a red background, open sell when the RSI2 is above 77.
3. Wish upon a star.
3a. Your Exit signal is a star followed by no star.
3b. Or the stochastic line changing to gray.
As you can see from the image above you had your exit signal before the gap up over the weekend. And the plain above was called a sell all along.
You may further ease your life by obtaining a copy of my _88_Luftballons indicator, which would plot the current RSI2 readings with large billiard ball numbers that are visible from the other side of the room. It also has about a zillion features that can extra fine-tune those entries and exits.
The latest new feature is the “time is up” powder blue boxes.
Knee deep in Hybrid trading I need to define the human role in a binary way.
I have been thinking about what the Human indicators would look like.
My current conclusion of the supplementary human trading is that it should be an “investment” in the right direction.
To figure the turning as a progress is more crucial than ever.
The market can turn both on a high/low note and on no participation – hence the title, and the first examples are here to look at.
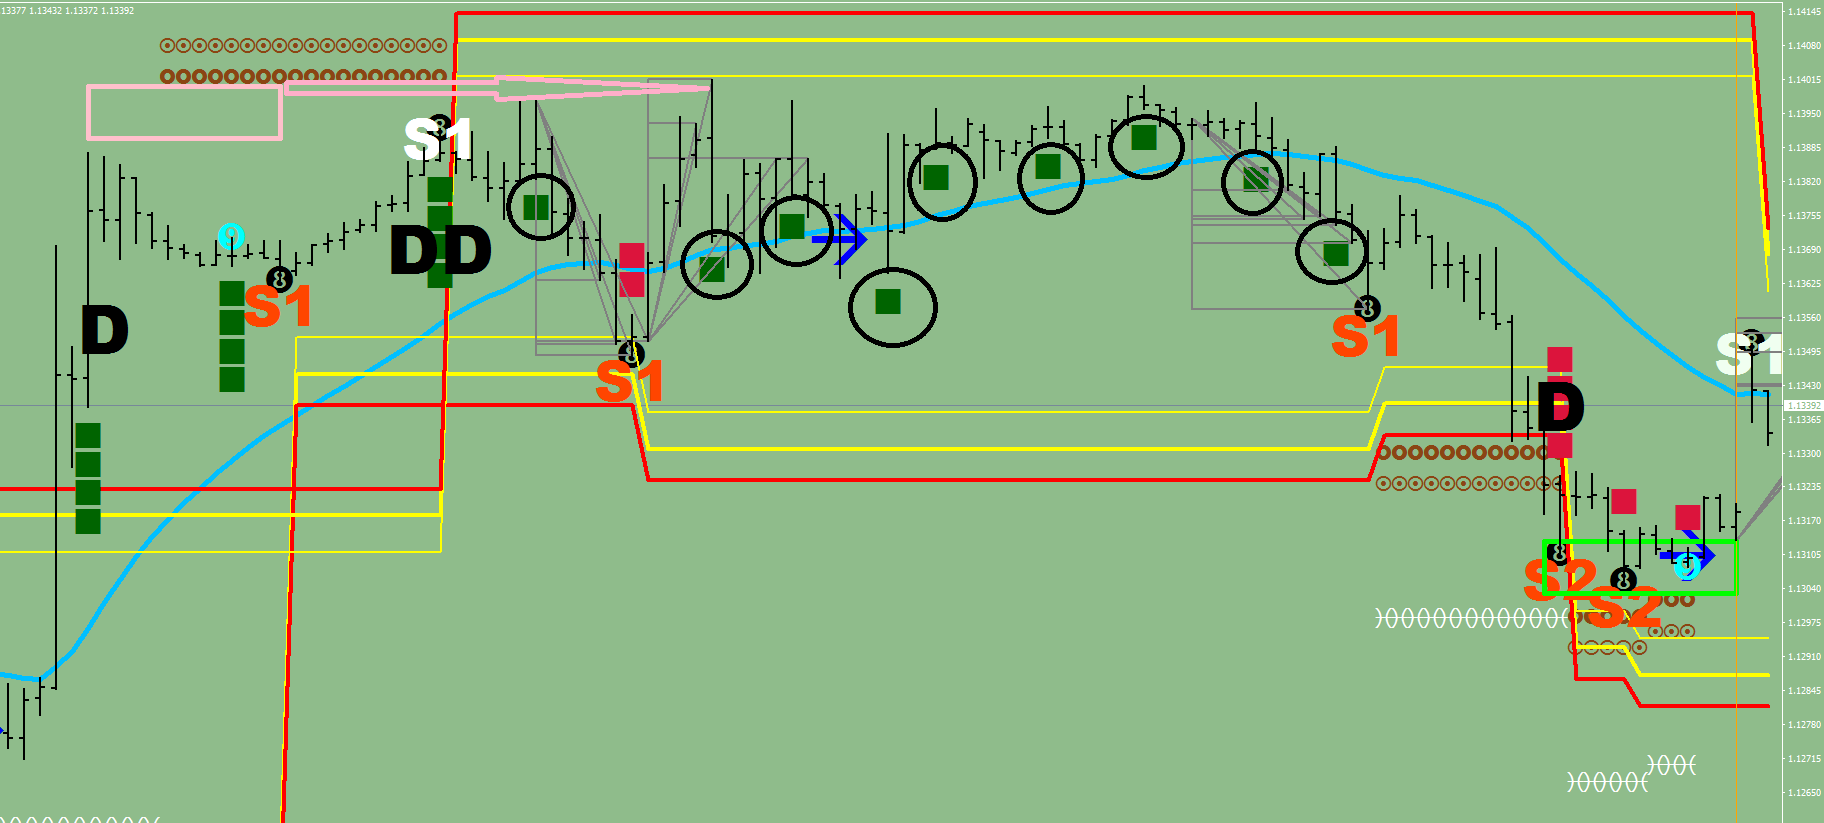
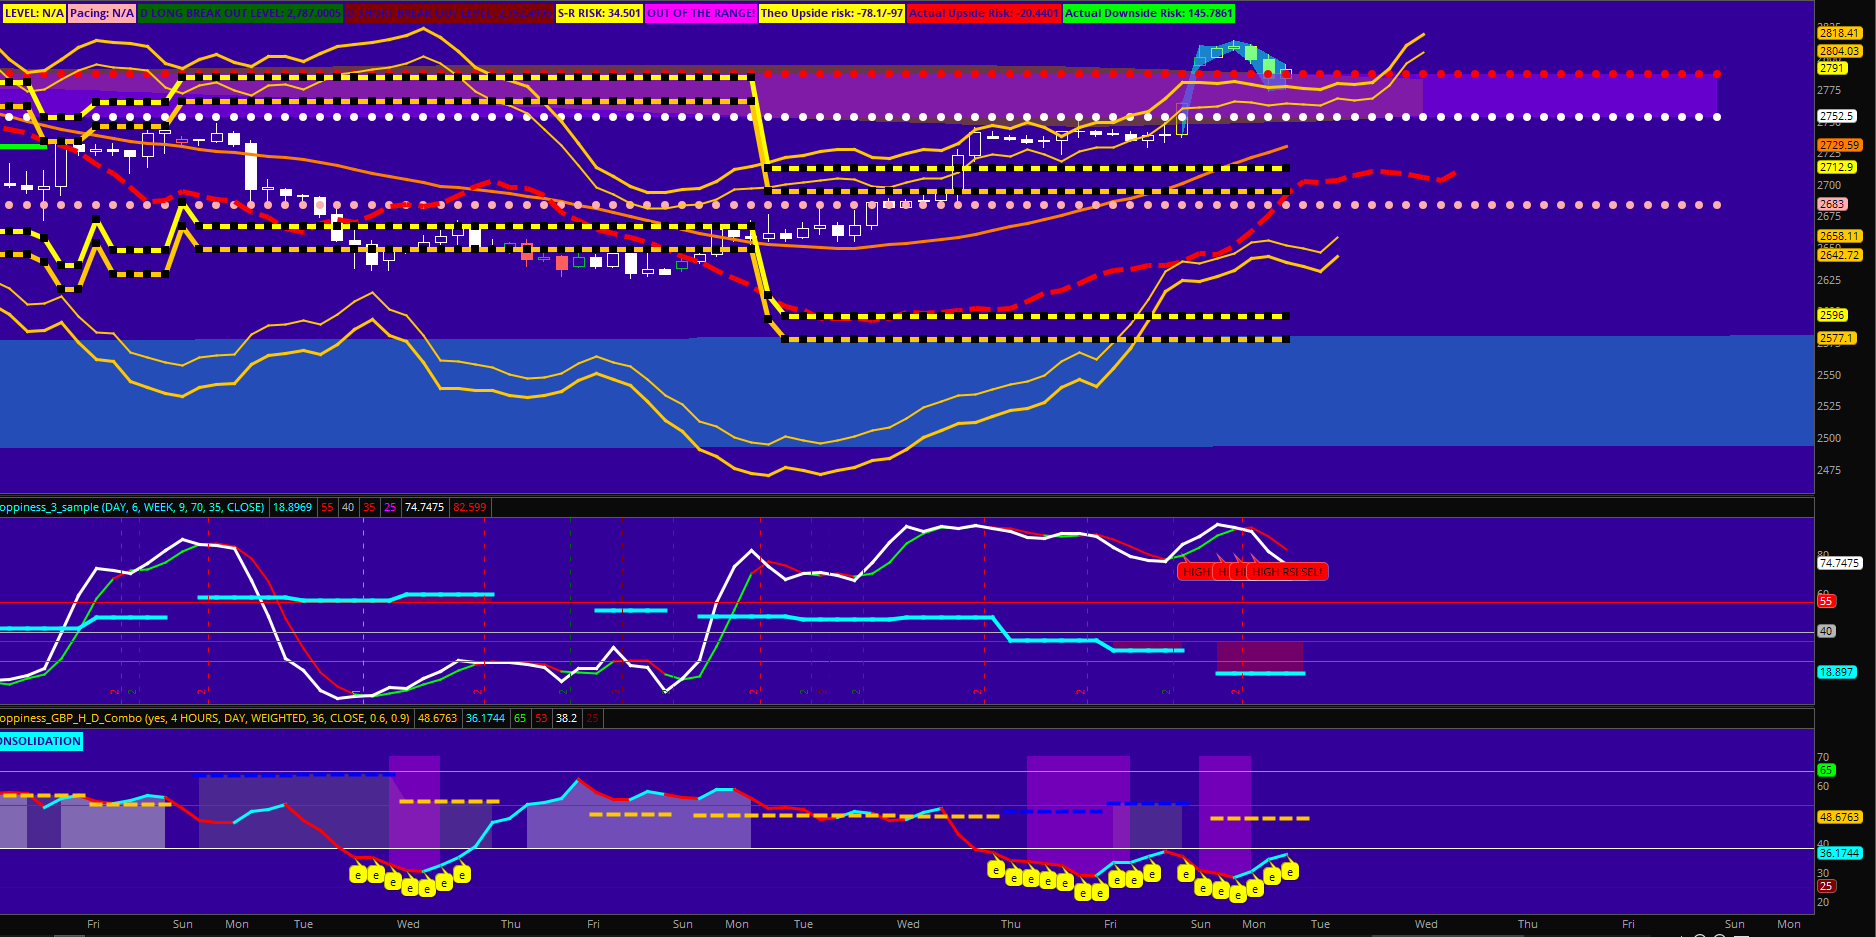
Lackluster Busts
On the image above there is a pink projection box, where the thrust should had landed in the next 10 samples or 5 hours. There was a thrust later that made it to the further level, but with significant delay. All the circled swing strength measurements fell in the moderate, 1x readings. The market ended up bowing back down.
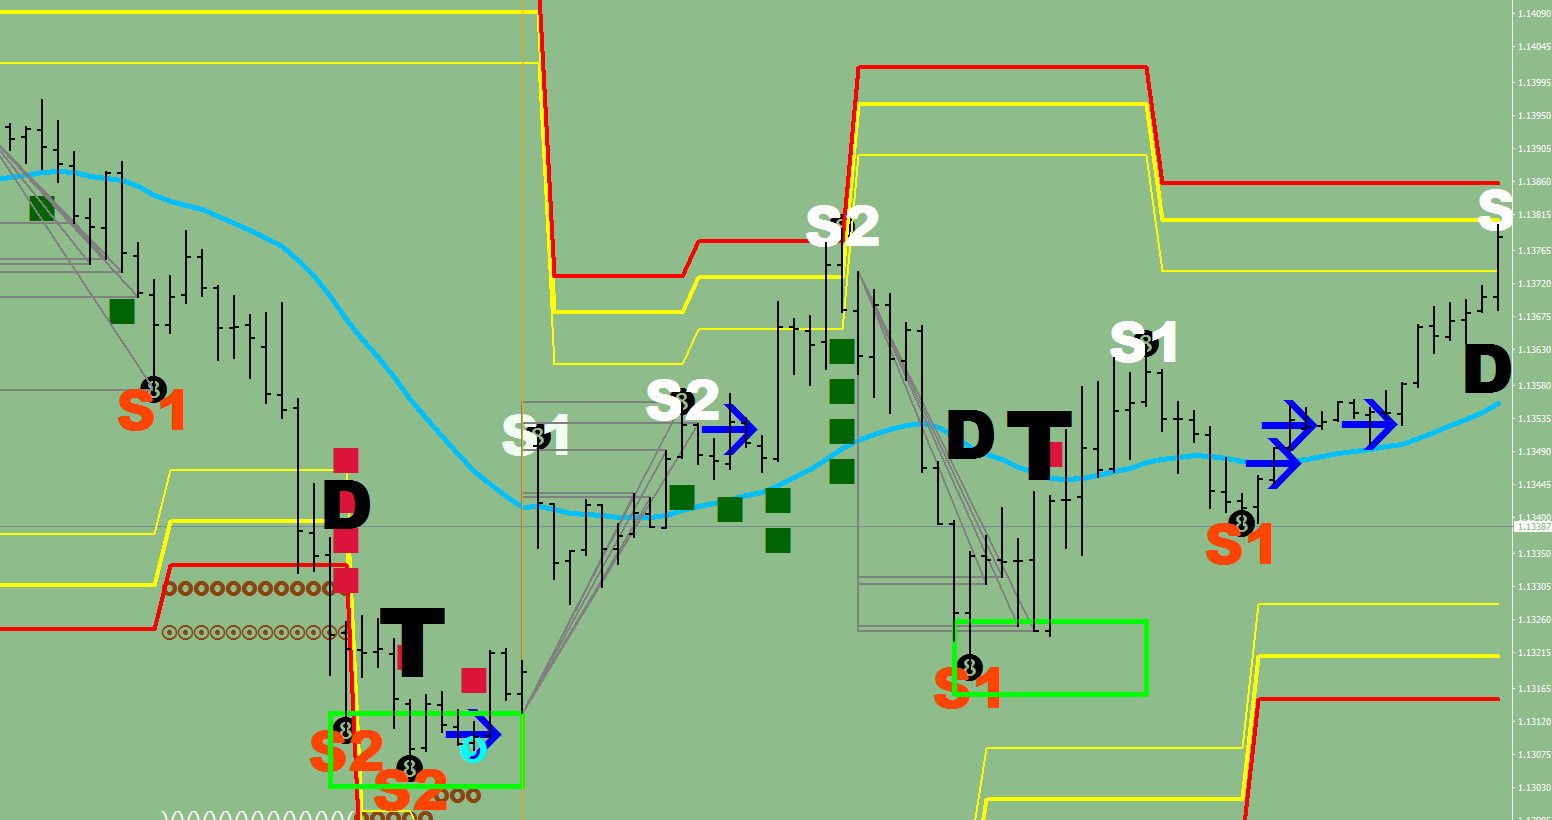
Driven Thrusts
I have got 2x 2 examples for you. I call the market “Driven” upon printing 3 consecutive embedded RSI2 max / min readings.
Once the condition subsides, the thrust becomes due. There may be multiple ones of course, but they should arrive in the next 5 hours if the interest is still on.
T=Thrust, D=Driven, DD=Double Drive
The double drive factors in the Stochastic Bars Mixed Peak readings to calculate for an extra oomph.
The last one has its box started and the time is ticking for a re-test of the low. 4 hours to go.
(These Plots minus the “T” prints are part of the 88 Luftballons indicator of mine.)
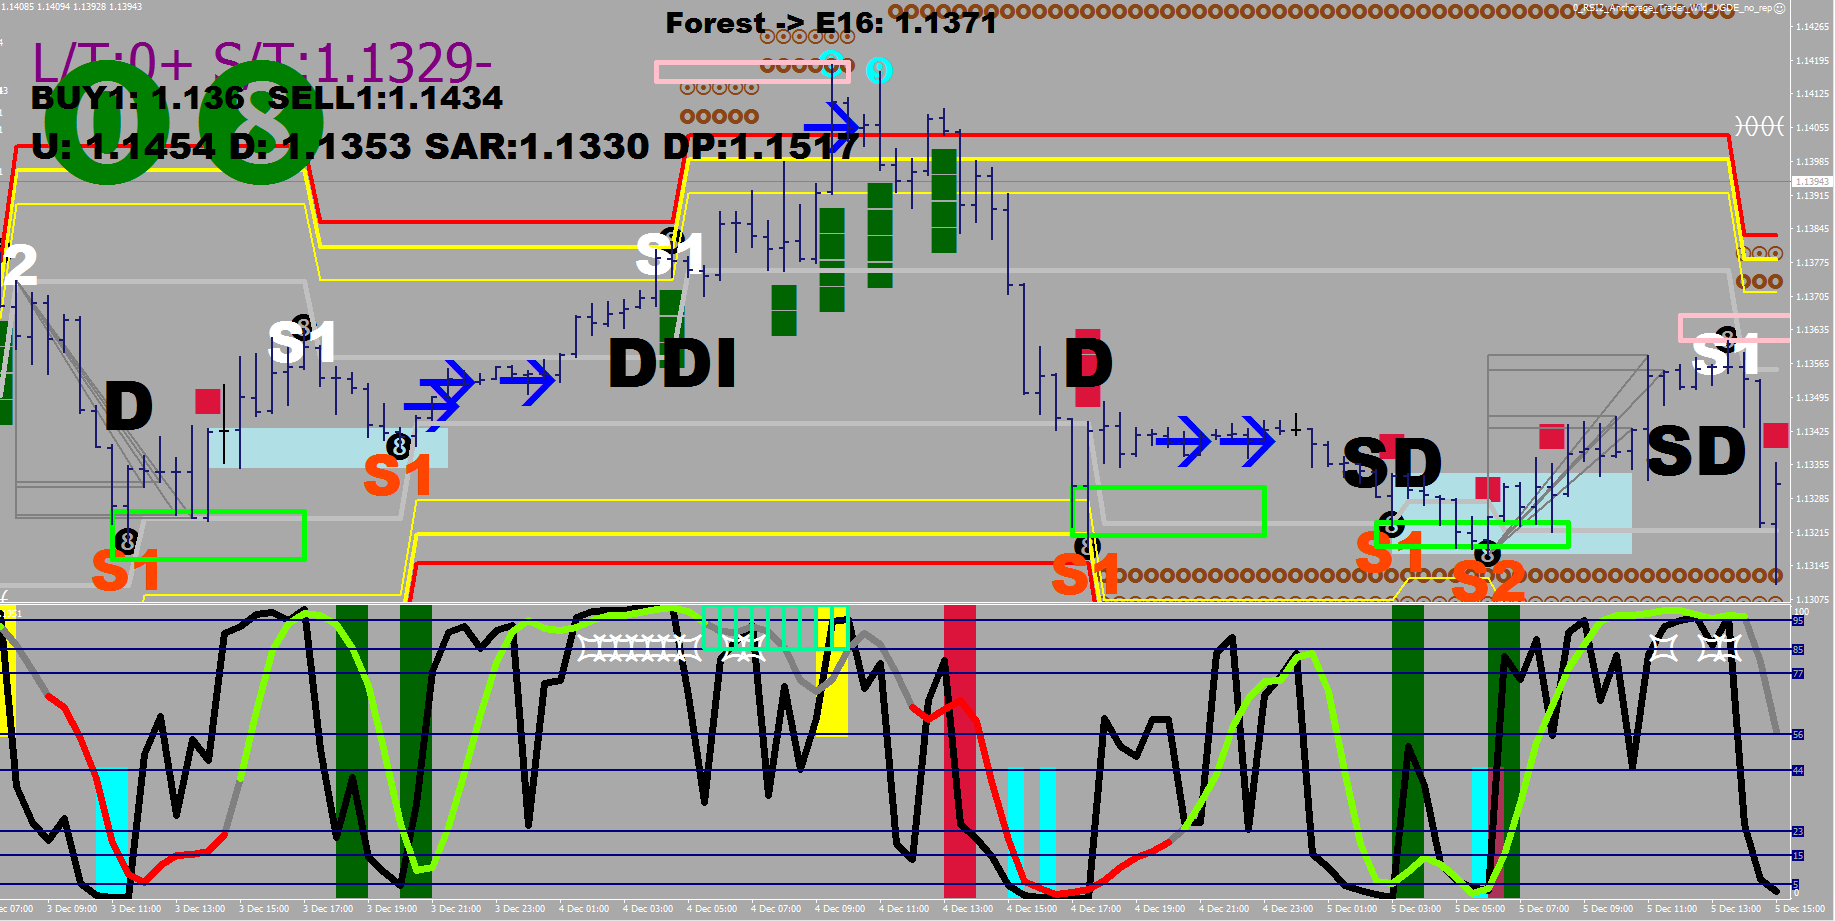
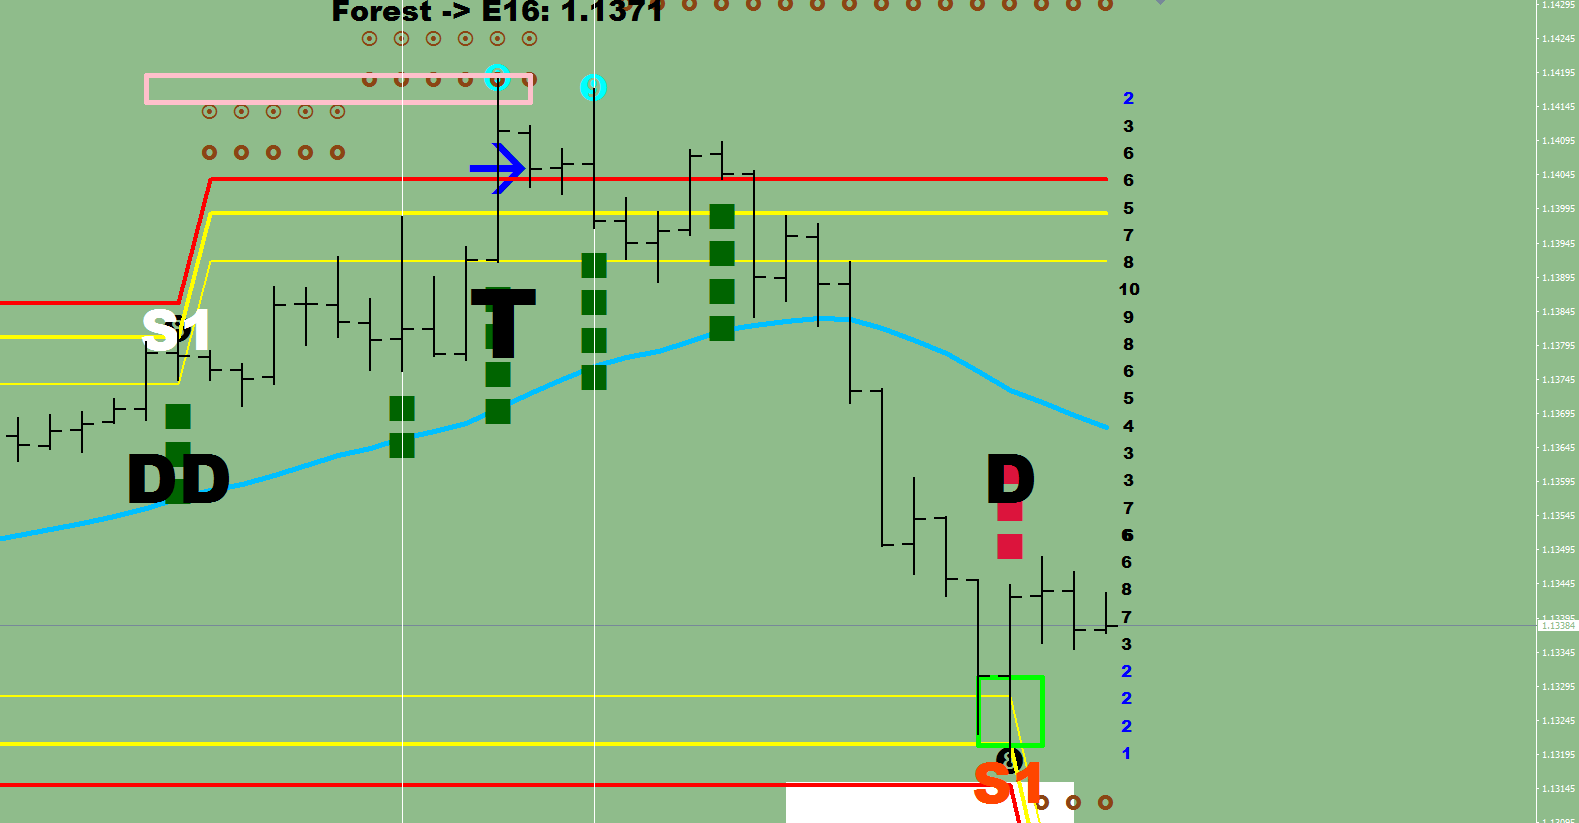
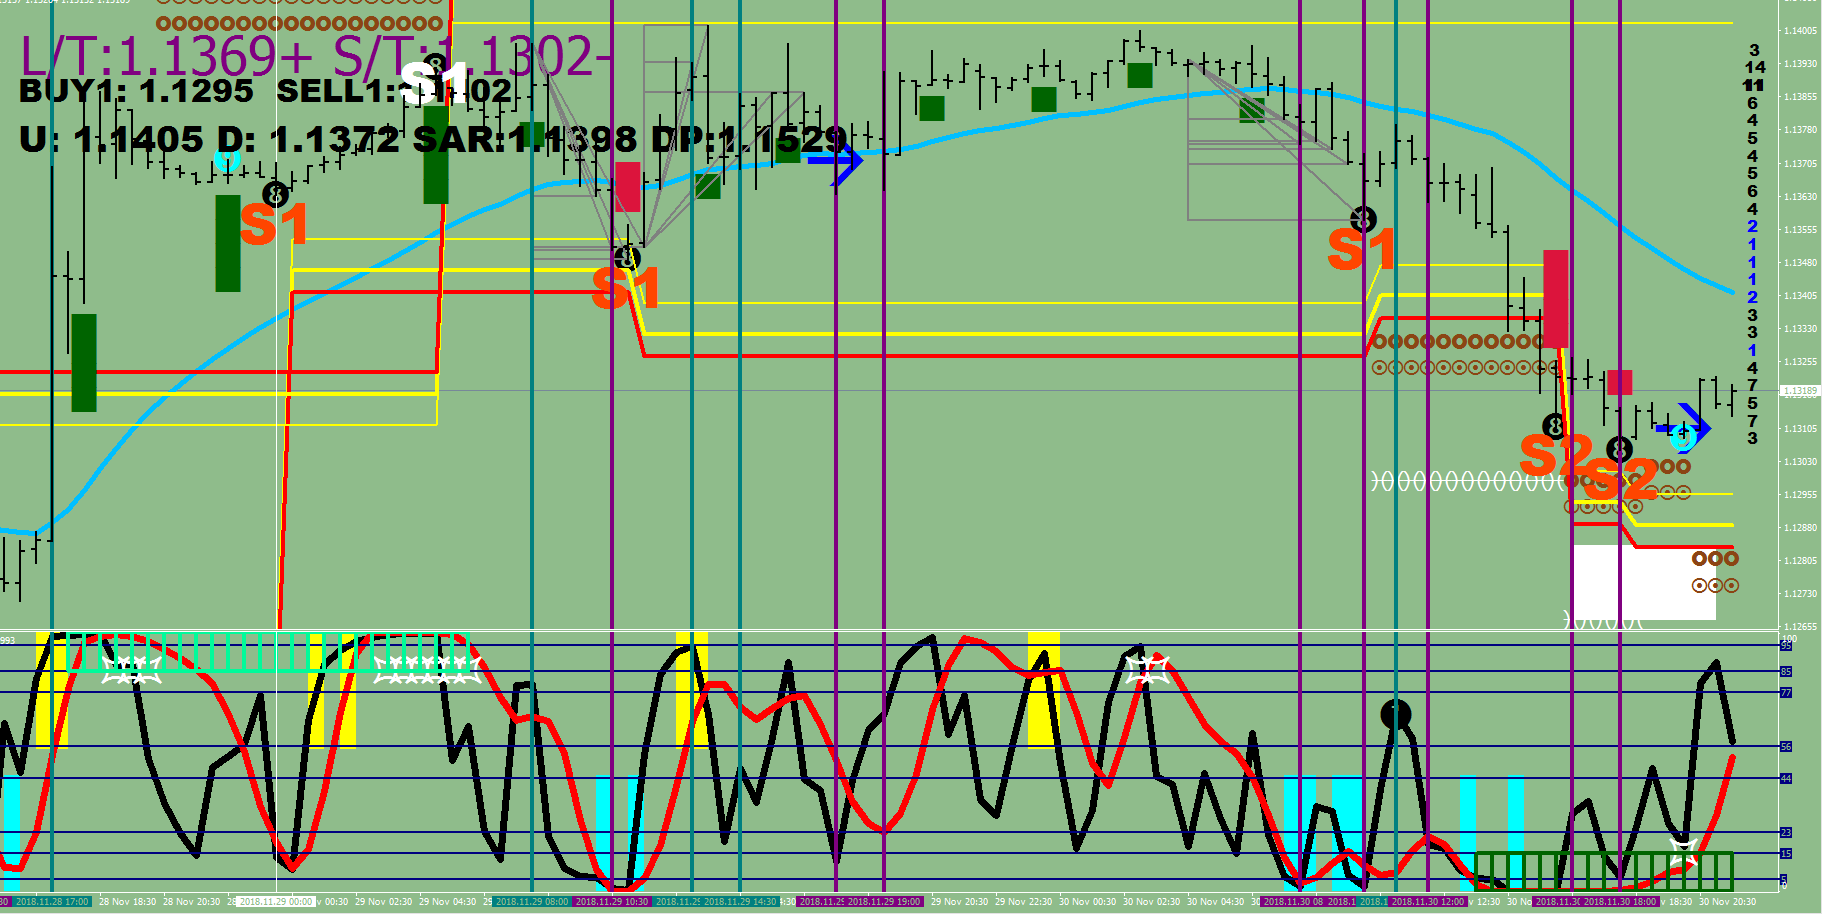
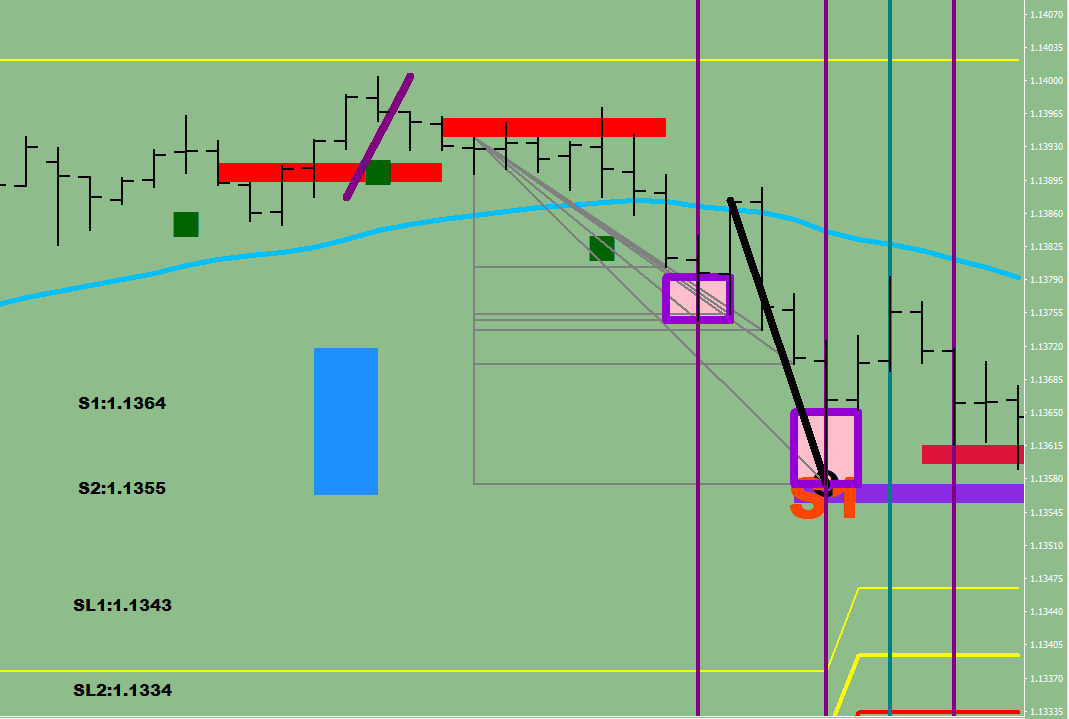
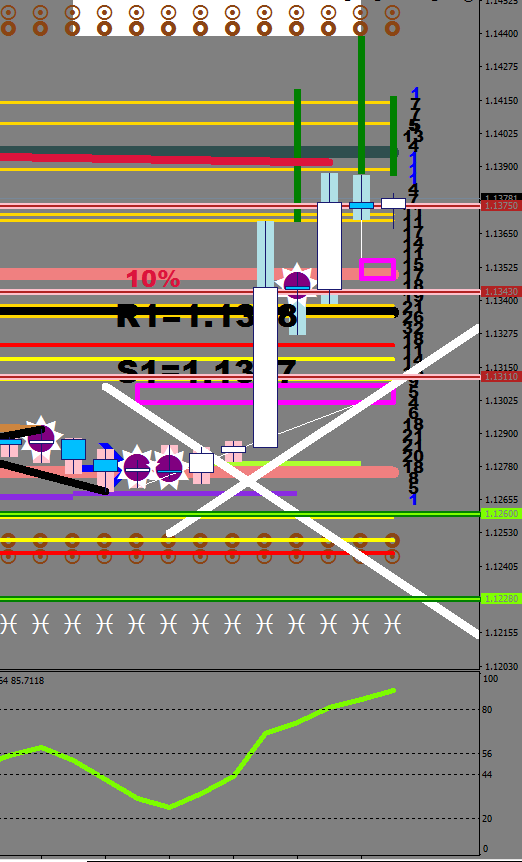
My latest indicator idea is a scale from 1-4 representing the strength of a move measured by the distance / location achieved by the last fractal move.
The green and the red little squares on the chart, yes.
Notice the break out on the image below, on the left.
Price broke through the red line, got a 4-score and then proceeded to stampede until the range got re-aligned with a new sync high printed (the S1 on the screen). As soon as the new range was made, there was noting that ever registered higher than a “1” on the upside, but the pullback went to “2” on the downside. This subtle change in dynamics is what I wanted to be able to give new visuals to. The last swing print to the downside was a “1” – that is weak. Remember what happened when there were only 1-prints on the upside.
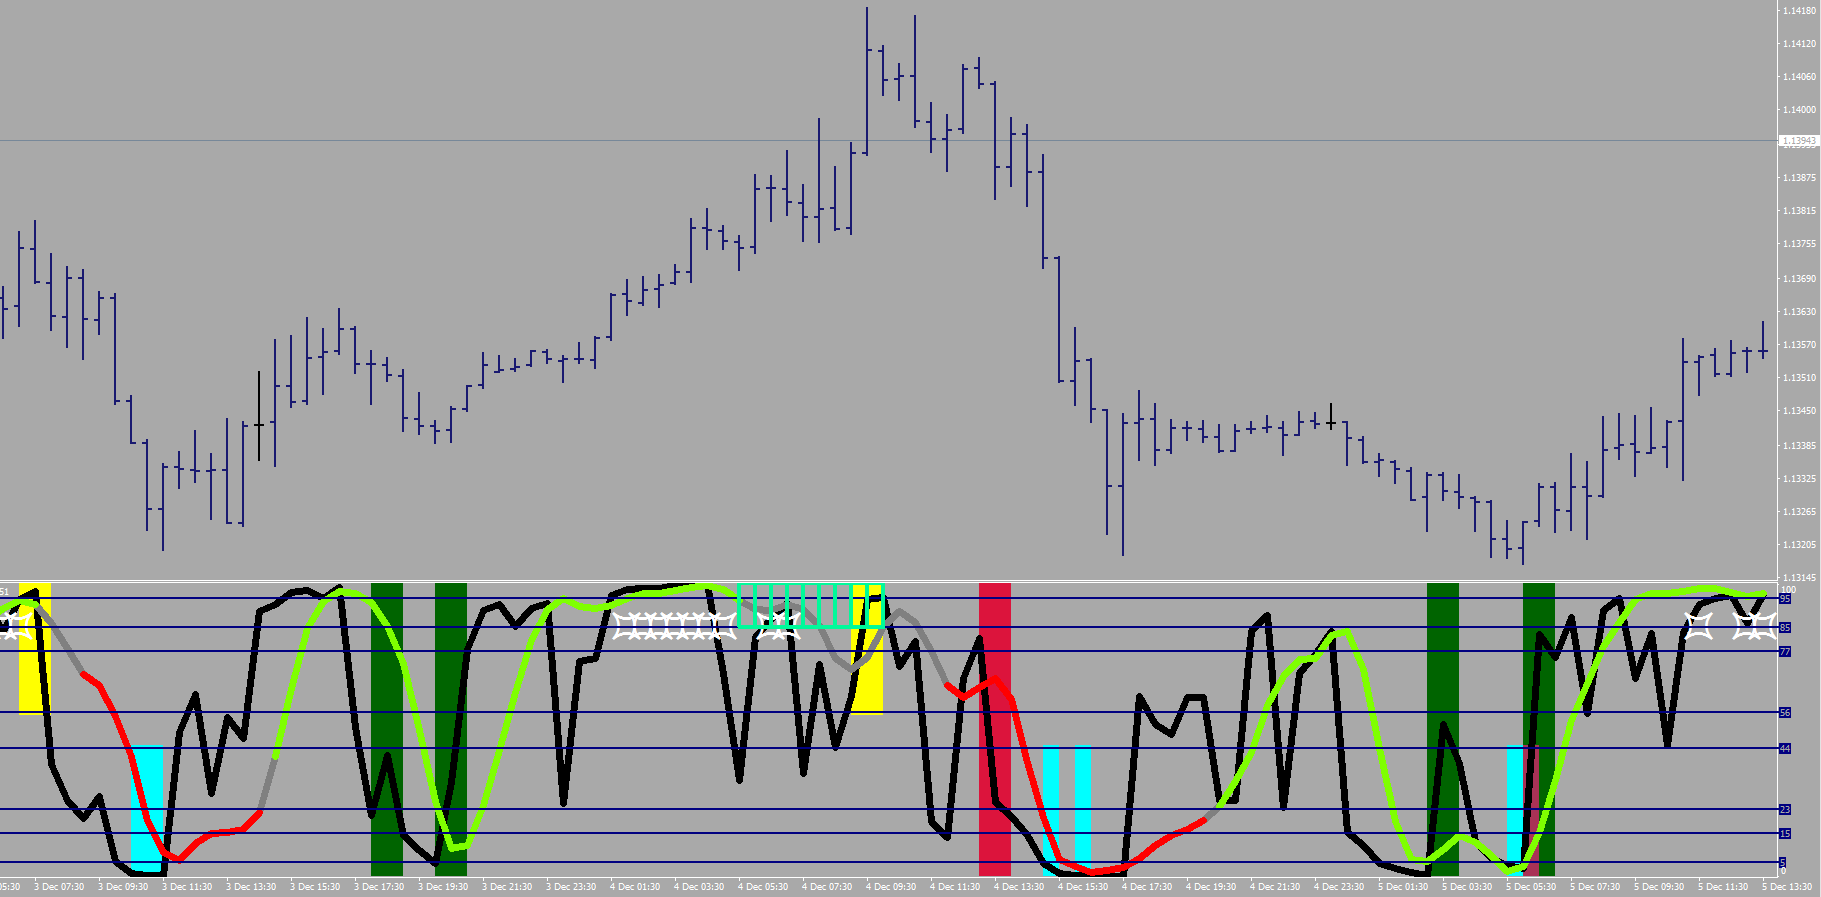
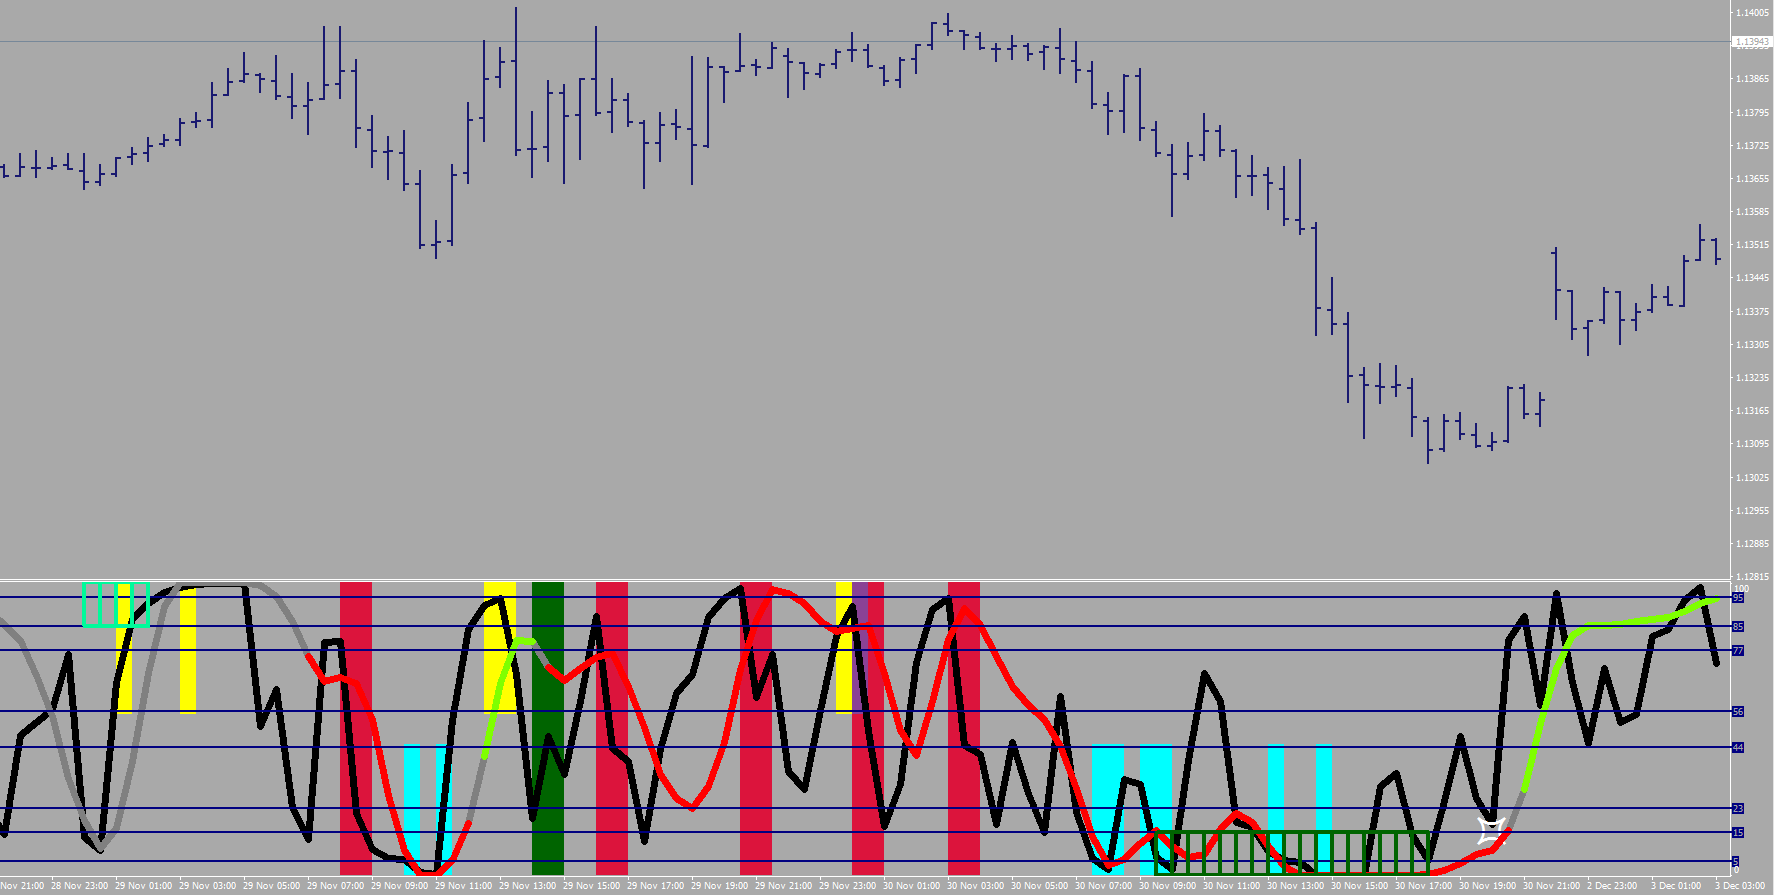
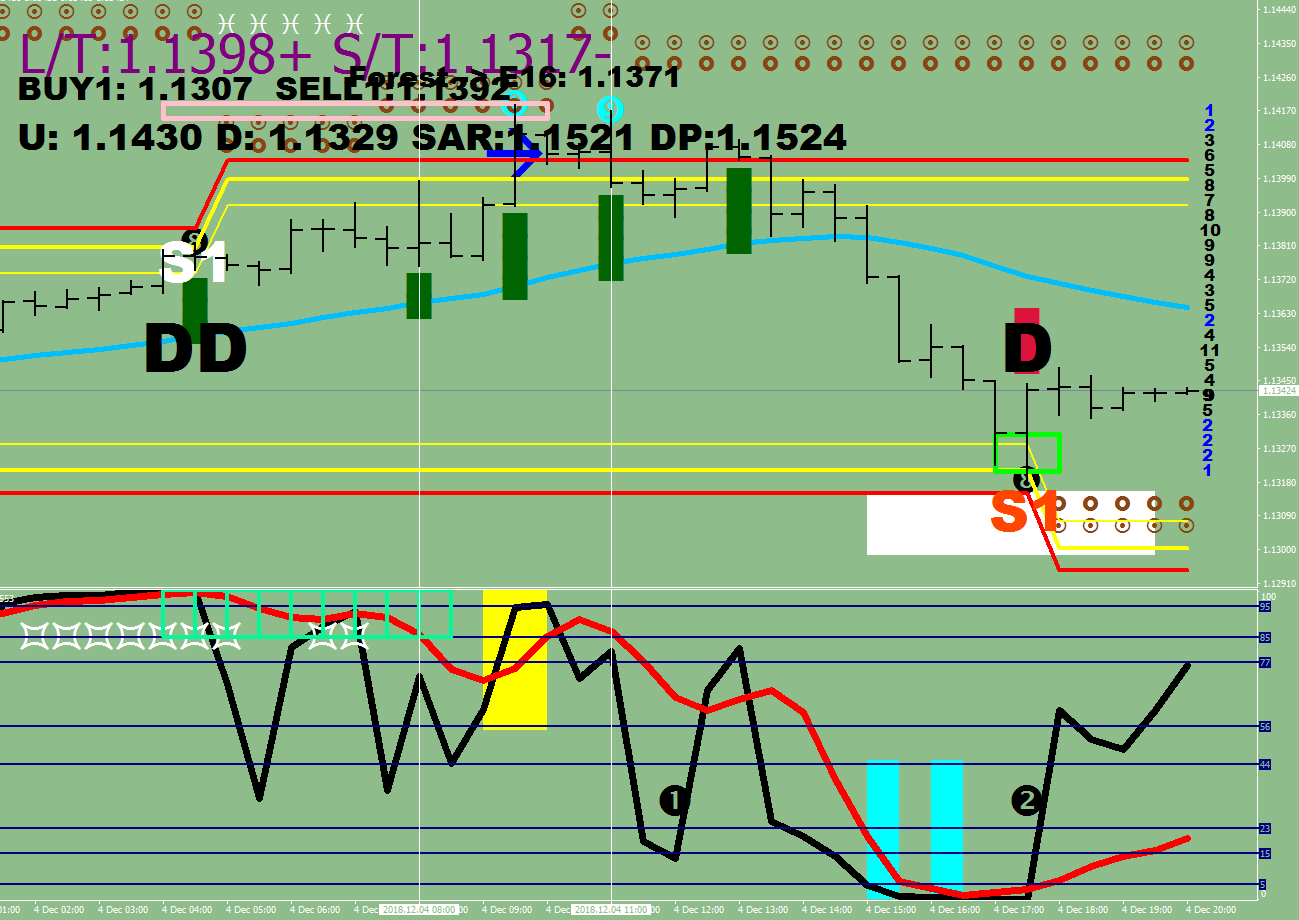
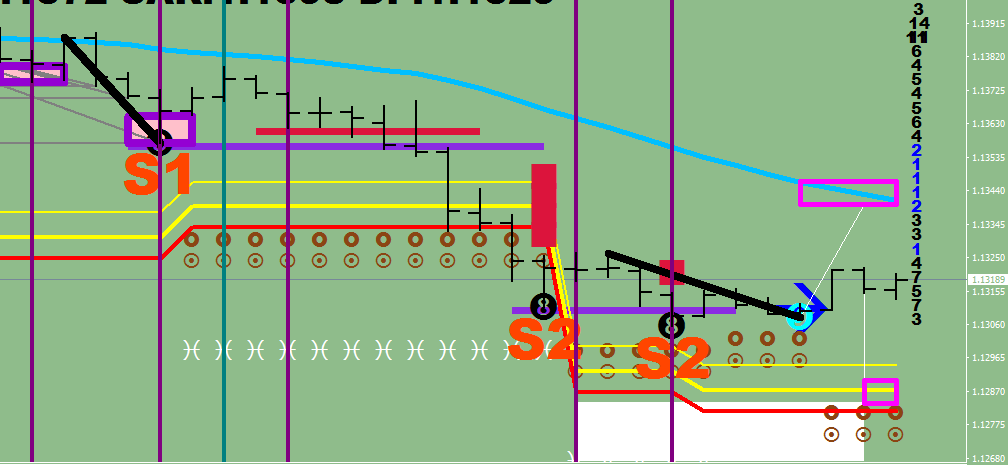
Other: the stochastic bars hybrid got incorporated into the bottom oscillator (as white star looking things) to save surface. I made a Rebound hedger routine that is based on this signal: if there was a star, it buys / sells the pullback in the next 10 bars. It also crops its own positions when they reach the opposite end on the scale. All RSI2 readings based.
This would be buying the following pullback for instance:
The vertical lines are the “stops”. They are showing the end of an at least 2-sequence run that expanded the range to beyond 1/2 fluctuation size in the last 4 samples. They are my current definitions of end of waves. As you can see, I don’t call everything a wave, anything that remains within the fluctuation cap is not a wave.
The green mesh at the top / bottom of the oscillator is meant to draw attention to an RSI2, 2 or 98 reading on the 4-Hour chart, that is basically an over-rider function: whatever you do, don’t sell / whatever you do, don’t buy while the condition persists. When the condition is waived, then it is time to go crazy.
(The chart screen plots are all part of the 88 Luftballons routine, and the bottom indicator goes by the name of _RSI2_)
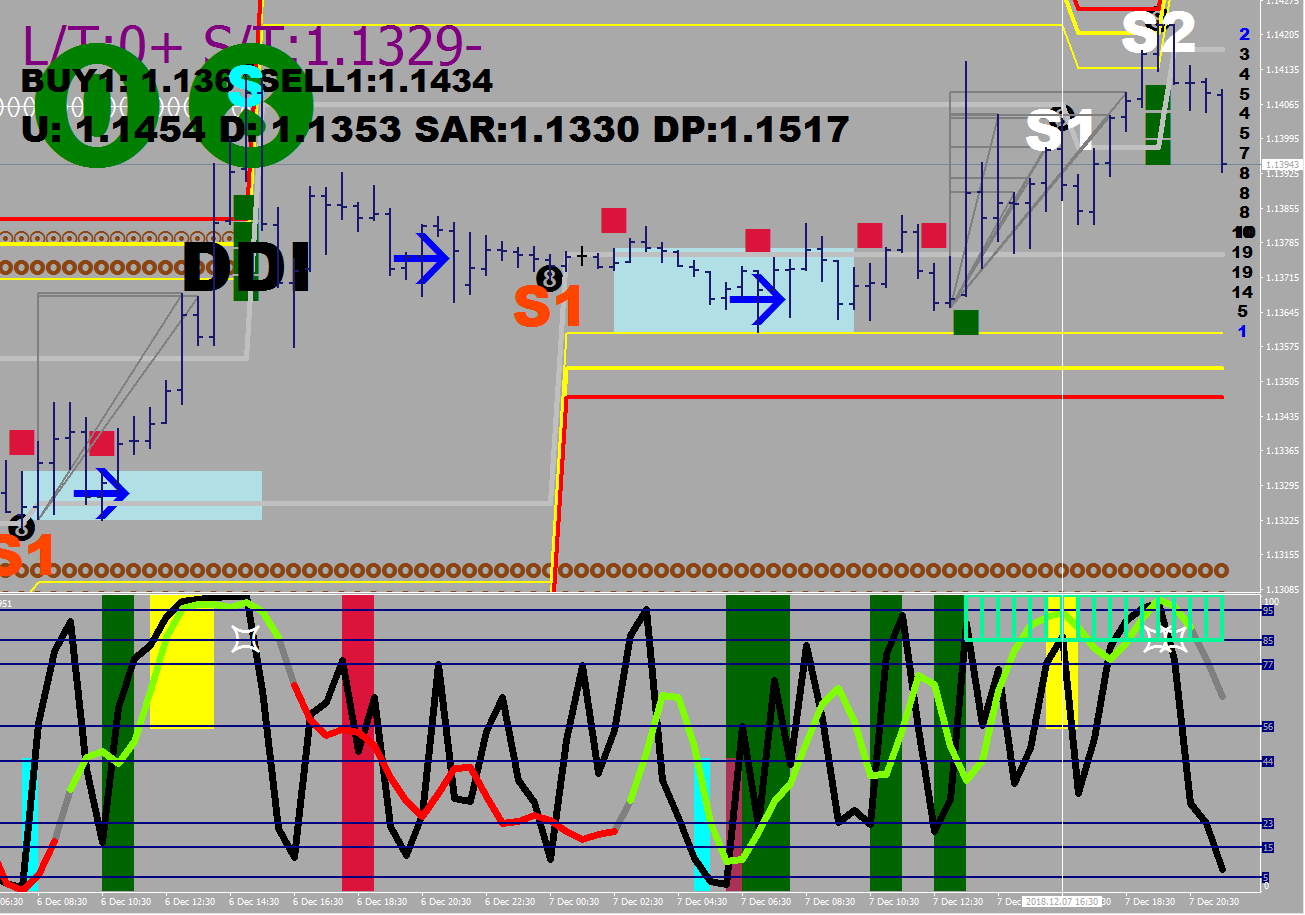
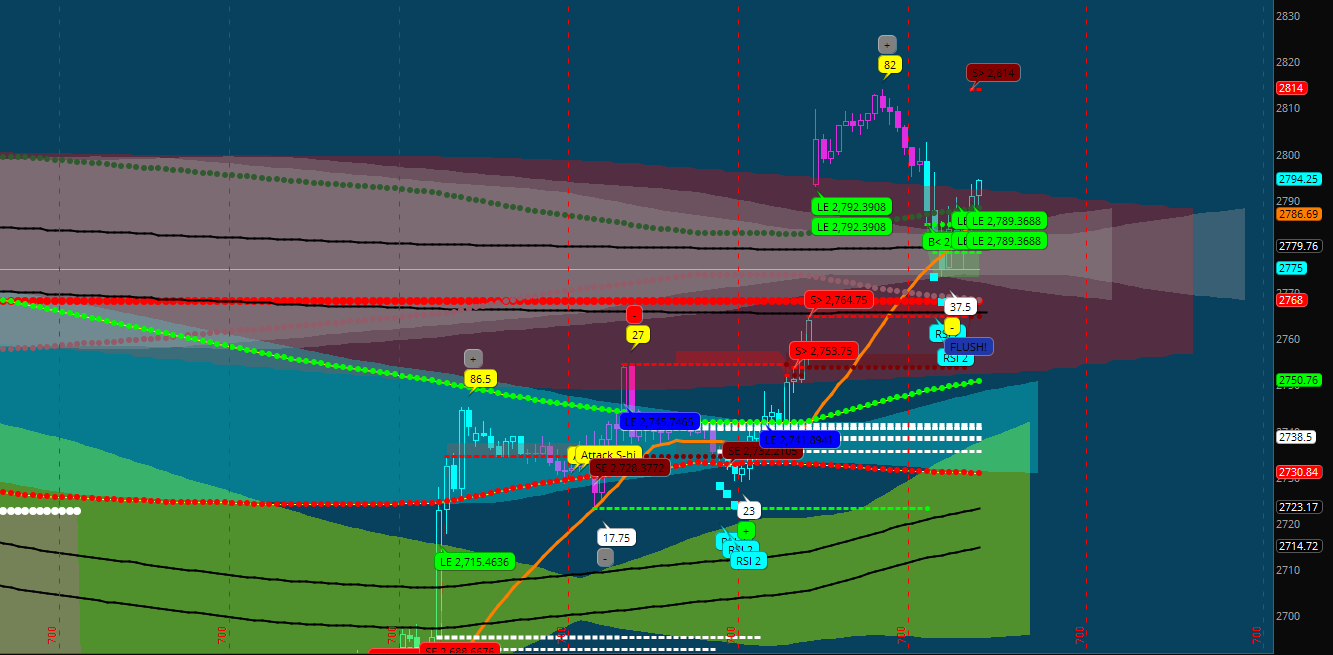
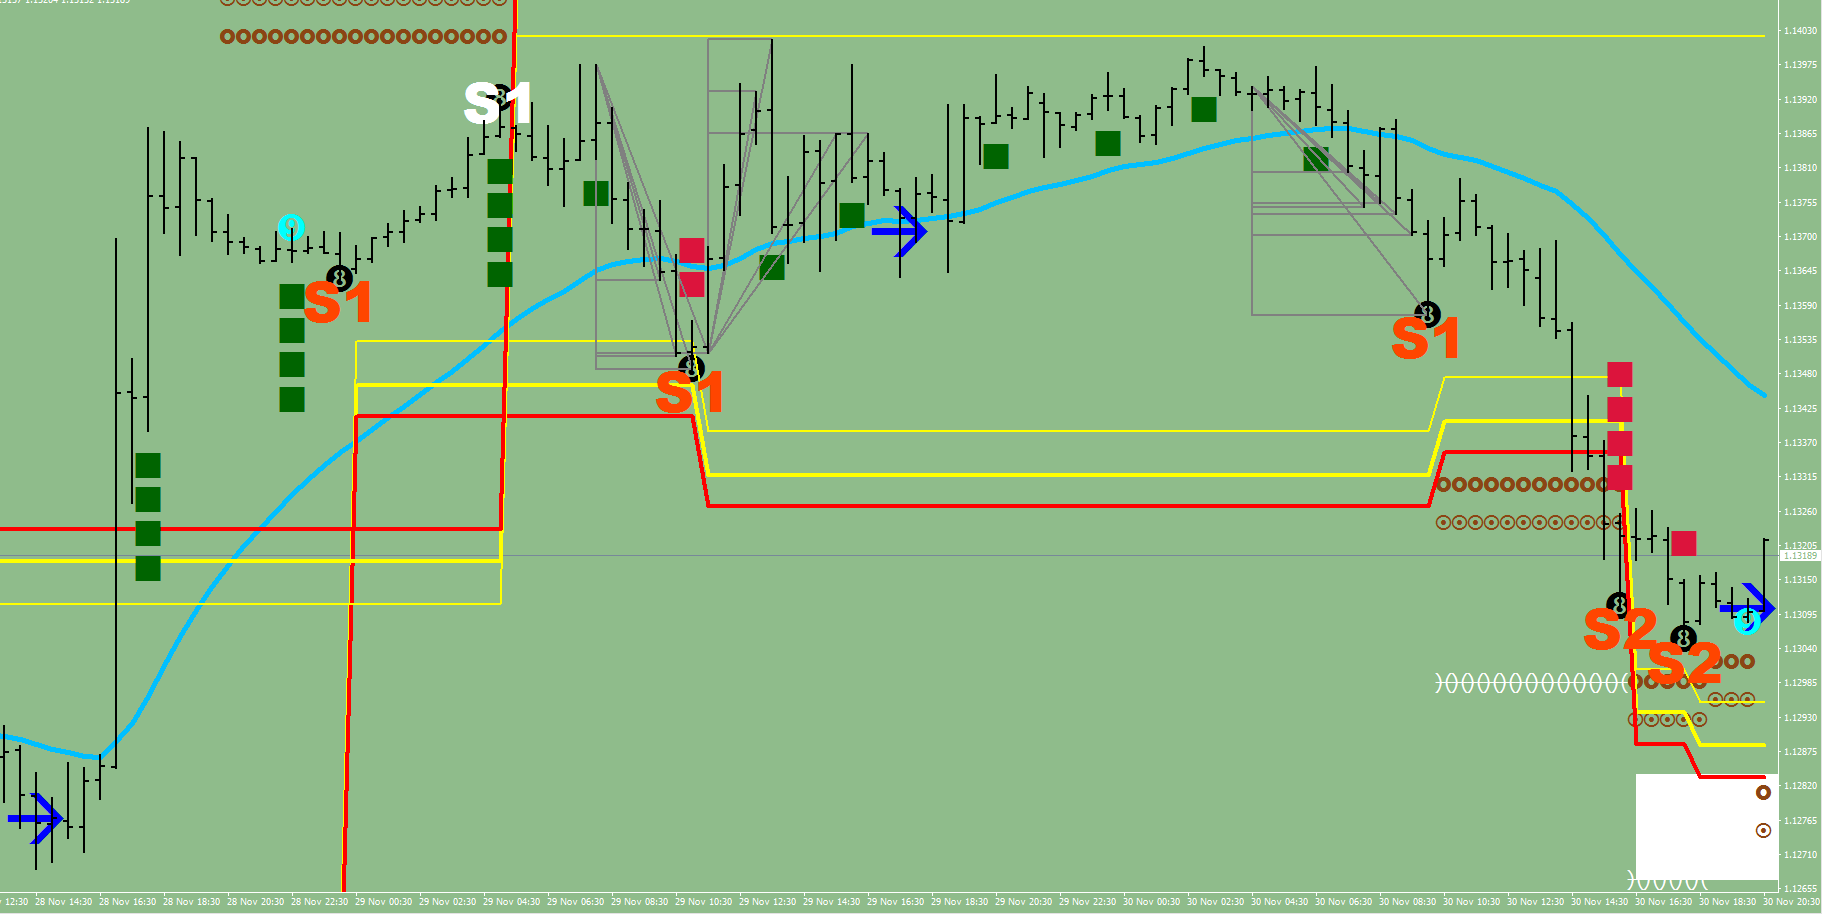
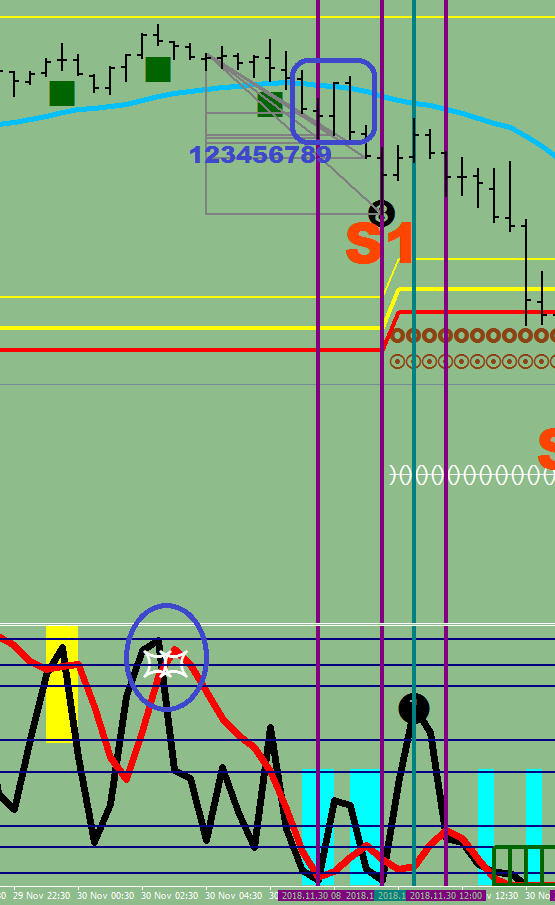
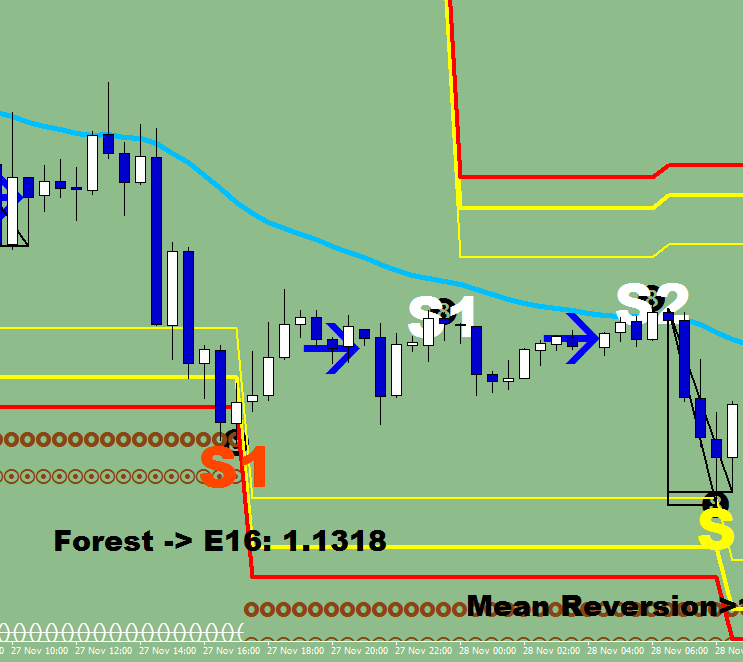
This final image below shows the 2 bounces occurred on the way down, the first, that has a sharpie box high light, was the hedge trade I mentioned above that made a kiss good bye to E-16, and the second bounce – the second sharpie high light – was prompted by the end line (purple) triggered buy box (s1 / support1, s2 / support 2) and was the only move back up that actually made it to a wave status (teal vertical line). It also shows a terminal move line (in black) into the S1 sync low.
(End lines, terminal waves, sharpies and the thick strike out lines are plots of the God Awesome indicator 1.5).
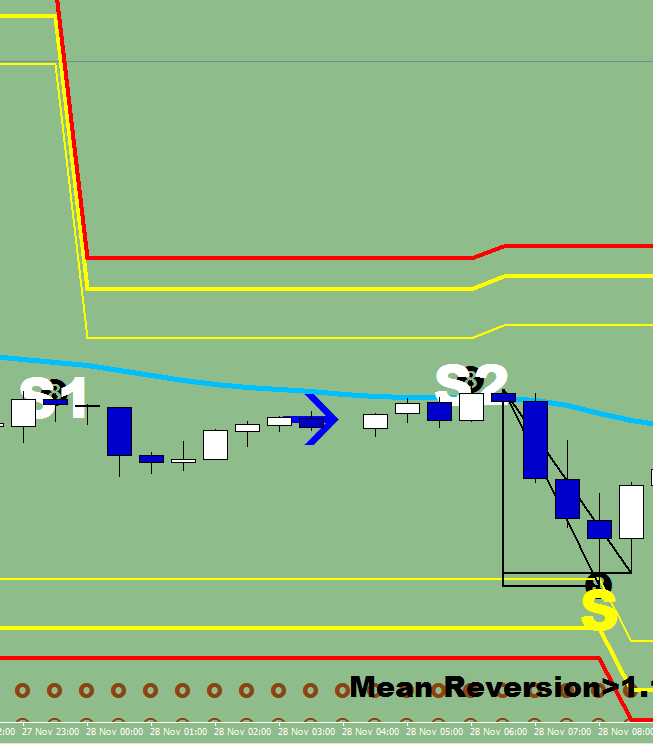
…and the image posted after the last image does show the second terminal wave as well.
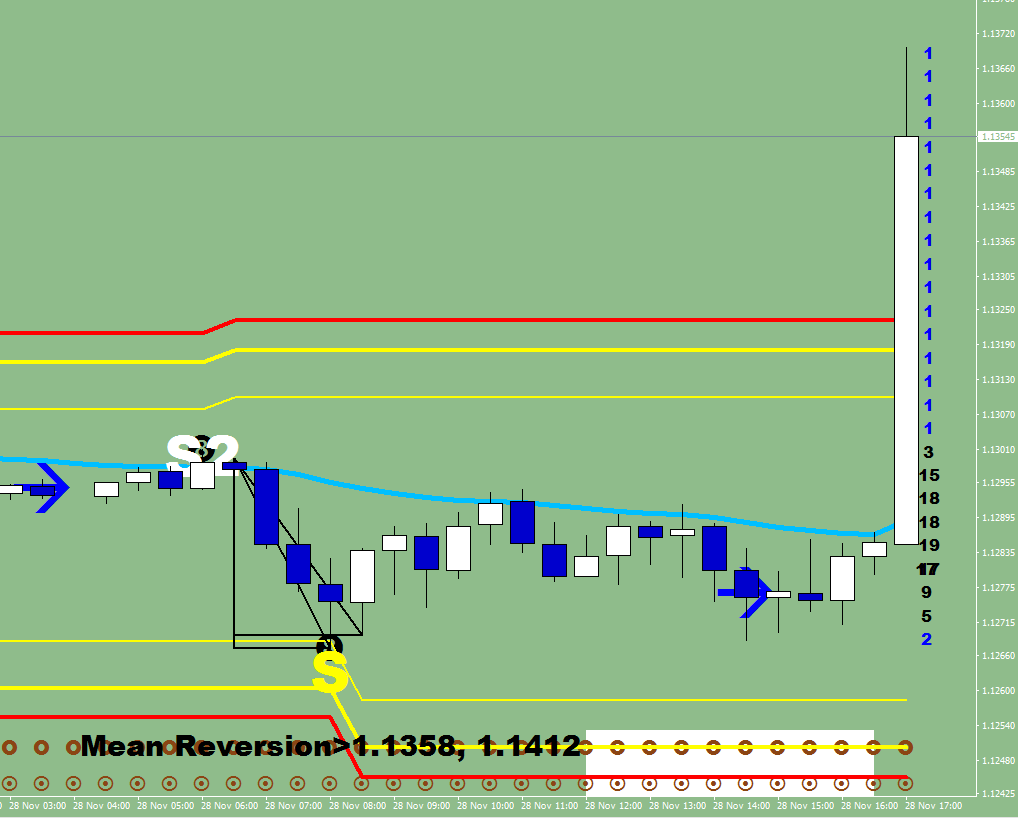
Imagine remembering that the first Forest touch prompts a Forest to E-16 trade, and knowing exactly where the forest is.
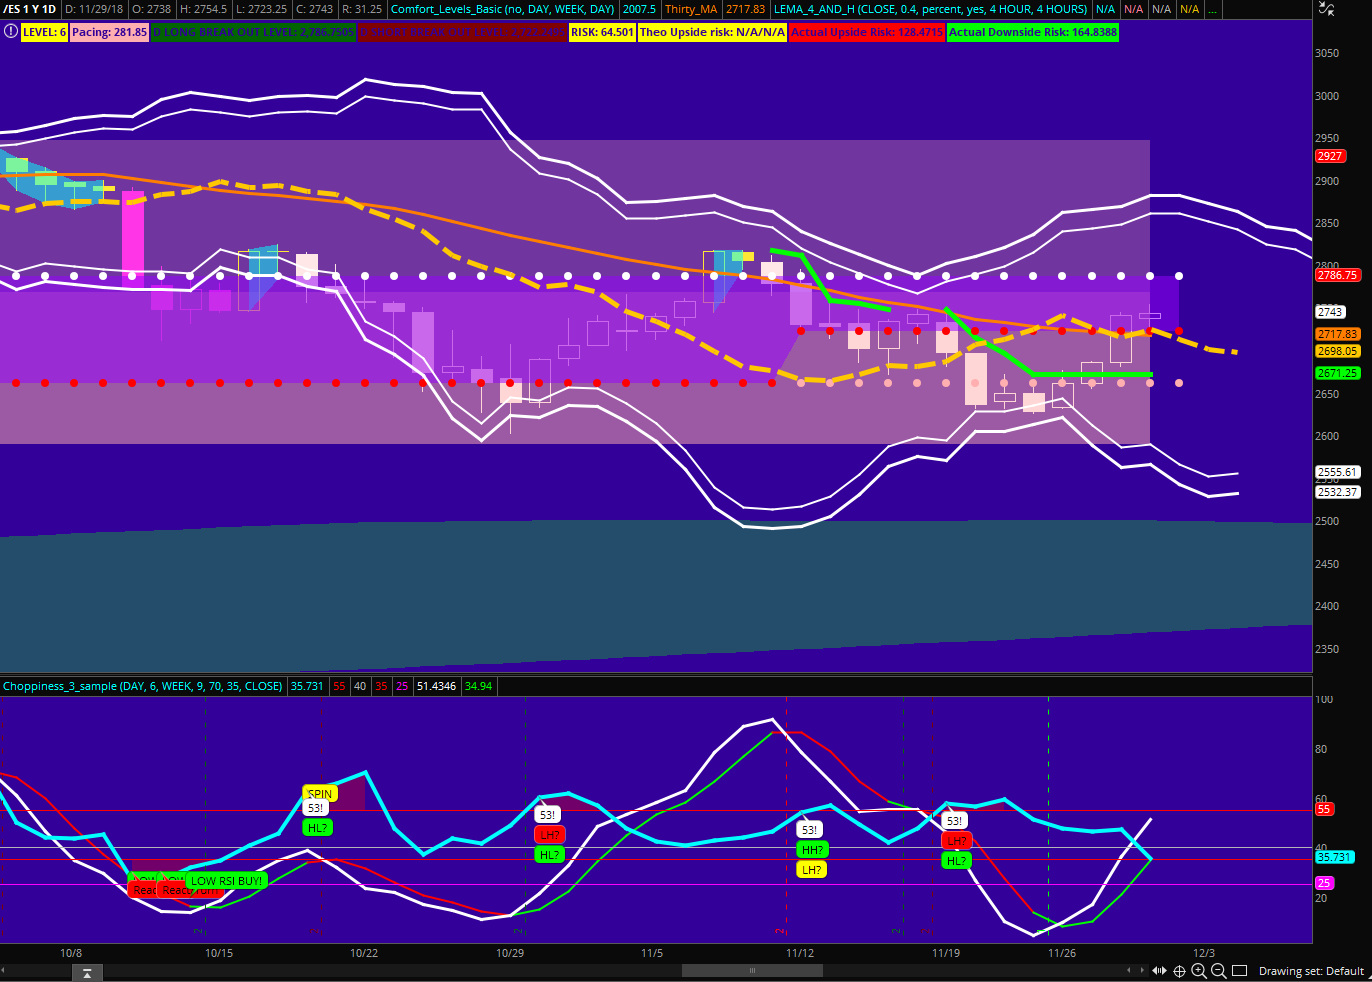
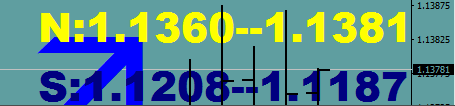
Imagine knowing on the 27th of November, what level to cover the shorts at and go long on the 28th of November.
Imagine having an understanding of the inevitable trade, knowing that the “S” print shall not be exceeded on the downside, and a mean reversion was triggered. No matter what the market does between now and two days from now, the price would have reached the 1st target and is possibly going to exceed the second target as well by a smidge.
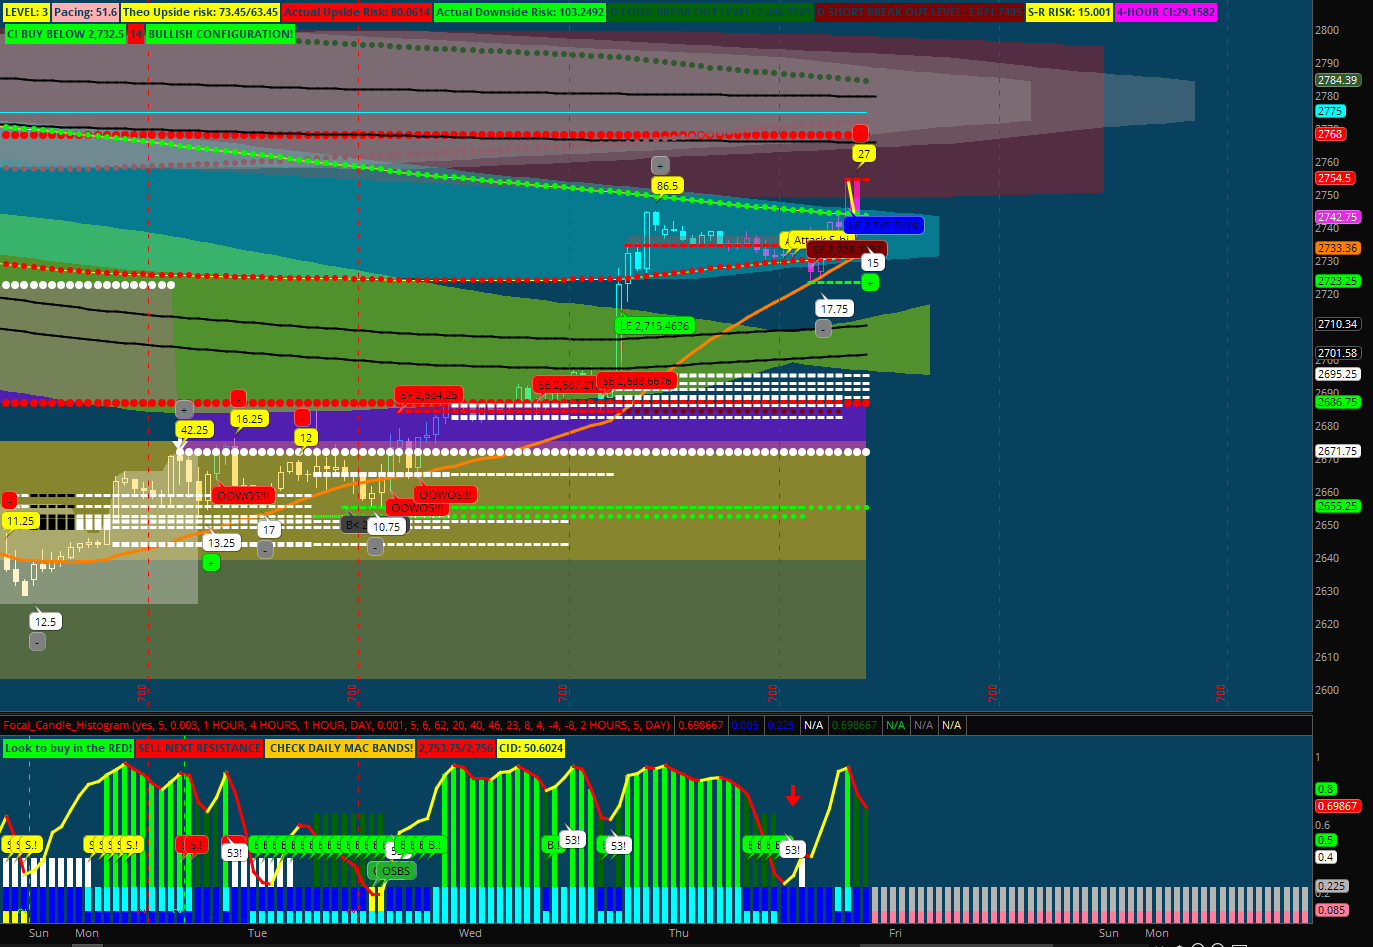
Imagine knowing and remembering how to count to three. And not forgetting to load up the wagon around the “Sync” low.
Imagine having the whole thing play out an hour later.
You no longer need to imagine being light years ahead of everyone else out there.
At times out of nostalgia I browse among my older routines for a current back test to see if any of them holds up well in the current environment.
Hundreds of ideas came and went, but some were on cue all along. I used to have a chess team with not much in common but the idea to exploit an edge.
Now I am thinking more of in terms of a complete, well rounded system, and I expect just as much from the management part as from the “excuses”, the trade initiator routines.
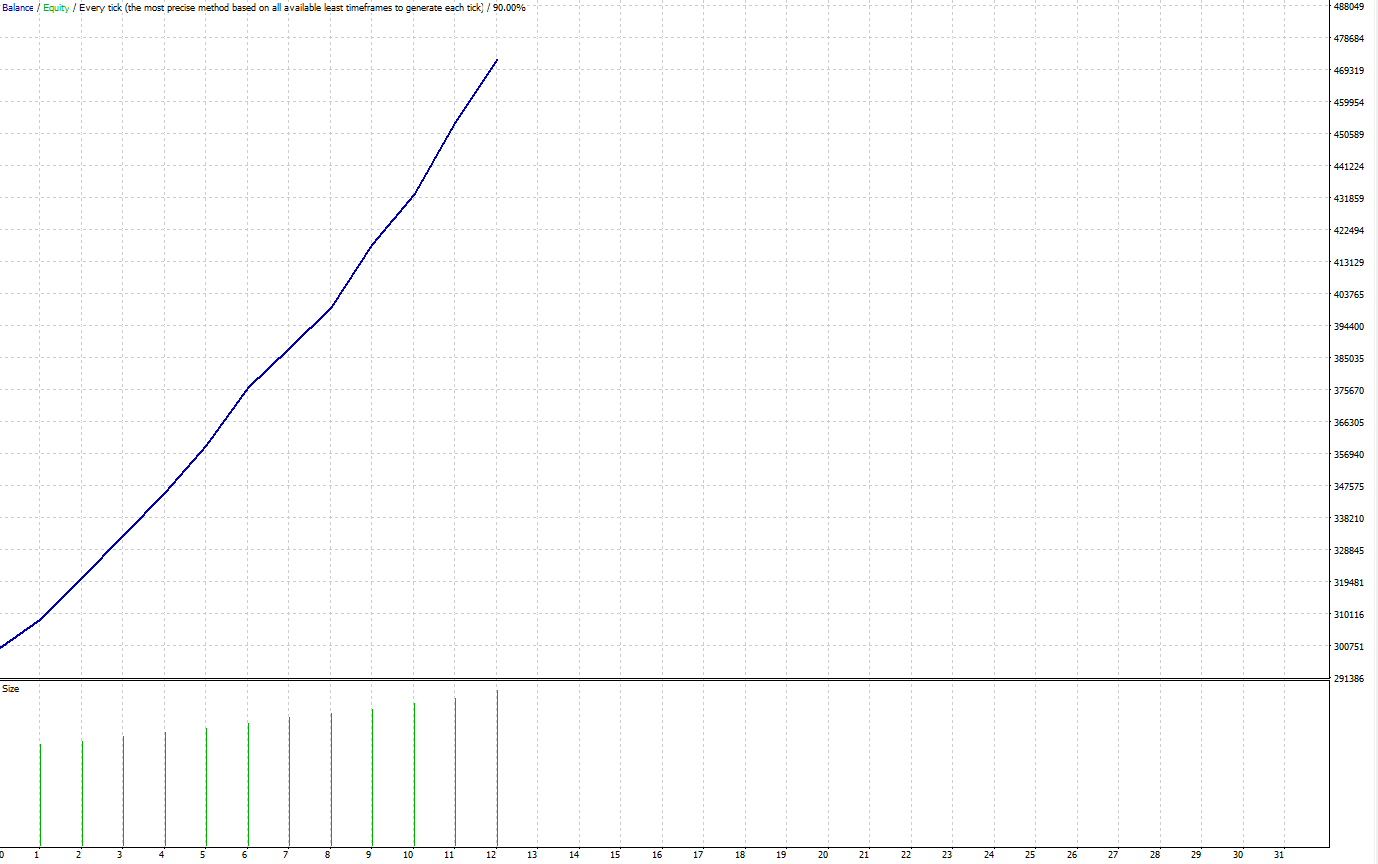
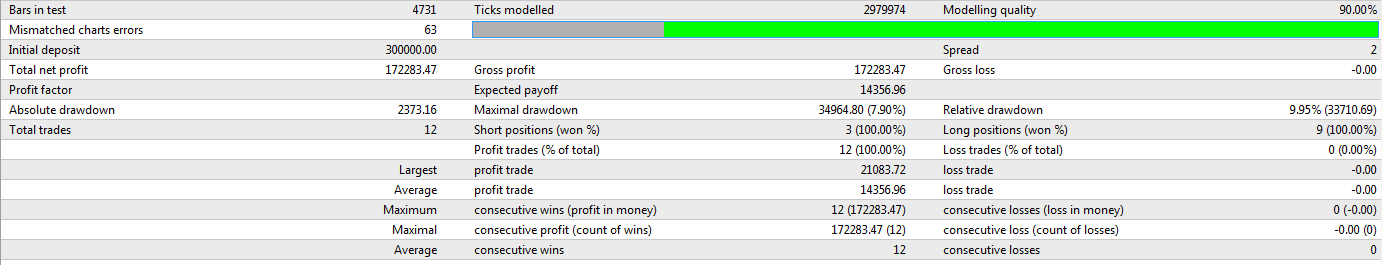
I am happy when I see something with a back test like this:
This is treasure. Something with a great edge. All you need to do is sell instead of buy and vica versa.
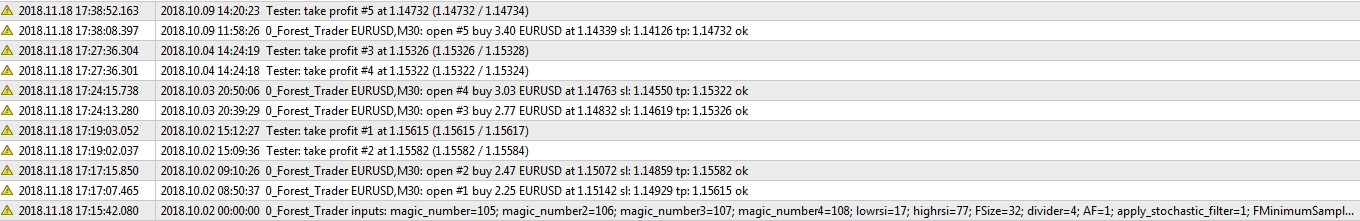
I would like you to follow on my path in redoing the piece of code I have coming up here.
I made a few modifications and this is what I ended up with.
Out of the total, 17 “bad turned good” trades I only lost 5 when I applied one 4-hour filter per direction – to eliminate the losing trades.
Can you do this? Could you even better?
Feel free to show me your insights and your results!
The testing period is from the 1st of October, 2018 to the 25th of November, 2018. Tested on EUR/USD with 2 points average spread.
if (OrderSelect(i, SELECT_BY_POS)) if (OrderMagicNumber() == magic_number) { order_type = OrderType(); if (order_type == ORDER_TYPE_SELL_STOP) { if ((NormalizeDouble(OrderOpenPrice(), Digits) != open_price) || (NormalizeDouble(OrderStopLoss(), Digits) != stop_loss_price) || (NormalizeDouble(OrderTakeProfit(), Digits) != take_profit_price)) { if (!OrderModify(OrderTicket(), open_price, stop_loss_price, take_profit_price, OrderExpiration())) Print(“Error: “, ErrorDescription(_LastError));
} break; } else if (order_type == ORDER_TYPE_SELL) break; } if (i < 0) if (OrderSend(symbol, OP_SELLSTOP, longsize, open_price, 3, stop_loss_price, take_profit_price, magic_number+” I.T. SSTP “, magic_number) < 0)
Print(“Error: “, ErrorDescription(_LastError)); } else for (i = OrdersTotal() – 1; i >= 0; i–) if (TimeCurrent()-OrderOpenTime()>=ClosePendingInSeconds) if (OrderSelect(i, SELECT_BY_POS)) if (OrderMagicNumber() == magic_number) // if (OrderType() == ORDER_TYPE_BUY_LIMIT) if (!OrderDelete(OrderTicket())) Print(“Error: “, ErrorDescription(_LastError));
The need of hedging comes from the presence of human error.
Human error is for instance opening a position without a reason, not having / eliminating stop losses, and you cannot blame an EA for opening a trade at the wrong place/ time, only the maker who failed to factor in all possibilities and failed to include / find the necessary / right filters.
I have started a video series on hedging, called 4-step Auto Hedging in Forex.
In my opinion, there are three different hedging systems, and they all have their use.
1. Ratio Hedging
The fore-mentioned videos talk about a 4-step hedging system that is meant to prevent you from the equity/balance ratio dropping below a certain level. The weakness of ratio hedging is that it only relies on the equity drop and does not consider other factors, so you may end up with a hedge at a wrong place/time especially when you are opening larger sizes that you may be tempted for especially when having larger leverage at your disposal. The 4 steps as a reminder are: 33% hedge (the rope trade), 5% equity drop later 1/2 hedge, 5% equity drop later overhedge, and if for some reason push comes to shove, 5% later a full hedge gets clicked on – after which manual close outs mean the resolution.
2. Break Out Hedging
Break out hedging may be too far out to be accommodating, and would not eliminate the possibility of a margin call. This is where my good old, “re-calculate needed size, post pending order, wait, delete order” sequence can be utilized. To not be allocating to much bandwidth, it is sensible to to only start posting orders when price is within stone throw distance. I use my Forest model for this kind of hedging which by now includes the hedging line. This, roll-out, automatic hedging can be done with over size as well, and the routines can close out the hedges when the next mile stone was made.
3. Proactive hedging
I know, all hedging genders are proactive, they try to prevent from losses, but this particular kind is the early bird of the tree. If you were a human, this would be your place to chip in. The opened hedge sizes do not exceed the open position sizes (in the opposite direction), so if nothing is open, nothing happens. Since there is a place and a need to catering for the trading robots, Humanitica would have to define for the human what he/she is allowed to do in order not to cause any harm to the robots and the account balance. A lot of the human role can and should be handed over to the Human-Substitute Bots, for a human is not capable to carry out a 24-hour service, nor can they make emotionless judgements. Yet, they must be trained in order to aid their chances of survival.
Well, would had been if I did not touch the phone all day.
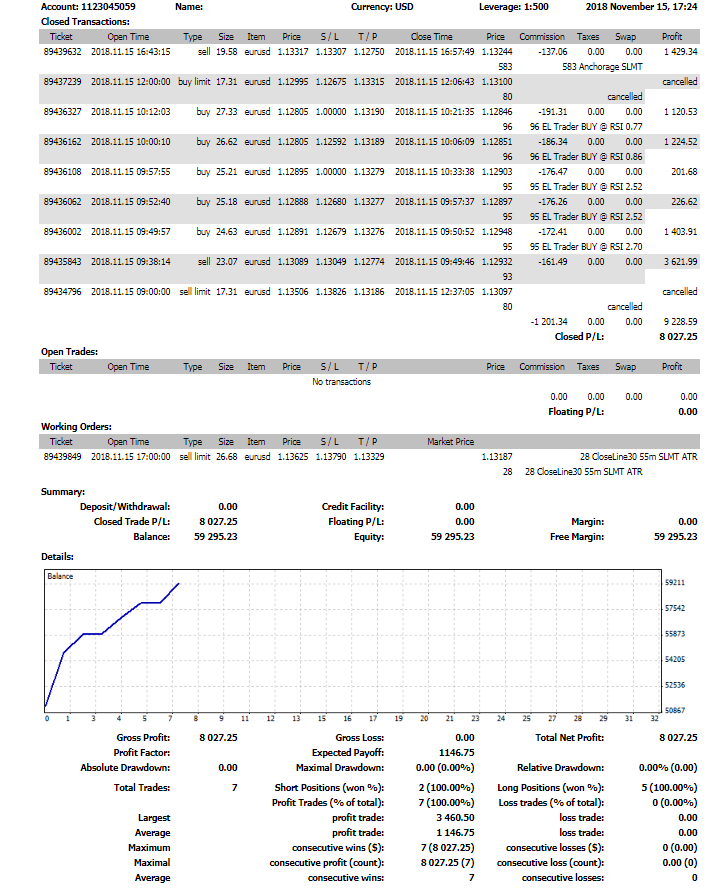
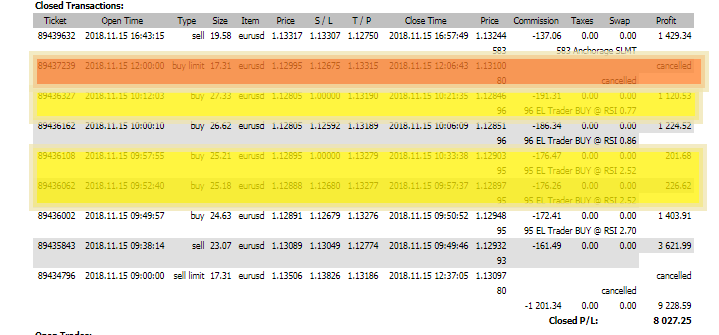
Here is how it shaped up after all:
Yeah, this is only 15.65%, I am fully aware.
I cancelled 4 trades.
The orange, buy limit would had been cropped at 2.5% gains potentially, if I did not touch it.
The next yellow box, the 96 EL potentially would had made it to 7% gains, for it is a high privilege trade, just like the first trade of the day was with “93” magic number (my weight breaker routine).
The other two yellow – at least one of those should had made it to the 2.5% crop.
I left 12% on the table due to having a cell phone at my disposal and too much time to interfere unnecessarily.
There were no trades opened manually, and none of the stop losses were danger of being hit.