Today we are talking about a global warning and what is beyond infinity.
I would suggest to start keeping an eye out for the following vista:
3x shy aka triple X. Particularly lethal mountain combination in an embedded market. Of course, if you are a price action trader, you don’t need this kind of a help. Just watch out for the side effects!
if (RSI2[i]<RSI2[i+1] && RSI2[i+1]>RSI2[i+2] && RSI2[i+1]<87.5 && RSI2[i+1]>60){
 siscounter = 1;
 j=i+2;
 while (j<i+12){
   if (RSI2[j]<8) break;
   if (RSI2[j]>87.5) break;
   if (RSI2[j]<RSI2[j+1] && RSI2[j+1]>RSI2[j+2] && RSI2[j+1]<87.5 && RSI2[j+1]>60) {siscounter++; j=j+3;}
   j++;
 }
 if (siscounter==3 && (RSI2[j+2]>87.5 || RSI2[j+3]>87.5 || RSI2[j+4]>87.5)){
Which of the following lines above is making sure, that this triplet does not get picked up as a Tripoli below?
What you are looking at here is opening sells into strength way ahead of the CPI (positioning). What you need to understand is that there was going to be selling regardless of what the actual news / reading would turn out to be. Then they would start adding to their holdings as the sheeple (Johhny Come Earlies) were going short dxy hearing aboit the record level of inflation.
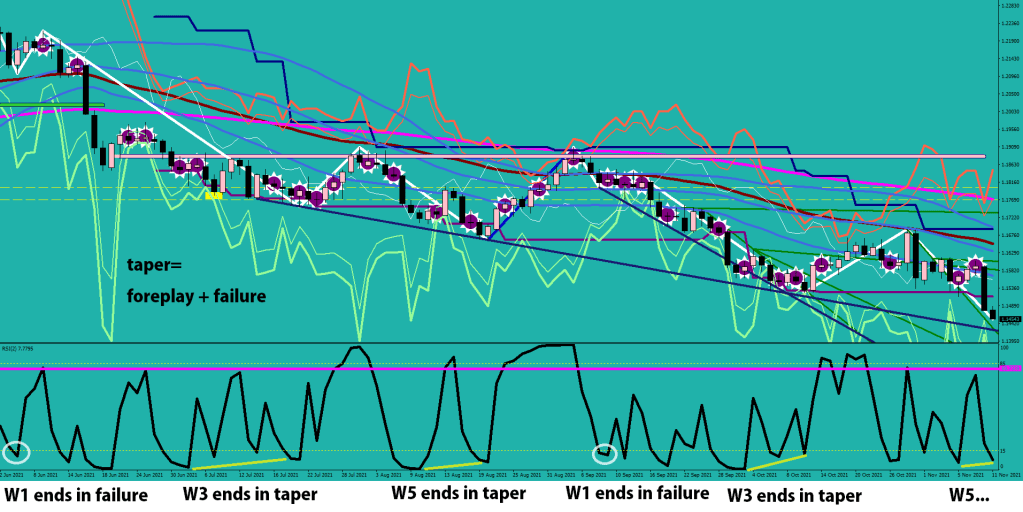
I certainly had an issue with the looks of the last leg down. It did not bear signs of tapering on the daily chart.
Wave 5 was always supposed to end in a taper.
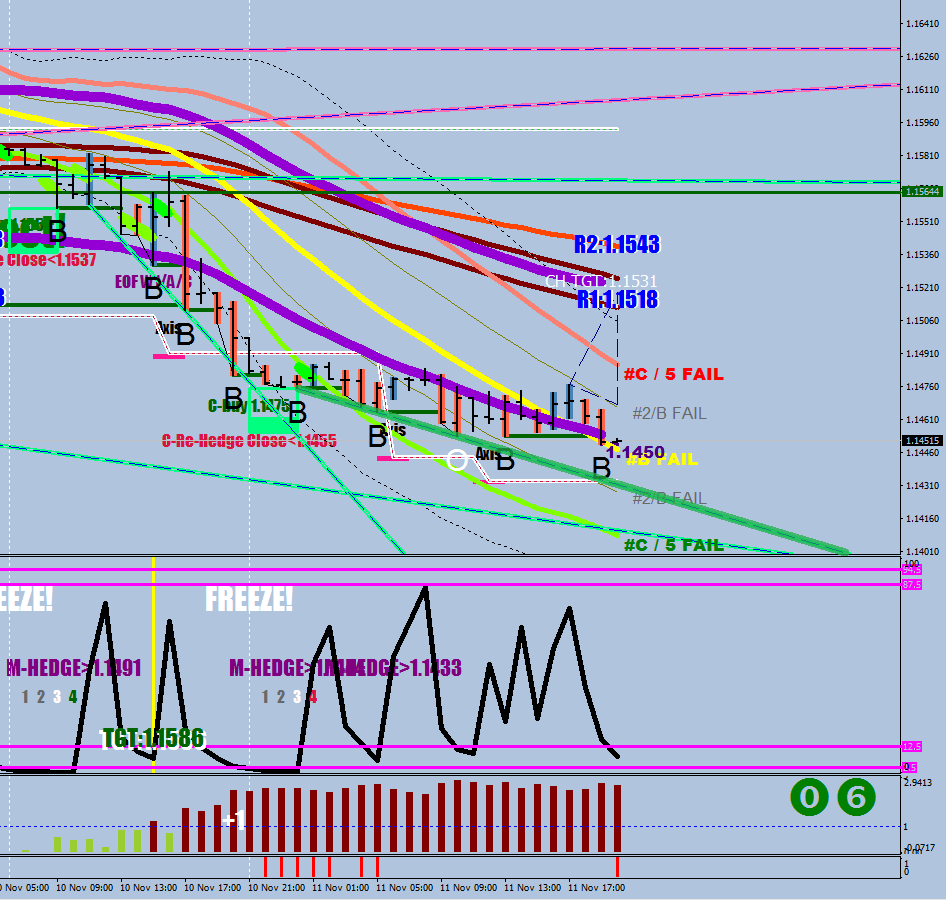
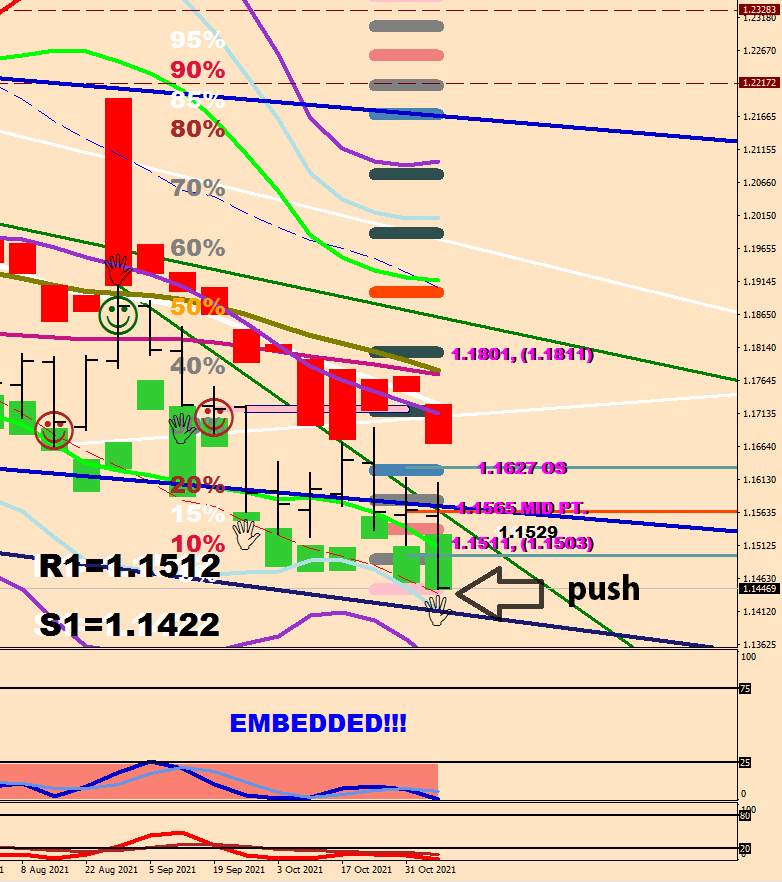
The Mastodon trendline was made. A scare on it or a near miss to end the downside progression would do. We are pushing 3x stretch from the mean (2.9413x)
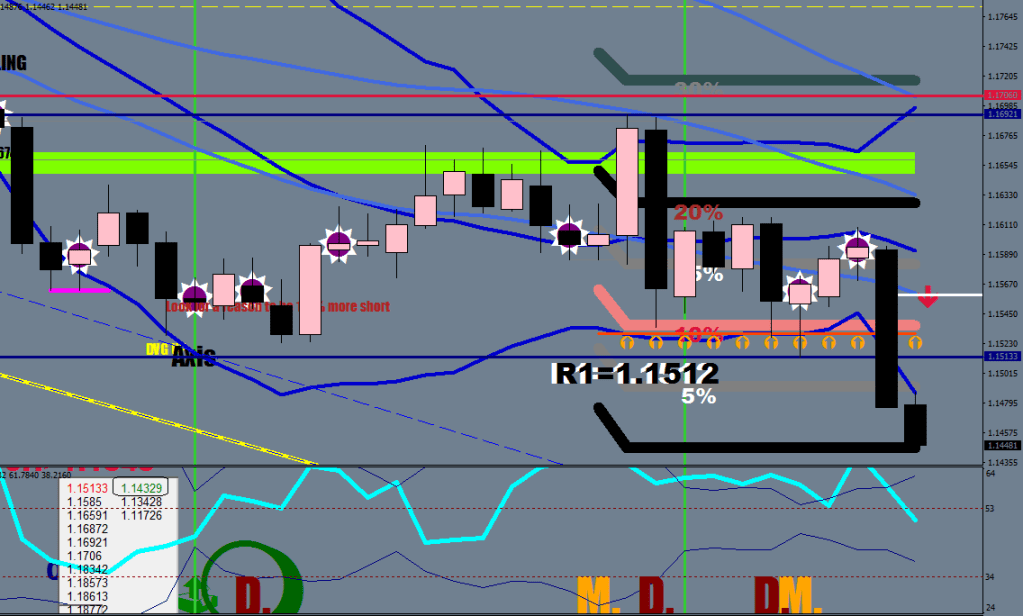
There is a push in progress below 1.1455 pushing the cover zone further out as well as lower the bottom of the range & the oversold neckline. What is not right here is that this move isn’t coming from nearby the reset (E21) and the stochastic is very low / yet still showing a divergence up from the previous swing low. The red interrupted Window Envelope is at 1.1439.
What other targets may be at play here?
The next daily level is 1.14329. Frankly, a scare is good enough.
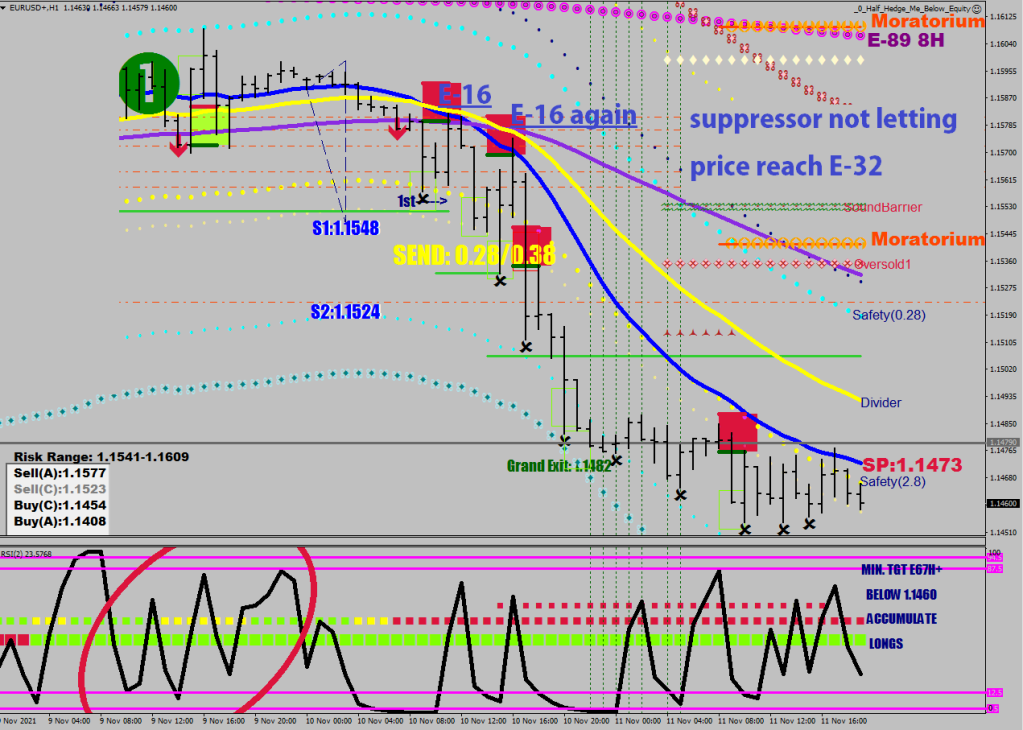
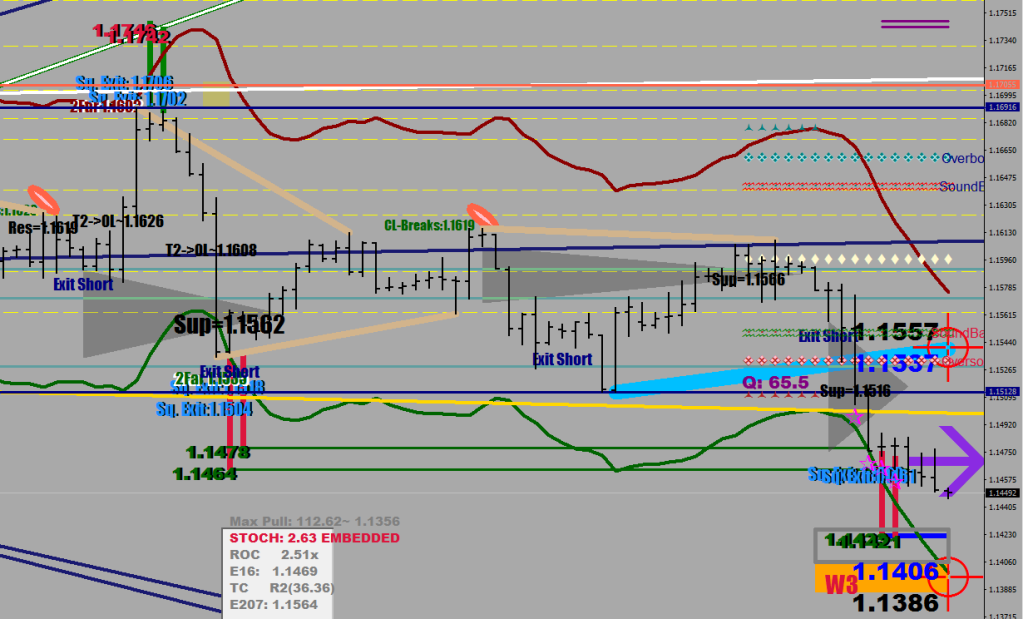
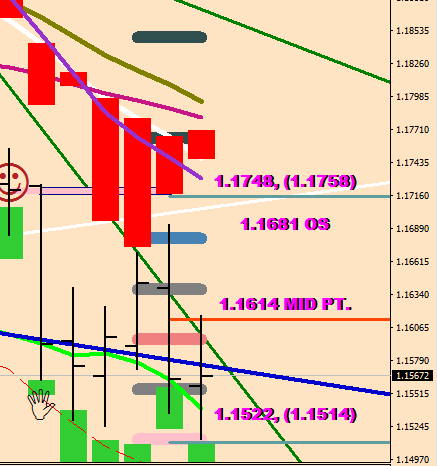
What about the hierarchy mentioned in the last entry? The first image shows the scare on the Overdrive line, it’s called “Grand Exit”.
The overdrive itself is a 2×2 Fluctuation Maximum displacement of the E-32. Cca 83.6 pips.
The projected distance call made by the A leg down has received its follow through by making a beat beyond 1.1464.
The current projection made by Wave C is meaningless, just attests to strength having transpired.
I’m about to teach you the hierarchy of fading targets.
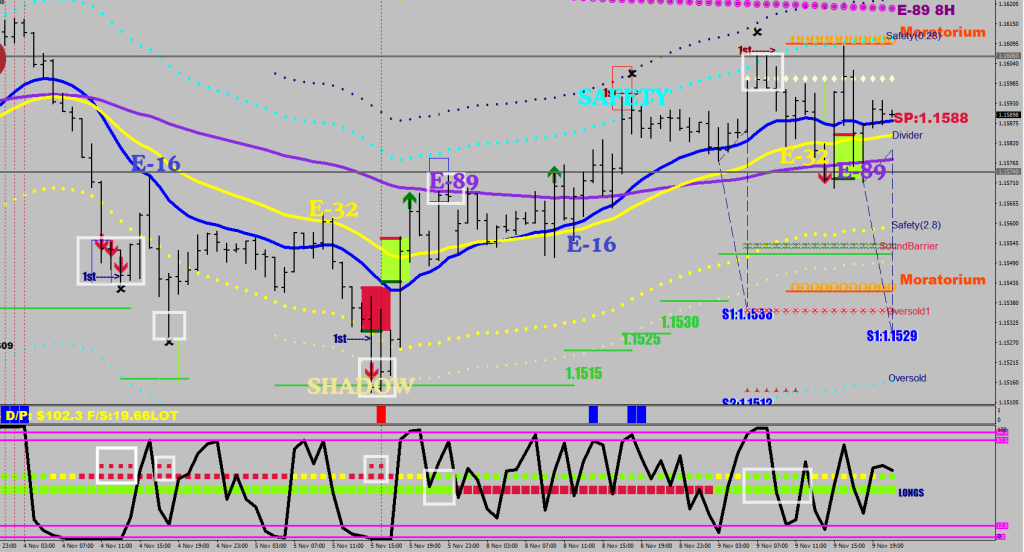
E16, E32, E89, safety, (shadow)
There, that was my quickest lesson ever.
We listen to what Scott Barkley says, and we give consideration to his words, but we keep our opinion to ourselves: “it does not worth for banks to make a move smaller than 55 pips”.
We listen to what Macdulio says about the Eur/Usd’s daily volatility and store in the back of your mind that this instrument 80% of the time would average 80% of 80 pips (yet another Fibonacci number).
So now you should have a sense of what pip size to aim for given that you are not likely to get the top and the bottom of the day with your entries and exits.
We are going to use the signals of the Holy Graph in combination with the Stochastic Bars Hybrid to get the entries right.
3 of the 5 exits are easy to plot.
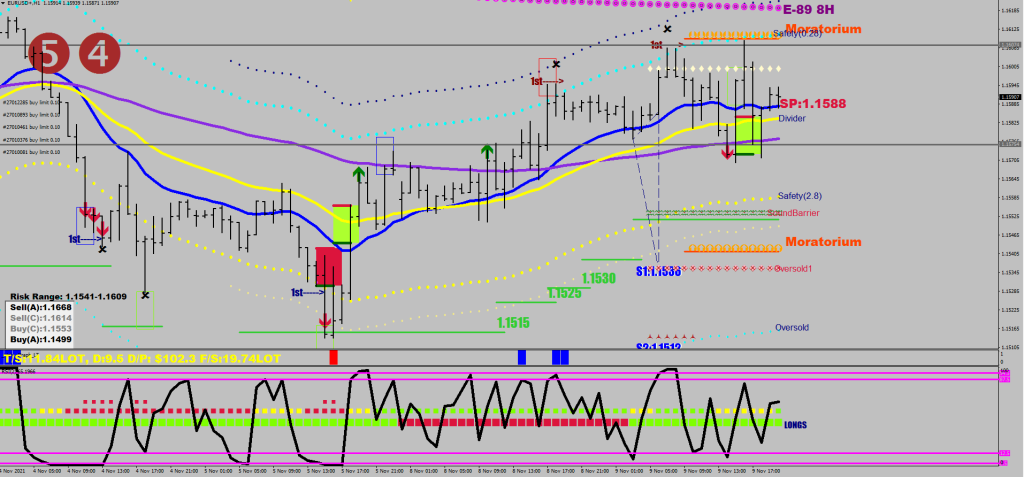
E-16 HL2 (the Suppressor) is in Blue
E-32 HL2 (the Divider) is in Yellow
and E-89 HL2 (Leon, the Pro) is in Indigo
The Safety lines are 28-pip displacements of the E-32, so you would need a routine to plot these
and the Shadow lines are an additional 10 pips further away
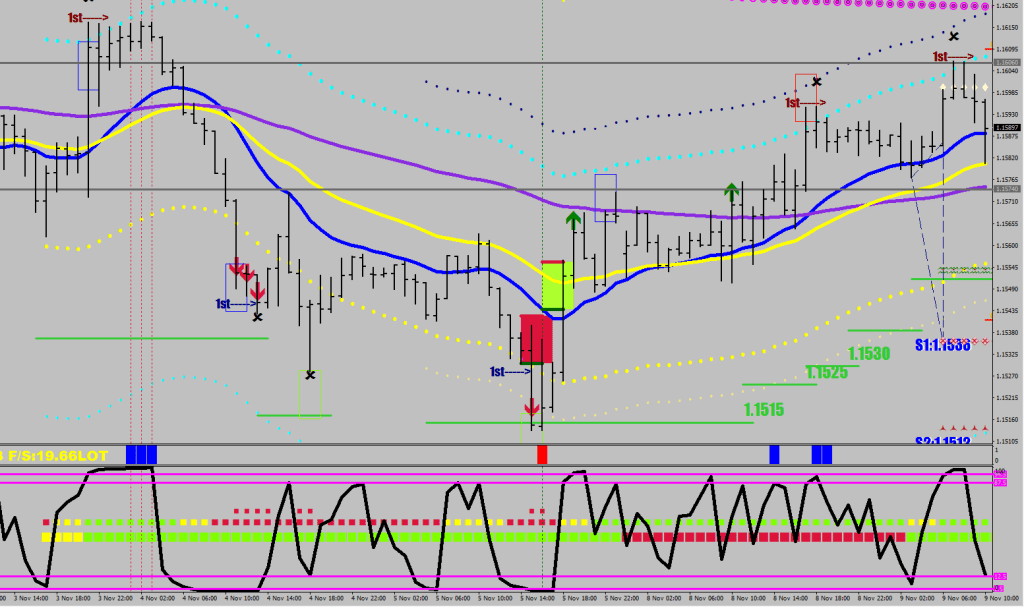
So here is the LT (lieutenant) version of the Holy Graph. It was dumbed down a bit (less cluttered).
Yes, I left in the Forest, the 4H overbought / oversold levels, and a bunch of other stuff. You only need to pay attention to the dotted lines, the moving averages and the 3 rows of cubes printed onto the RSI below.
Without going into details about the algo of the large squares (send functions, faith healers, E207 and E67 crosses), here is the plotter of the 3 rows:
The 3rd row is plotted when lows/highs get printed outside the shadow lines.
First, the easiest signals, the instant sells / buys.
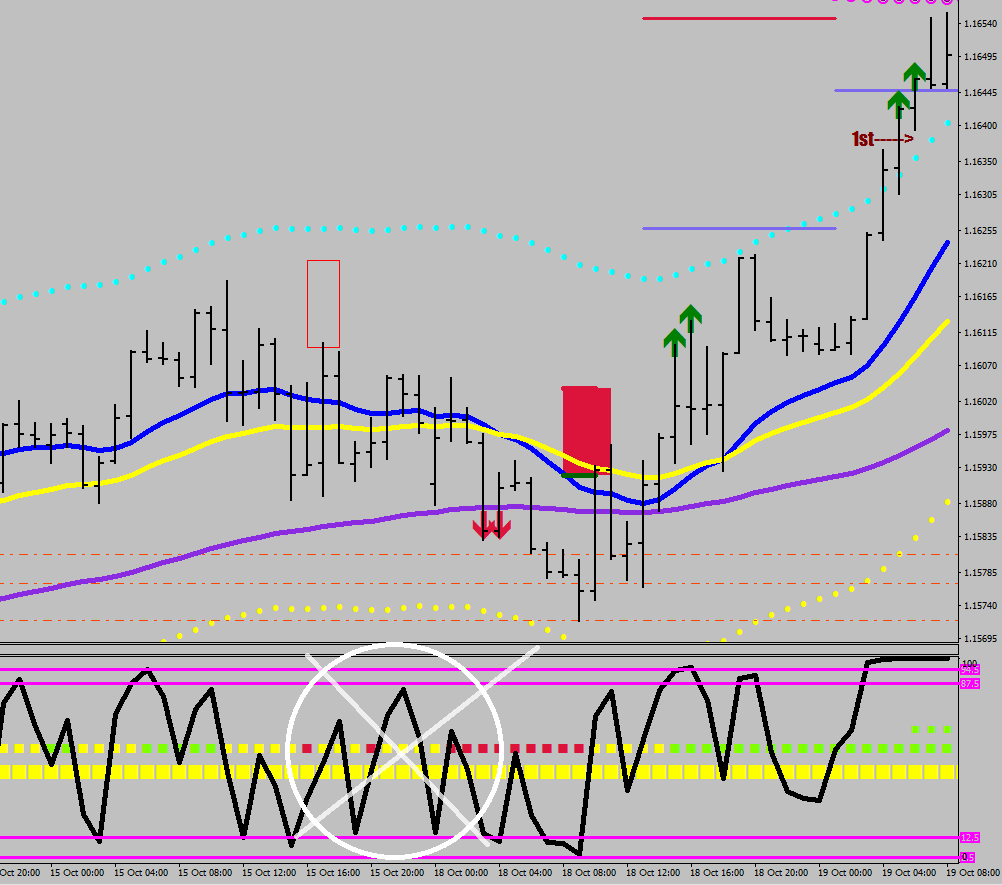
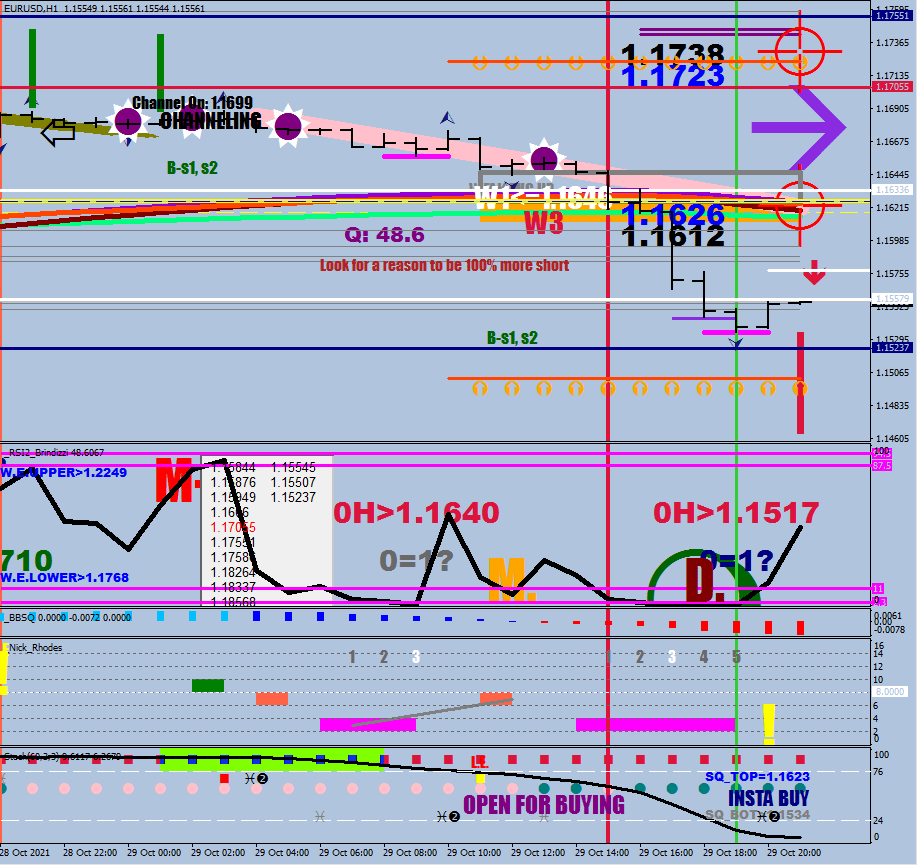
When you have 2 squares of the same color and the Stochastic Bars Hybrid has a corresponding peak signal, that’s an immediate buy/sell signal and the targets are the safety and the shadow lines at the opposite end (vertical lines).
Now, pay attention to the double reds and double greens.
These white blocks highlight a swing low / swing high.
Your job as a trader to put out pending orders beyond the qualified swing as follows.
Say you trade 10 lots.
For the next 10 pips, you put out 1 lot each.
Target the next support based on the shown hierarchy.
I made my choice long time ago to trade like the house. This does not allow for stop losses. I have targeting, trail stop and hedging for alternatives.
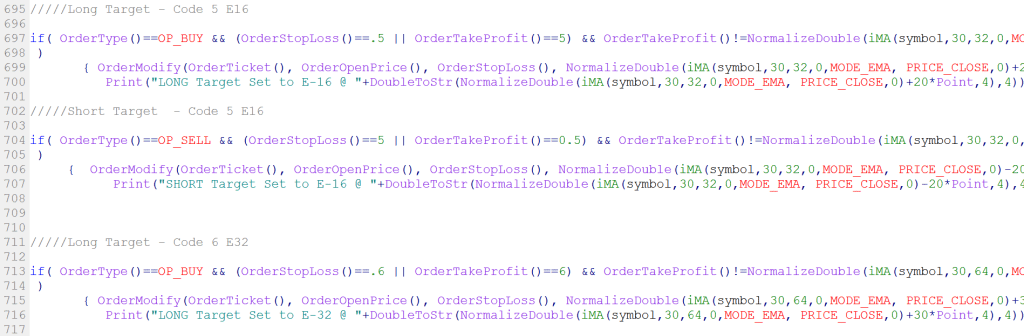
This is how my trail stop routine adjusts the target of a Code 5, Code 6, Code 9 etc open position.
The world’s history is made up of venture capitalists and thieves.
Everyone knows the name of Bill Gates. He holds the patent for the MS Dos, the very foundation of Microsoft because he… coded it? Nope.
Everyone knows the name of Steve Jobs, but what did he invent?
Graphic operating system with icons and mouse? Nope. These were the invention of Xerox employees.
What about touch screen, that had to be Jobs, surely?!
Jobs was 10 years old then.
Wozniak? Yes, he has beautiful stories of circuit-layout optimization for lowering cost and improving on speed, but nothing falls under the invention category.
One may be patenting something to be able to build a monopoly and capitalize on being in the position of power.
I’m saying these things so that you understand that the world is made up of venture capitalists and thieves. The original inventors die in poverty for the most part and nobody cares to learn their names. In fact, there would be all kind of efforts to erase them from history by some slick capitalist criminals.
In contrast, I know, inventing an indicator does not sound like much. It isn’t normally. Combining existing things, like RSI and Stochastic to a Stochastic RSI I would not call an invention, they are modifications / improvements.
For my Energy Bands however I had to invent new thinking, new math that reverses fractal energy calculation in order to predict future likelihood that can come in handy when determining a wave structure. It is truly something that no one has thought of before, and may never think of even in the future. They are tied to my personal existence. They are an invention.
If you type in Tesla Founders, you get a Venture capitalist listed as the fist one who was only present when the company needed the A-round of financing. History in the re-writing.
The idea behind the high pitched voices here is to remind myself of this finding: a zero print starts an auction, but the auction can be finished an octave higher or lower.
As for the Trading Strategist, he is going to get a short list of exits to have shorten the briefing time for the trader.
In the interim, the Trading Strategist is satisfied about the lower low and the close back above the cover zone, giving his blessing to the bona-fide reversal and reminding the trader to dump the shorts accumulated into the close upon Next Week’s Open.
The Trading Strategist is doubly satisfied because he was expecting this close for the week all along, the “Opex” Friday was a bit of an unknown, but failed to profess anything unexpected.
1st week of November, 2021
& so the exit levels were born
Exit levels

-- Weekly pivot

-- Oversold neckline

-- Oversold neckline


Not embedded, going down

- Beat of last swing low 16-26 pips

-- Push on the upside: 10 pips beyond the previous week's sell zone


Embedded oversold

- Beat of last swing low; if it exceeded the envelope, the beat can be 30-40 pips, if it did not, 2 pips plus


-- Push on the upside: 30-40 pips beyond the previous week's sell zone

--- Continuation entry: hourly triple X


Not embedded, going up

- Beat of last swing low 20-30 pips

-- Push on the downside: 10 pips beyond the previous week's buy zone


Embedded overbought with the weekly low outside the envelope

- Beat of last swing high by 90 pips


Embedded overbought


- Beat of last swing high; if it exceeded the envelope, the beat can be 35 pips, if it did not, 10 pips plus


-- Push on the downside: 30-40 pips beyond the previous week's buy zone

--- Continuation entry: hourly triple X
A few things I had to jot down for future use / reference.
During embedding 1) push into the opposite zones triggers a new leg 2) a failure at the OS/OB comfort neckline can also trigger a new leg
A leg ends upon 1) failing in the cover zone the previous week (by penetration & close outside) 2) taking out the swing point the next week and closing back beyond the entry end of the current or the previous cover box
Last week’s pivot may be a good location to re-enter
Without embedding
a push followed by a failure in the current weekly box can be the end of a leg if the 18-stoch is oversold/overbought a scare on the 21 EMA is a continuation entry
I’m on the record for calling the Mastodon while it was printing.
No chest dangling here, I traded like a biach afterwards.
I went from the initial position of 9 lots long and 10.9 lots short to 9.5 lots long and 7 new lots of shorts by the end of the day, and wasted all of my short prior holdings covering them for chump change, like I always do. Don’t laugh, I only collected $420 today, bringing the month’s total to $5,576.60.
Now, the part where I gain some traction here (perhaps you can too) is drawing conclusions and making the necessary adjustments for the future.
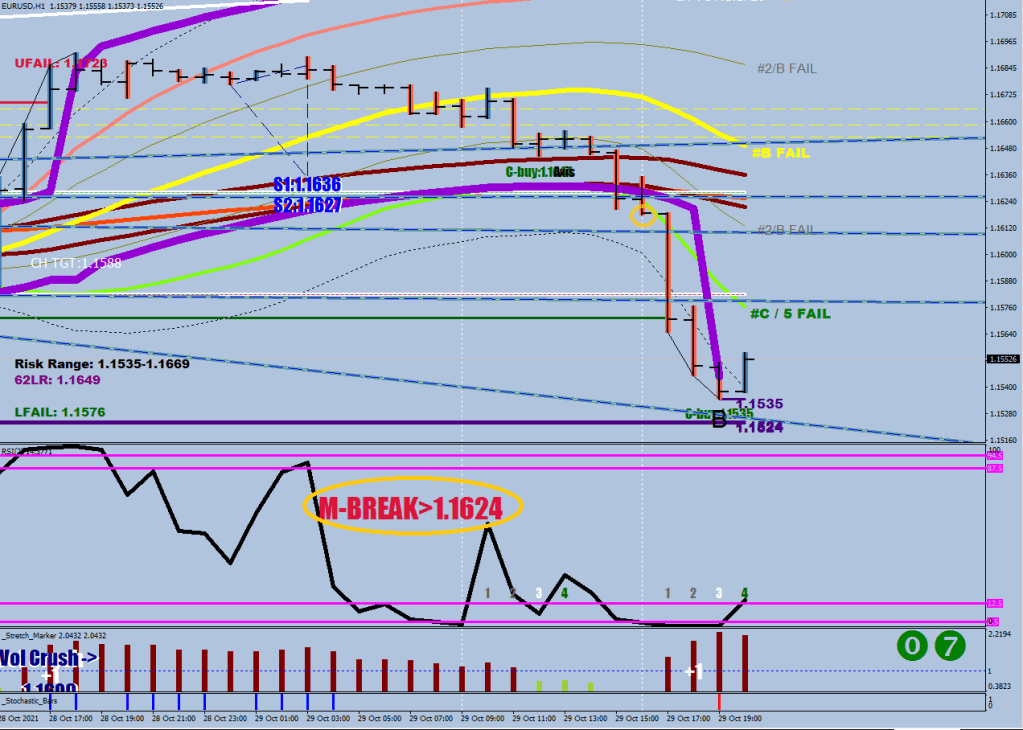
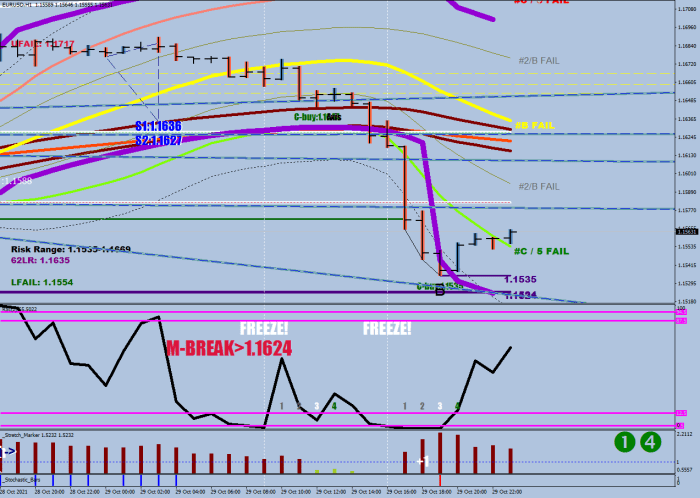
The first miss of the day was not knowing how important a break is at the M print that was not preceded by a zero.
What I already had right was graying out the zero to the downside if it settles above the E-67 band.
The second thing I had to correct was another filter, this time for the Four-counter, which was much too restrictive initially to pick up the second fresh zero-sequence-starter first hour, due to looking for a too high RSI2 reading in the last 10 samples.
if (RSI2[i+1]>2.5 && RSI2[i]<2.5 && RSI2[ArrayMaximum(RSI2,10,i)]>56.5)
          cdncounter[i]=0;
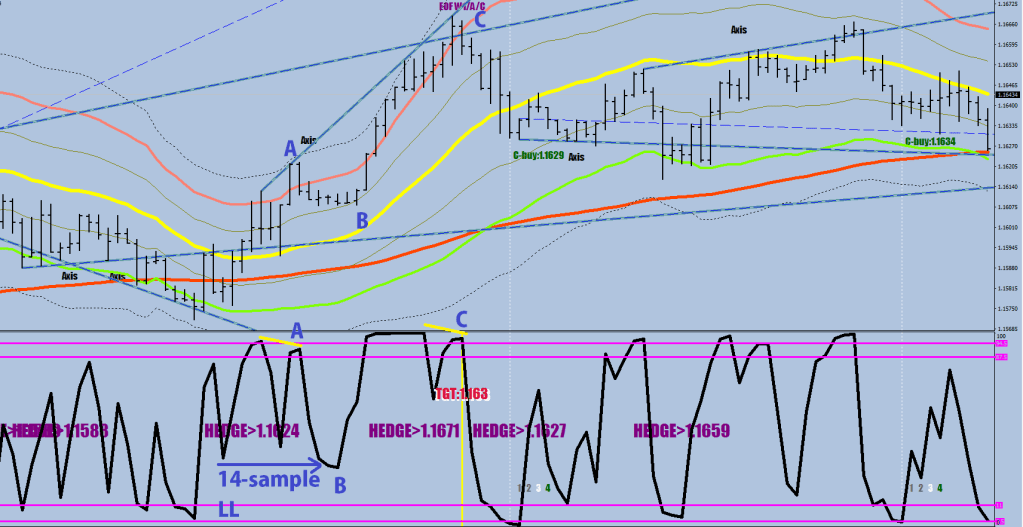
That 4-count is there to remind me of the due inactivity: you need to let the market auction to play out in the following 3 hours, and only name your sell cover after the time was up (C-buy print on the chart.)
Now, let’s concentrate on the ellipses below for a guidance on what may happen next here.
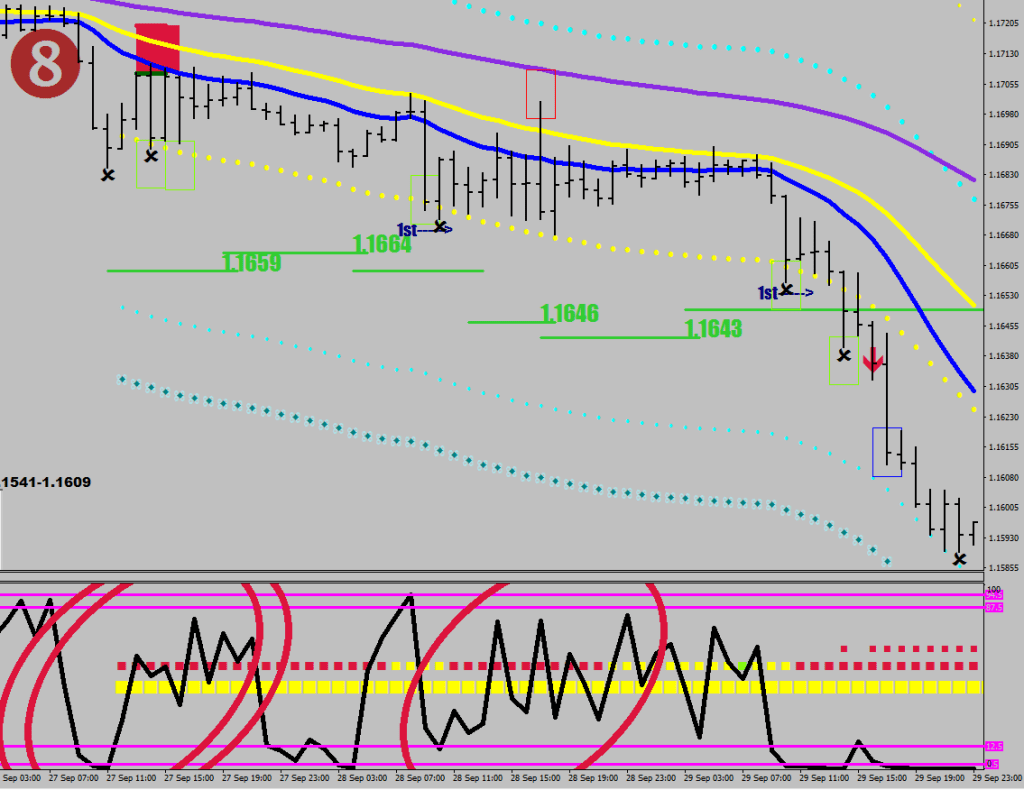
Volatility is rampant currently, one break out occurring after the other – that’s flag #1
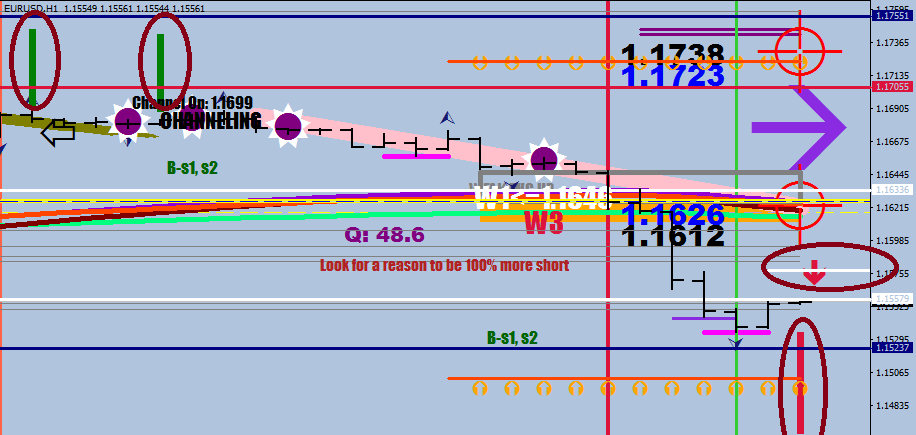
The vertical ellipses are there to call attention to a 4-hour move that comes with 50% increment from an already good sized 4-hour candle.
The point is, the move is deemed significant and receives a projection line. The significant move of course can be at the end of a structure or at the start of it.
In our case, the upside channeling confirmation value was not hit at 1.1699, but the one on the bottom got called in at 1.1580 – the first evidence for further downside to come.
The second evidence is the horizontal ellipse, which is the hotstepper line borrowed from the Energy Bands (proprietary). Being below it is not a good omen.
The third evidence is the strength of the move & the projection down to 1.1462.
The fourth evidence is the impulsive looking wave structure, where the continuation divergence is about to kick in the next wave down.
It looks like wave 4 of Wave 3 is going to end by the close for this week. Wave 4 would only start after the taper of Wave 3 ends, and then there still would have to be a Wave 5.
The fifth element evidence is the sudden pause before the 1.1524 for a consolidation.
The only counter argument here would be a double bottom / higher low – but I do not see any rejection here for now.
Over & out.
The sixth evidence is the strong rejection from the 20% level on the Comfort Levels: you are headed for a lower low, and the window envelope interrupted red would be down around 1.1450 next week.
I created the Price, Method, Techno methodology and trained 100 Billion people I may also have created Insanity with a smidge of Shamwow. Forbes magazine paid me to be on their cover from here on till eternity.
First, price has to magnetically induce magnetism which cteates a total meltdown.
Meanwhile, back in the future we examine the acceleration coil that has been trapping price between the two Mastodons.
ECB policy statement is pending, and you can almost feel the Bollinger Bands tightening around your skin tightly – visually by the rings around the rosary and audibly thanks to Sonic, the hhog.
BBSQ shows the TTM squeeze packing a punch and a half by the submerge below the Keltners.
How to play this?
Clearly a break out trade, but lots of fake outs if you try too close.
This is where I mention about the M-Hedge lines (white combo). They are 20-point displacements of highest high/ lowest low around the M-s. That’s when I would try. Once the trigger level was hit (it is good for a quick scalp) start scaling in to the direction of the breakout in progress; price is not going to be let dipping back in the accelerator range. Stop losses could be made tight.
I would ride the break out until a new Mastodon print appears (RSI2 peak print between 87.5&94.5 or 12.5&2.5).
I should also mention that I made a trail stop option that only starts locking in gains after the RSI2 goes overbought/oversold depending on direction.
Of course, the two magic numbers had to be made exempt for the all of other trail stops.
Let’s refrain from mentioning the lack of refrain in this Meta-verse (pun intended) & let’s go back to buying Teslas by the pair.
I had a headline shuffled in saying that EUR/USD pierced resistance at 1.1655 this morning – I did not ask for this opinion.
First and foremost, don’t listen to news. They serve someone’s purpose. The broker wants you to buy when they know that there is no more upside. Being contrarian may serve you at times, but you will ending up negating things you shouldn’t as well.
The idea is the same as cutting the picture of a Coca Cola into the film roll for seconds, so you only perceive it subconsciously. After a while you start handling things as your own facts, no matter who put them in your head.
Now, for the technical part: resistance by what standards?
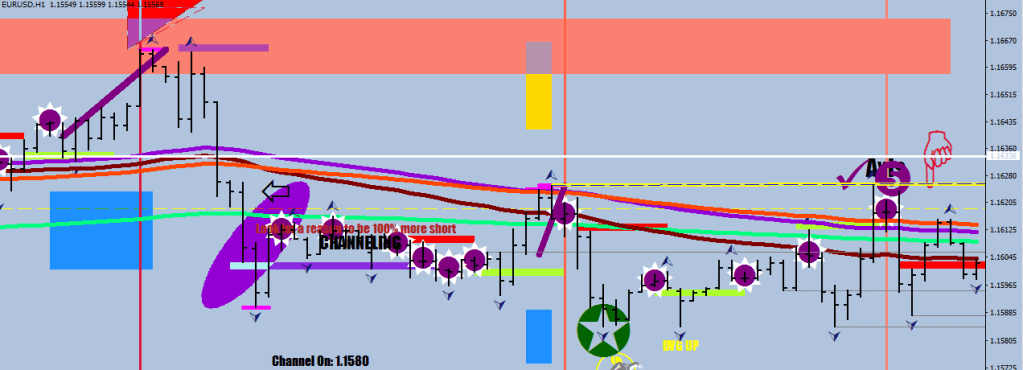
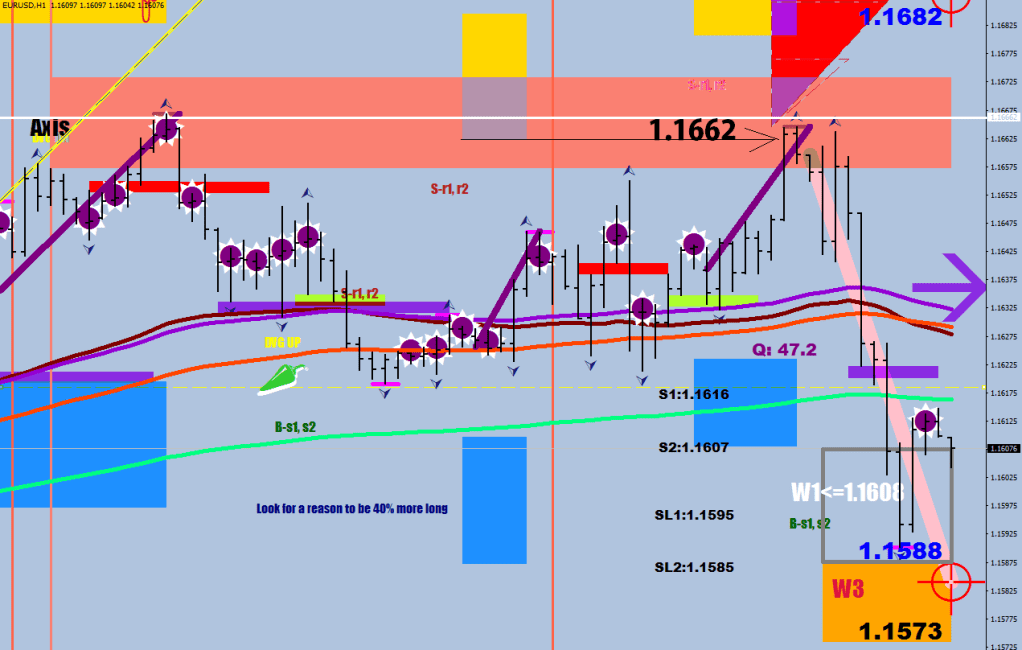
There is no such thing as objective resistance. The 16-pip wide (1/2 fulctuation-size) salmon box due to an RSI2 reversal divergence starting from a new higher high beating the preceeding 26-sample range
The yellow box is due to the presence of the End Line (the purple diagonal), which is basically an energy discharge notification (CI-7 crosses below 51). The box itself is displaced by 16 pips (1/2 fulctuation-size) on the closer end and 1.2x fluctuation size at the further end.
The idea behind these yellow and blue boxes is that you should be fading moves arriving here if they are against the right direction (it went too far in the wrong direction).
Now, which is the right direction?
All comes down to the wave count.
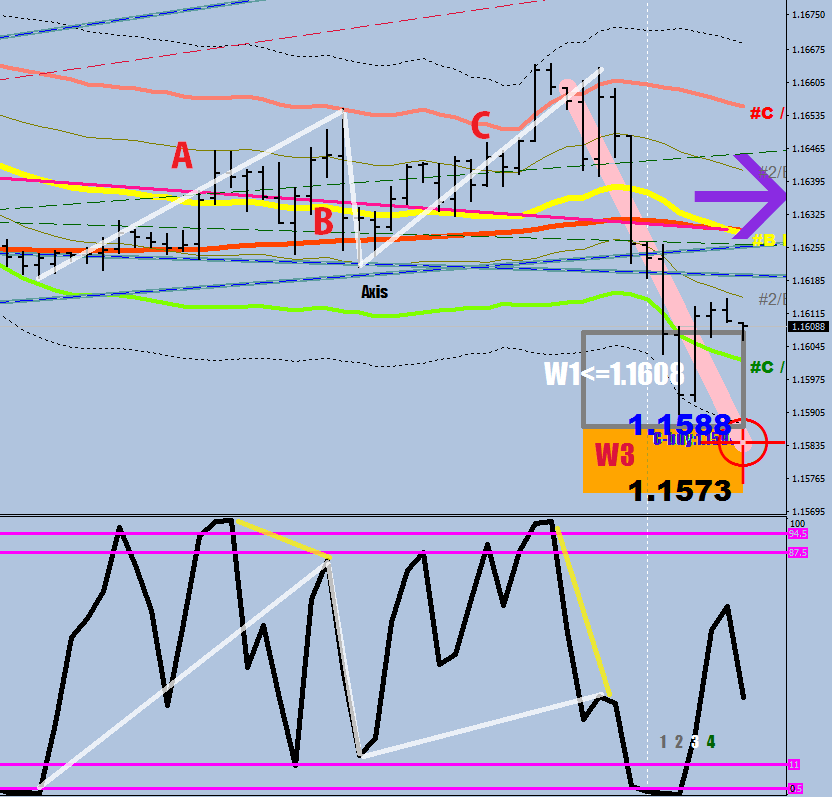
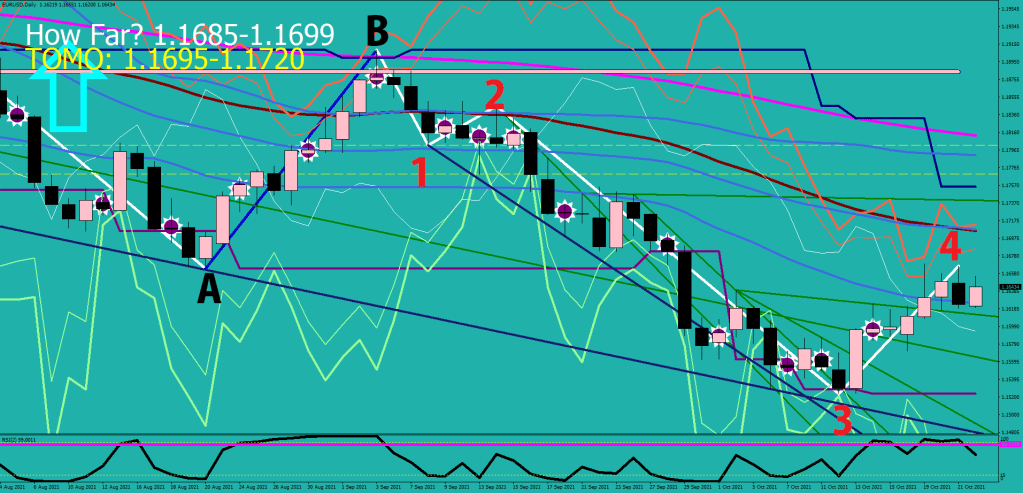
If you just saw an ABC correction to the upside, what do you think is coming next?
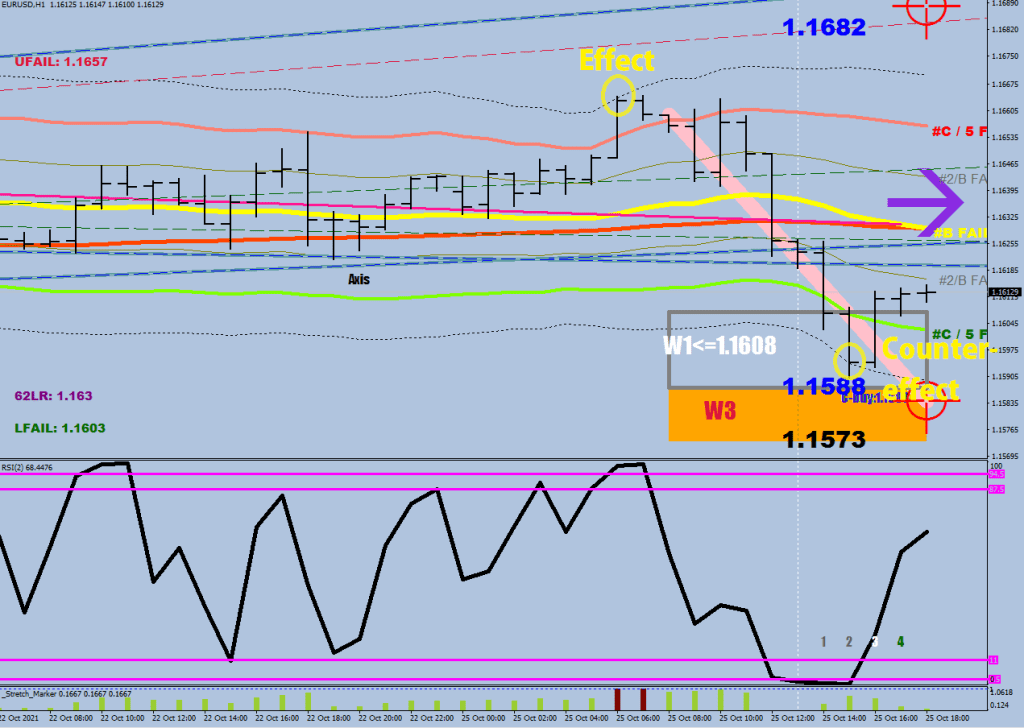
Wave 1, of course. Wave 1 is expected to fall shy from the landing zone of Wave 3 measured by the 15_MIN_ATR_TARGETS routine. As a body insert (label), the core routine was posted here.
Wave 1 is expected to fail before the closer end of the orange box, usually by 20 pips or somewhat less.
The other method is the mirror effect of the pop of the 3 standard deviaton displacement of the 62-sample Linear Regression line (Effect-Counter Effect) – these have al been posted lessons.
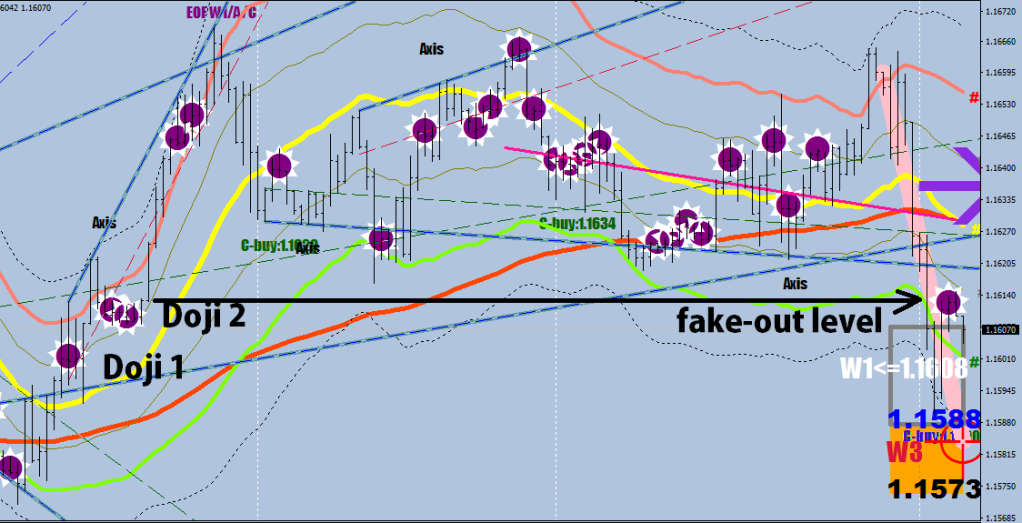
What is the expectation for a Wave 2? Faking out the second Doji by 4-9 pips.
What comes next? Wave 3 to the downside, with the ATR box re-adjusted by consolidation.
Back to Psychology, how many times did you hear Ira Epstein mentioning Fibo Nazis? Zero. His targets are the Bollinger Bands, Window Envelopes and moving averages.
A playlist of David Paul vids, he talks about training CFAs somewhere in these 10-min shorts, and how they are shaking their heads when they hear “Fibonacci”.
I can’t stress enough how important the Wave ID list is that I posted in the Taper Harley entry.
I have a quick tab on my phone to remind me of what I am looking for as an end to the current wave.
Anti Pasta? – Pro Pasta!
Hedging inflation with Crypto is another disaster waiting to happen. A quote from below:
…with all this said, the best formula for calculating S1 is measuring a fluctuation maximum (42 pips) from the last continuation divergence.
There was this rally where you would think it had to be impulsive, because of its powerful nature, and you would put numbers on the waves, and you would be… wrong.
See, my initial reaction was that wave 5 would come next, or wave 5 got somehow absorbed, etc.
The first problem here is that both a Wave A and a Wave 1’s mo was identified as a 0M. Further adding to this was the fact that price crossed over the E-67 band, which would push your thinking more towards a Wave 1.
The third problem was the shallow pullback to 1 sd beyond the 62LR line. Surely that had to be Wave 2 – not.
The fourth problem is looking for an absolute extreme for a Wave B ending instead of a 14-sample lowest low / highest high and that it ended 1sd out, not at the 62LR.
The proper wave count was of course corrective.
C in fact was so powerful, that it blew past the 3-DAY ATR reversal zone of a normal Wave 3, which capped out at 1.1654.
Having a corrective wave structure at hand, your mind can be more relaxed instead of having to anticipate a beat beyond a Wave 5. This ABC was the wave 5. Now we have a missing beat to contend with on the other end, below 1.1524.
By the way, the 4-hour Wave 2 & Wave 4 continuation divergence was picked up correctly by the Overdrive240 routine.
Besides these new findings, now I’m starting to apply the new wave-id principles on the daily chart as well & keep on updating the Wave id list that I posted in my Taper Harley blog entry.
Inflation is always, always a Milton Friedman quote.
Topper Harley
TapperHorst Tappert
What is tapering in trading?
A ends in a 0M at 2sd B ends with single Zero around 62 LR or 1sd, B can be very short C ends with a taper (0M) or a triple M or acceleration (single Zero) at 2sd
A full length ABC takes the 9-sample stoch oversold / overbouģt twice
When an ABC ends with a bang, don’t be rushing in in its original direction Rember, a new serving would only be stopped by a 0M
1 ends with an MD (0M) beyond E-67 2 (rushed) ends with an S at 1 sd 2 (all out) ends with faking out the 2nd doji / 1sd 2 should come back through the far end of E67
3 ends with a taper (pushing back highs sold/lows bought multiple times) likely in the ATR box 4 (rushed) ends with an MD & sets up continuation divergence relative to 2 4 (all out) ends in a 0M by 2st & takes price oversold / overbought twice on stoch 9 4 (absorbed) may not register on the timeframe, but 5 could add on gains beyond what was reasonable from 3 (ATR +30% projection); the result could be short lived
5 ends with a bang – still shy of the record set by 3 (perhaps @ the 2sd failure line), likely with a no break extension
There would be good times coming, where all investments would yield measly returns, and the trader shall be king, so let the good times stroll…
check the close back below the 2sd gold (failure) line close to the top of the hour




















 ForexFore - Internals, indicators, algorithmic trading