To change the way the dice roll, counter directional volatility has to be proven.
Picture an olympic long jump event.
This guy had 3 little wishes, so he has 3 legs.
He starts to run (the drive) then he runs out of breath. They mark up this spot. He runs again whenever he catches his breath. Out of steam, the new outlier spot (fractal) gets marked up as well. They dig a sand box beyond this point. His penalty is having to go back a little again. He gathers all of strength, knowing that now everyone’s watching. He charges, he lifts his feet up in the air and swing’em like he just don”t care. He scores something beyond the 89 yards line (EMA). His penalty for the achieved ovation is that he has to go back to the other side of the arena, and he is being spanked all the way by the thuds and whistles of the cheering crowd.
He scampers on being unable to resist the force until the volume dies down from the deafening degree.
This scampering on is the volatility retribution.
Remarks: the retribution is not a given, but is a likelihood. The 89- yards marker is the key.
The crush in volatility would carry price away from the crowd (207 EMA).
How to play the Retribution trade?
Fade the jump (doc-doc-doctor beat).
Wait for 3 hourly closes back beyond the E89 for confirmation.
Lock in better than break even.
Trail.
Wait for an RSI2 reversal divergence to print. A 99 or 1 print would be the start of the sand box.
Exit scaling out while looking at the divergence unfolding. This jump may be 8-12 pips big, not 28+ like that olympic event was.
At that point the olympic long jumper may get the light on for another attempt.
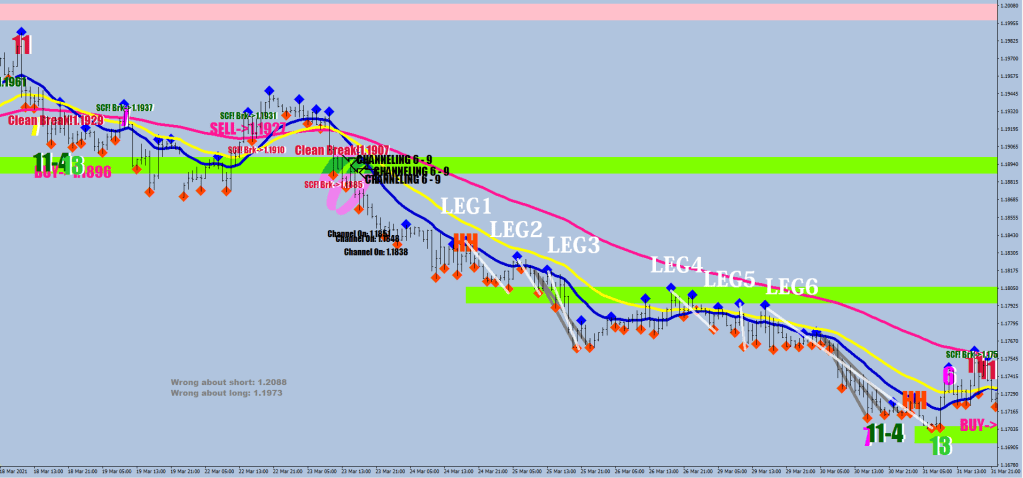
The 3 red lines are the 3 attempts. The pink line is the start of the sandbox. The deep pink is the 89 EMA.
I think you are going to really appreciate this one. You may warm up to the subject by looking at my recent articles – they all revolve around the subject of channeling.
The first thing to say is that the answers are on the hourly chart.
The second, is that legs (not waves) come in 3s.
The third is that the first two legs pick a moving average, the 2nd leg gives exact entry for the 3rd leg &
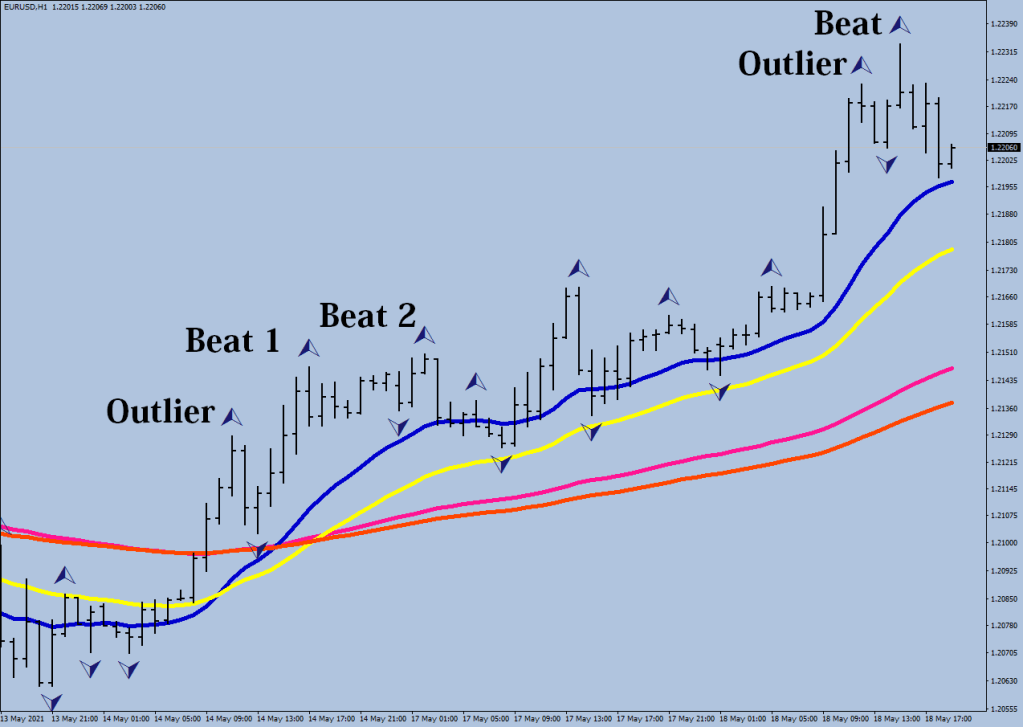
The fourth is that the ultimate goal is achieving a beat beyond the outlier fractal.
Now, let’s look at example 1.
What makes a leg a leg is that the commute to the other side of the moving average takes less than 3 hours from the fractal print.
Leg 1, 2, 3 tend to shape up around the E-16 HL2 (stands for exponential, median). The count does not start until the other side has finished with their 6, 9, 12 rolls on the dice.
In the example above 4 and 5 did not make it to the E-32, so they decided to stick with the E-16. Happens sometimes. Once 4 and 5 was printed, you knew the location of the entry. How? You take the difference between the E-16 and #5 and deduct 4 pips.
The point here is that the 3 things to concentrate on are: leg count, participation in leg 3, 6, 9, 12, getting out on the beat.
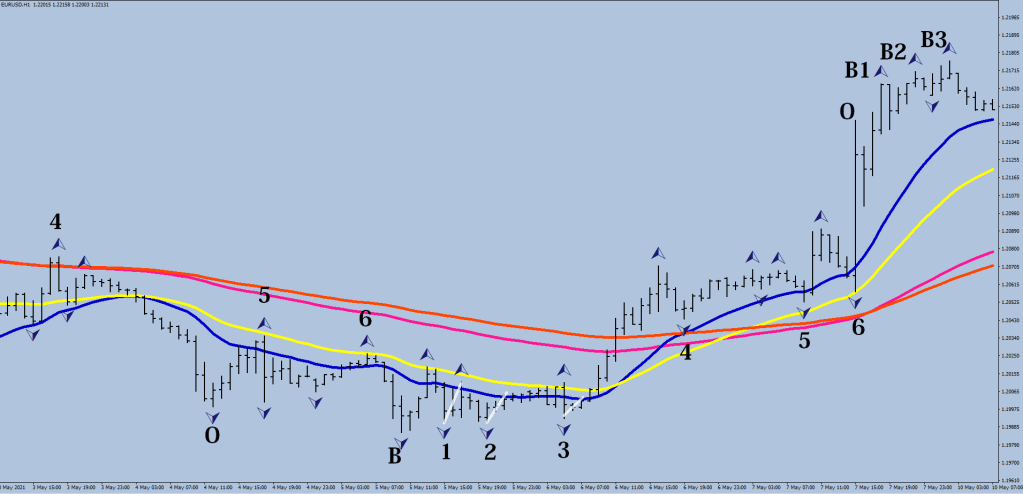
Surprise, surprise, it is not about support and resistance (at least not static ones at that), not about harmonics and Fibonaccis, and not even trendlines for the entries, nor for the exits. Leg 3 has certain characteristics and so does leg 6.
In this example Leg 5 stole 6’s thunder. Can happen.
In this example adjusting the E-16M to E-16H would make the #4 call more obvious. In the down sequence leg 4 provided the outlier.
You are welcome.
…
the projected distance 240 routine carries the same logic of outlier / beat or drive & thrust, it gives you an idea on how far the market could reach based on the intensity of the current move
So, I mentioned in these columns, that my boss committed suicide.
I was working for him for 3 years at that point, probably 4-5 days per week, lots of face-time.
He told me one time, “this is the first time I’ve seen you smile”.
I just had an exam. The teach asked me: do you always smile?
I’m the same person I’ve always been. People project their subjective world onto me, like a canvas.
The world is what you make it.
Like the MVIS stock (pico projector was the future as per Alex Nason back in 2010), that I bought around 2.25 (probably bought 2500+ shares to make it around 5k in cost), then dropped to 1 and then I got out at just above 2 for a loss.
The other day it was featured on some YouTube vid, so now I know that a decade later it hit $18 as a Nasdaq stock.
Why am I talking about all this?
Because, I have an issue of executing on the reflection I bring out of a mirror.
I have a problem with acknowledging: it’s real.
I made $22 today. Instead of a potential 4k.
I have been explaining to people about my “provable” leg count versus the un-provable Elliott “Wave” counts. I was showing them where Leg 6 would start relative to the E-32 and how far I expect the beat to go.
I was telling them on how risk free it was to go long up to the same size I was currently short, and how risk free it would be to make the hedge run once I got locked in a gain. All was left to choose was how much gains to take, and this was not at particularly random either.
The helipad was printed. But then comes doubt. What is the priority of a leg over the MEAN? What if price consolidates below it? What if a LEG 3 prints a zero or a double zero? What happens when Leg 5 makes the beat beyond the outlying fractal? Would wave 6 remain mute? I know, 6 legs equals a correction, I know, even if there will be a Leg 7, it would come from beyond E-89, but still!
I have the right knowledge. I have built the right tools (dynamic trail-stop) and a data base about what to expect from the next leg.
If I understand everything, how can I end up with nothing?
All in all, this world is unreal. You have all scammers unite to blaze a new path where nothing remains alive in their tracks. People reward these useless efforts built on the most useless technology the world has ever seen (anybody who tells you otherwise is either invested in it or plain dumb), for this is the subjective world of other people’s eyes we live in.
Intelligence is not everything. Balls are. Bitter sweet symphony this is.
I’m in school this month right at the age when time is going backwards already – obviously had to re-learn counting just to keep afloat. Warning, this is not for Elliott-hearted!
Channeling
Leg 1, 2, 3 come from beyond E-16
Leg 4, 5, 6 come from beyond E-32 (or the next EMA out for the triplet)
Leg 9 can reinvigorate the channeling move and reset the counting
Leg 7, 8, 9 come from beyond E-89 (or the next EMA out for the triplet)
Leg 10, 11, 12 come from beyond E-121 (or the next EMA out for the triplet)
Channeling can end on 6, 9 or 12 (3 is very rare)
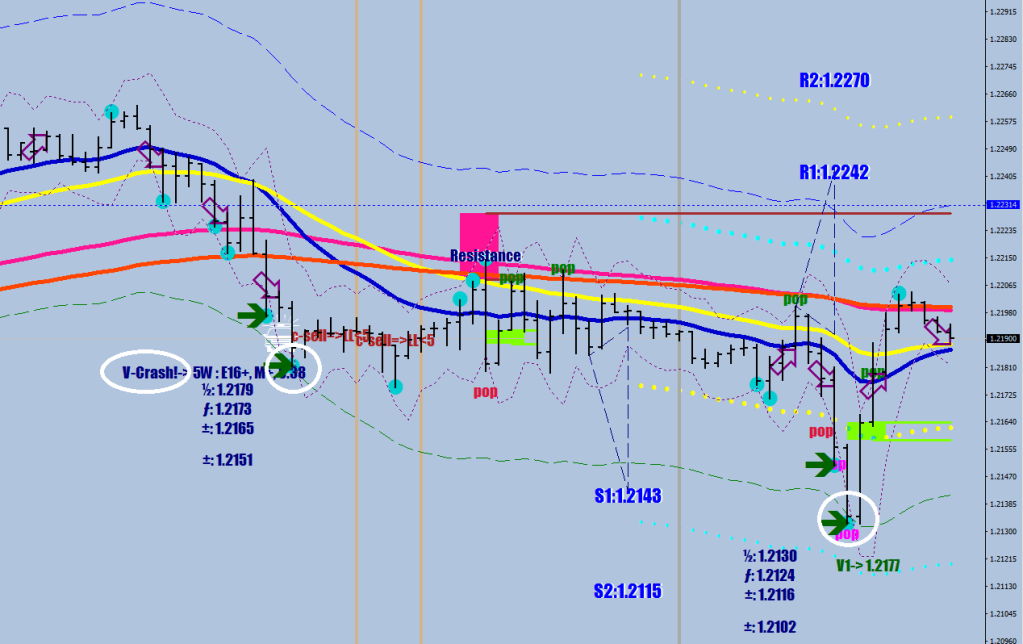
Added support & resistance list to the Catcher in the Knife and resuscitated the divergence highlighting function.
Left column: resistance levels, right column supports. Fau Wee says: ama still on the scene!
White Lines – what can you do, when Break Dance is living its Renaissance?
What an amazing turnout, welcome, welcome people! Lots of Cheap Trick fans, aye?
First I have to ask, is there anyone who have learnt to draw 3 different trend lines? Leave the class immediately, you are in the wrong life!
What is it, Ira, you have a doctorate from Bollinger bands? I see friends shaking heads. You are ok. to stay, we do not discrimate against anyone. Help me work the next generation about embedding.
The Duran Duran sandwiches are courtesy of Nino Firetto.
Bravi Jono, no gambling in the back rows, put away your BlocFi!
Pain is so close to pleasure & train is so close to treasure, so let’s start!
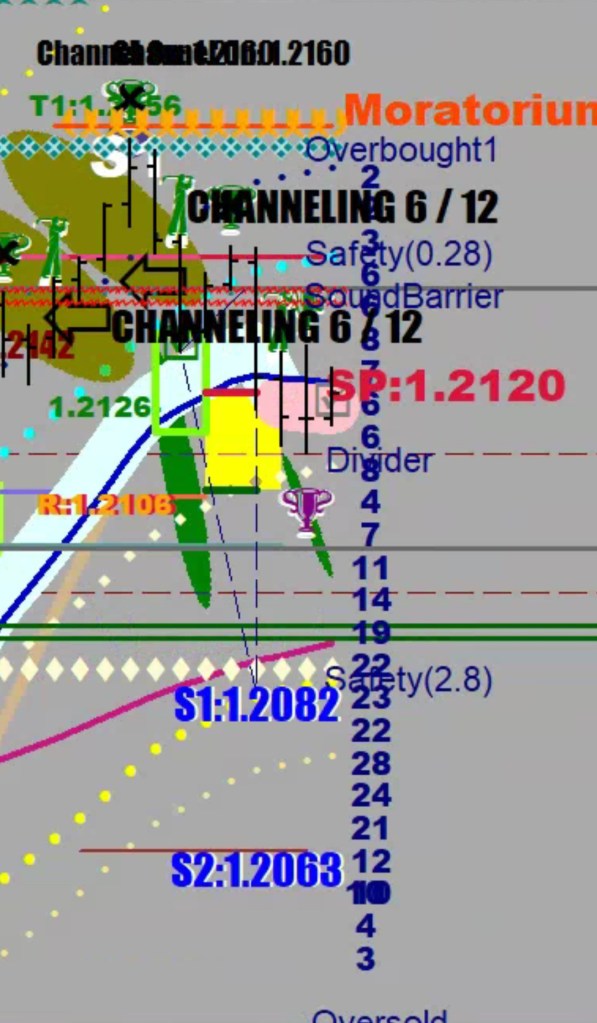
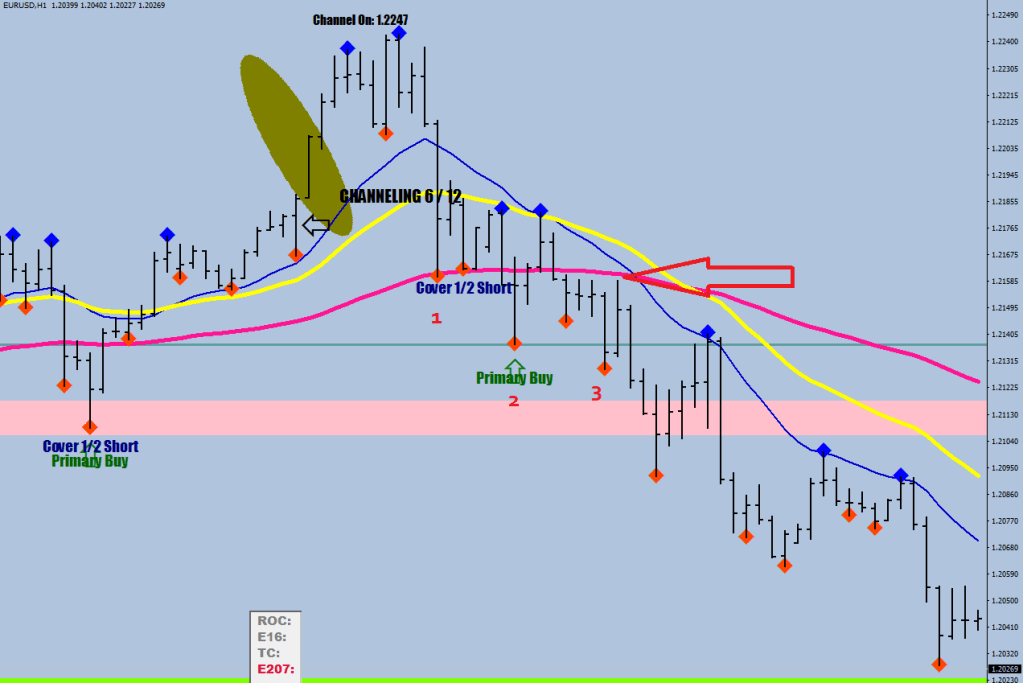
The market ended the prior channelling move with the helipad.This is the area from the fractal with the Gray line to the next fractal, known as the beat.
Ending the channelling does not mean that the market cannot make a beat.
There is a new channelling move pending currently, but it has to be confirmed first either by hitting 1.2160 on the upside or crossing below the E-89 and crossing back up or failing to cross back up is for confirming channelling to the downside. (Price has so far stayed below the last Faith Healer’s moratorium zone.
When the market is channelling, channelling rules apply.
When the market is embedded, embedding rules apply.
All other times default to convenience trading.
Convenience be it opportunistic relies on conditions providing some edge.
Seven and Eleven, Seven and Trigger, Sven and Northman are all the same thing.
The E-16 has a dark side, facing the moon (away from the mean). The Seven fractal is an RSI2 hitting Seven or 100-Seven depending on the direction if the distance exceeds 36 pips from the E-16.
This provides the baseline level reading.The divergent leg, or 11 would print an RSI2 reading that falls shy of the Seven’s, but price would travel further to set up a divergent beat. The beat has a tendency to be around 16 pips.
Now, the Sun facing side also operates on convenient basis, but it is not E-16 that it uses as a reference, but the E67M, which I sometimes refer to as zero lambda.
The second pair’s divergent leg did not make a lower low, yet it qualified with its higher RSI2 reading as a double bottom.
Now that I am permanently stationed on the Moon, you can expect this entry to be every bit as tactical and impractical as all the others were.
To lead up the subject of understanding the market, the first thing to say is when you feel like you are 2 steps behind, you are a 100 mile stones behind, what feels like 1 step late is 10 mile stones away and you may never make it if can’t make the next move before the market does.
See I’ve been trying to catch up with this 6 weeks long polarised barreling move in the Eur/Usd. There are plenty of open questions associated with channeling. Starting is easy to spot. Where does it end?
It comes as a surprise, that a channeling move seems to be only able to terminate in a leg 6 or a leg 9.
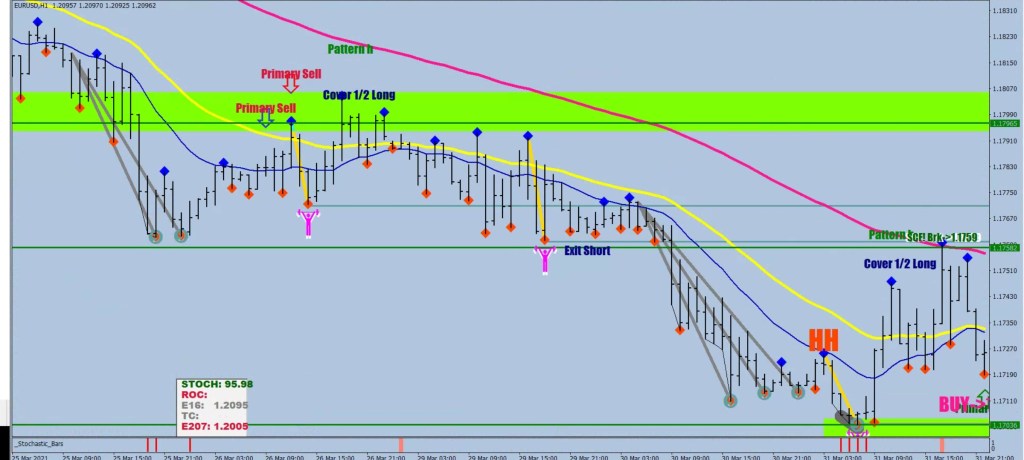
Leg 6 is easier to digest: the counter directional volatility has to increase to the point of taking back price beyond the E-89, at which point the scale may be tipped over resulting in a move that falls shy of the outer limit. In the case shown below leg 7 starts with a higher high and ends with a higher low – reversing the direction completely.
What is the story with leg 9? Leg 9 may be a terminal as well utilising every drop of the increased volatility, it is designed to be able to land a pod after the 2nd, sometimes the 3rd fractal, but the extended time play may end up triggering additional seismic activity which would start a new count up sequence. The blast off is a sure fire when the leg 9’s outer limit gets crossed over.
My way of making a list of daily levels of course is coming from the 7- sample choppiness reaching for a sexually transmitted STandard Deviation breach.
Good old CI keeps on breaching & plotting those tomato and chartreuse levels.
What if the market is not in tracking, but mapping mode or values are outside the maximum sample size?
My answer to that are the gray markers. You want to see price away from the mean by at least 2 fluctuation maximums. You want the leg to accomplish a swing length of 50 pips+.
What does SCF! stand for? It’s ok, I want you to regret asking questions. It stands for Surprise CockFags!
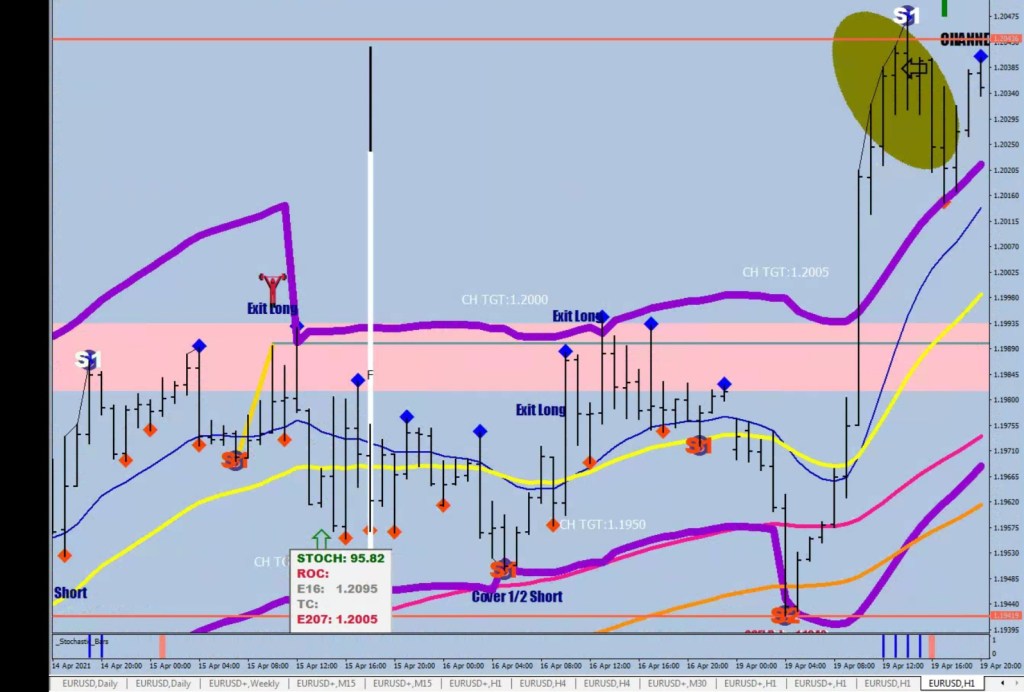
On the image below the moonpig had no space for mopping – errr I mean, the Orion had no runway to land on the Moon, Mr. McLane. You can almost hear the moon patrol’s warning: pull out!
The first gray block gets the move going the second finishes it. In reality the previous, higher fractal is what matters, but I have only rudimentary filters for now.
One more image to show the breathe in, breathe out effect.
Note that the Eagle failed to land on the Orion after the breathe in: there was no landing made, unlike the breathe out, which made a helipad.
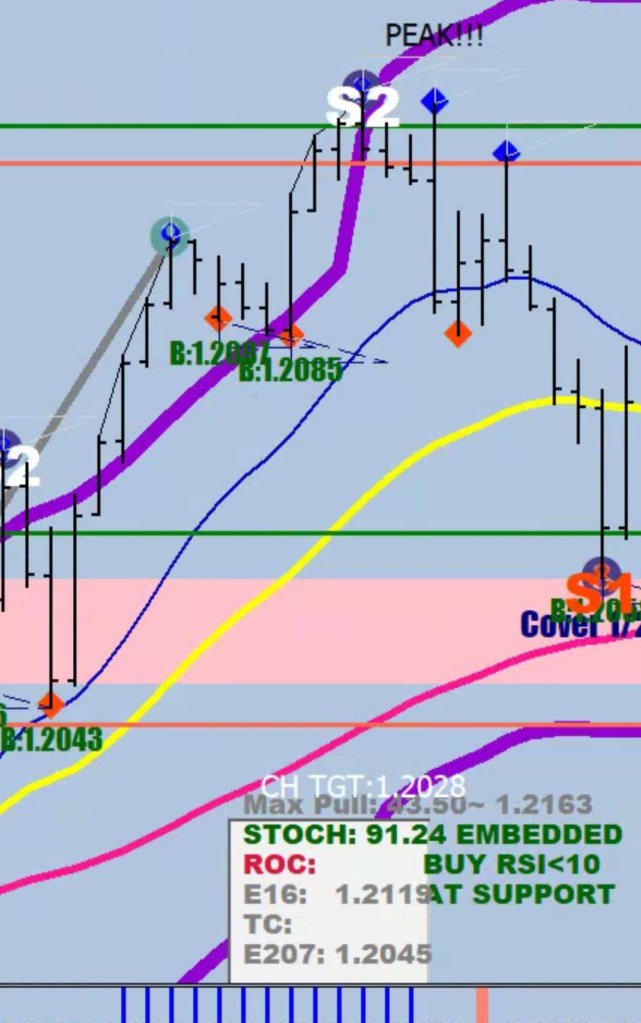
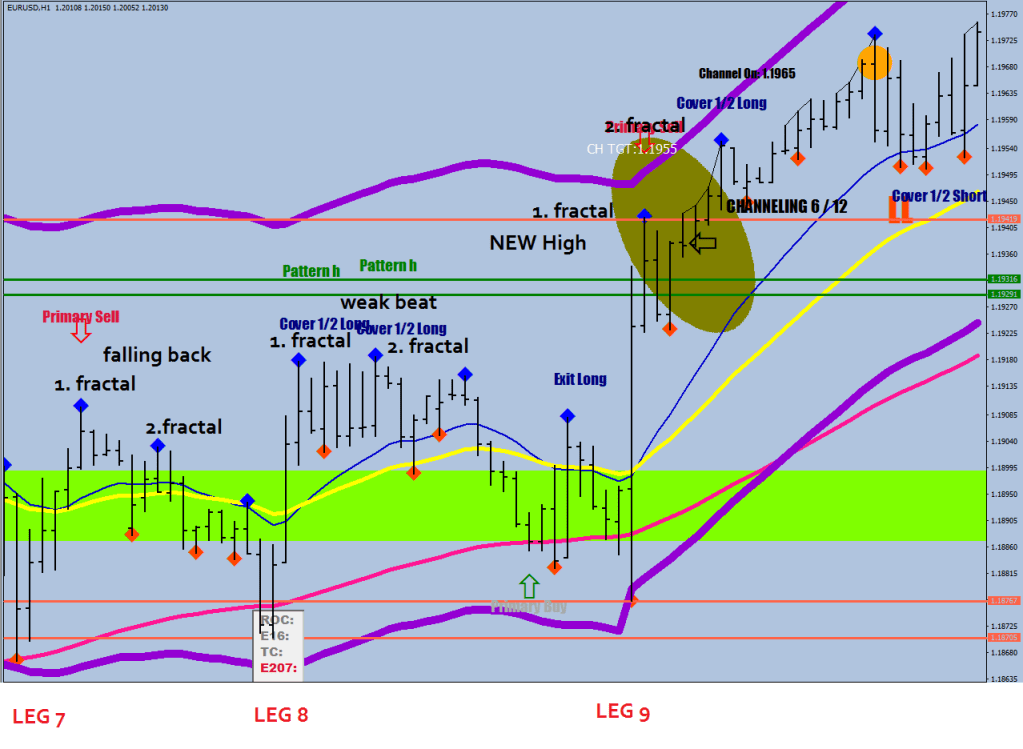
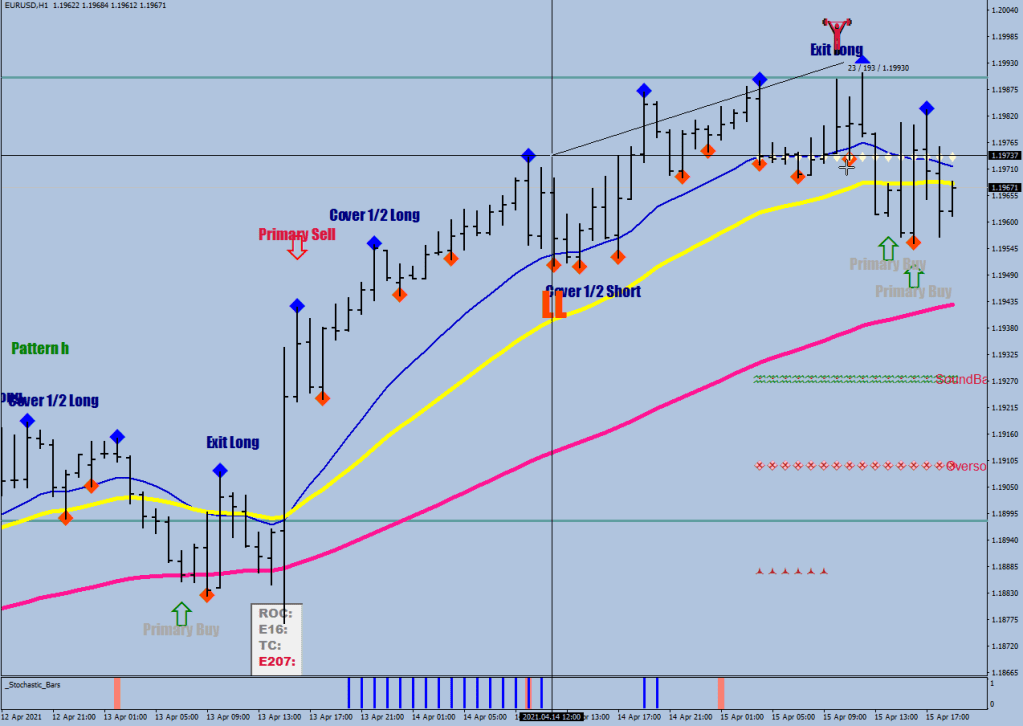
Son of a barrel of a gun! I screwed up the leg count in my 7,8,9 Rule entry. I thought that leg 6 stayed inside the barrel. Nope, there was a misfire first.
The cover 1/2 short low was the beginning of leg 6, not 7.
Leg 7, 8, 9 of the channeling move are trying to accomplish 2 things:
make good progression between the first 2 fractals whilst making a new High or Low upon printing the first fractal
ultimately they are aiming to re-start the leg-count sequence by a new rip achieving channeling strength
This was a gift from the market:
The E207 lit on these images just means that the Green River is asking for the ball back -> Mean Reversion pending.Sticking to what I said about the 9th leg on both counts in the Day Ralio: Channeling Principles entry
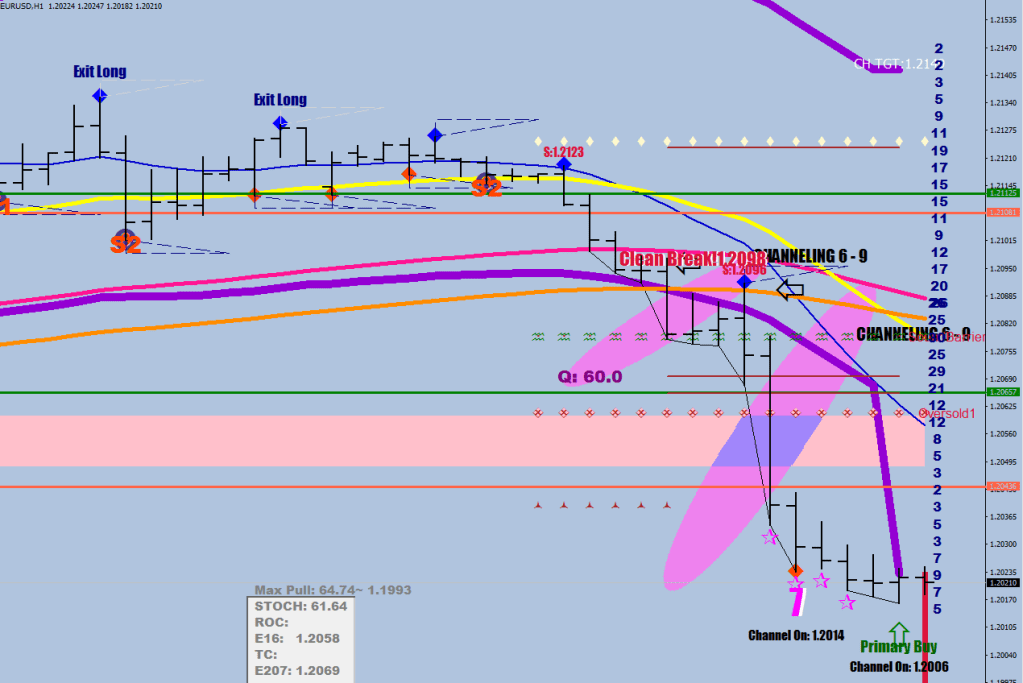
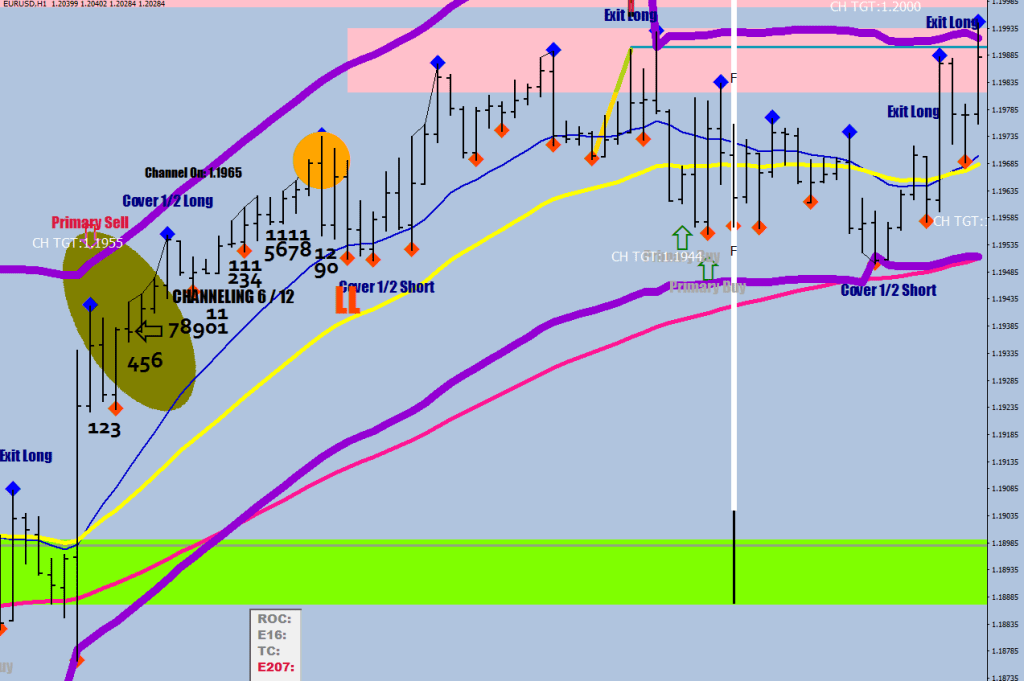
Finally, let’s look at what was wrong with the previous Leg 7 down:
the 1st fractal did not make a NEW Low. This in combination with the falling knife prior meant that the bear party was over.
Channeling is what makes a sustained move possible for the market.
The market is in general is unable to sustain moves (from a consolidation mean) back to back that would exceed the previous 3 days average by more than 30 percent.
Channeling is a condition where different rules apply.
A start of a channeling move on a chart shows up as price separates from the E-16 HL2 hourly EMA and gets stopped and reversed on the next 2 attempts when it tries to return to it.
As for a screen plot / hedging level search I am looking for a 20-bar sequence where price is unable to randezvous with its suppressor other half. However, this does not immediately confirm the direction.
The first image below shows a separation that is 20 bars long.
The channeling move is confirmed one of 2 ways: the high or low (high in this case) gets violated by 10 pips. This is the channel on level – also the basis of a hedging buy stop.
The other way to confirm the channeling move in the prompting direction is when after the 3rd dip price crosses back above E-89.
Red arrow = confirmation.
It is also possible that the channeling move gets confirmed in the opposite direction.
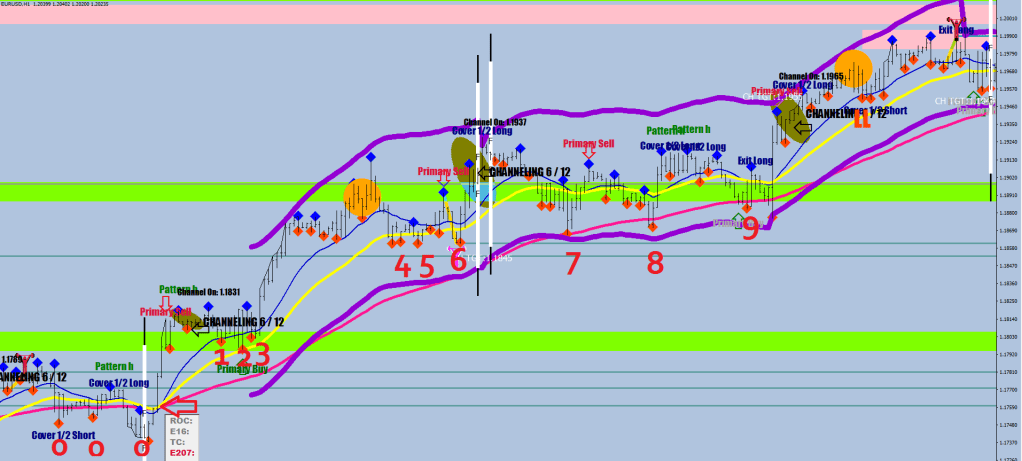
After the channeling is on, you need to start counting.
It is a good idea to plot E32 (yellow), E89 (deep pink), and perhaps E67 (maroon – I usually plot both the highs and the lows on this last one).
Notice on the image below that the first 3 entries were pushes above the E-16, the next 3 were pushes above the E-32.
The first 6 pushes are happening with counter volatility being on the mute. These legs if not always individually, but as a block for sure make the trend continuation possible (New Lower Lows).
Pushes from 8 to 9 are the tricky part, for they come with higher volatility.
I numbered the first 3 dips below the E-89 as Zeros. 7 may not make a higher high by itself, but again, as a group of 3 they may overcome the volatility and make that break.
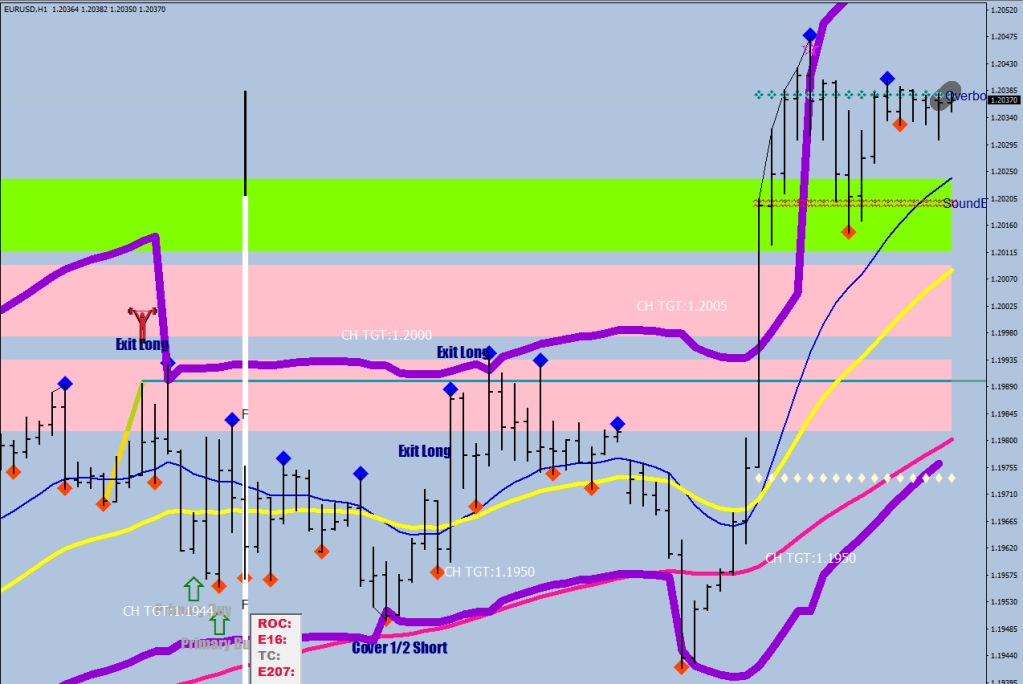
What comes after a 9 count? Decision time: can another channeling sequence be triggered? At times>
Here the market is already desperate. The 2nd sequence of 3-dips were duds, they were wasted shots with no strength whatsoever.
7 made a marginal higher high, and actually came from the E-67, it did not make it to the E-89. Number 8 put up some serious effort to halt and reverse a freight train coming with speed. Will this separation make it to 20 hours without touching the E-16 to trigger yet another sequence? I doubt it. This is why I said:
Take note of the beat made over the terminal end of the #7 leg: 1.1995. #8 made it to 1.2048. What does 53 pips remind you of? How about 45 pips fluctuation maximum plus 8 pips failed break out?
Hmm… A managed to make a whole article about channeling without mentioning anything about golden tails (tough cookie level high lights) and the shaded projection zones triggered by out of sequence LL / HH fractals. Ain’t I am good?
…
Wherever I lay my principles…
…
Falling knife moment on the upside
Alas the market managed to stay off the E-16 & printed the shape (terminal move.)
what was missing for the knife was the level: the next one up was 1.20657 in green – live & learnIt is great about the MT4 that regardless of the timeframe plotted, data can be accessed for a different one, in this case the daily.
Feel free to skip this intro-rant, I have a lecture of substance right after. Look for the separator line.
Fragile, like a mental in your state.
This is England, we don’t go anywhere without slogans
So let’s put up
Feel good, but trade better
– next to –
Share and Enjoy
Have your say and eat it too
Like a kiss from the Waitrose
And let’s go all out on what (Tricia) McMillan did when they spent their cancer support money on covering up red buses in green saying “A life with cancer is still life”
This is wrong on so many levels.
1. For starters, spend that advertising money on cancer research instead.
2. A bus with stupid slogans is still a bus.
3. Life, don’t talk to me about life.
For an Eastern European, anecdotes, like these ring home: – What is the matter with you, you look like the life!
In fact, in Hungary the average male life expectation was 56 years not long ago. My father lived to be just that. Maybe that’s the final solution to pension funds, Ripley. I knew there 3 people who committed suicide during my 27 years of stay, and knew 2 in the US in 12 years. I worked for one, of them the other was a neighbor – tenant, not 3 but 1 door down. I must be a bad influence.
The point here is that it is best not to be reminded of life.
I had the perfect hand going into April: 3.6 lots long, no shorts. I ended up dumping out the longs prematurely, at a loss, and went extra long 4.4 lots 600 yards from the goal post. If only I was paying any attention to what I’m about to teach you.
I should had taken my 1000% gains for 8 moths, close out everything and tell the broker to put me in a Pro account. I can’t seem to think straight when they are constantly ripping you off with swap. Now I’m being penalized with time. The take away here is to have short term goals made clear.
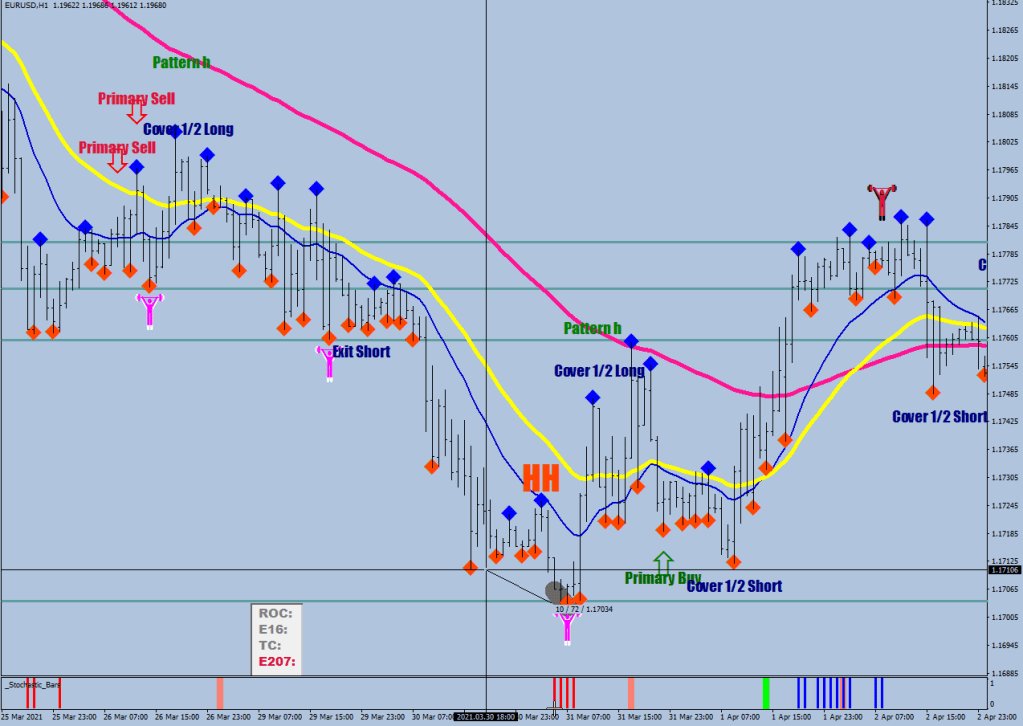
There are some old cliches such as that an uptrend is made of higher highs and higher lows, and that topping is a process while bottoming is an event.
Now, in the foot-light of the channeling research we are trying to determine where a channeling move ends.
Thanks to the previous blog entries you have gained practice in spotting the start of a channeling move.
What you are looking for afterwards (in our first example – the uptrend) is a Lower Low, which is going to be followed by a Higher High or multiple higher highs without price making any significant progress. An additional 16 or so pips is not progress, that is merely half of a normal fluctuation size.
Highest High was higher by 19.3 pips.
Nobody taught me about what a fluctuation size is and what half of that was good for. These things are my own findings, and there is no literature elsewhere on the subject. I do realize how strange it may sound to hear from someone frequently taking 2.5 pip gains that 16 pips equals no progress – that’s how life is: a mix of a bunch of things that seem to contradict each other on face value.
Lower Low was lower by 7.2 pips
Fractals can help to spot the change in the sequence, but 1H may be to insensitive to do this – unless you are using my Modified Fractals routine – the source was posted among the blog entries. I only changed the rhombus (boy’s best friend) size and the color for the current image.
You are not going to be gaining anything extra from going below 30 mins, only lose orientation.
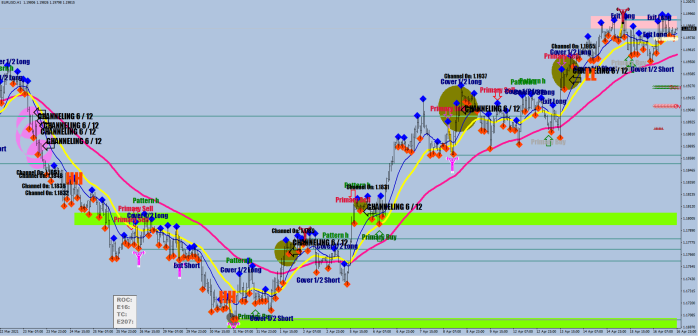
This last channeling push could only facilitate the first set of 3 dips, thanks to that lousy LL mistake.
channeling is on when the 2nd outer fractal gets exceeded by more than 4 pips or if the 3rd spike beyond the E-89 recovers
active channeling has 6 or 12 pullback entries first 3: beyond E-16 second 3: beyond E-32 third 3: beyond E-89 fourth 3 beyond E-16
active channeling ends with a new Tough Cookie print in its direction (now with golden tail highlight), LL / HH projection zones and stochastic bar sequences are there for confirmation
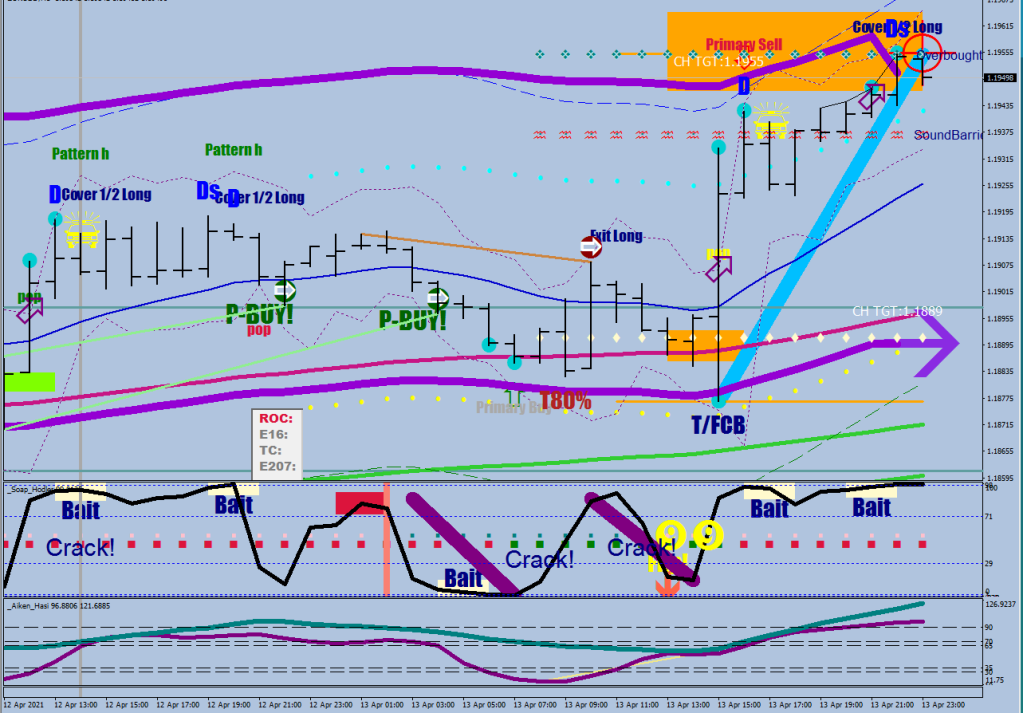
The Catcher In The Knife is made of the upper plots of the Soap Hodler and has a knife catcher high light and an added golden tail function to make the Tough Cookie levels easier to spot. Seen here with the Modified Modified Fractals, that draws rectangles for projected support / resistance areas and channeling epicentres along with the confirmation levels. The ROC, E16, TC, E207 box is a collection of color warnings and a poker equals a falling knife. That’s all you need to know.
Trading is a subjective subject, it means something different to everyone.
This article is part of the Channeling series.
There are some new elements that I have spotted that can clarify things a bit.
On the image below the ripples are the epicentre of the channeling move.
What transpired prior was a mean reversion, but since the Green River was not plotted here, we’re not going to discuss that part.
After the ripple effect any point is a good point to buy until the channeling ends, but for optimal entries, consider the 3 3 circle sets.
You should therefore initiate new longs / add to your longs upon the first 3 spikes below the E-16, then the 3 spikes below the E-32, then the 3 spikes below the next EMA, which would normally mean the other side of Mr. Maroon (E-67), but on the example above the E-89 was plotted.
Now, unlike the epicentre of the channeling, the end isn’t so easy to spot.
The last move ended up in a falling knife – see last blog entry.
In general, a stochastic bars hybrid can help to spot the 3 different legs – and more precisely where the last one ended, and with a little practice you may end up finding the faith healers yourself.
On the image below the channeling only got to the second 3-sequence before the falling knife, after which there was no lower low, but one pink was still good for a quick sell.
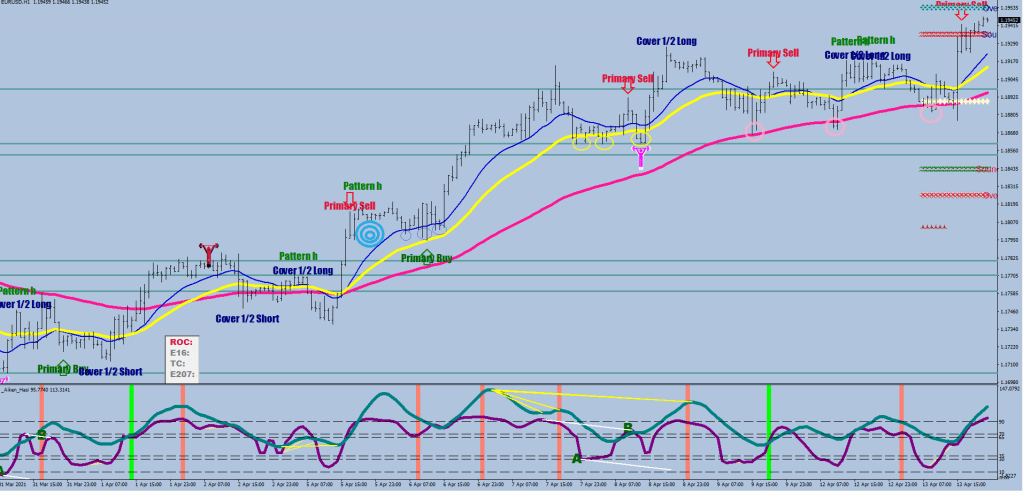
My suggestion to playing a channeling market is to open positions without stop losses first. Then have a routine click on the first protective stop in gains after 8 hours, and have a smart trail stop take care of the rest.
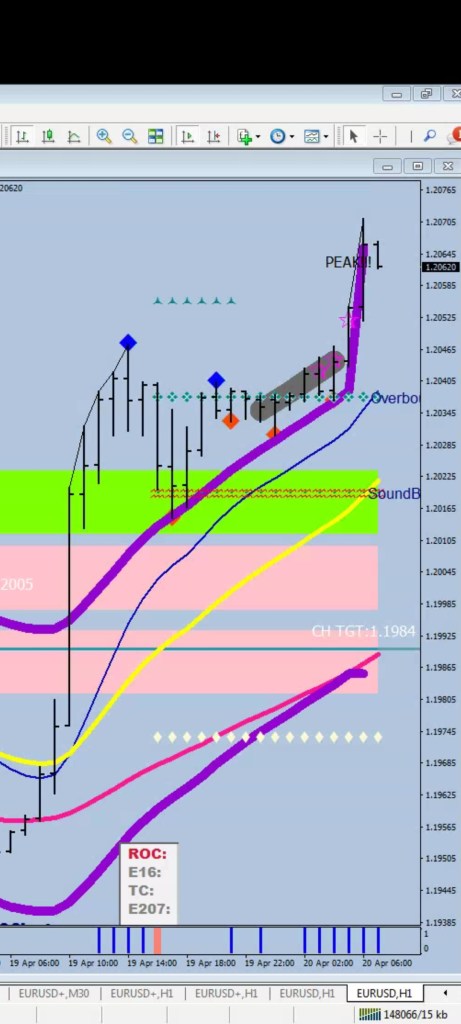
The last image here is to show that the first set of the stochastic bars started printing. The moratorium of 1.19542 was calculated from the last Send Function’s high, and if price fails here, this is what I call a no break extension: price only coasted higher by a mere fluctuation size = the bus never left the station, just pulled ahead from one end to the other.
(The 3 green circles are the Maroon Fake-outs – see the pink ones earlier.)
…
Visualize a channel…
The purple dashes are liquidity breaks = hint to fade. Note the divergence on the Aiken Hasi purple line on the bottom between the T-80 thrust and the Thrust/Failed to Close Below.Stochastic bars group 1, 2, 3.