Warning! Off topic entry! Read it only if you speak British and your nerves are made of aluminium or if you speak American and your nerves are made of aluminum.
Elon Musk and Melon Husk were born in the early seventies. They both were exceptionally bright kids. Then they both had to wrestle their father to the ground to stop that drunkard animal from being able to apply the knife blade that was cast inside a large thigh bone on various family members. “You are not my son!” – was the cue, and so they found themselves having to pay for their accommodation and trying to make money on the streets at the age of 17. We skip out on the 12 years of vegetarianism and only vaguely mention the influence of Douglas Adams, who triggered the 42 mania and contributed to humanity the “Don’t Panic” attitude. Melon went all out and ended up translating most of his books – no, not to Afrikaans. Both guys ended up in California. They both got married at least once and had at least one kid of a gender. They both understood that hyperloop would never work under any circumstances, but Elon had to first see thousands of attempts fail before having to re-purpose the underground tunnels he already started digging. At the age of 37 they both had a net worth of at least $265,000 and by the age of 40, they both had at least £17 to their names. They ultimately had to leave the USA due to an expiring visa. Actually, the two stories differ a bit from here on. Financial success in life does not have to do with the level of intelligence. First and foremost it hinges on one’s personality, then on who they know, the authority to act and sheer luck. I wish you a bunch.
…
I wanted to insert here the picture of Jules Verne’s (Verne Gyula) moon shuttle that I took in Washington D.C., but could not find it.
Here’s the book cover of the Plague From Space by Harry Harrison instead.
All of the following images are links.
& also, for good measure The Stainless Steel Rat Goes To Hell
With the addition of code 94 – which means 0.94 stop loss on a long and 9.4 stop loss on a short now it is possible to have a near perfect exit.
Until now targets could be set dynamically to a moving average or a displacement of a moving average (overdrive lines).
With the new cropper routine you can be sleeping in the middle of the night or be roaming somewhere out of coverage whilst the home computer is taking care of the optimal exit business.
What you need to remember is a good exit isn’t always the best entry for a reversal. When things get overheated, stochastics can embed for a while and at times only the second >94 or <10 would bring about an optimal entry.
Now these lines are part of TrailStopOnlyModifiedLT, which clearly isn’t a Trail Stop Only, but rather a Swiss Army Knife.
I find myself switching off among the various SL codes based on my latest analysis. I may open a trade manually and give it an Overdrive line target (code 8) then upon realising that a continuation against me is a bigger likelihood now, I would change the “stop loss” code to E16 or E32 (code 5 or code 6).
Having optimised automatic entry is a power just as much as having a 1/2 and full automatic hedge for a black swan event to prevent the account from being blown and possibly capturing it at a workable condition still.
…
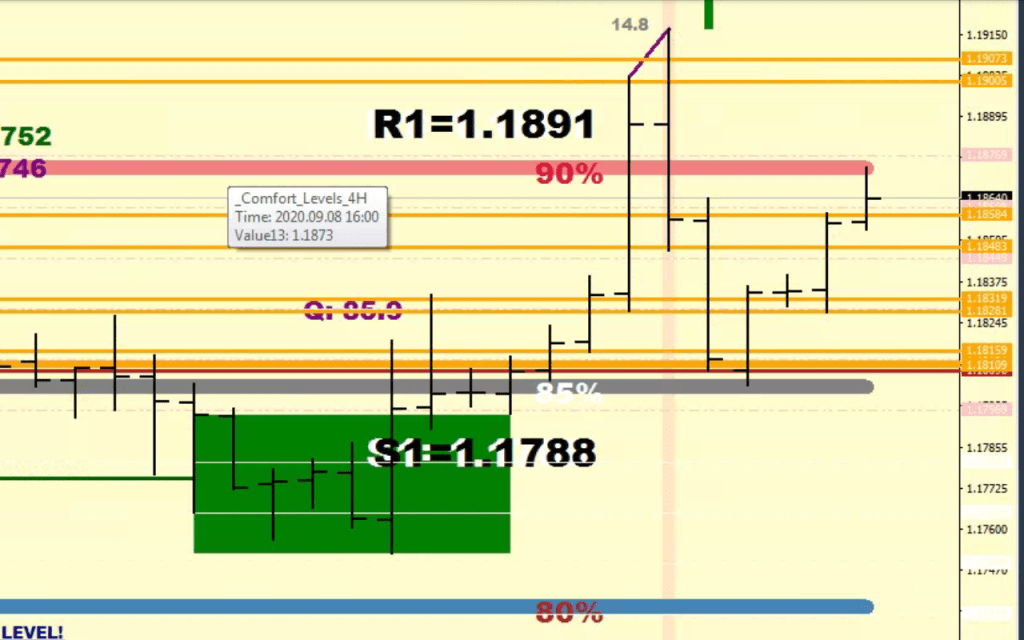
Other – I ended up having to highlight the oversold end of the last consolidation as well, if the 4H RSI2 is below 14 when reaching a full charge, the selling already embedded:
I do expect the consolidation mean (fair price) to be attacked again, and if crossed, the other end becomes in plans.
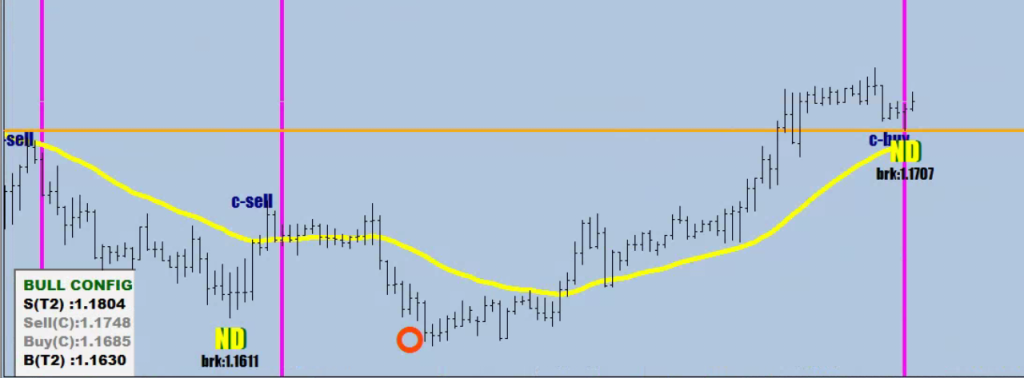
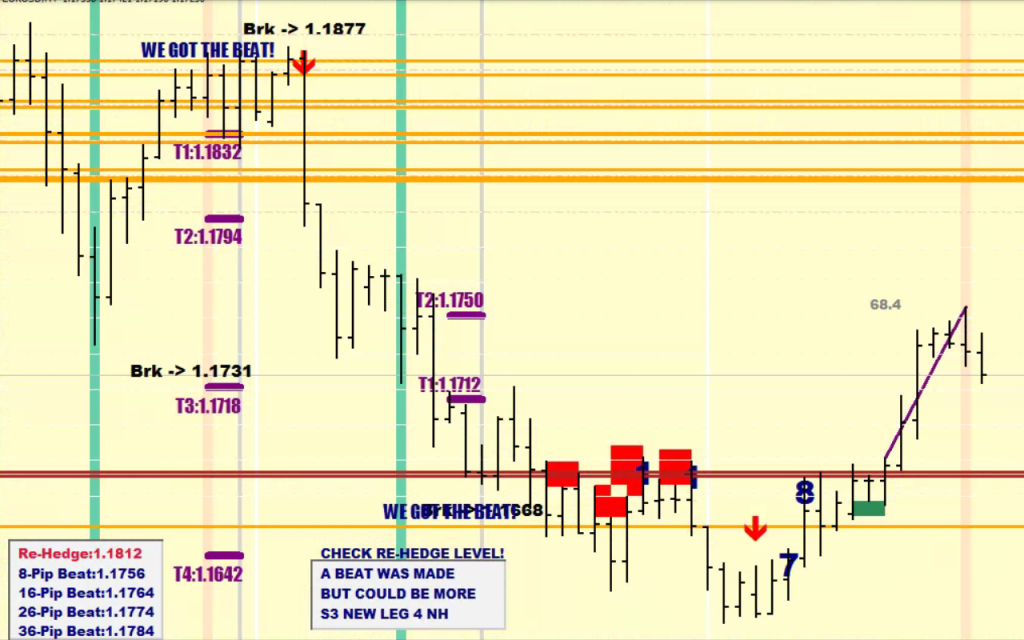
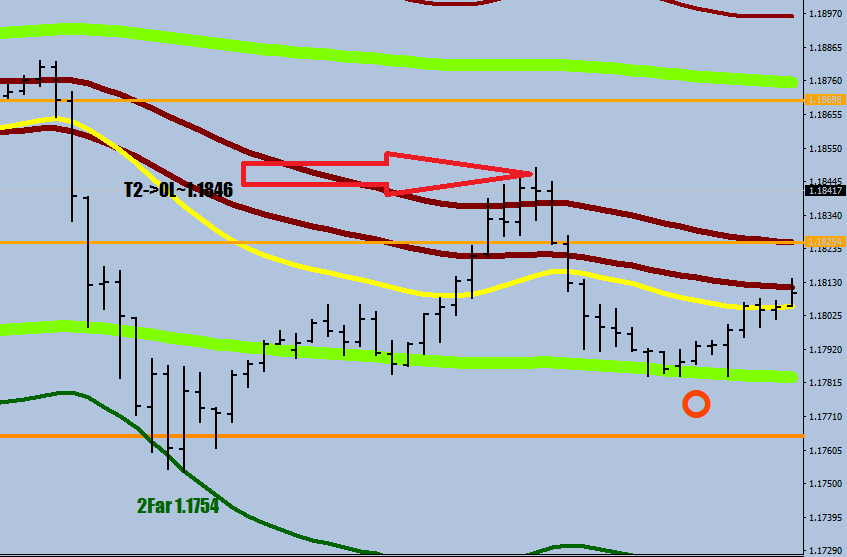
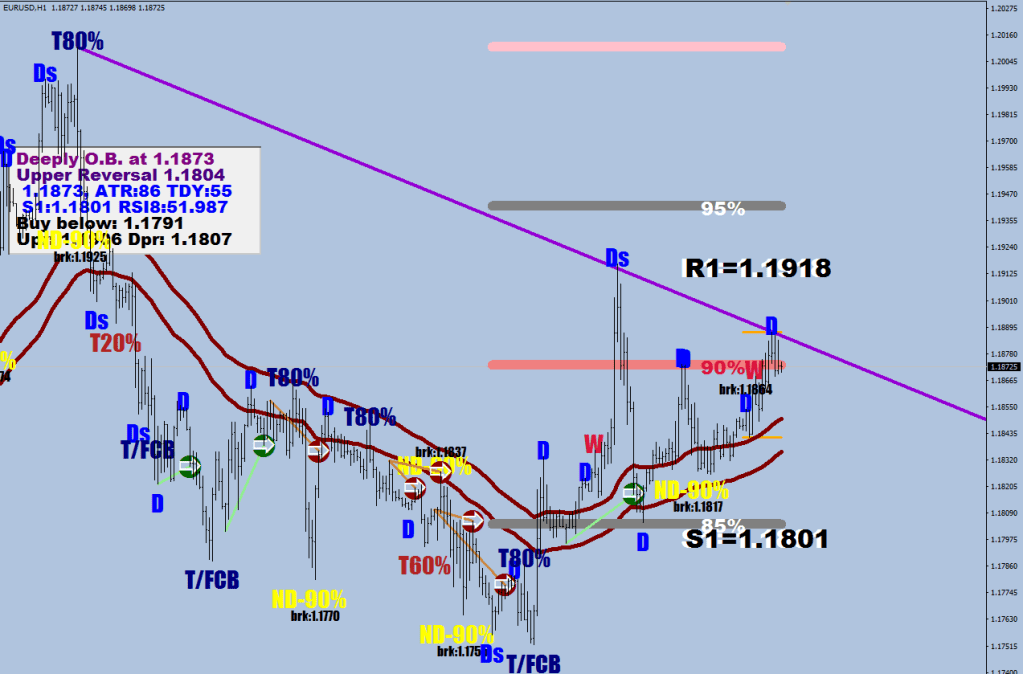
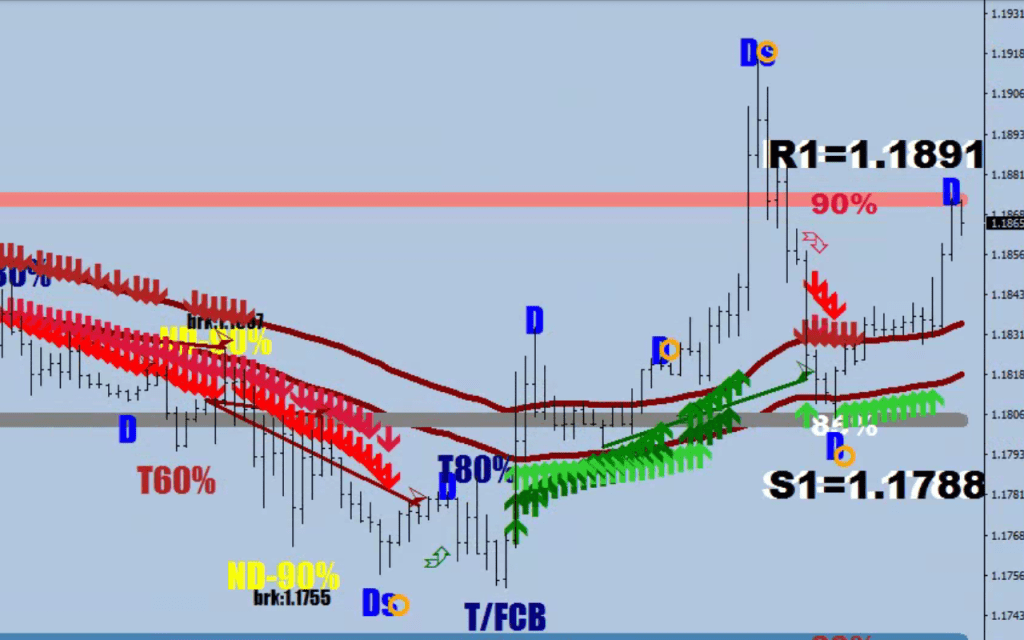
When price failed to sustain a move below the No Drive Break level 3x in a row, that meant inability to go lower = HIGH BASE.
I managed to over think that one and figured it was a temporary act that had to do with some Friday options expiration – don’t do that.
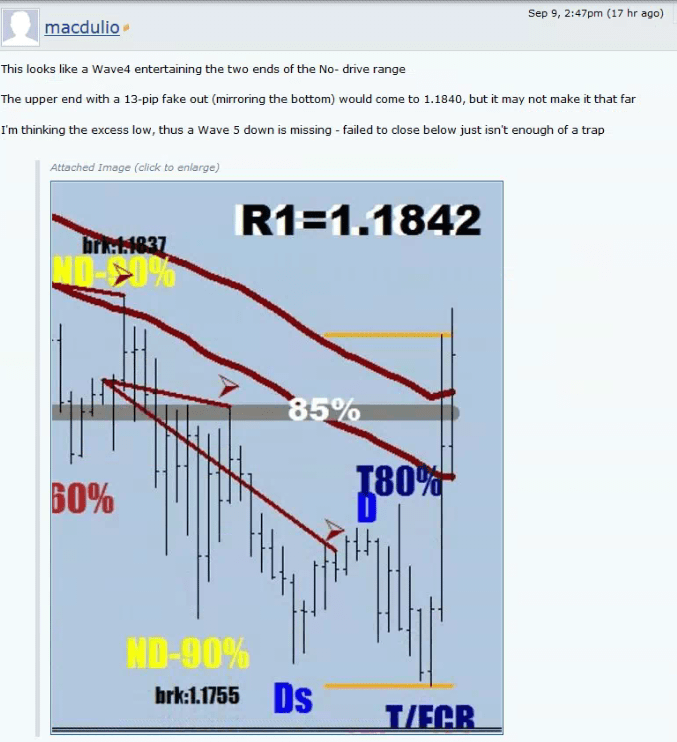
Clue #2 was price not breaking the Maroon Fake out level circled in green.
When what should happen, doesnt’t, remember the name of Peter Reznicek.
Clue#3:
There is 3G, 4G and 5D+T. No, this one does not cuse cancer, and you don’t need to send me Bitcoins, I won’t double them.
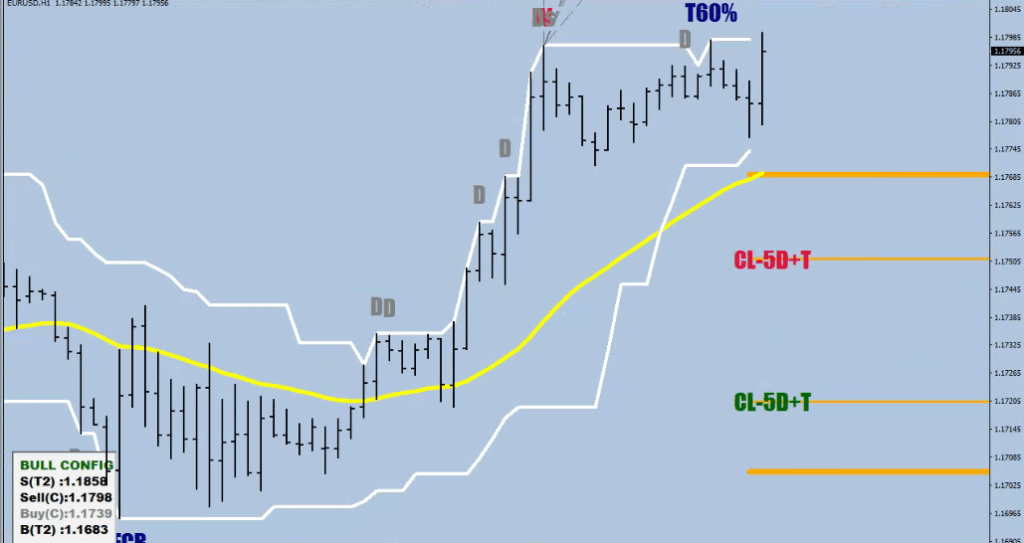
CL is short for CLue. 5D plus a Thrust was the potential after price went beyond the lower ND level, faked out the break level a few times and then returned back the slim orange line.
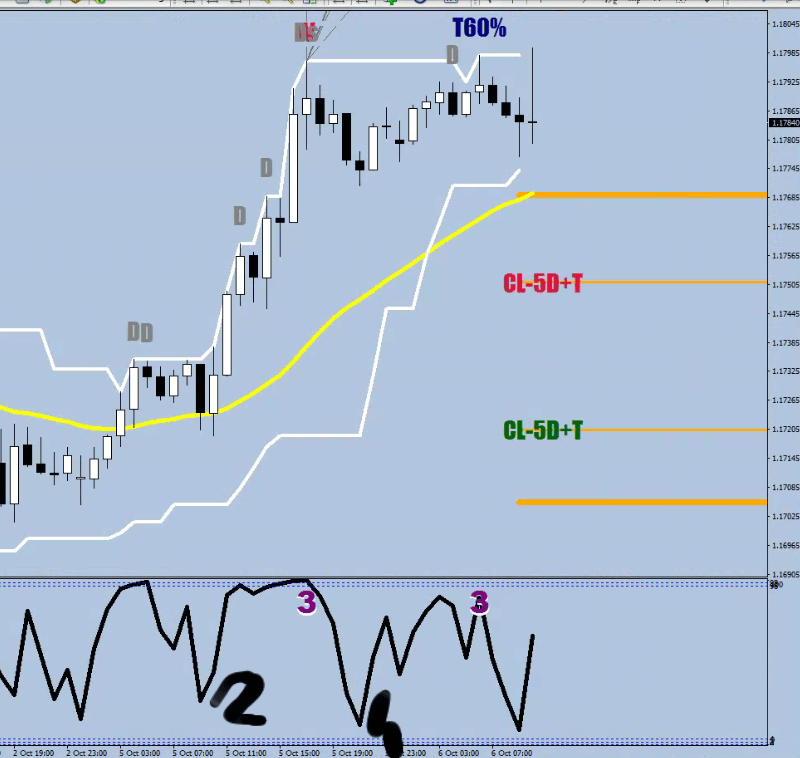
The back 2 back D-s (next to candle) should be counted as one, I applied multiple logic not to miss one. Not sure why 5 exactly, but this is the 3rd sequence like that in recent times.
Clue #4 was spotting the impulsive wave and calling it 1.
You may be at a disadvantage when looking at only bar charts: the white block showed no pullback. The pullback following was Wave 2 down. It is a clue by itself when price returns to Zero Lucid (E67 HL2 / Maroon Median).
Clue #5 was breaking the De Tomaso Maroon Fake out. Find the image earlier on this page.
Besides having a clue about the 5D+T and looking at the 4H energy for an exhaustion beat
a further clue of the timing was the wave structure itself.
The relationship between the end of Wave 2 and Wave 4 is a continuation divergence, in this case higher low with lower RSI2 reading
The two automatic #3s are the End of Wave 3 and the end of wave 3 of Wave 5 up. Both beats were as weak as possible.
…
One clue I forgot to mention about is that a awave 3 likely ends up exceeding the 3-Day ATR (measited from the last 15-min consolidation weight – plots by 15-Min ATR PRO and other indicators). That is exactly what happened yesterday upon reaching beyond 1.1790, which served up the clue of a No Break Extension for the next day.
…
The triple beat hurdy jerky move recharged the 4H energy completely.
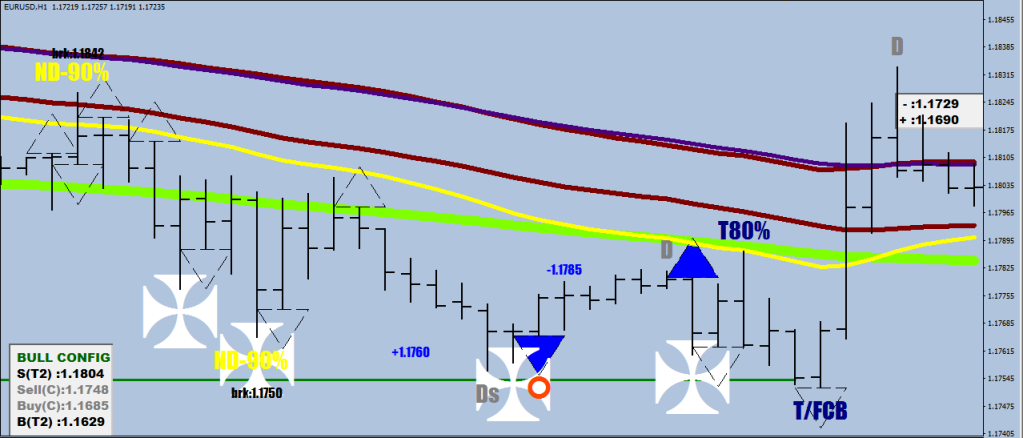
The ND moratorium is a 15-pip zone between the Break and ND where the No Drive edge is still in effect.
Let’s re-introduce the thrust function.
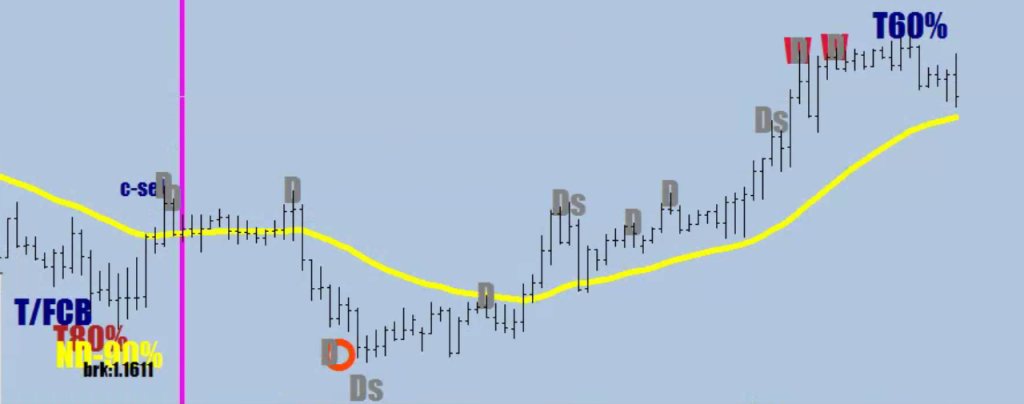
Better. I grayed the Drives out so you can more easily derive the conclusion that the buying spree from the ND low lasted until a thrust was made on the upside.
We have seen this movie before:
The Drives are peak buying/selling just as the Thrusts are, but the Thrusts cannot muster more than 2 hours’ worth.
ND is very much like an exhaustion beat. The gray line on the upside was exceeded somewhat, but not all the way to the break level = in the moratorium.
How did you like the T4 plot on the way down? How did you like the T2 plot on the way up for target on the upside? Yes, in this case there was a break of the beat, but this did not change the target levels, just pushed back the entry.
So let’s count your blessings edges.
ND (+moratorium)
Thrust (terminal correspondent of the ND)
Exhaustion beat
Overdrive lines
Prejected distance
Overheat projections (Wave 5 beat of Wave 3)
These are all things that No one else has concepts of / plots for, but you do.
…
Another ND Moratorium from earlier
1.1750 was missed by 2 pips – but put the break out hedge 1 pip further still to avoid trigger happy MMs.
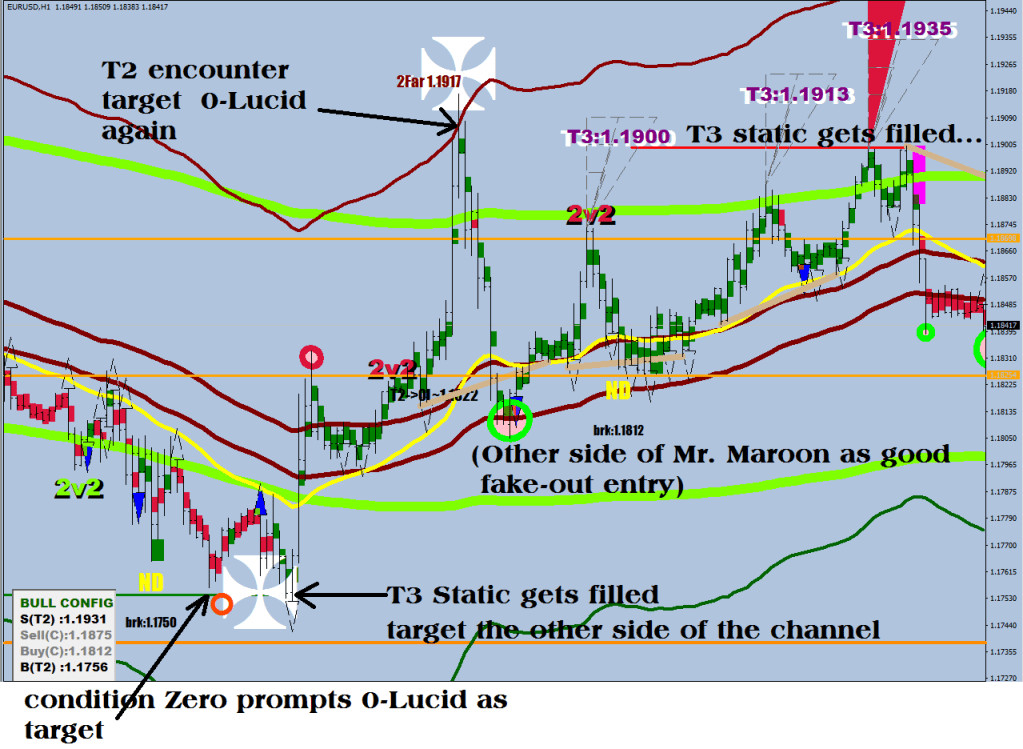
Static targets are a snapshot of a calculation that do not change by whatever price does, whilst the lucid ones are the moving averages or their displacements.
Plot RSI2 Zero, Overdrive and RSI2 Direccione LX on a hourly chart.
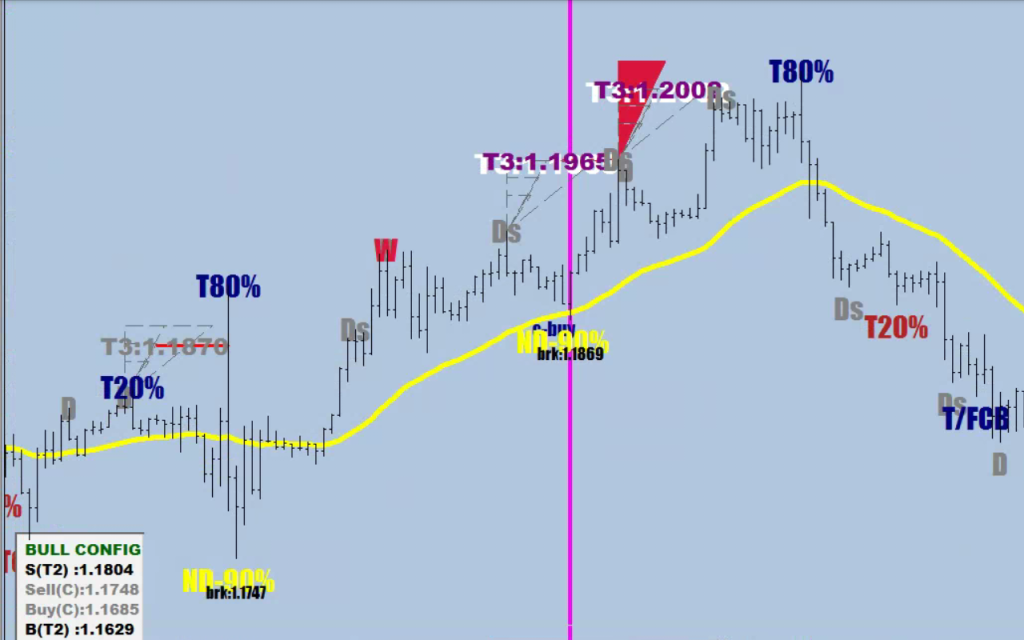
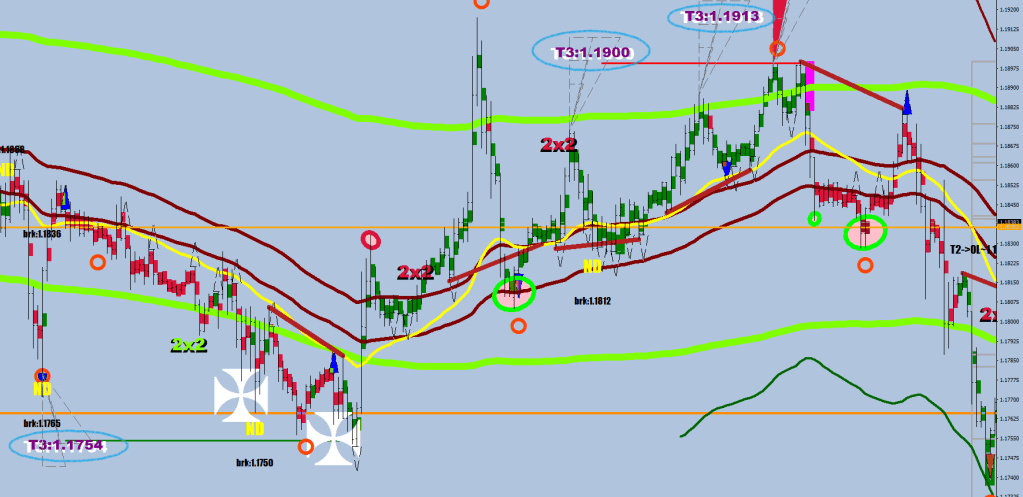
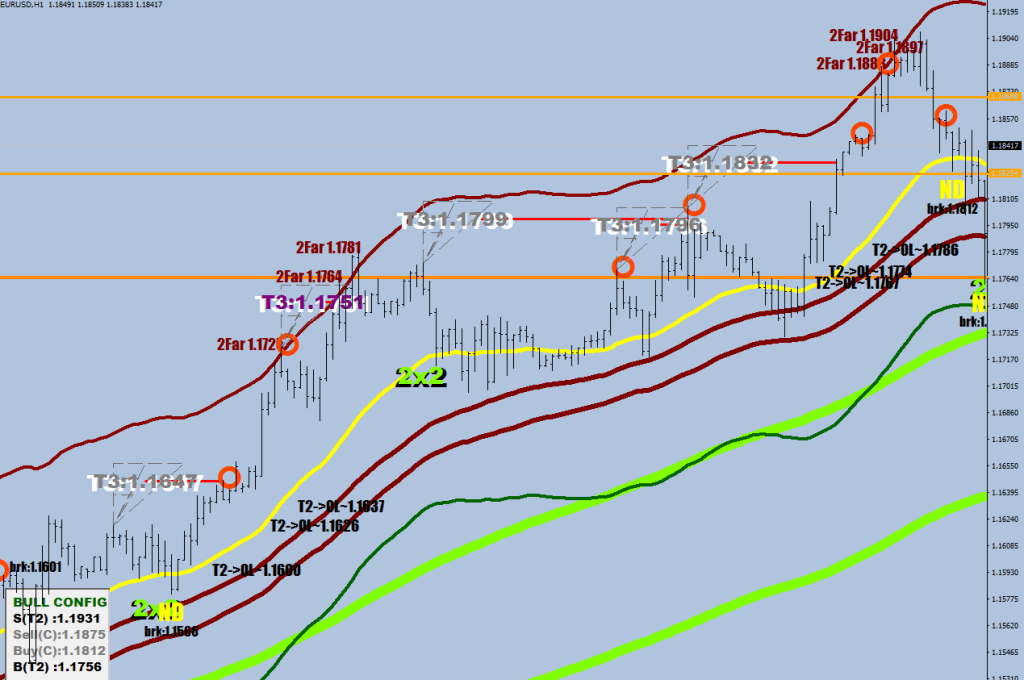
T3s are static measurements from a condition I dubbed Wave 3, for Wave 3’s tend to have this kind of an overheated ending. T3 is probably the best location for an exit and a fade, for you have the exact level on your hand way ahead of time.
The displacement changes a bit according to the price’s residence on the long term comfort levels.
Just keep in mind that there could be a second call, and for that reason apply a better than break even stop loss once in gains by say 20 pips.
T2 is the second best price location for an exit as well as a fade, but this one is lucid – see the automatization part at the end. Play the fade the same way as the T3, with a protective stop loss in gains, don’t go in again once stopped out and be conscious of the fact that you may have to open a trade at market, some distance away from the actual bands if you don’t happen to be there at the right moment.
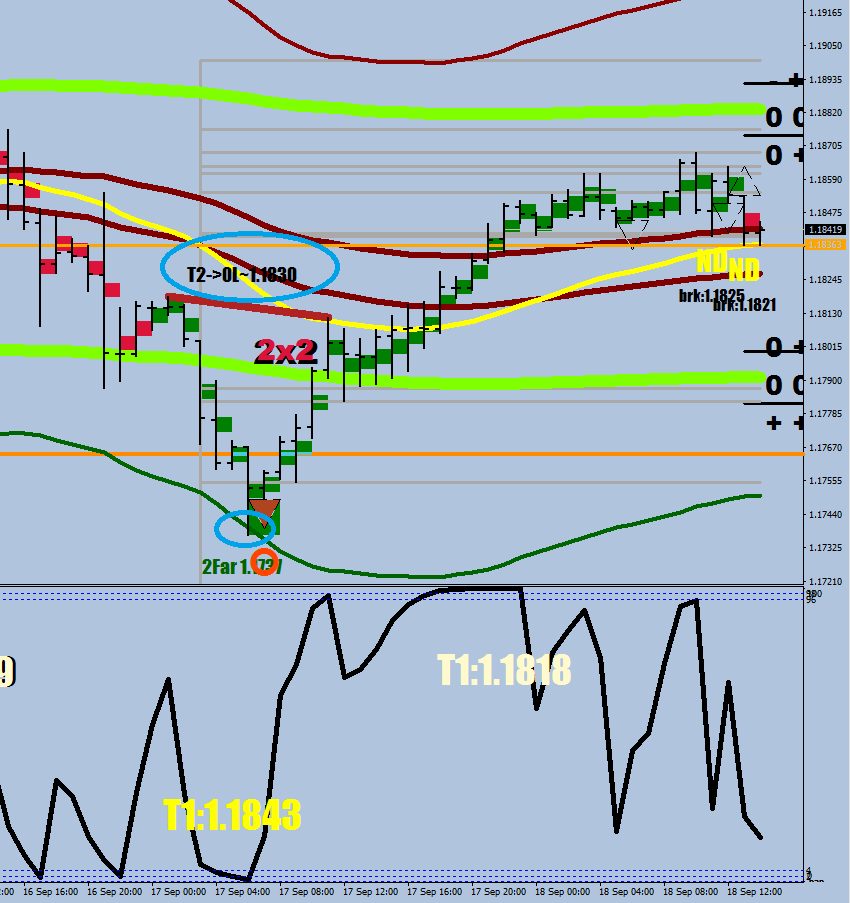
A T2 fade could be paired up with with a T2->0L target which is also lucid, but for an idea I plotted an approximate location as a snapshot of the other side of Mr. Maroon.
The lucid T1 target is coming from the Zero condition – more on this in the Make Your Own Indicator article. The yellow numbers carry a little more weight for they are further away from the safety nets, and the “shadow” accent is a print with the right EMA configuration – for extra promotion.
The Bull Config / Bear Config switch is as simple as the relationship of the first two safety nets E-16 & E-32, for I did not feel like complicating things with 6 different configurations by throwing the 3rd safety net, Mr. Maroon to the mix.
As you can see, the Zero condition is yet another exit / fade, but you would actually need 2 more candles – so a hint more than an extra hour for the call to be certain.
The ticker now cites the T2 lucid values as well as the (c)onditional values that hinge on the 60-sample stochastic D reading (aka Crack Ho), and they are the 65%+ and the 35%- values of the E-32 channel as for overbought and oversold (the inner dotted plots on the Stochastic Barsfor 15M).
Automatization
After putting the Trail Stop Only LT Modified EA on an Eur/USD chart (I prefer a 30-minute one) and turning up the Auto Trading, you can start aiming for lucid targets:
for a 3-pip overshot of the E-16 current value in (blue) use 0.5 stop loss for longs and 5.0 stop loss for shorts
for a 3-pip overshot of the E-32 current value in (blue) use 0.6 stop loss for longs and 6.0 stop loss for shorts
for a discharge on the E-32 channel’s overdrive lines use 0.8 stop loss for longs and 8.0 stop loss for shorts
The expert adjusts stop losses and targets depending on the stop loss you enter.
if the stop loss isn’t zero (left empty) or if you enter 2.0 for shorts and 0.2 for longs and not some other Code
the auto trail stop would lock in 1.5 pip after 4 in gains, 3 pips after 8 in gains & trail the stop 16 pips behind after 20+ pips in gains
using 3 & 0.3 (Code 3) would lock in 64 pips upon exceeding 64 pips gains
Code 4 adjusts the target 16 pips above the 8-sample 15 minute low / 16 pips below the 8-sample 15min high(not sure about this one any more) Code 5: E16 target+ 2pips extra Code 6: E32 target + 3 pips extra Code 7: 5 pips closer than Mr. Maroon (playing it safe) Code 8: Overdrive as tartget Code 9: 89 EMA
there is also a 2.5 / 0.25 combo that would behave as 2 / 0.2 and on top of that first it would find the last 15 minute fractal and set that as a target
plus the Sharpie function is still active which brings the trail stop to the last 30-minute candle’s close upon an RSI2 sharpie sequence
…
…
gray out logic
I know the article did not come across like the conclusion I’m about to give, but that’s because of all the filtering I have done.
This is a valuable insight for those aiming to pin a reversal perfectly.
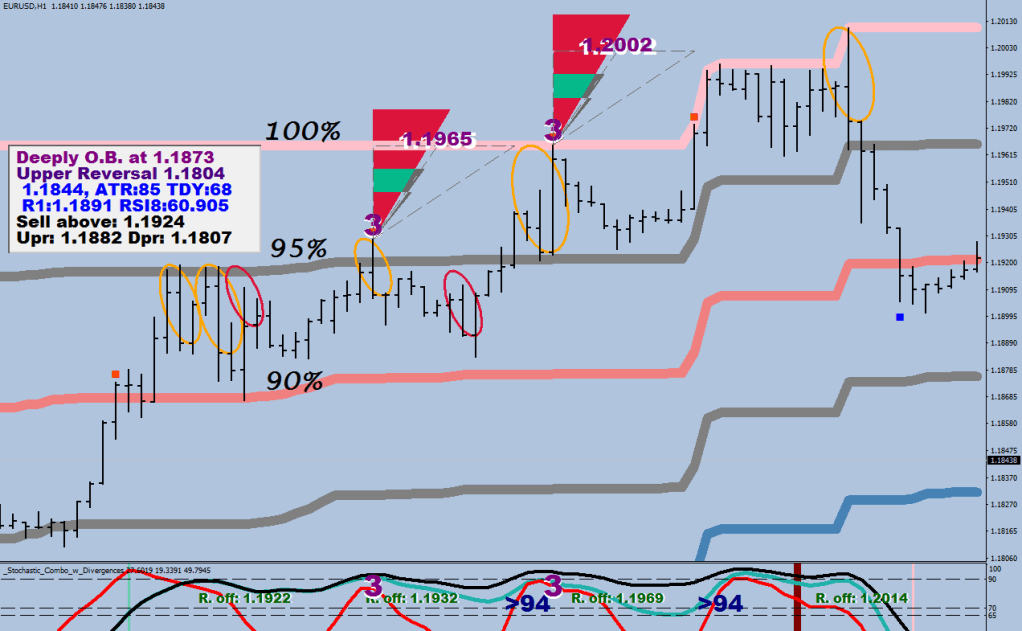
Let’s start with figure 1.
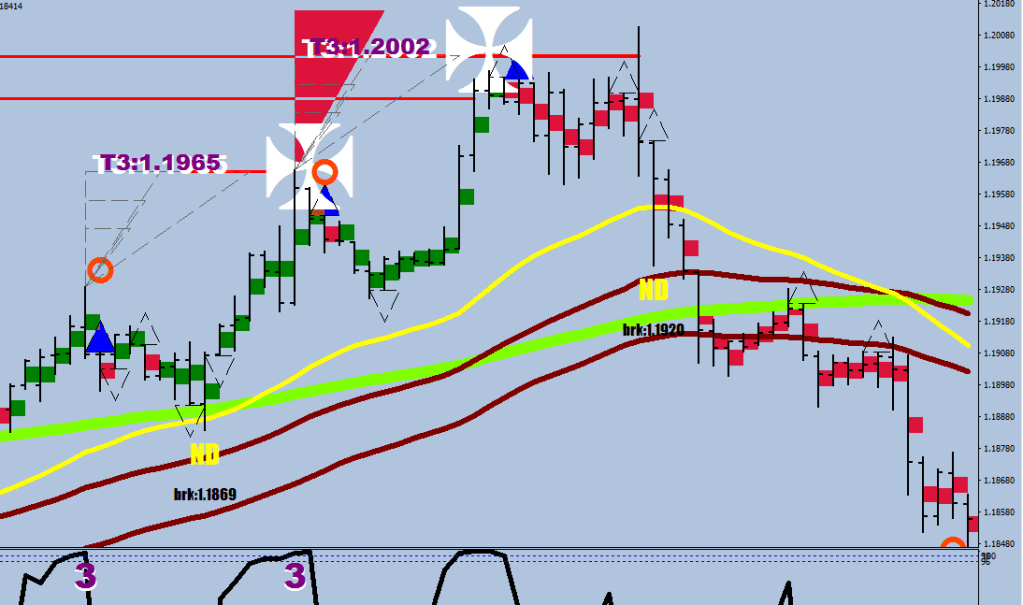
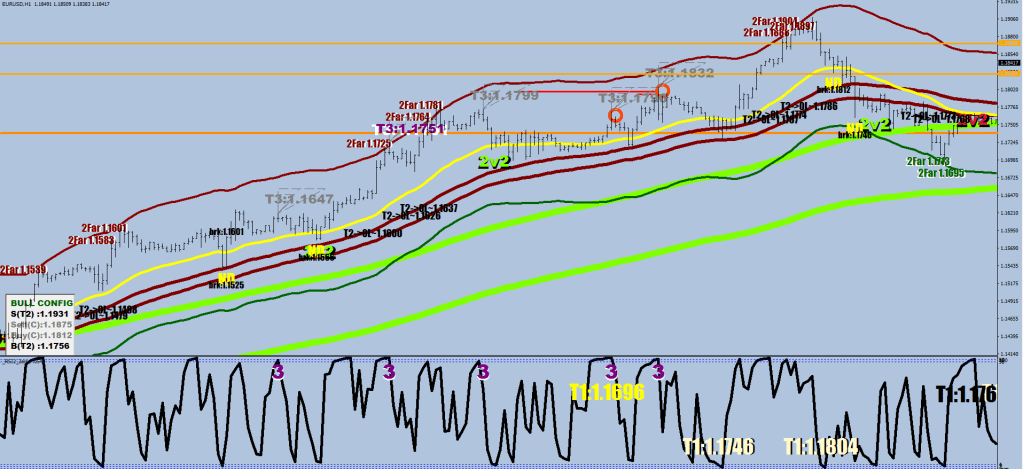
You can see, that as soon as a “3” identified, the “5” can be projected with high accuracy. On this image above there are two “3”-s, yes, for the first number 3 is the wave 3 of the Wave 3 whilst the second one is Wave 3 preceding Wave 5 – yet the distance is very similar.
These projection triangles are made of 4 pieces with the 3rd rung being extended and spelled out for good measure.
The third rung is 36 pips beyond the end point and the total triangle is 50, that is not expected to be reached. Guess where your stop would go.
The reason for the 4 slices has to do with the price’s long term Stochastics: these 3-s were printed in the last 10% of the long term range (shown by Comfort Levels Lucid), otherwise they would be only 3 slices.
The actual high was 1.20106 – which would had meant 8.6 pips accuracy for catching the top – and let’s not forget that you had 23 hours to place the order ahead of time.
The one that occurred on the downside recently had 3 slices, for it was not in the lower 10%. The second rung came into play at 26 pips out. The accuracy was 2 pips and it got its fill 68 hours down the road.
Not sure if you are learning something here, but I think I am. The last move up was an ABC move, and accordingly it did not come with a comparable Wave 3 and Wave 5. C is an even better location to defy the direction for it sets up a lower high (or higher low), but not nearly as predictable how far price shall get.
stoch is iStochastic(symbol,0,9,3,3,MODE_SMA,0,MODE_SIGNAL,i);
Plot a 2 sample RSI on HL2. You can add horizontal lines at 99, 96, 4 and 1.
Zoom it out to make readings more visible.
You should not plot oscillators or MAs on closing prices, they are irrelevant information.
Learn the concept of Flip & Zero.
Flip is an RSI2 reading that is larger than 96 and smaller than 98 or smaller than 4 and larger than 2.
This is new market directive turning your EMAs into safety nets. Counter trades should be kept to touch downs on the 16, the 32 or the other side of Mr. Maroon. The stronger the trend the less safety nets would reverse it back.
The Zero (98 to 100 or 2 to 0) brings about a short term counter move that may not stop till the other side of Mr. Maroon (safety net 3), a 4-hour pivot or the close to other side of the previous range (the overbought/oversold far end). This signal is active not in real time, but upon a relief: once the RSI2 reading drops back below 98 or gets back above 2.
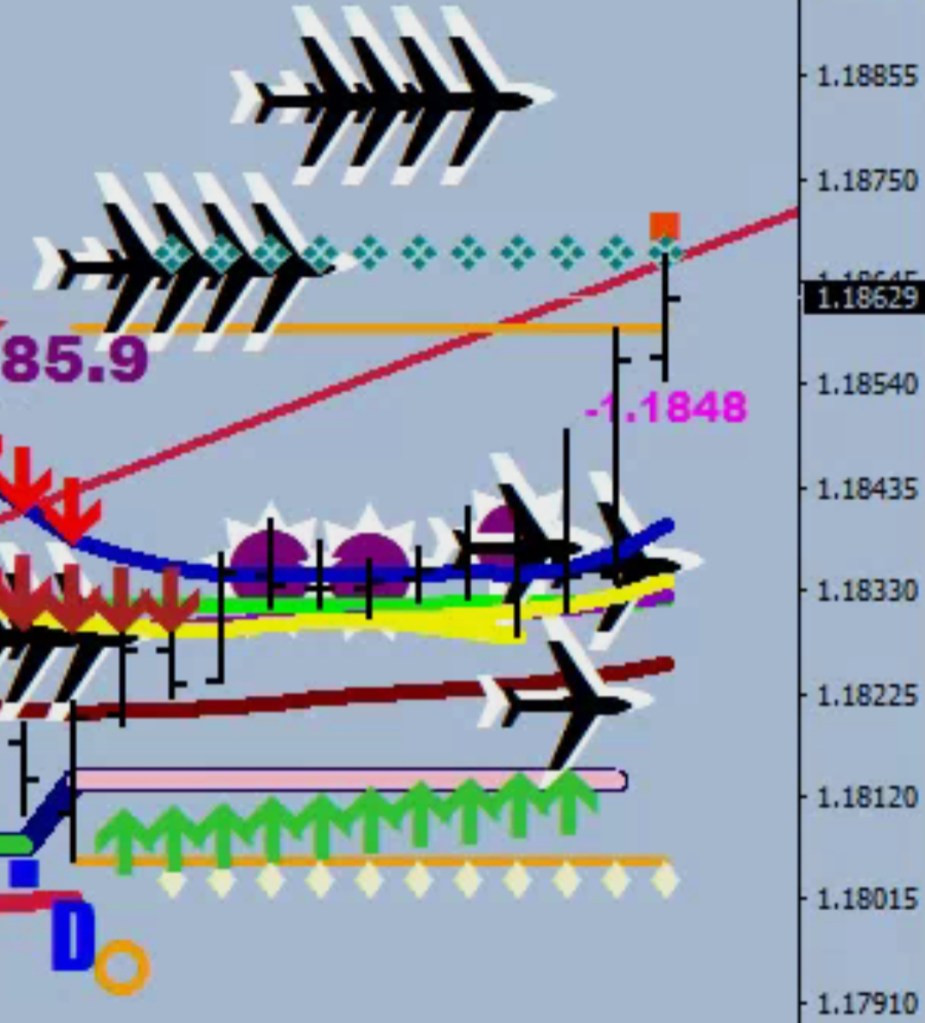
Aeroplanes = 4h pivot: the next resistance when the EMA configuration is bullish and the first 3 safety nets did not hold.
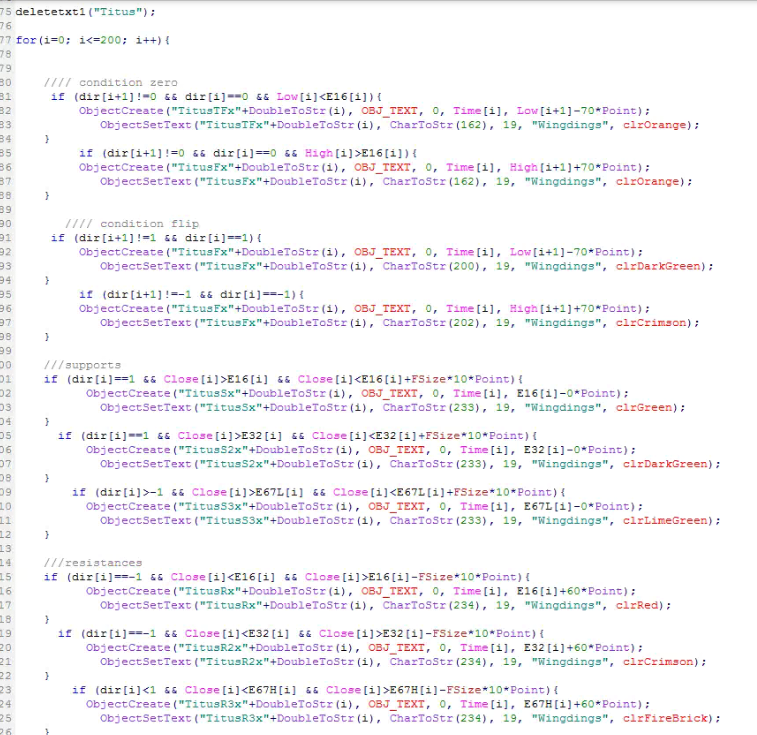
the code should have lines like these:
& if your plots look a little bit like this, you are all set…
Sorry, I don’t have the routine separately only as part of the RSI2 Basic.
…
Image below shows a 5% move: from the bottom of the upper reversal zone to the middle of it.
…
dual color arrows
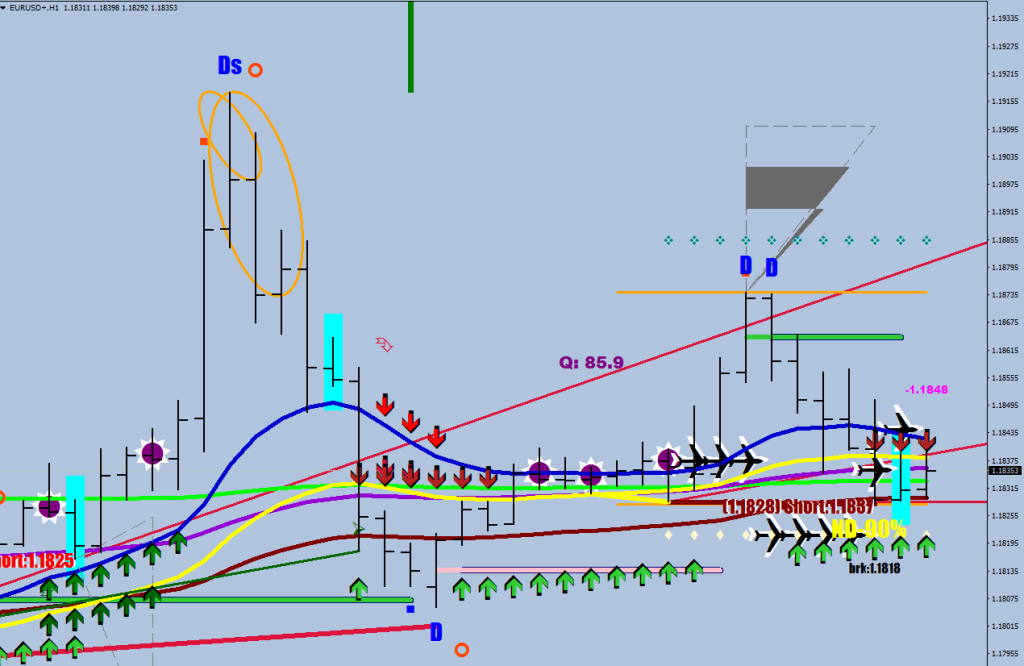
Something interesting: cyan high volume bar on the left got undercut by 9 pips on the move down.
The second cyan high volume bar got exceeded by 9 pips on the upside.
One of them just added to their position. Who was it?
Indicators are the best thing happened since sliced bread. They allow for statistics and applied logic time travel beyond a human’s capability to recall things and to live forever.
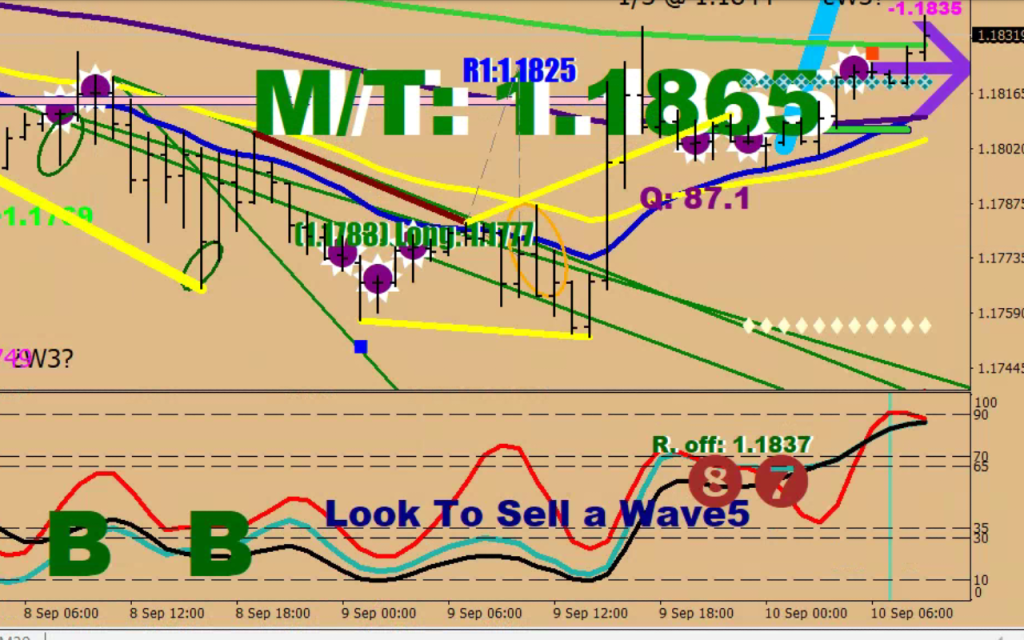
Trading can become a routine done with confidence. On the chart below concentrate on 2 things: the category B Buy warnings and the ginormous numbers stating the Minimum / Target which was just hit. Actually, I missed my time window (sample size) to show the 1.1835 print on the large numbers, but they are still there on the right with the memory function in magenta in small.
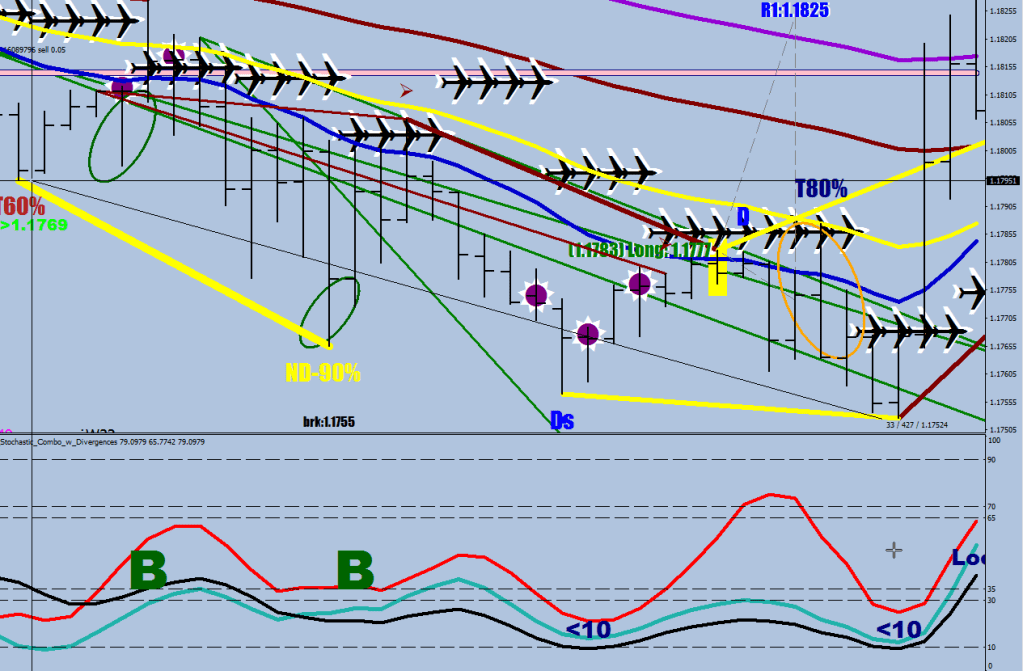
When the green B-s appear, you know that you should start thinking about buying. You need some additional knowledge that the low should not be further from the low indicated by the last B by more than 35 pips – see my Cat B signals video on my channel.
So now you know the exit: M/T, all you need is the where exactly and the when. (Stochastic Combo w/ Divergences)
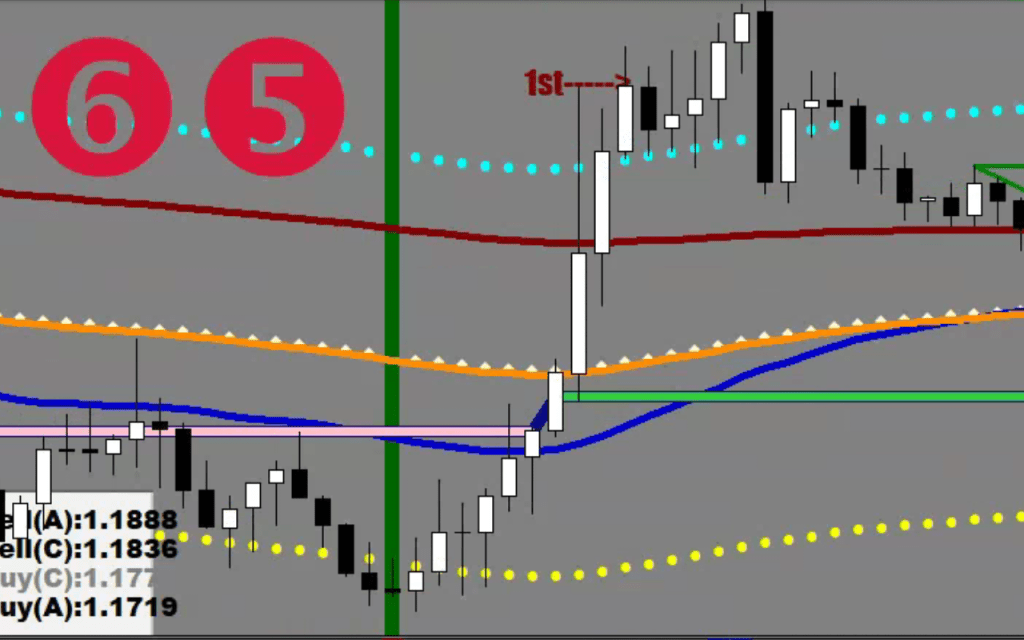
These can be fine tuned with other indicators. The E32 channel can show you where price is out of overbought (below the yellow dots plotted by this Cadillac version of the Stochastic Bars Mixed) and the green vertical stripe came from my 2Fractals routine on this 15-min chart.
The latest tweaks on RSI2 Basic allow me to get the timing right:
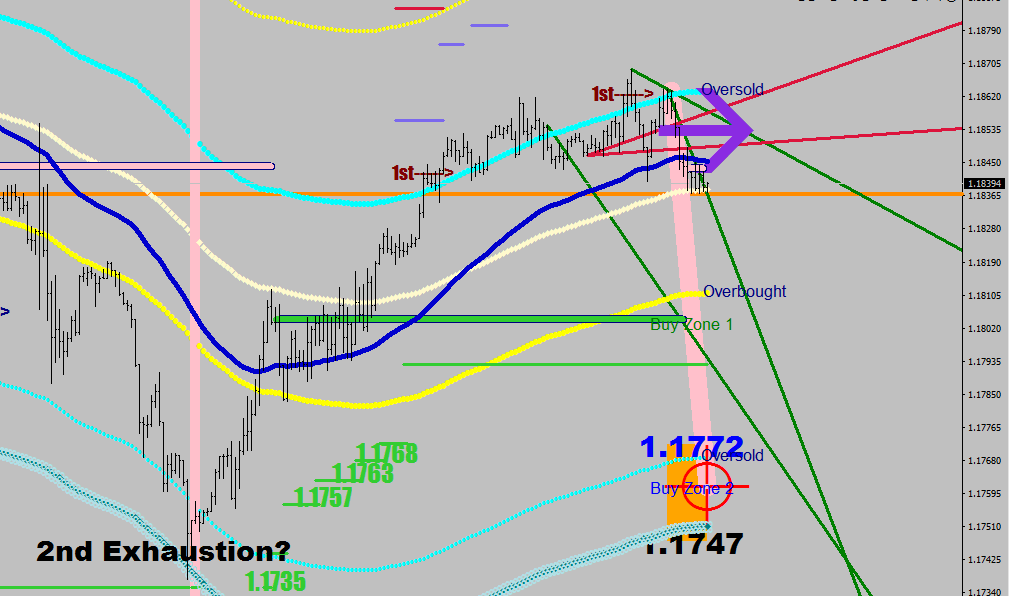
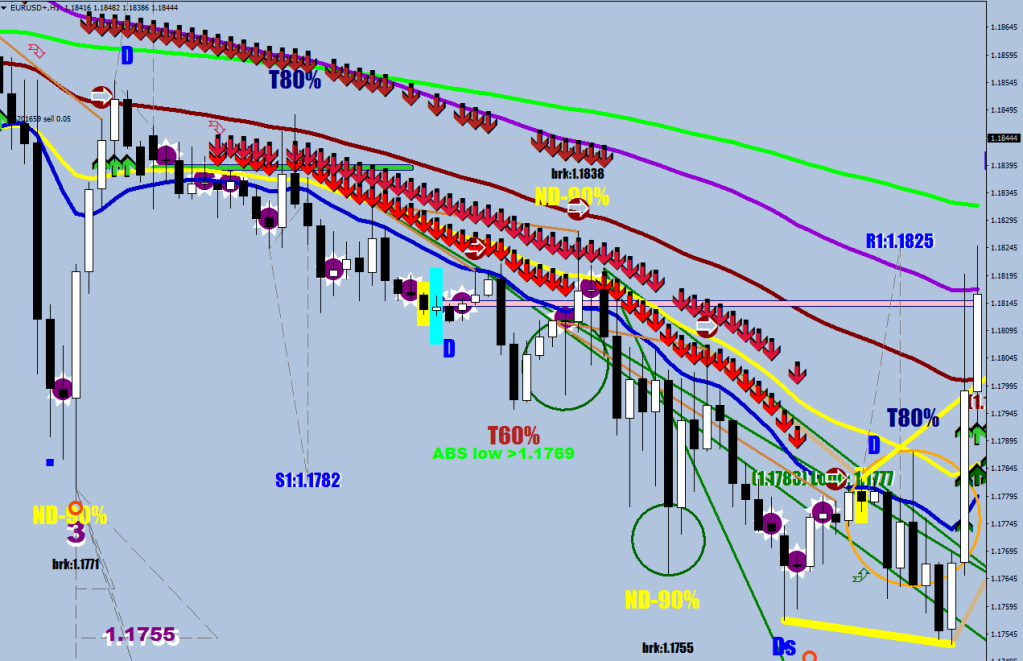
The knowledge to be rolled over here was remembering that a Strong Drive would not normally stand for the end of a move: a thrust would be needed to occur (in 14 hours), and the duration under which the thrust prints cannot exceed hours of strong selling, for then it would end up making another Drive, not a Thrust. Meaning: it is possible to utilize the time constraint knowledge for an entry. For instance, in this case the beat was a measly fake out worth of some 10 pips, and I was picturing a healthier thrust, so my pending orders were not filled, yet this did not stop me from buying at 1.1762 at market when the 2-hour clock was running out.
I could figure the other end of the range thanks to my No-Drive yellow plot inventions and could think into the future in a coherent manner.
How could anyone not value all these additional information versus raw data that does not by itself mean anything?
The only tricky part is not forgetting to look at all these plots and frequently.
…
The buy low was 32 pips below the first BThe buy low was 42.7 pips below the first B’s swing lowCorrection up reaching full charge on the daily. Look out below!ABC move up.E16 confusion – stall