The least likely is a continued selling (blow off move below 2) without a qualifying pull back – a desperate move & somewhat counter productive if you are a bear, for it triggers a 3-point reversal.
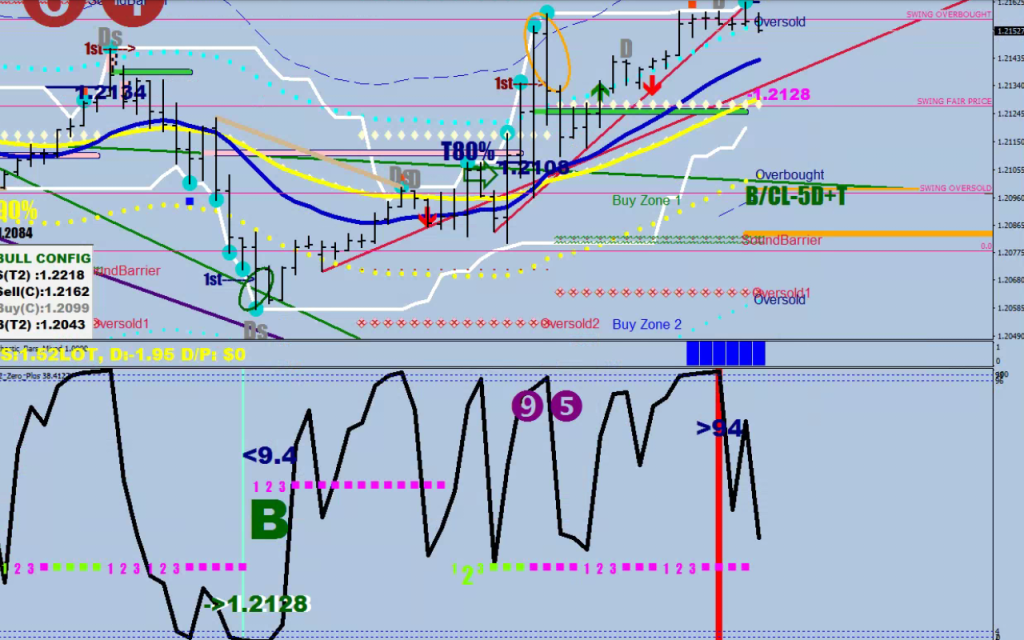
The most likely event is a conter-weight move especially if you are at the overbought end of the spectrum: a Cooper test run that ends when the Crack No hits 94.
The second most likely event is a correction: this looks like a plateau-break, plateau-fade event on the 12-sample bracket.
The fourth, still possible event is a pullback to the E-16, yet not much further than the E-32 before a new lower low print.
The Crack Ho hit above 94. Your turn.
The hint: averaging $33 a day starting on an account balance of $1,435 (on the 30th of July), 2020 is a 2.3% gain daily. If I keep this up, that would mean 575% yearly. My goal is to reach 1000% gains by “my fiscal year’s end”.
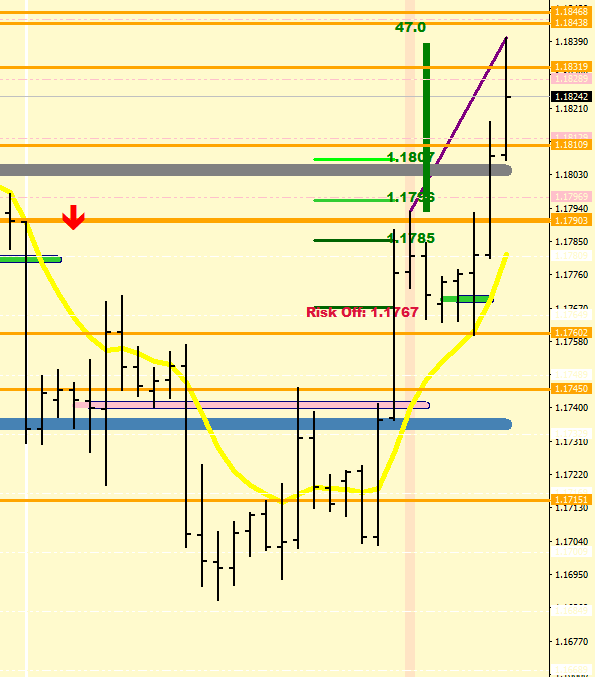
Let me ask you something, how often do you think the EUR/USD gets away from its speed line by more than 47 pips?
I’d say not very often, and it is even more rare that it does so with freshly consolidated overbought / oversold.
Can we agree, that these entries are perfect for a discharge on the speed line?
I may just have found the best scalping idea that could even be automated. It is semi automatic as it is, I enter the trade with the right stop loss code and my Trail Stop routine relentlessly starts adjusting the target 2-pips beyond the current E-16 HL2 value (0.5 for longs, 5 for shorts).
No, those below did not occur with a fresh overbought, this was a re-entry.
Now, quick remarks about the mean reversion. The idea is always the same, only the MA changes.
I did get 1 like for it, nothing to complain about. The fact that the low was 1.2078 was just a lucky coincidence with the 3-day ATR measured from the consolidation level.
Today’s new invention the wick highlights (see above) brought no appreciation although I was even considering to elaborate on how I foresaw the mean reversion playing out.
This was exactly what I had in mind. A normal mean reversion has 2-3 days to play out. The move from the dashed line (4x stretch from the mean) to the grass green (1x stretch from the mean) was 3x fluctuation maximum. You can figure the rest.
People cannot appreciate a good thing even if it is in front of their nose. Excuse my frustration.
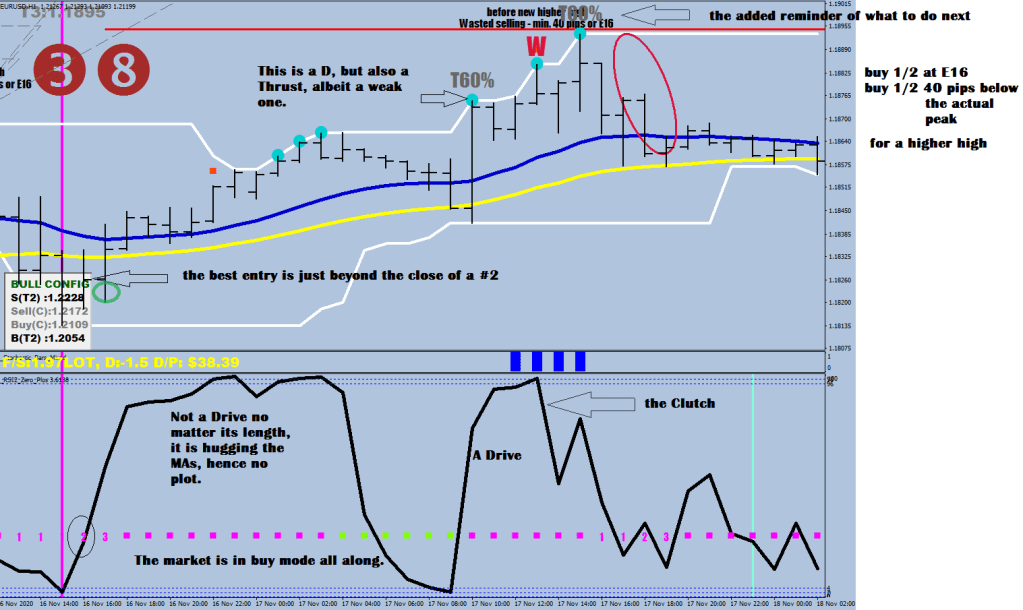
I’ve been calling the W a gear shift, but really what I meant with the actual location was pressing the clutch.
All of the subsequent conditions require the market having seen a “T” or thrust in the last 3 to 4 hours.
Exhibit A
A drive is RSI overbought / oversold for more than 2 hours and has reached velocity (separated well enough from the core MAs).
Let’s see how that one played out:
Exhibit B
The opposite side is the latest addition. The text plots change based on being in the comfort overbought or not. Here the bulls have the upper hand, so no 40 pips slack, merely E-16 in play.
Exhibit C
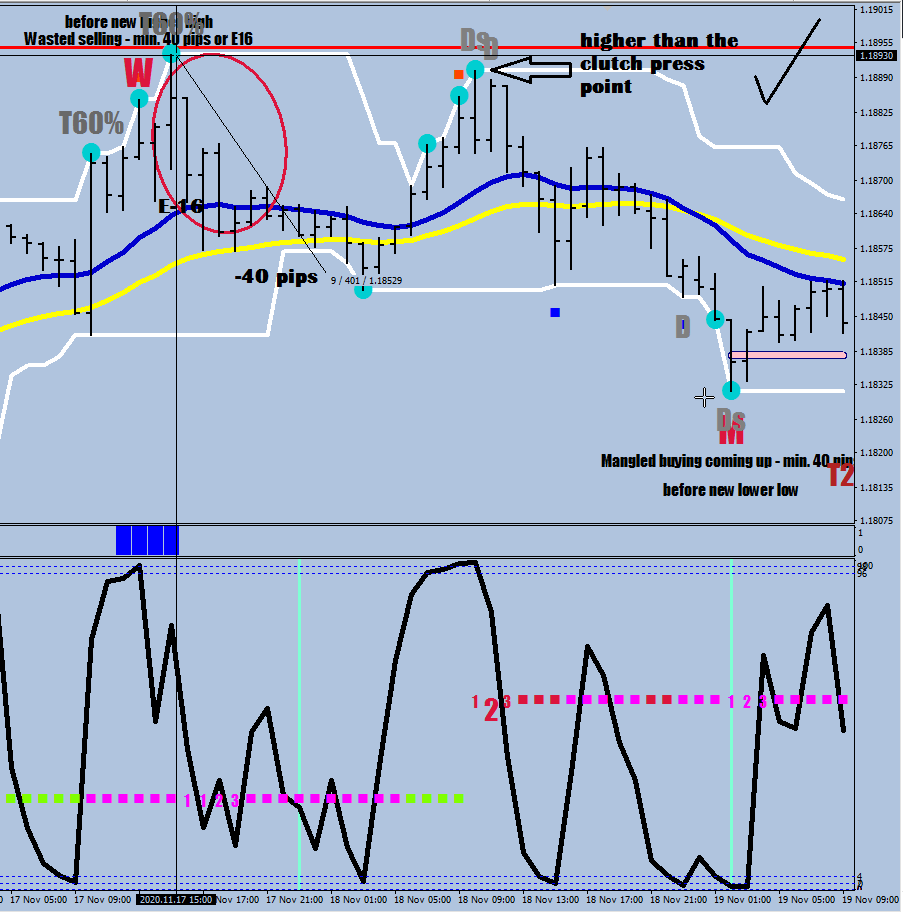
The total pullback on the first W was 53 pips, so that would mean 13 pips draw down on the 40-pip entry and 20-pips draw down on the E-16 entry. Could you have added more? Certainly, while W-s keep popping up it is safe to buy the pullback, all the way until…
Exhibit D
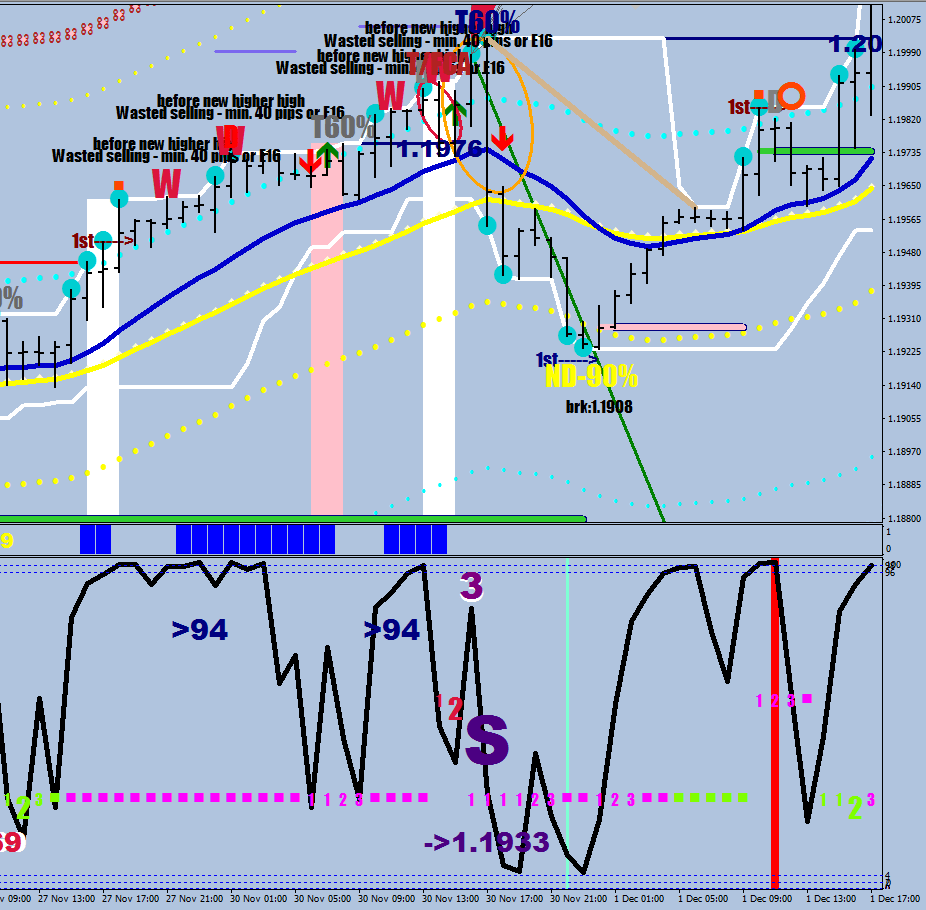
…until a serious Thrust in technicolor: this time it is different.
As you know the Wave 3 – Wave 5 beat projection was trumped by the freshly printed new, ND (No Drive root).
Exhibit E
Things are running red hot. There were 2 discharges above the Overdrive line. Can you be still trusting the clutch?
Yes we can! No change!
( I have changed the color to RedOrange since, Crimson on Crimson wasn’t the best color combination.)
Exhibit F
One more time a Clutch press and a 43-pips pullback for a higher high after a blow off top? Retest, yes. All in order. Currently the market is tempering with the No Drive’s break level. What a tease!
A Mangled buy (meaning a continuation sell) would require a move back up to E-16.
W is a new 12-sample high without follow through with a thrust bar 3 or 4 samples earlier.
if (i>0 && High[i]>(iHigh(symbol,0,iHighest(symbol,0, MODE_HIGH,12,i+1))) && High[i-1] iMA(symbol,0,67,0,MODE_EMA, PRICE_LOW,i)-120*Point){
           if (tup[i+3] || tup[i+4]){
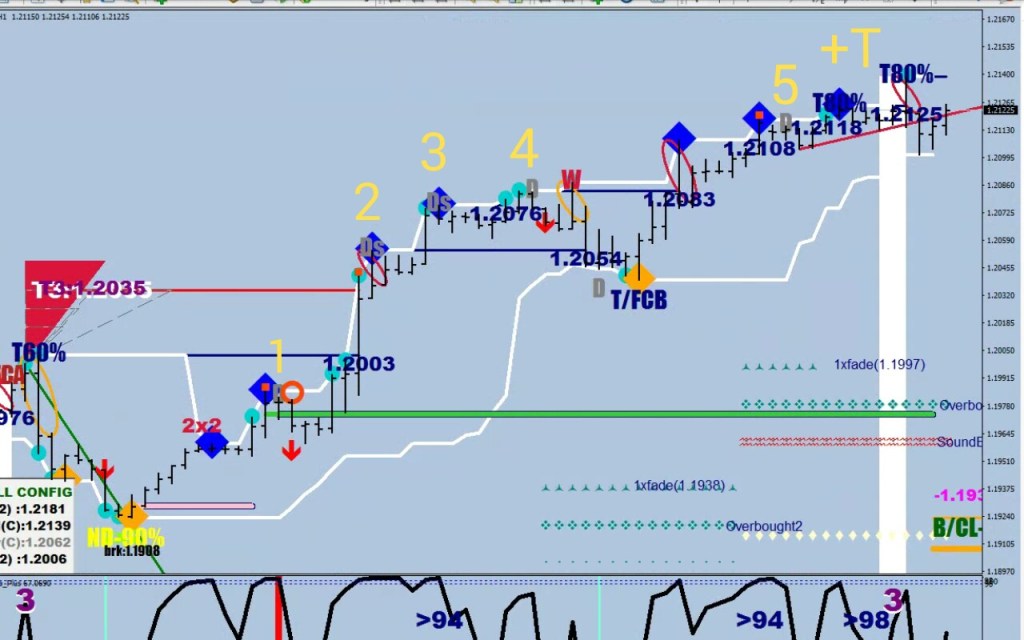
You submitted the following image for a long entry:
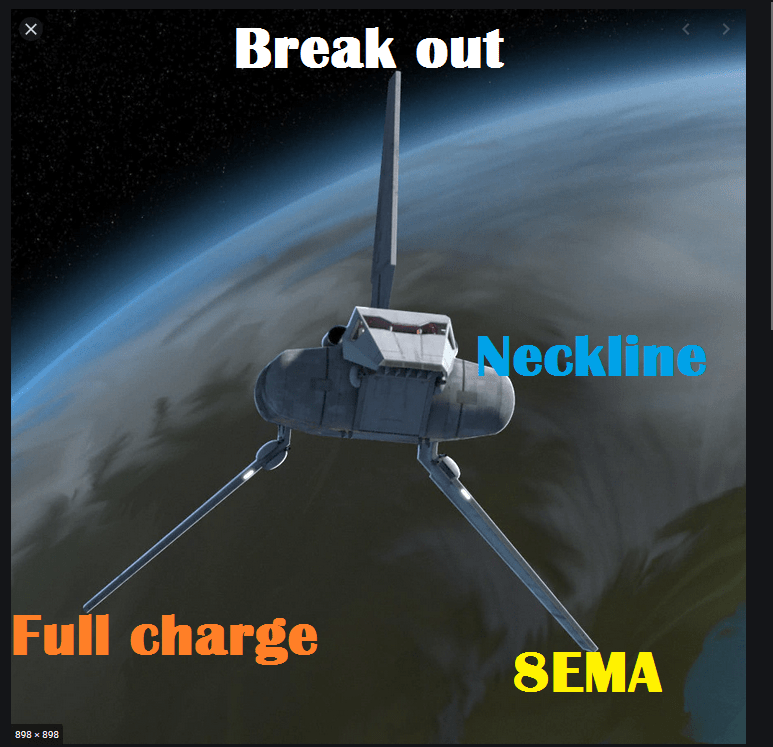
The 4-hour bar was picked correctly, but what is important here is the horizontal level, the blue diamonds representing the overbought. The high charge and the 8EMA alignment are important, but crossing back above the overbought neckline is the confirmation / trigger. Below that you are jumping the gun.
To show how the No Drive root results in 5D+T from recent history this was the right image, well done!
As a remark, just as No Drive has a 15/20 pips moratorium depending on comfort overbought/oversold or not, the Thrust also has this feature (20/36 pips – the blow off would prosuce that), and can happen multiple times with some offset before the settlement is final. The actual top came in at 1.21749 cca 36 pips above the 2nd thrust – no surprise.
Now, let’s talk about why 94 won’t be like 94.
RSI2 Zero+ comes with these plots that are based on the Crack Ho (60,3,3) STOCH D.
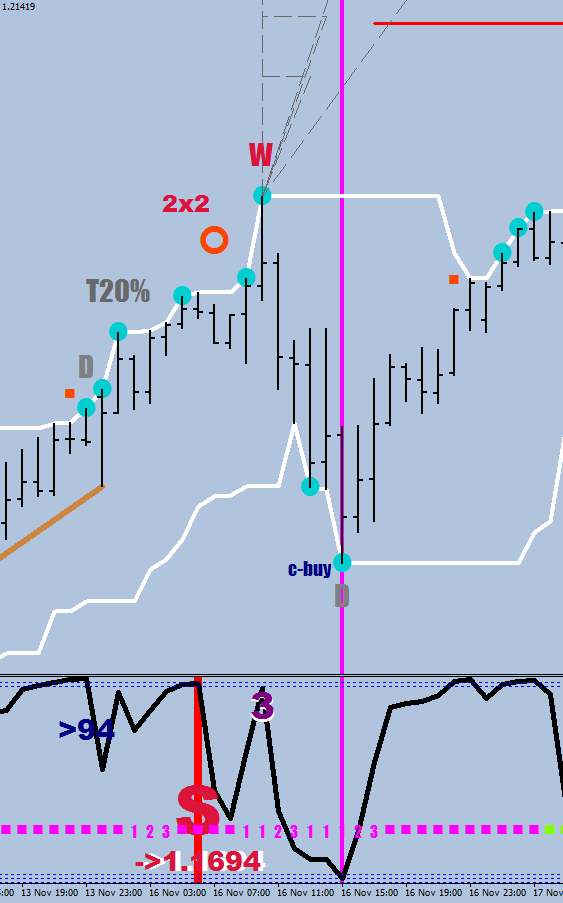
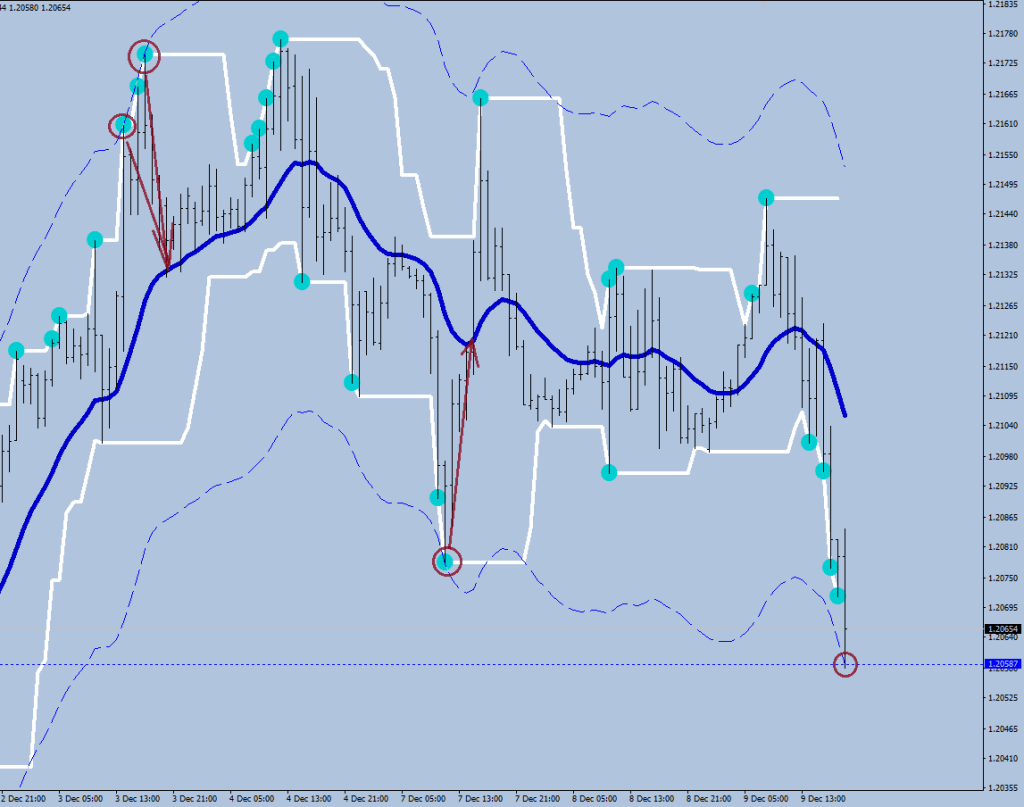
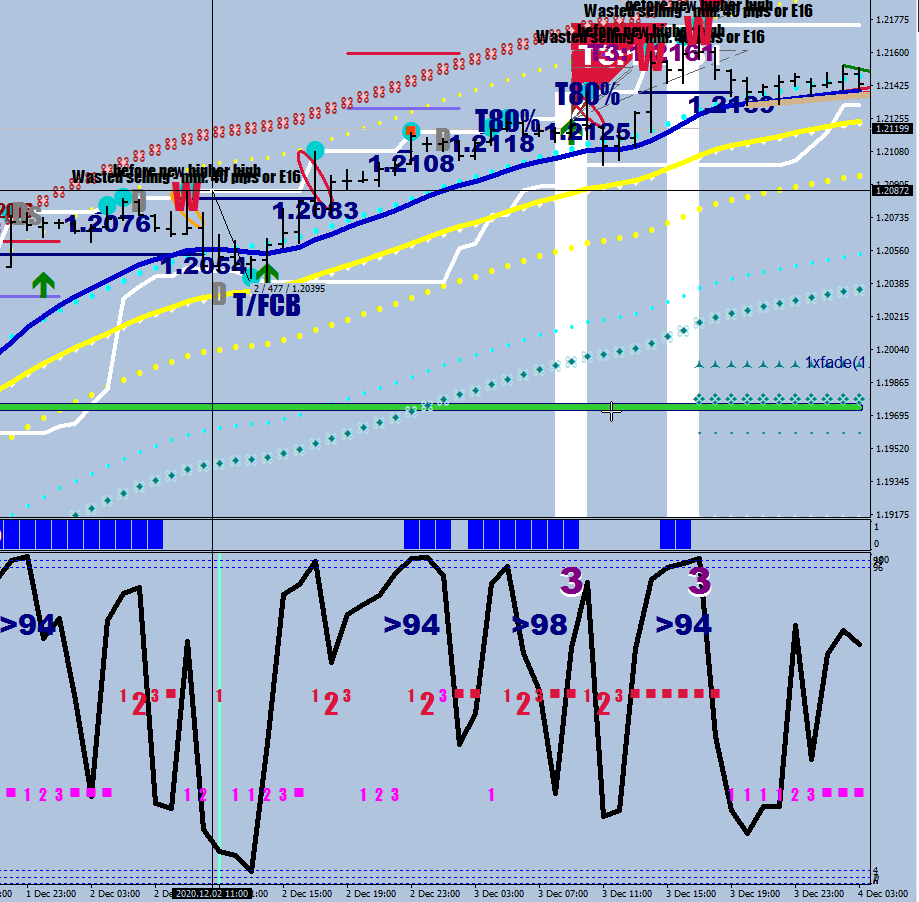
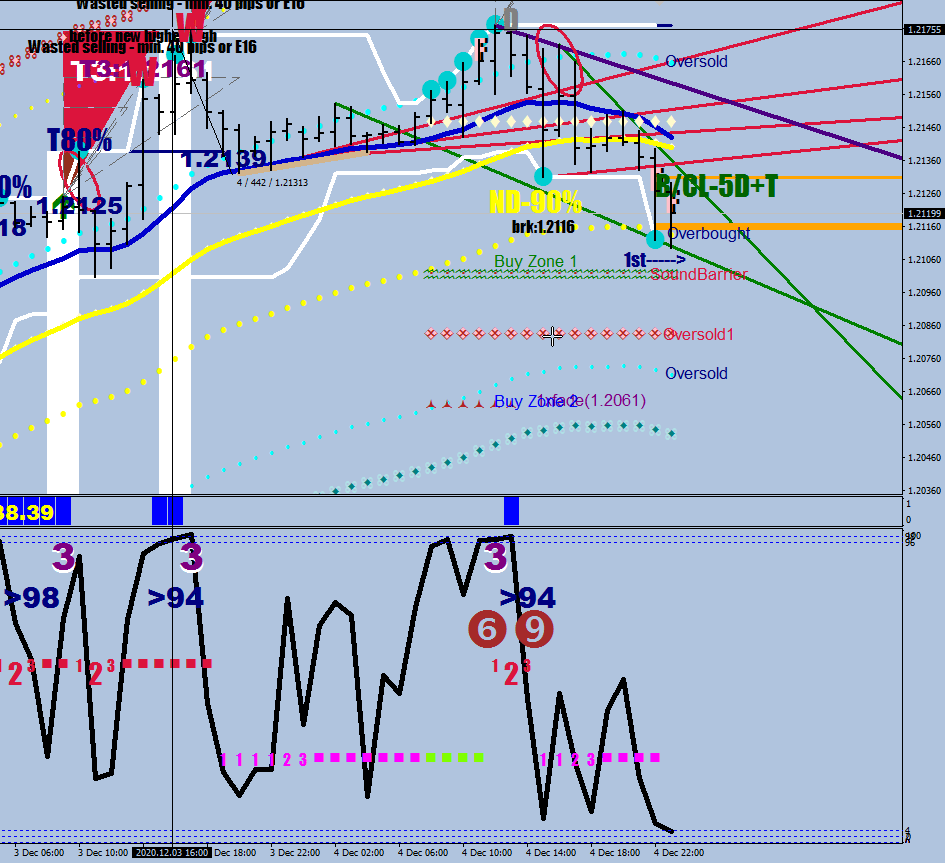
The first guest appearance of 94 resulted in a gear shift and an ABC move down (shown by the dots on the 12-sample bracket).
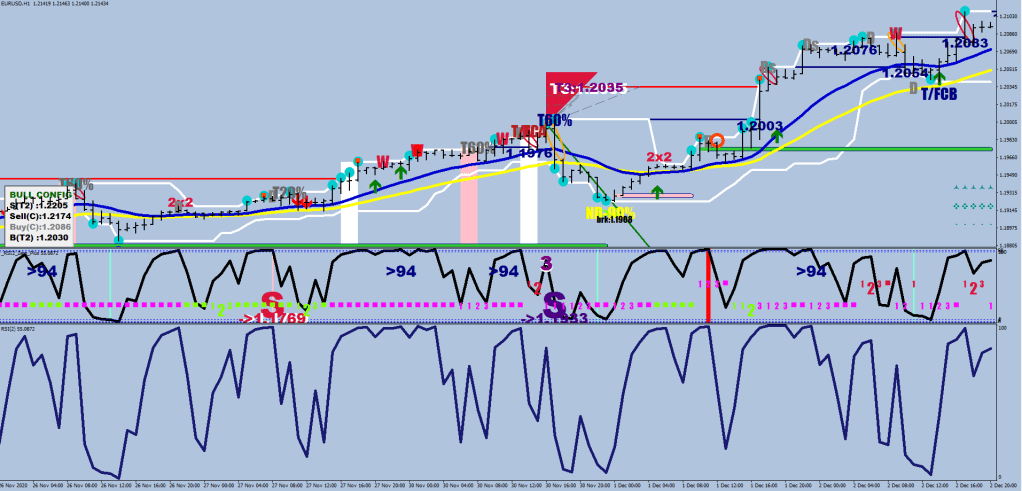
This was a correction – to warm up to the subject. The following image is to show that when you get back to back 94 readings, every second one would result in a pullback that normally ends between the E16 in blue and the E32 in yellow, but does not exceed them by much. Find the pullback between the 2 corrections!
The next sequence accordingly should be: pull back, correction, pull back.
But what happens when the next 94 won’t be 94, but a 98? No correction for one, and a blow off top with a divergence back down to 94.
I swear I am not a Star Wars geek, I just got lost in the rabbit hole of figuring a funny name for a trafing firm: Darth Fader Corp would be basing its trading on a Fade in the Starts and beyond and could have a company logo of a stylized tie fighter.
The Point of No Return is when scammers start multiplying on YouTube by halving.
You are here for a lesson in hedging.
The Point of Known Return is at about 10 pips into the overbought / oversold end of a constant consolidation rage. This means that there are no larger and smaller consolidation zones (only partially explored ones).
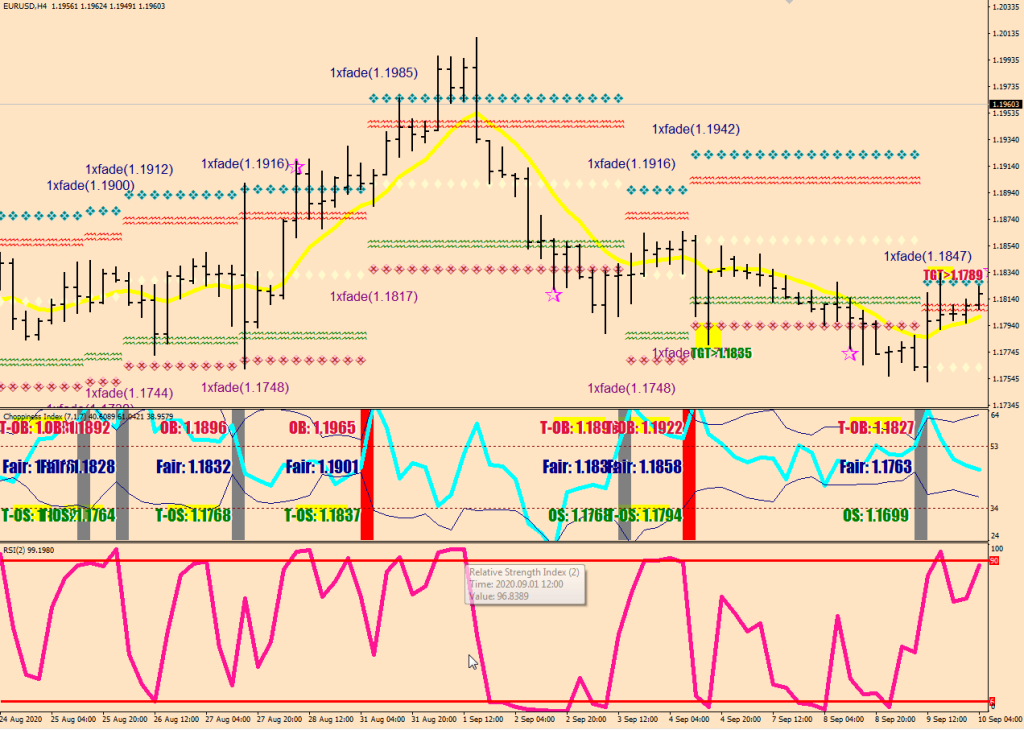
After hitting the star in the sky the suggested long / long hedge entry should had occurred upon touching the 8-EMA while the CI was displaying mucho fuerca. There was an additional move of 10 pips beyond the actual location of the PONR before turning back. The RSI2 low was at 34.02. Price had to come back up through the overbought level for a confirmation after touching the high charged wire.
The exit required a new consolidation consolidation range to be displayed, the RSI set a peal at 96.83 – the prior tick was 96.77 despite of looking flat and all of this took place in the new overbought area.
There was no star in the second overbought field – see the code that is looking for a fresh penetration into the overbought field within the next 10 samples.
2.
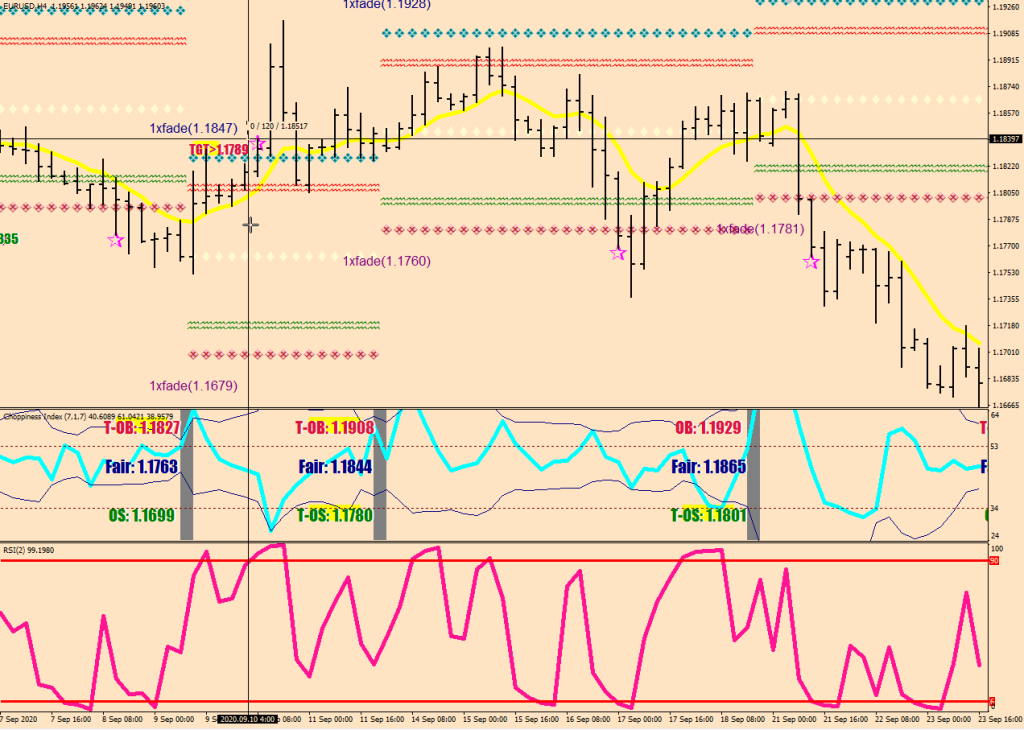
Entry: star was touched. After a consolidation whip move that took price down by an additional 35 pips at the peak, energy got high, the 8 EMA was touched and price came back down through the trigger oversold level.
The entry was valid, but there was a back test move 55 pips lower that could had been utilized for an exit, but a deeper, more decisive penetration occurred later on. The RSI2 was showing a reversal divergence on that low.
The second star in the same direction should had been ignored.
3.
This one was a difficult one. Price kept on going for 80 more pips after seeing the star. For participation to the upside you would have had to go long say 12 pips above the high of the penetrating 4H print, and exit on a 99+ RSI2 print or in excess of the sound barrier represented by the water sign on the left. What you learnt with this example is that your size would have to be such that you do not get a margin call for your holdings even 90 pips into the current overbought range.
4.
We seem to have an example for everything here.
By printing the star, the direction was chosen. There was an additional 32 pips beyond the PONR Star. The three ingredients, a) high charge, b) EMA c) crossing back below the oversold level were the entry requirements.
The first RSI2 reversal divergence was broken if you ditched your position on it, you would have to go in again upon breaking it – twice in fact and the party wasn’t over until scratching the Sound Barrier for an exit. This exit was a very good counter entry as well.
What this move taught you is that a hedge has a roll-out function.
5.
Stary sky on the way up. 24 pips extra continuous motion before the 3 ingredients coinciding for an upside entry.
There was 90 pips to be had, after ignoring the second star, the second push into the new overbought came with a lovely RSI2 reversal divergence for an exit.
After this there were some maximum range moves without hitting the stars: just into the oversold prompted the TGT print in green – which was meant to say TGT1, for TGT2 would be the middle of the consolidation range as in LemonChiffon color Boulder Dash diamonds, and TGT3 anything beyond the high tide waves of the sound barrier. Of course, these moves do have the potential to turn into something more.
6.
This was the trickiest Star Sky yet, for it came with a Hutch. 28 extra pips first. Arguably there was a valid short entry with the 3 ingredients coming together although the charge was on the week side by being below 53.
A protective exit stop loss does make sense just beyond the entry upon seeing 3 closes below the oversold level.
7.
The run-up on the same image was the runaway kind. Your 12-pip-out beyond the printed high would had meant a pending entry placed somewehere between 1.1799 and 1.1804.
The run-up ended in an exit RSI2 divergence that was not broken if you put the continuation 12-pips out and your broker was not the hairy-hearted one.
8.
The Star level was pressured by 14 pips on the move down. The entry was the confluence of the 3 ingredients.
The exit was the RSI2 divergence.
Notice the spike low later dipping into the previous water mark.
9.
The first run-up entry had a 70 pips pain to the upside. This was not an easy play for if you put a 12-pips out entry above the high, the remaining meat on the bone would had come to 15-40 pips. Not terrific & major heat up and down.
The second entry was coming back through the overbought level and since the energy was in a recovery move, there was no high reading for the 3rd ingredient. Nevertheless, the prior water level would had worked exquisitely, all the way to the next water dip exit on the other side.
10.
The water dip to water dip theme kept on giving, and even the Star pull back – 3 ingredients came together in an unusual sequence for an entry. There was 20-pips of potential pain beyond the PONR Star if you waited for the energy to get high enough.
Exit – plain and simple water mark RSI2 divergence.
11.
This bring us to where we are now. The star entry wasn’t a terrific one on the left the TGT prompt took the price back to the previous Boulder Dash mine of TGT2 before resuming to break 2 more times above the overbought level resulting in an RSI2 divergence exit with 30 or so pips or a 40-pip draw down on your hedge trade before a water line exit of 40 pips in gains.
12.
The last water mark dip originated star add-on entry on the second overbought 3-ingredient entry also was dragged down 34 pips before making 40+ into the high water level.
In conclusion, Hedging is just as good of a pseudo science as any. Yet, you have to try your best. & so the Choppiness PONR periscope was born today for future stargazing.
…
Here, at the Institute of Hedging, we charge you 60k for a course, take you to the Bahamas and make you engage in extreme sports i.e. making you hanging upside down from a flying hydroplane to make you feel absolutely certain that you can hedge. If things don’t work out – oh well – at least you had an expensive holiday that at least we could enjoy (Oh yes, we live).
I want to point out two pieces of useful information today.
1st: it is helpful to understand a level that does not have a plot of any kind, yet is very informative in trading.
Try not to pay attention to the yellow high lights, they have their own logic, but don’t take them on as your bias.
Pay attention to the relationship between the ovalled numbers and the levels where the market throws in the towel / is experiencing great difficulties to proceed.
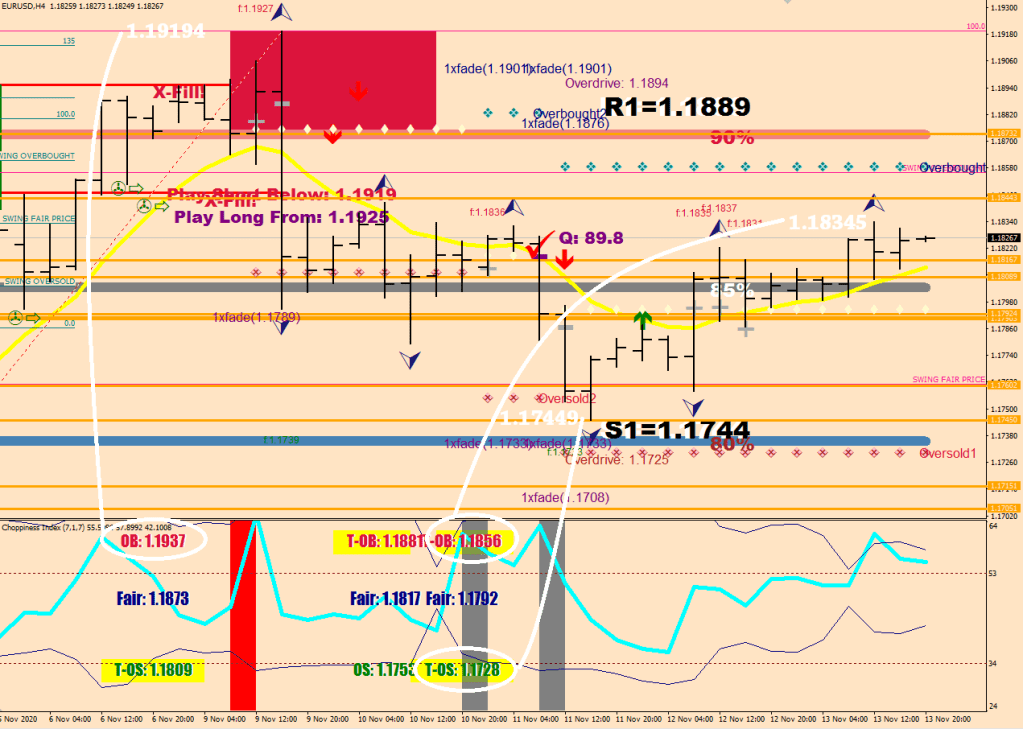
Actual high on Friday was 1.18368 + .002 = 1.18568 – circled white.
If you came up with an approximate number of 20 pips shy, congratulations.
This distance is the instrument dependent distance from the consolidation weight known as fluctuation maximum (I refer to it as sound barrier on occasions). Only a Wave 3 has the ability to clear this level.
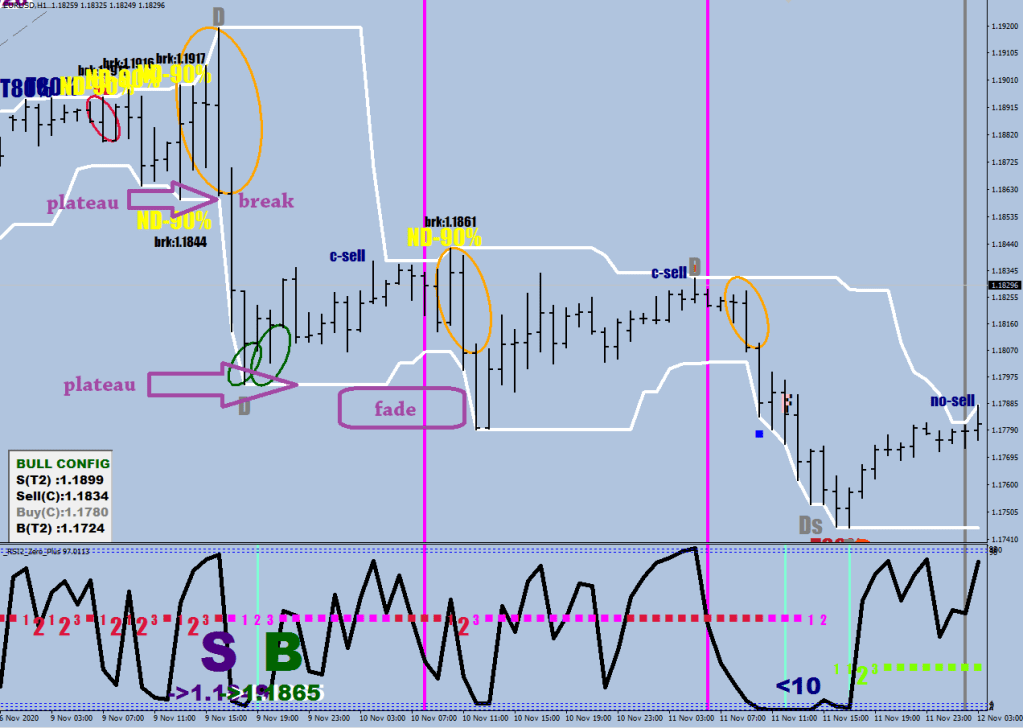
2nd thing is the 12-sample bracket. Learn to think like this:
Plateau – break; plateau – fade
When you had two of these occurring back to back, try to suspend enforcing continuation sells / buys
…
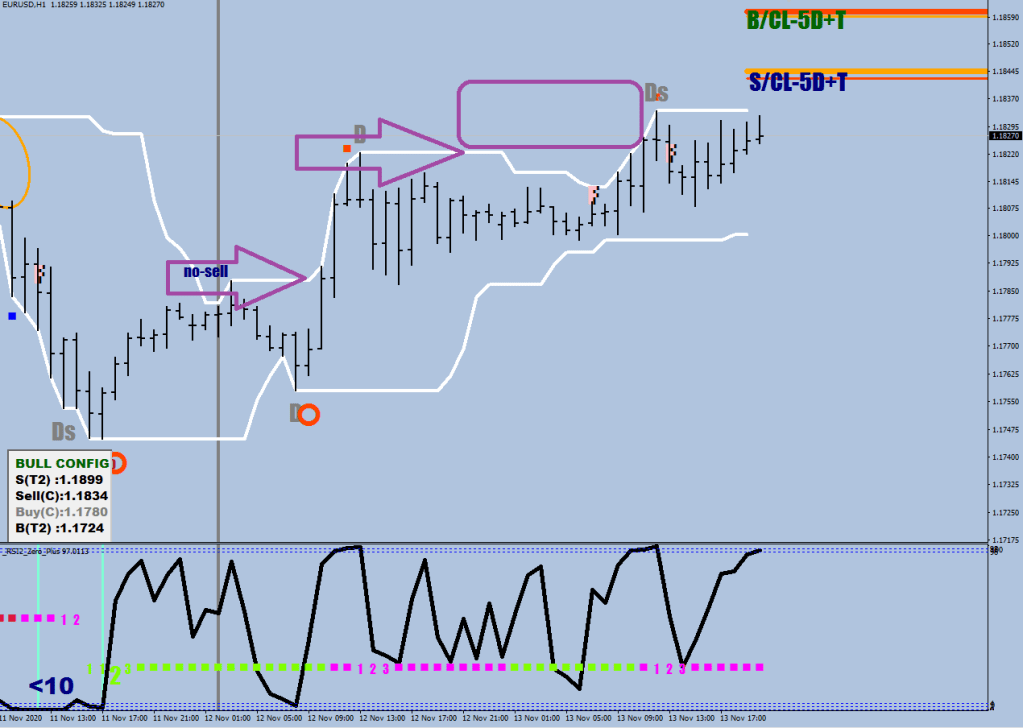
an example from the upside as well
You had 5 wolf cries before the the moratorium of the last NoDrive call choked and reversed price for good.
property copyright "by Macdulio"
 property link      "forexfore.blog"
 property description "12-sample high & low"
 property indicator_chart_window
 property indicator_buffers 2
 extern int lookback = 300;
 int       Range_n=12;
 double HighBuffer30[];
 double LowBuffer30[];
 //+------------------------------------------------------------------+
 //| Custom indicator initialization function                         |
 //+------------------------------------------------------------------+
 int init()
   {
 SetIndexBuffer(0,HighBuffer30);
    SetIndexStyle(0,DRAW_LINE,2,4,White);
 SetIndexBuffer(1,LowBuffer30);
    SetIndexStyle(1,DRAW_LINE,2,4,White);
 //----
    return(0);
   }
 //+------------------------------------------------------------------+
 //| Custom indicator iteration function                              |
 //+------------------------------------------------------------------+
 int start()
 {
 int    i;             // Number of counted bars
 string symbol = Symbol();
 ArrayResize(HighBuffer30, Bars);
  ArrayInitialize(HighBuffer30, EMPTY_VALUE);
 ArrayResize(LowBuffer30, Bars);
  ArrayInitialize(LowBuffer30, EMPTY_VALUE);
 //--------------------------------------------------------------------
    for (i = lookback ; i >0; i--) {      HighBuffer30[i]=HighBuffer30[i+1];      LowBuffer30[i]=LowBuffer30[i+1];      HighBuffer30[i]=iHigh(symbol,0,iHighest(symbol,0,MODE_HIGH,Range_n,i));      LowBuffer30[i]=iLow(symbol,0,iLowest(symbol,0,MODE_LOW,Range_n,i));   }
 return(0);
   }
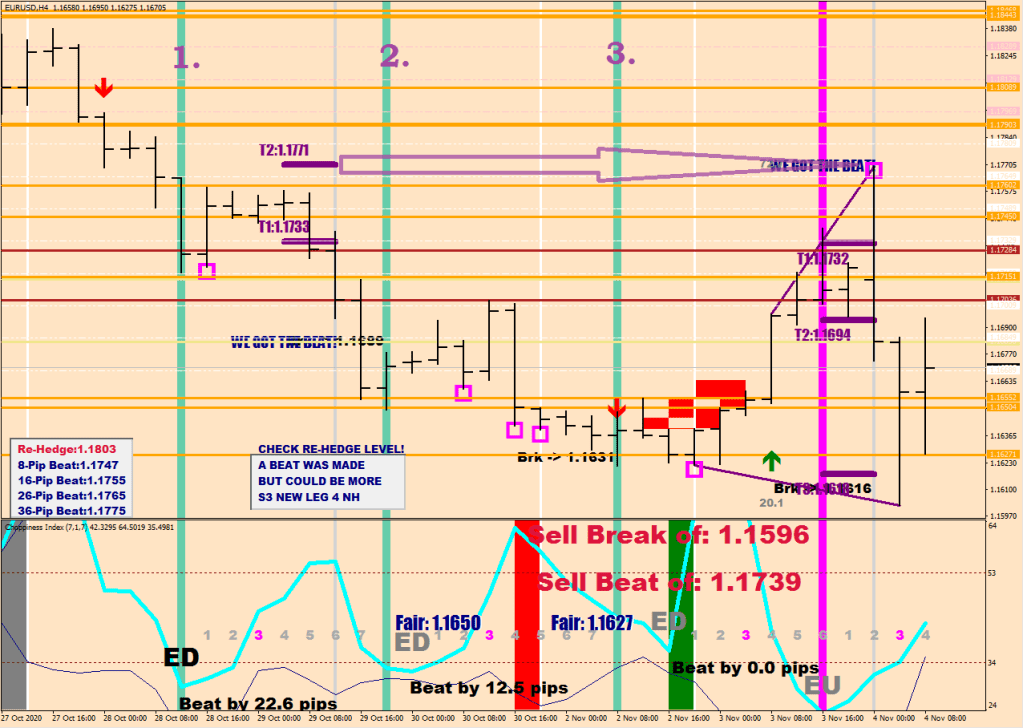
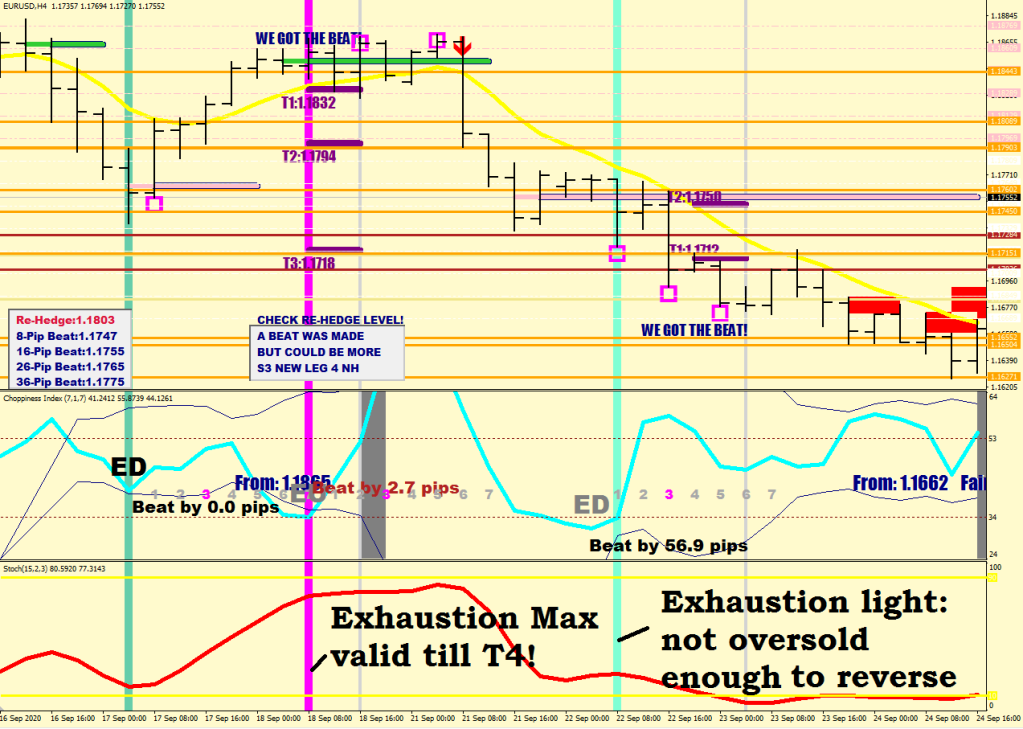
What is going on with the downside, why can there be multiple exhaustions and which one to take seriously?
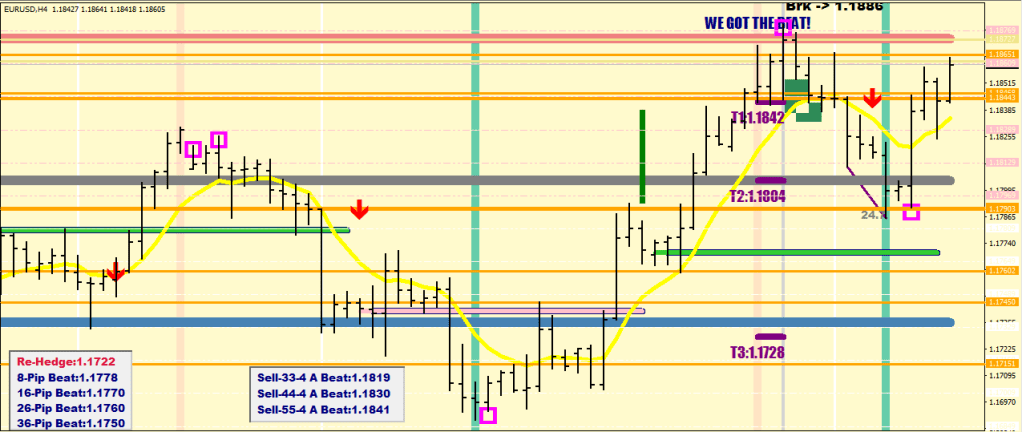
The picture below shows 3 deep exhaustions. Any of them could had been final, but something was missing. What?
The beat of the first exhaustion provided the target level of 1.1771. After that I was not curious of the beats. I wrote the routine like that intentionally.
You have to move the exhaustion low to the 1H chart in your mind, and then tell me, what did not happen all the way down from 1.1728 to 1.1640-?
There was no thrust, so the low could not be trusted (the white stuff).
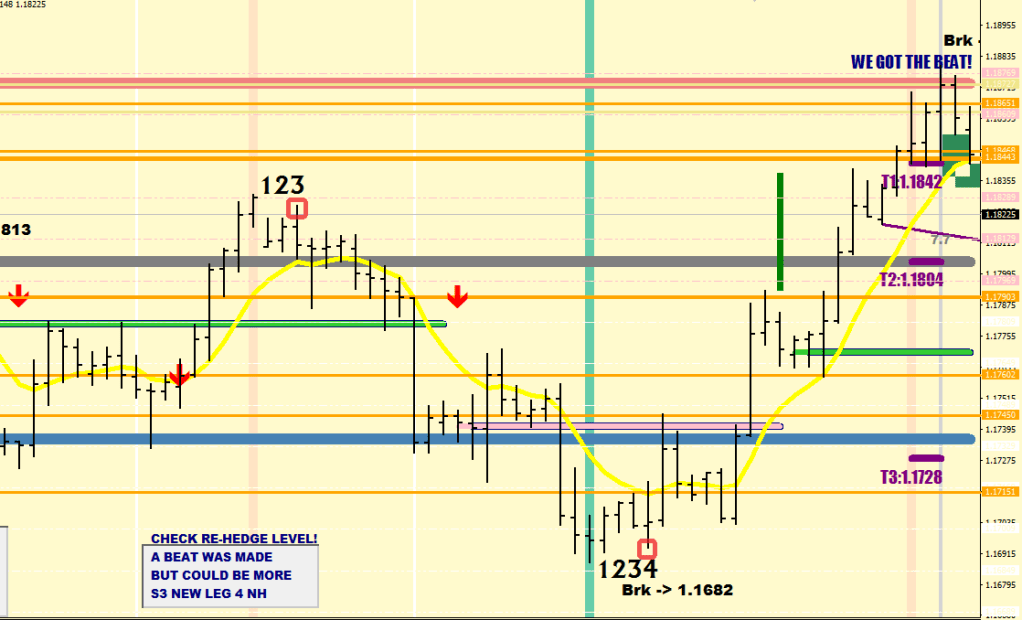
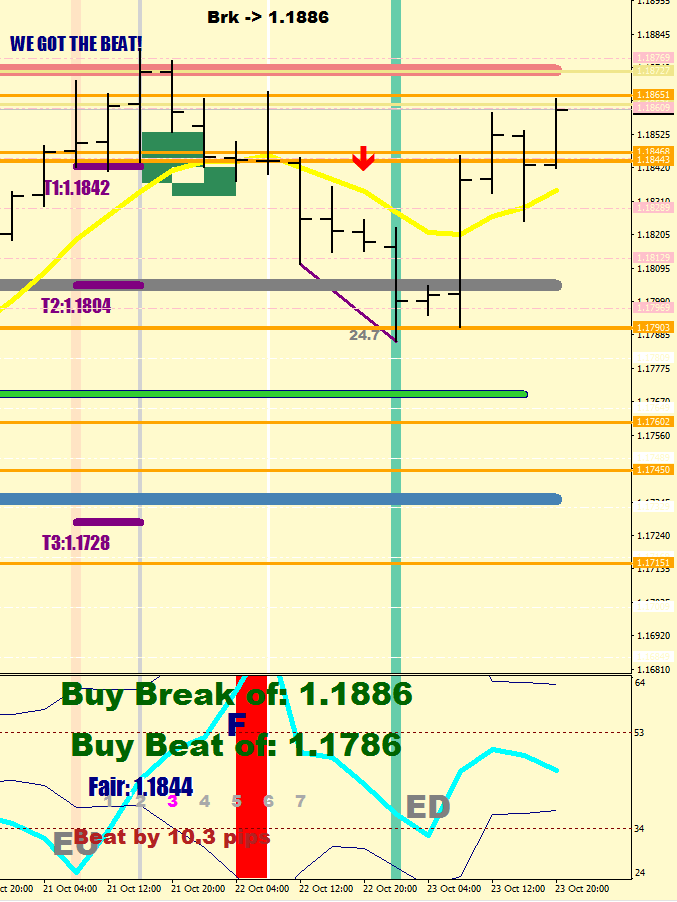
On the way up the beat coincided with the thrust. T3 was filled.
So what’s the Level 3 answer for finding the market top / the market bottom?
This is a Level 3 article, no outsider would have a clue of what I’m talking about here.
Trading Menu
1xFade – scale in with large size, target 20 pips+ from entry. Exception is when the call levels had no effect in the opposite direction.
Driven Thrust + Full Charge (Pink F) – Target T2 if Wave 3, Beat if Wave 5 ___________________________________________________________________________
Exhaustion Beat / Exhaustion + Beat Attempt – play the decisive direction according to color depth and to final or intermediate status target beat-T2(700+), beat-T3, beat-T4.
Fade T3 failure target Green Mean, OD(T2)
High charge + Swing Fair price failure – continuation move trade target the new Fade1.
A Bottom / A Top Continuation trades & swing overbought / swing oversold target opposite 20/80, OD(T2)
Fade T2 (overdrive) failure after Crack Ho 94+ or 9.4- print target 0 Lucid, Green Mean.
Sophistication comes with being able to distinguish between say a top and thetop.
After a top you want to be playing the upside still by buying low, while after the top you want to sell high. This is where all tend following systems would end up putting you on the wrong side.
The spohisticated method is plotting a CI DV on a 4-hour chart to find exhaustions, beats and beat attempts and making a stochastic (crack ho) comparison to find reversal divergences.
The following image shows how to spot a beat attemp – for the beats are automatic plots anyways.
On this image you are looking at the top, the bottom and the top (the last one had a valid beat).
The next step is to make the comparison. The Crack Ho would come out to be a 15-sample high-low stochastic signal with 3 smoothing and 2 delay, but that’s a bit crude, so I would look fir those two wicks on the hourly chart and use the Crack Ho straight up.
There is one more thing. The exhaustion itself has to be qualified by the Crack Ho being above 90 or below 10. Otherwise you are looking at a top or a bottom by default.
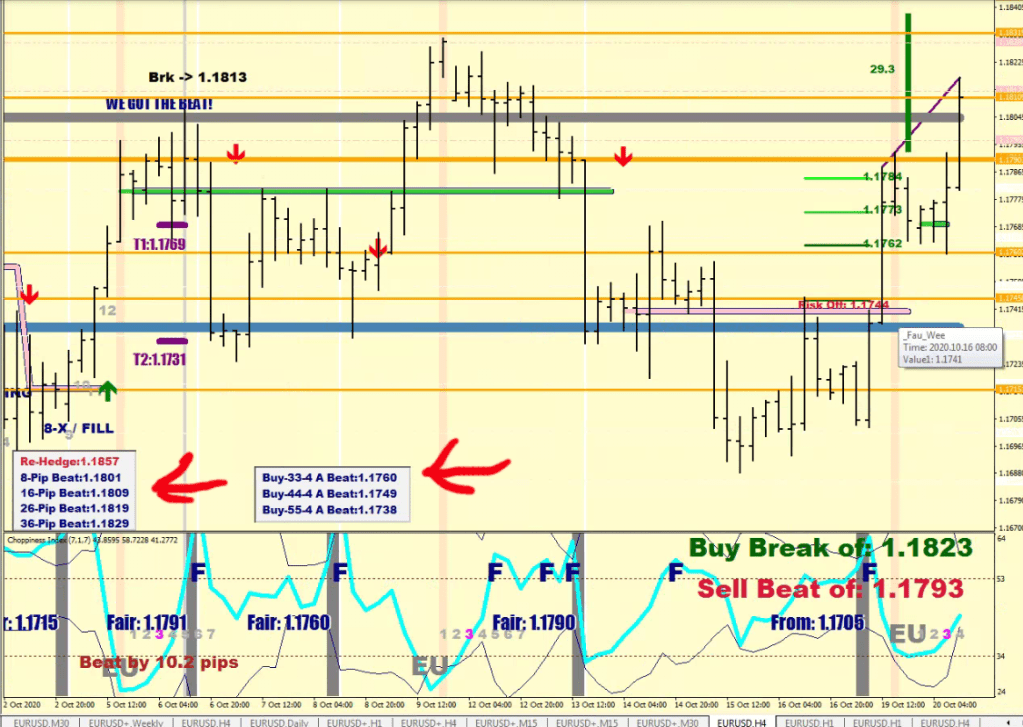
This is how the exhaustion (second image) on the left that coincided with the beat represented a top and thus the T2 target wasn’t hit versus the one on the right which was the top.
What is the number one concern for your trading account?
Stayin’ Alive!
If you could have only one indicator to make decisions about where to open a trade, what would it be?
Choppiness-Mac, that’s right.
Ready or not, here I come!
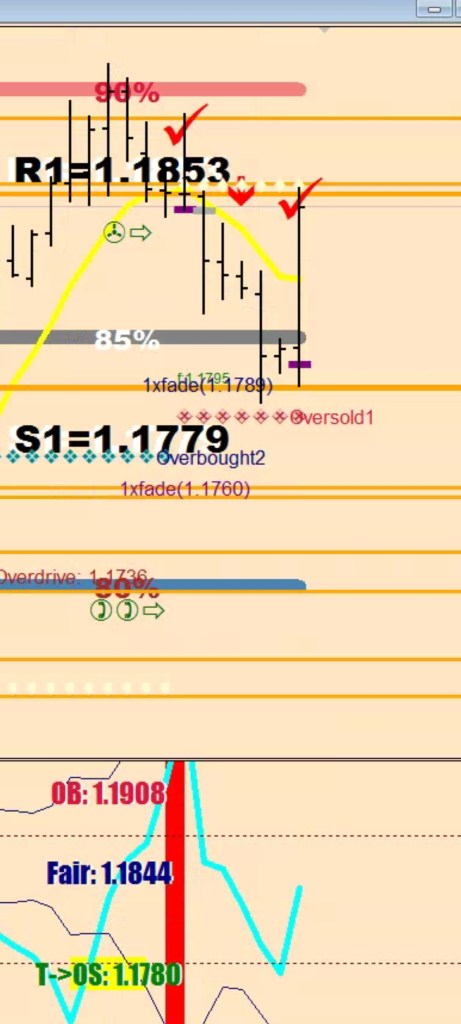
The 1x fade got a plot correction based on the Fugees “one time” count.
20 pips into the overbought / oversold field you can bet on the back test of the current consolidation range’s overbought / oversold level, and a certain 20-pips move is nothing to sneeze at when the certainty is high. Scaling / adding to the position moving further against you is advised, for the first penetration into the overbought / oversold would get rejected back. Do not try to go in at the same level again.
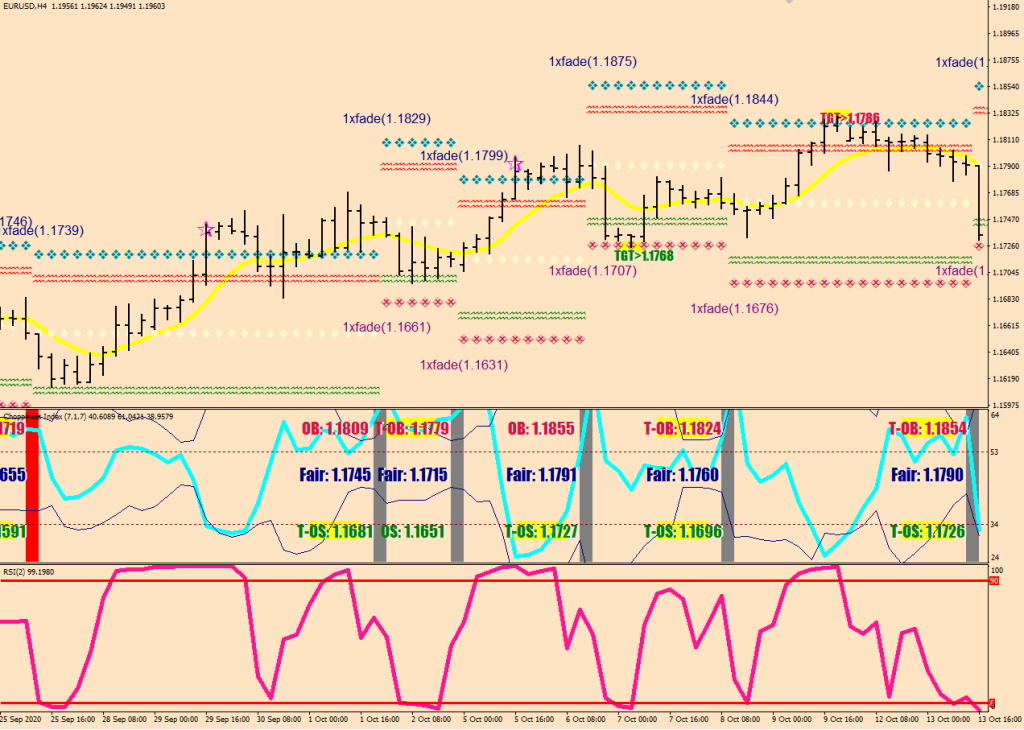
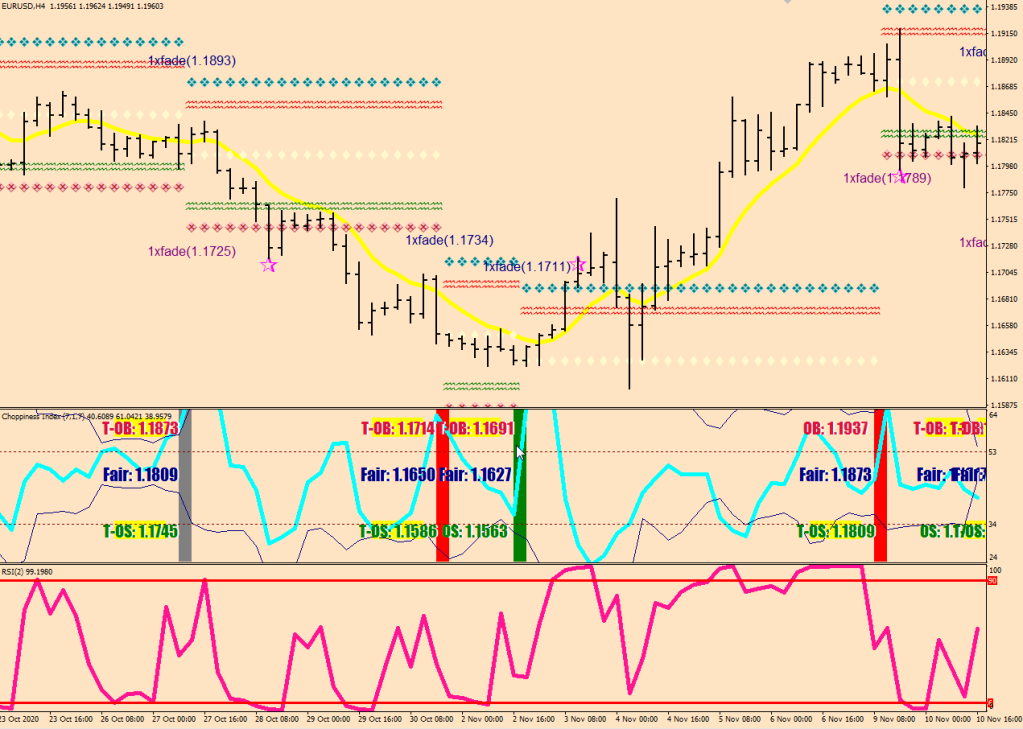
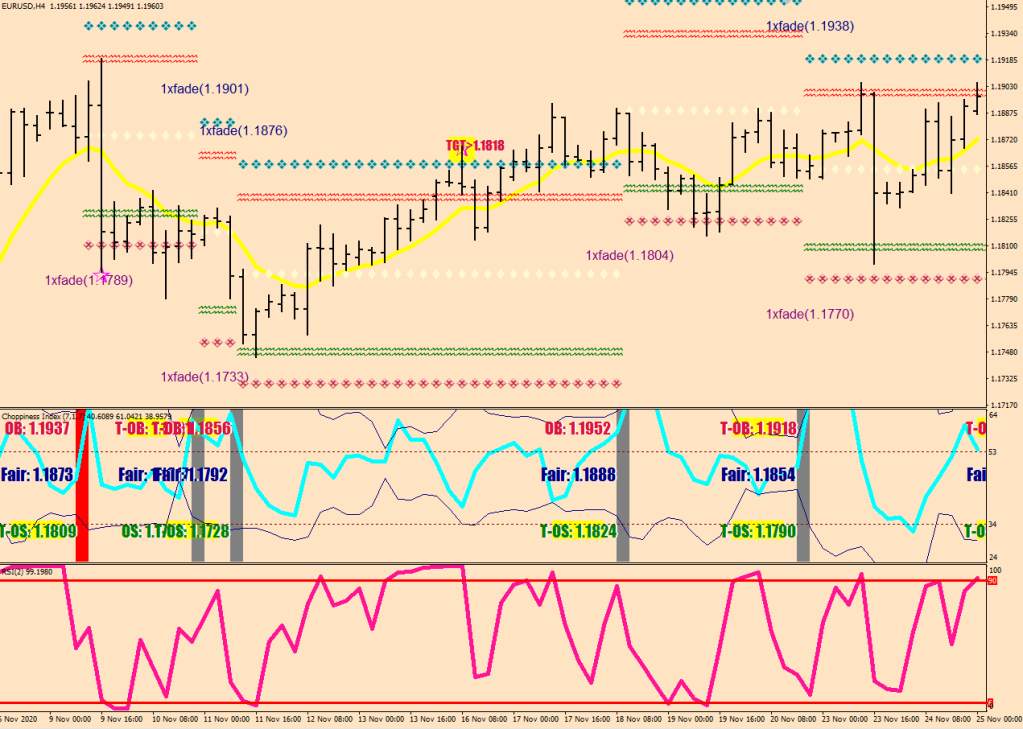
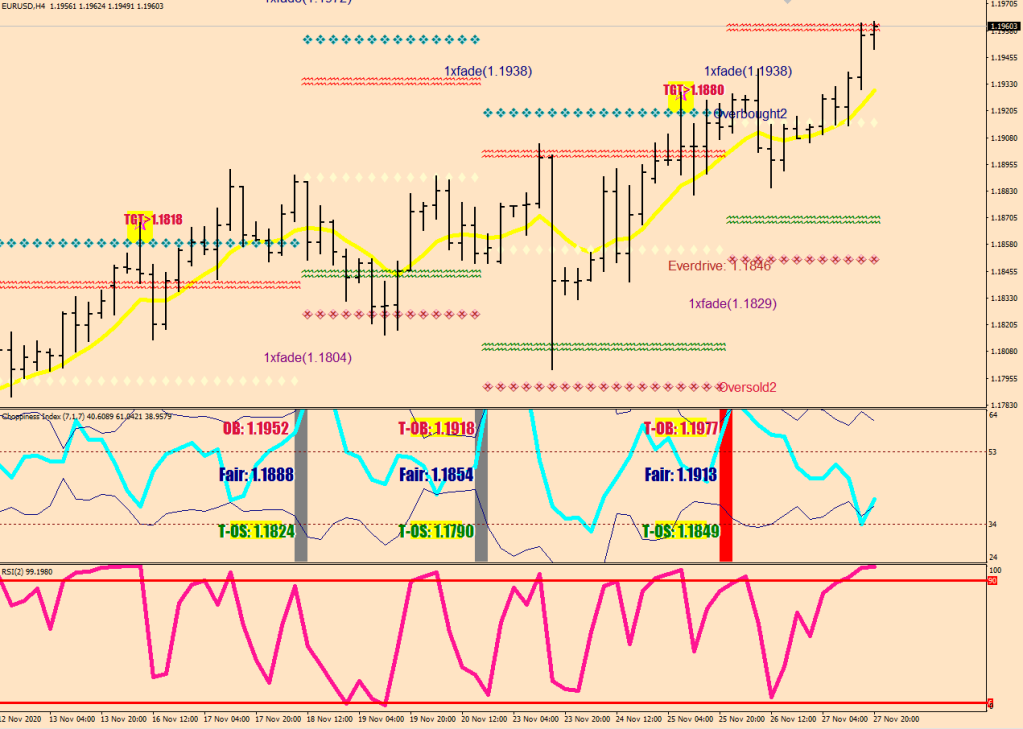
2. The new yellow highlights are to call attention to the Quick Picks / Lucky Dips depending on which country you are calling from. Now with added T>arget prices.
3. The full consolidation targets that are highlighted on the bottom, you are already familiar with.
Don’t forget to apply protective stop losses when in gains.
You would no longer have to feel like J. P. Gaultier wishing for a trading idea.
…
…
Projected distance – speaks of the fractal nature of a wave structure – patented to my name










 and an ABC move down (shown by the dots on the 12-sample bracket).