Commuter Market?

This person called it.

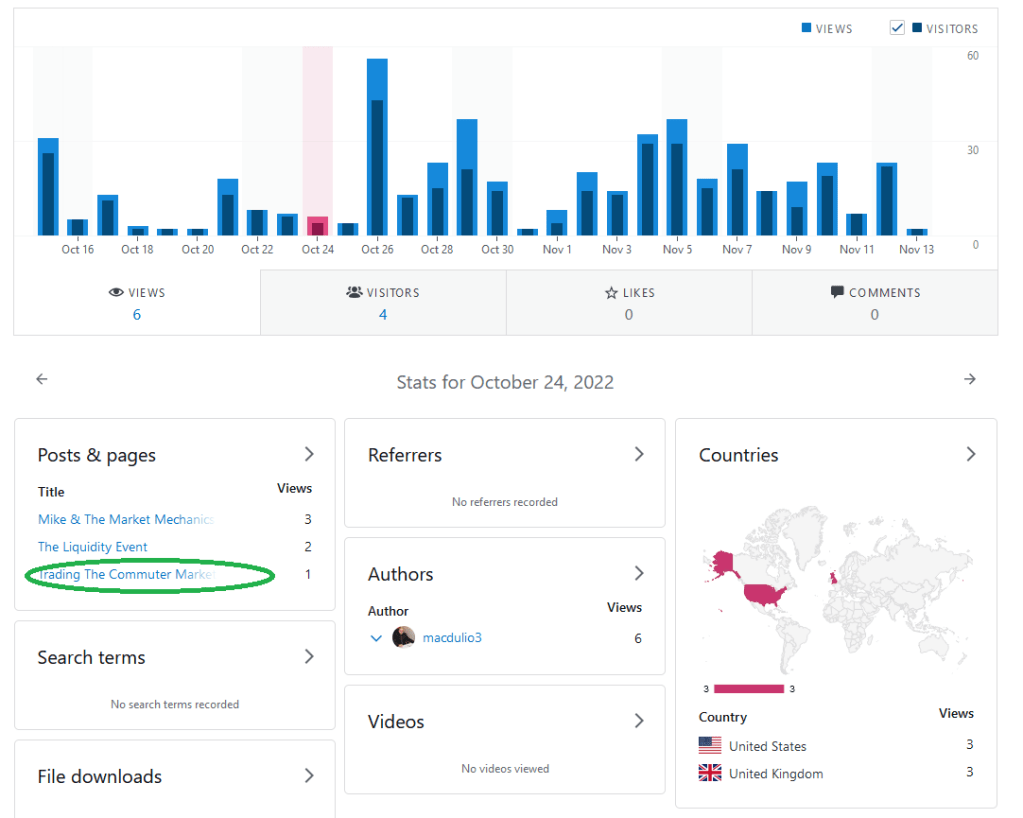
He / she looked up the right blog entry.

This market has changed significantly.

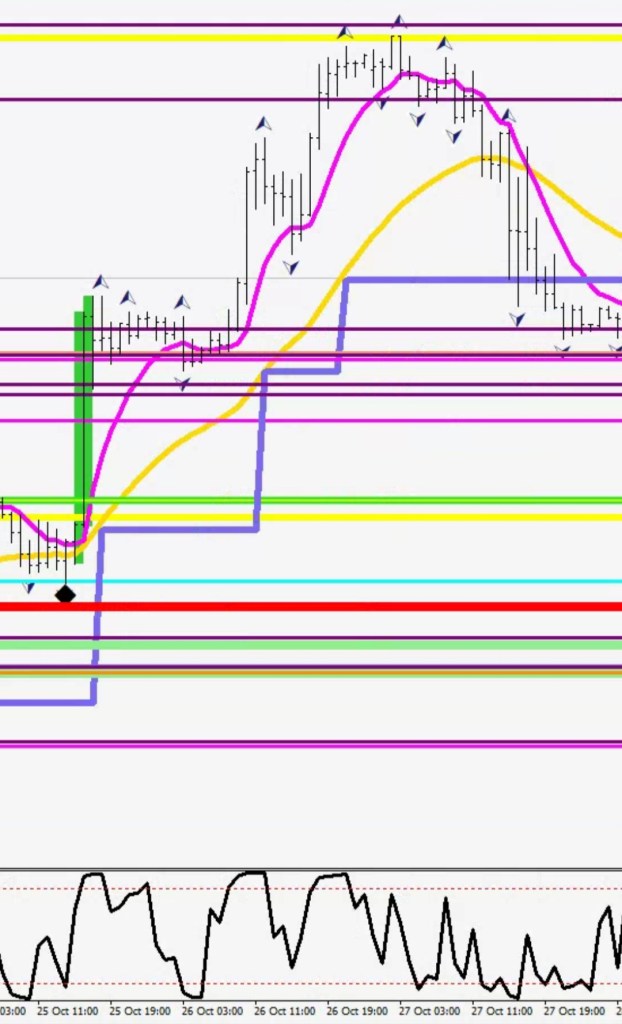
The funny thing is that I even called the bottom within 14 pips (no, I’m not a frequent bottom caller).

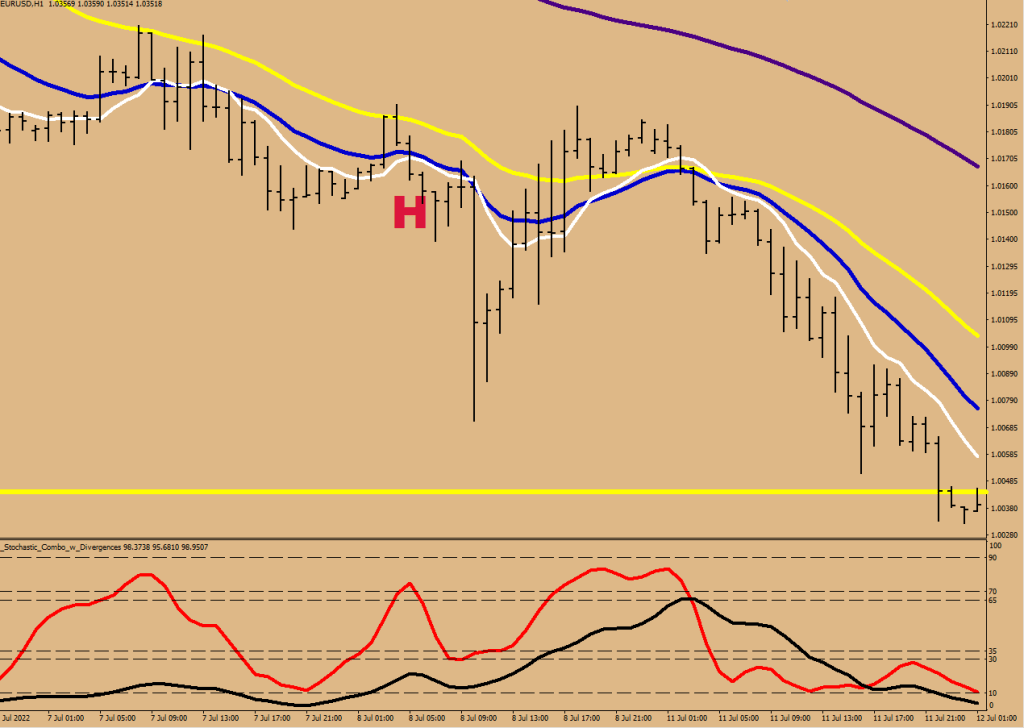
We can all be in denial of the absence of dollar strength, but there is no other evidence than the settled candles.

The E-21 on the weekly was blown right through and would likely serve as support on a retracement at least for a bounce.

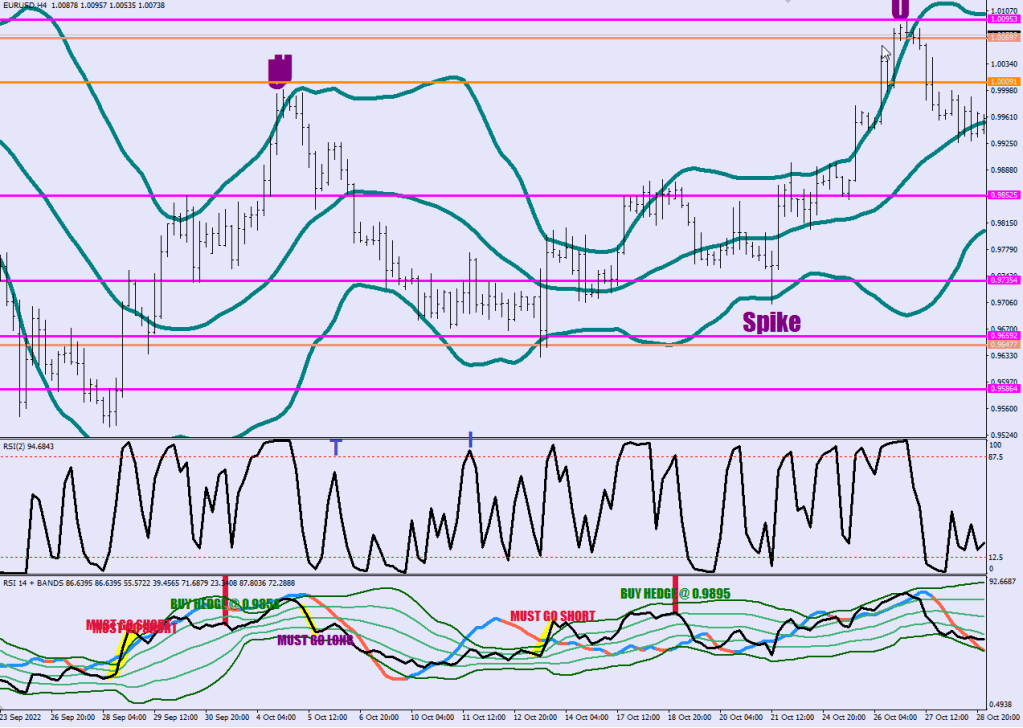
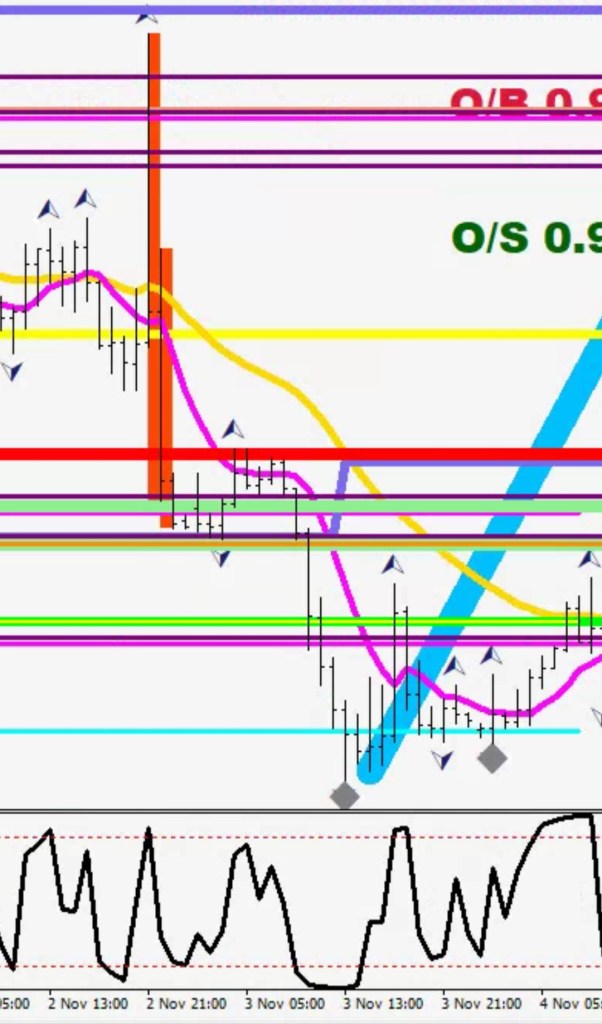
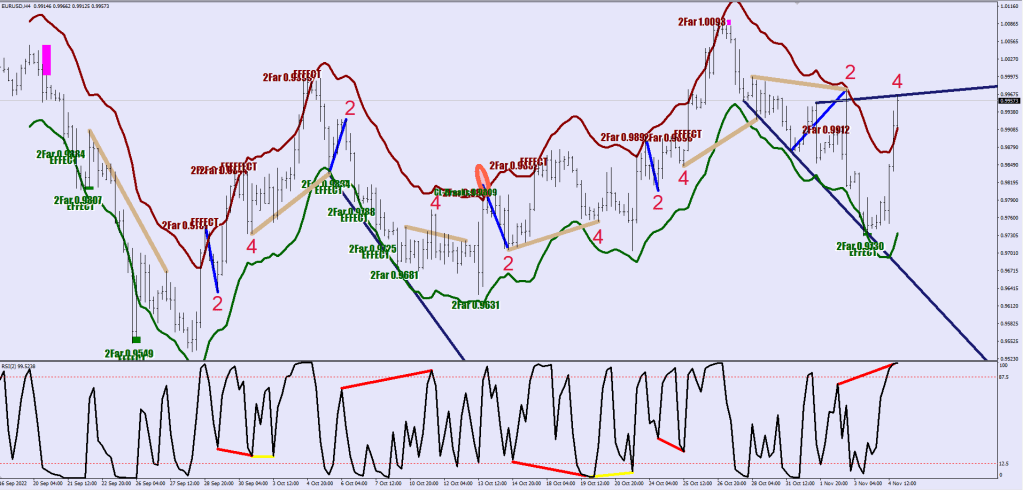
The commuter market in essence has 2 tarrgets: 50% of the range and the other end (Overbought in this case).

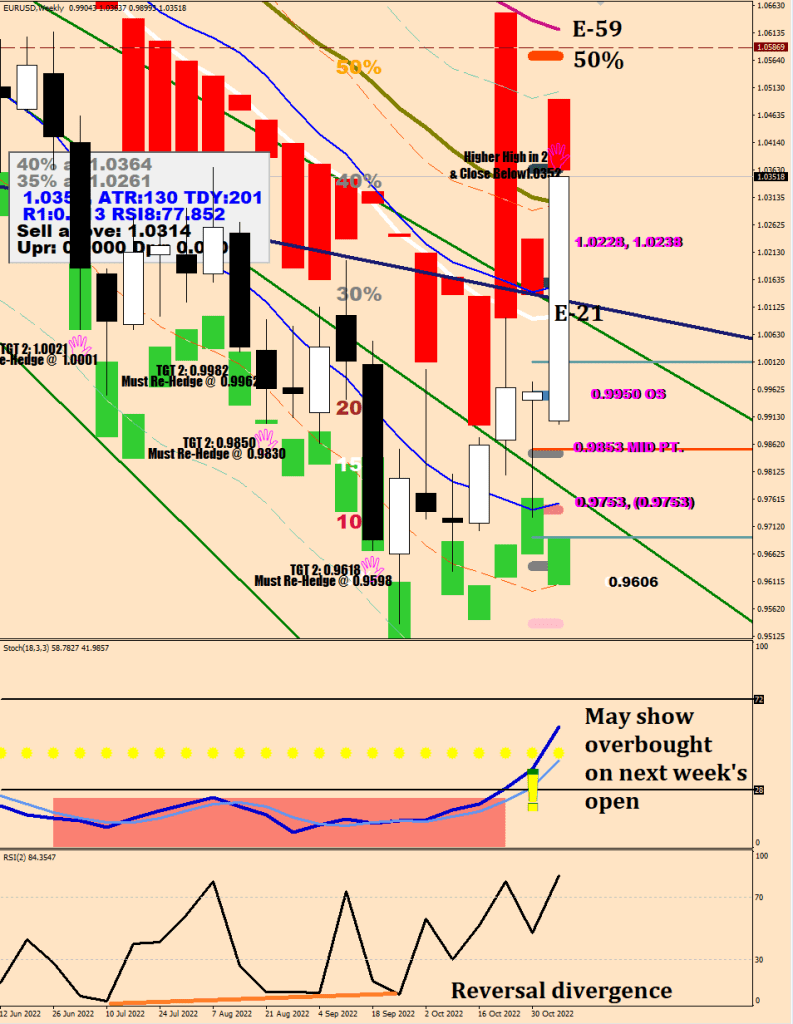
E-59 is the limit of this bear market, would coincide with the 50% marker in a couple of weeks. 3 closes above the E-59 and the bear market flips to a bull.

One trick that can give you an oscillator’s new print for the next week is to cut back one on the sample size (does not always work).

If I bring the sample size down to 17, the stochastic comes in at 64. Still not overbought.

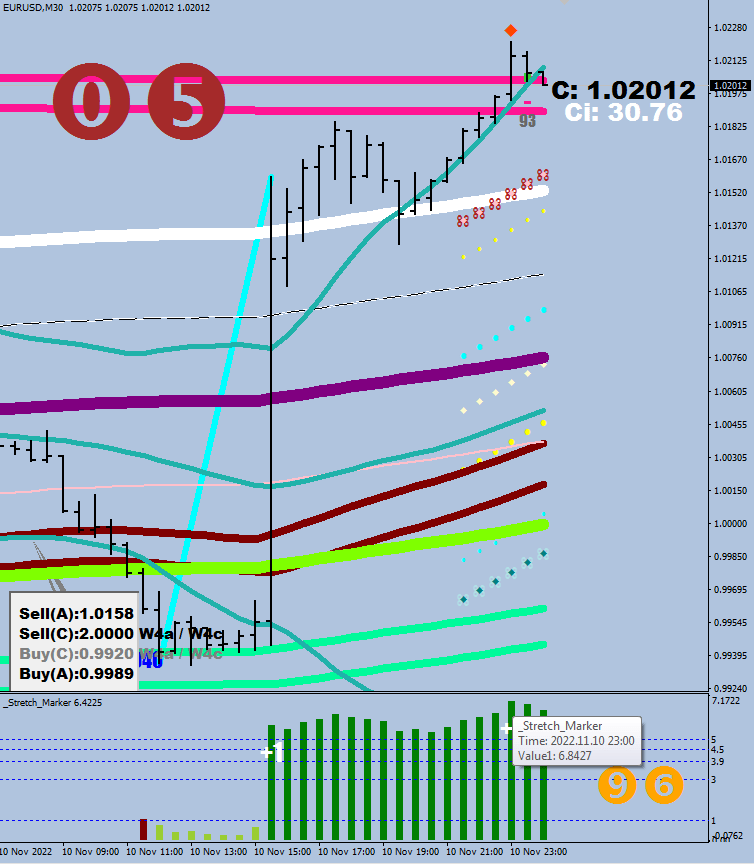
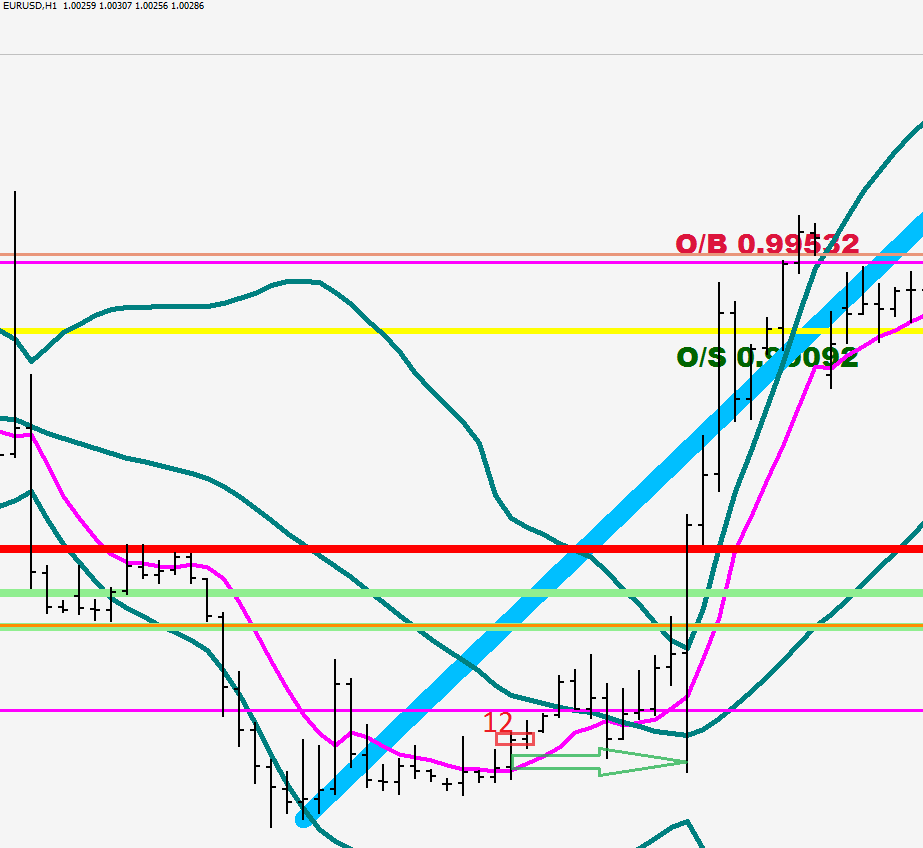
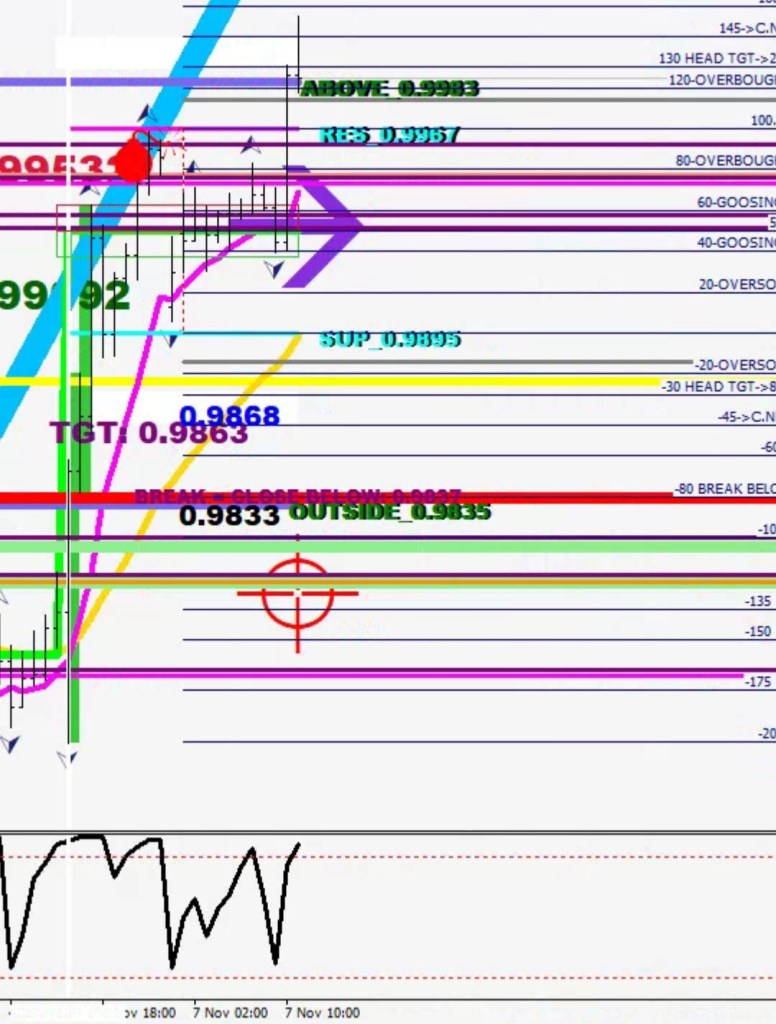
The 40% level in combination with the E-34 should prove to be a challenge on the first run.

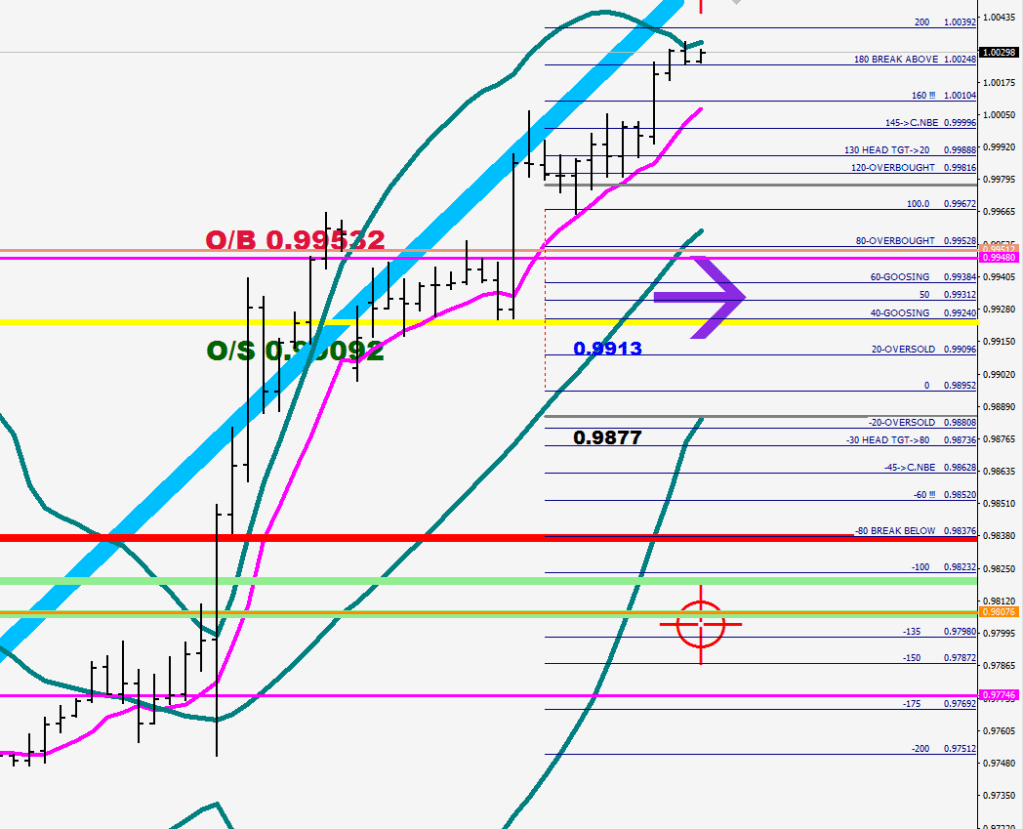
So let’s look at the levels. 50% is at 1.0572

Possible resistance levels on the way up:

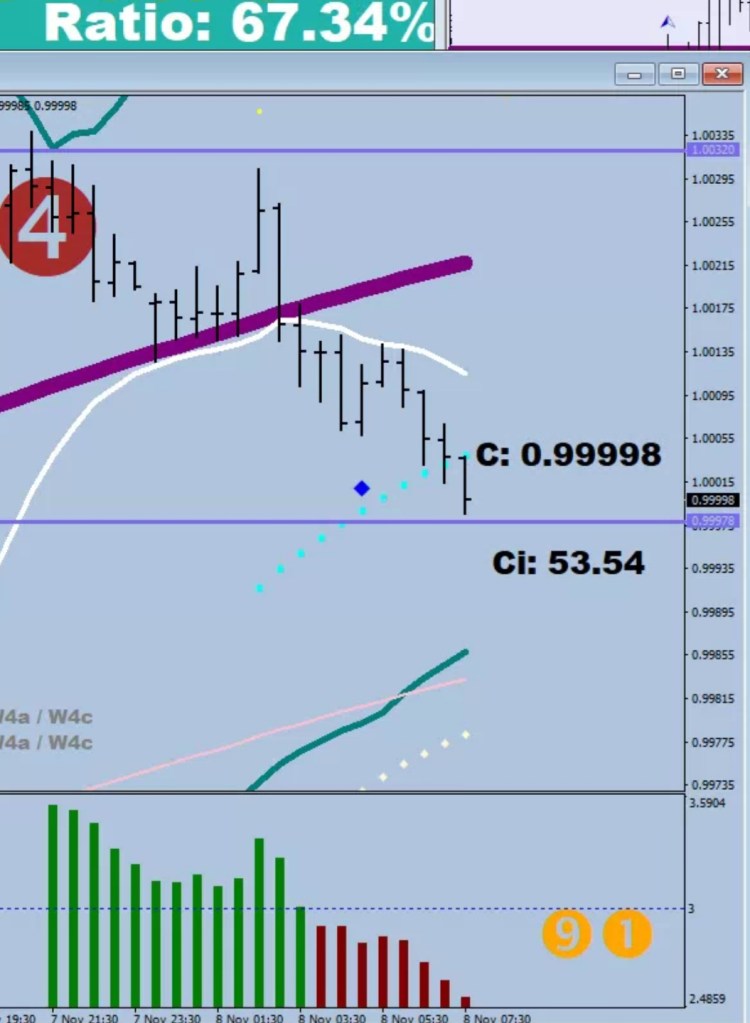
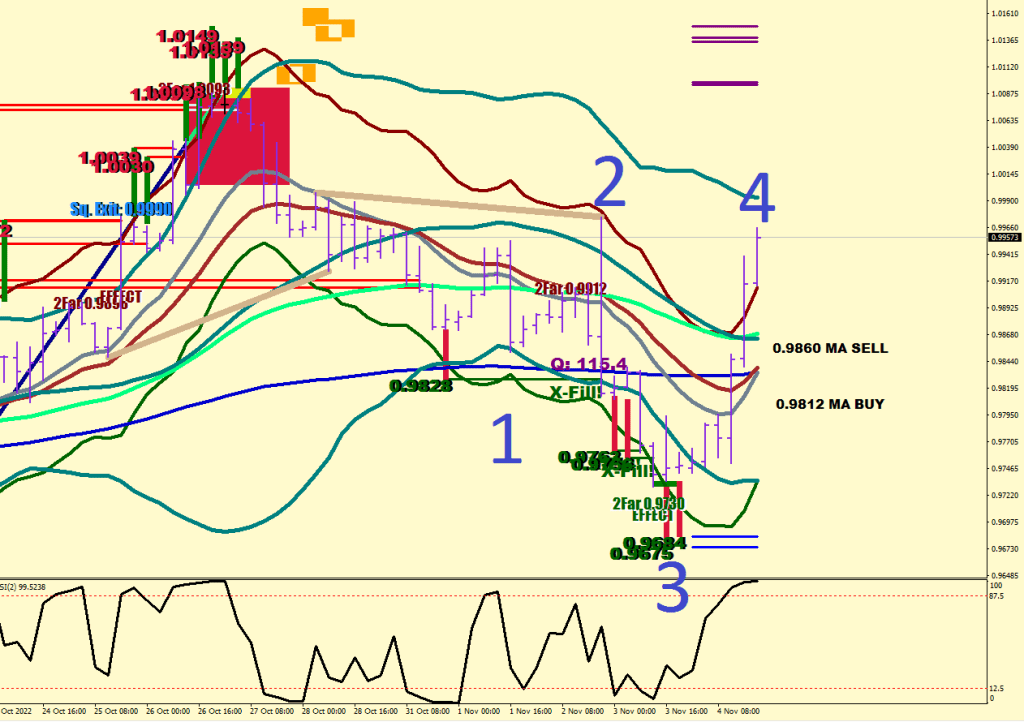
The Daily has come into a swing low and is overbought. May see a relief back to the 1.022x region.

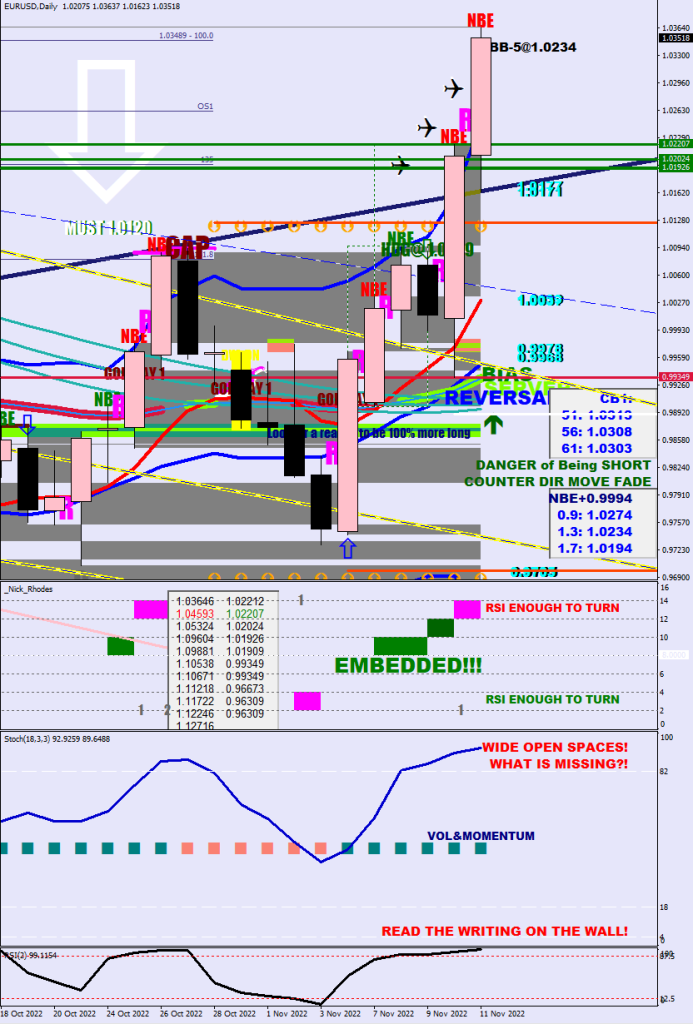
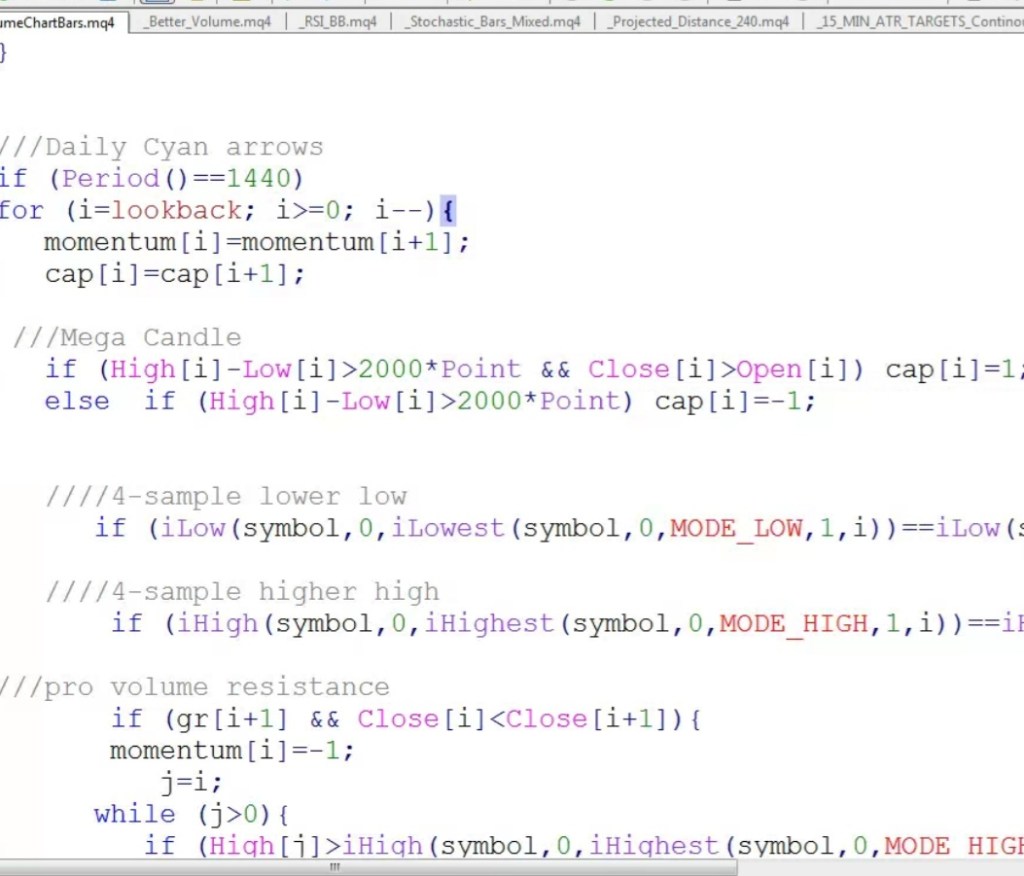
Since price is no longer oppressed by stochastic embedding, the 9-day run up sequence cap out does not apply.

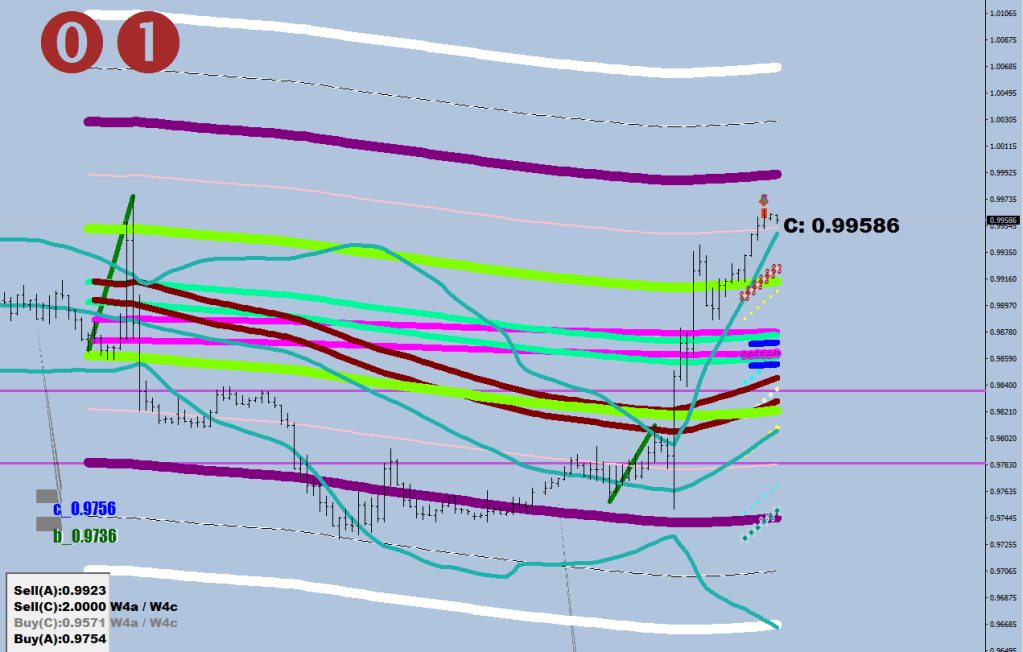
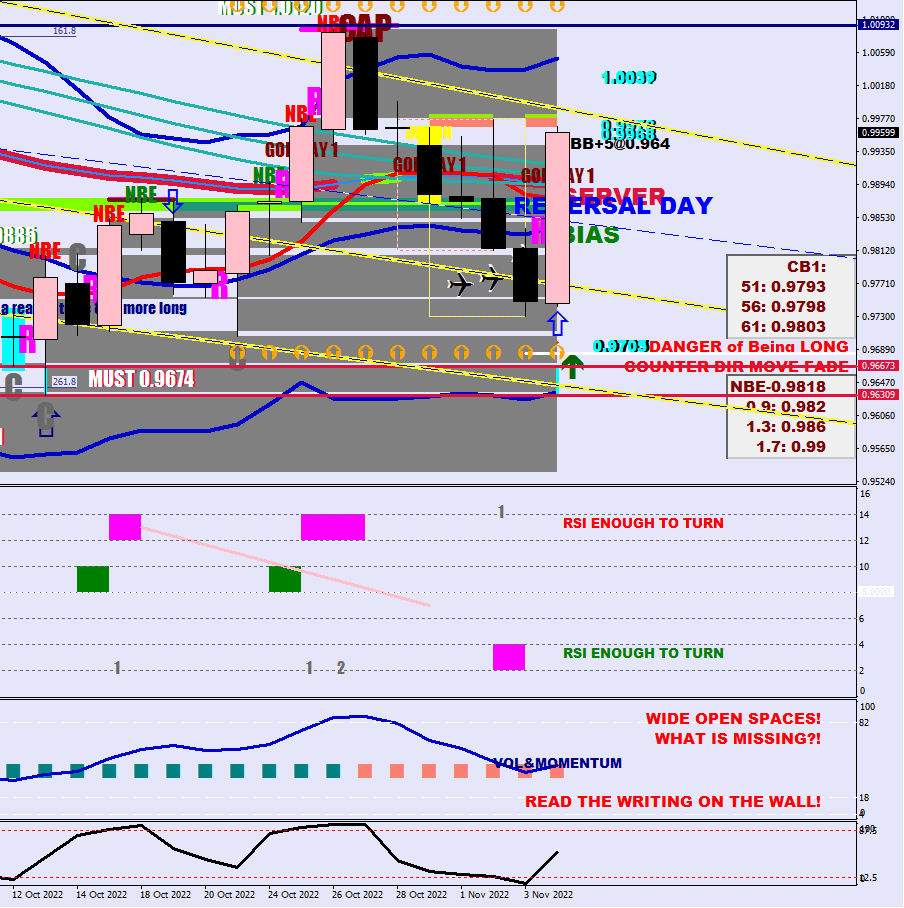
Some more level ideas are in the NBE boxa above for a 90-pip, 130 and 170-pip pull back.

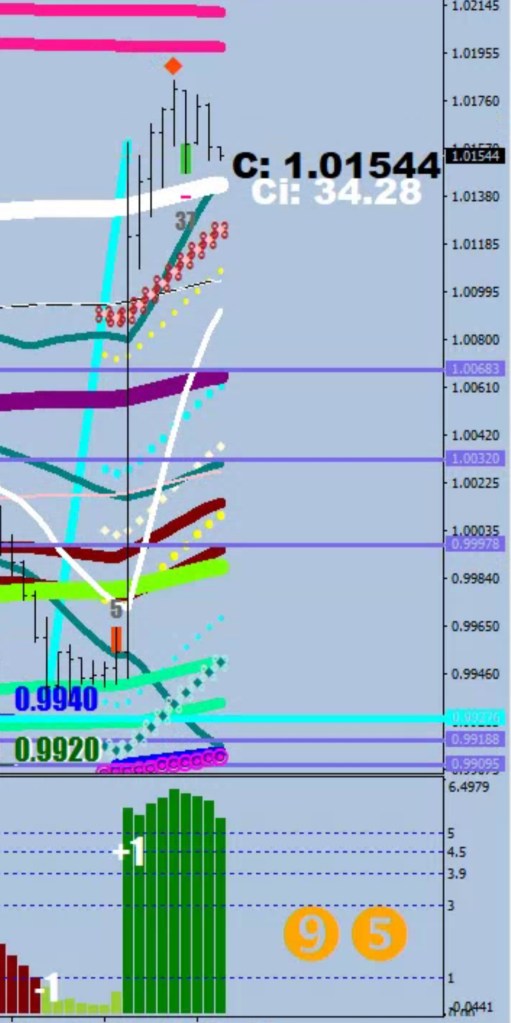
A full mean reversion is kind of out of reach in one leg at 1.0030

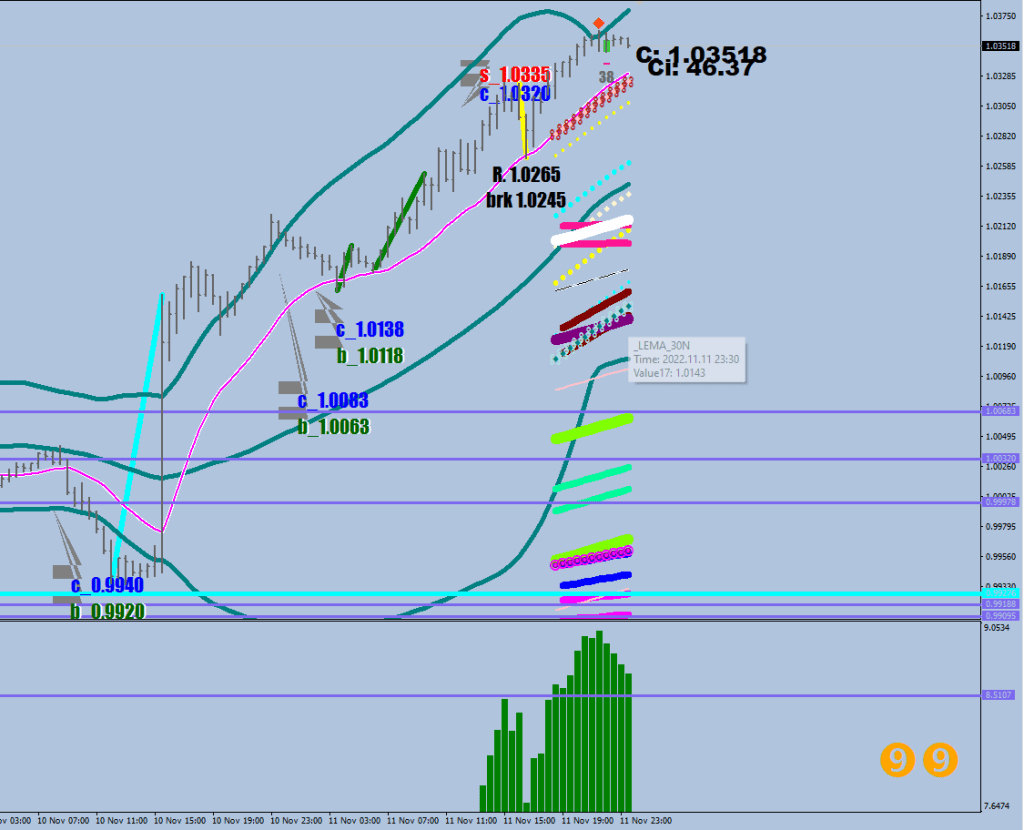
What could provide support at least for a bounce is the 3x stretch on the way down @ 1.0143 instead before a leg up in combination with the E-21 at 1.01+. With a short I would target the hourly 30-sample BB low (& trail). This may come together with the upper guard rail somewhere above 1.006. I would not have hopes beyond these numbers on the downside currently.

I have certainly underestimated what the CTAs can do when they all are buying in an accord. Looks like Europe decided to export back some inflation to the US for Christmas.

Hedge Hammer

One person’s risk off is another one’s risk on.

It is the fist go at isolating the Hedge condition for an auto hedger.

You know, I may be working, offline or sleeping or mere 5 months away from a bank clerk being able to remove a temporary block that nobody asked for from my credit card.

It is amazing how many things I have already coded, finding treasurus on every shelf.

Old code, so I went with the old lingo. NULL and DoubleToStr(i) instead of IntegeToString(i), just out of nostalgia.

    if (Close[i]>iMA(NULL,0,8,0,MODE_EMA, PRICE_OPEN,i) && Close[i+1]<iMA(NULL,0,8,0,MODE_EMA, PRICE_OPEN,i+1)+130*Point && Close[i+1]>iMA(NULL,0,8,0,MODE_EMA, PRICE_OPEN,i+1) && Close[i+2]<iMA(NULL,0,8,0,MODE_EMA, PRICE_OPEN,i+2) && Close[i+3]<iMA(NULL,0,8,0,MODE_EMA, PRICE_OPEN,i+3) && Close[i+4]<iMA(NULL,0,8,0,MODE_EMA, PRICE_OPEN,i+4) && iMA(NULL,0,8,0,MODE_EMA, PRICE_OPEN,i) >iMA(NULL,0,32,0,MODE_EMA, PRICE_MEDIAN,i)+80*Point && stoch60[i]>65 && iMA(NULL,0,89,0,MODE_EMA, PRICE_MEDIAN,i+4) > iMA(NULL,0,207,0,MODE_EMA, PRICE_MEDIAN,i+4) ){
            ObjectCreate("Titee"+DoubleToStr(i), OBJ_TEXT, 0, Time[i+1], Close[i]+120*Point); 
                  ObjectSetText("Titee"+DoubleToStr(i), "H", 42, "Arial Black", Green); 
           }
           
            if (Close[i]<iMA(NULL,0,8,0,MODE_EMA, PRICE_OPEN,i) && Close[i+1]>iMA(NULL,0,8,0,MODE_EMA, PRICE_OPEN,i+1)-130*Point && Close[i+1]<iMA(NULL,0,8,0,MODE_EMA, PRICE_OPEN,i+1) && Close[i+2]>iMA(NULL,0,8,0,MODE_EMA, PRICE_OPEN,i+2) && Close[i+3]>iMA(NULL,0,8,0,MODE_EMA, PRICE_OPEN,i+3) && Close[i+4]>iMA(NULL,0,8,0,MODE_EMA, PRICE_OPEN,i+4) && Close[i+5]>iMA(NULL,0,8,0,MODE_EMA, PRICE_OPEN,i+5) && iMA(NULL,0,8,0,MODE_EMA, PRICE_OPEN,i) <iMA(NULL,0,32,0,MODE_EMA, PRICE_MEDIAN,i)-50*Point && stoch60[i+1]<30 && stoch60[i]>20 && iMA(NULL,0,89,0,MODE_EMA, PRICE_MEDIAN,i+4) < iMA(NULL,0,207,0,MODE_EMA, PRICE_MEDIAN,i+4)){
            ObjectCreate("Titee"+DoubleToStr(i), OBJ_TEXT, 0, Time[i+1], Close[i]+50*Point); 
                  ObjectSetText("Titee"+DoubleToStr(i), "H", 42, "Arial Black", Crimson); 
           }

I know you just love this background color. I’ve gotta think hard about a good definition for the end game. Courting the 30-sample 4-hour seems a bit lousy and lewd and the 8EMO closes can be reversed – see this very page.

Sucker DJ

When does a trick become the theme? When does it become old?

3 times in a row?

Spike Force Cobra

1)

Two pullbacks followed by an undercut spike – surprise Cockfags! – Motoring on till the utmost condition.

2)

Two pullbacks followed by an undercut spike – surprise Cockfags! – Motoring on till the utmost condition.

…and now for something not completely different.

3)

Two pullbacks followed by an undercut spike – surprise Cockfags! – Motoring on till the utmost condition?

There’s nothing organic about this rally. Do not root for it, as this volatility would end up cutting in both directions. 6.8x stretch makes me afraid about what this would do on the downside next. 10x, 11x maybe even more.

Snapflix

This was a Wave 5 from hell.

Modifications.

As it turns out, a 200+ pip day which is more than 2x the statistical ATR is on the level. Overrides everything, including momentum at once.

R2 was reached and so was the ATR target.

Coming back after only 2 houtly closes above sounds like a failure, yea that’s another long body, but now the volume that went has come back out. CAPsize would have the last word. There is also a divergence between the initial 300 versus the current 260.

The 6.5x stretch ftom the mean on the upside beats the largest in recent history that was 5.9

There’s a Lema just above. Could this reach it? I’d say at low odds. Once the 5x white line is lost, this would not be able to get back up above again.

The downside stetch with this volatility on the roll could perform a 10x next.

A bottoming process should look like a dog with a bone in its mouth waving it left and right. This was left.

Final score: 6.8x stretch, No Break Extension move printed the same day

Live Fade

– Can you perform under pressure?

– No, but I can try Bohemian Rhapsody.

Let’s talk interaction condition.

When?

When the (stochastic) spread is wide &

RSI is outside (its Bollingers)

Then you can fade at R1 / S1 for a good 64 pips one time. Freddy or not.

Stochastic spread is between a 60-sample Stoch K and an 18-sample.

Hourly chart, always.

I have shared the code for calculating an S1 (see Quadruple Snitching in the Blog).

Questions? Fragen? вопросы? Pregnutas?

(My Math / Programming teacher used to finish like that.)

4H Refinitions

(Refined definitions)

It took me 12 years to grow up to the 4H chart. I think this might save you some time.

Admittedly, things would take a long route when you start with denying factory settings, indicators on closing prices and don’t get the urge at once to start applying std bands around RSI14 HL2 readings. Sometimes lag is just what you need to arrive at the right conclusion.

The art of choice.

Utmost Condition

The utmost condition is an outside (of the BB) and an outside (RSI14 +- 2 SD) combo.

      ////Utmost
            if (RSI[i]>upper2[i] && RSI[i]>70 && High[i]>iBands(symbol,0,30,2,0,PRICE_MEDIAN,MODE_UPPER,i)+50*Point){
               ObjectCreate("Utmost"+DoubleToStr(i), OBJ_TEXT, 0, Time[i], High[i]+590*Point); 
               ObjectSetText("Utmost"+DoubleToStr(i), "U", 34, "Impact",  Purple);
            }
            if (RSI[i]<lower2[i] && RSI[i]<30 && Low[i]<iBands(symbol,0,30,2,0,PRICE_MEDIAN,MODE_LOWER,i) && iBands(symbol,0,30,2,0,PRICE_MEDIAN,MODE_UPPER,i)-iBands(symbol,0,30,2,0,PRICE_MEDIAN,MODE_LOWER,i)>2200*Point){
               ObjectCreate("Utmost"+DoubleToStr(i), OBJ_TEXT, 0, Time[i], Low[i]-40*Point); 
               ObjectSetText("Utmost"+DoubleToStr(i), "U", 34, "Impact",  Purple);
            }

Spike Back

A spike back reinforces the charge and will take no prisoners until an utmost opposition is met. A spike back has a thrust wick in excess of 45 pips and crossed over back and forth either the 4H BB upper, lower or the middle line.

/Spikeback
            if (Close[i]-Low[i]>450*Point && Open[i]-Low[i]>450*Point &&
               ((Low[i]<iBands(symbol,0,30,2,0,PRICE_MEDIAN,MODE_LOWER,i) && Close[i]>iBands(symbol,0,30,2,0,PRICE_MEDIAN,MODE_LOWER,i))
               || (Low[i]<iBands(symbol,0,30,2,0,PRICE_MEDIAN,MODE_MAIN,i) && Close[i]>iBands(symbol,0,30,2,0,PRICE_MEDIAN,MODE_MAIN,i)))){
               ObjectCreate("Spike"+DoubleToStr(i), OBJ_TEXT, 0, Time[i], Low[i]-40*Point); 
               ObjectSetText("Spike"+DoubleToStr(i), "Spike", 24, "Impact",  Purple);
            }    
             if (High[i]-Close[i]>450*Point && High[i]-Open[i]>450*Point &&
               ((High[i]>iBands(symbol,0,30,2,0,PRICE_MEDIAN,MODE_UPPER,i) && Close[i]<iBands(symbol,0,30,2,0,PRICE_MEDIAN,MODE_UPPER,i))
               || (High[i]>iBands(symbol,0,30,2,0,PRICE_MEDIAN,MODE_MAIN,i) && Close[i]<iBands(symbol,0,30,2,0,PRICE_MEDIAN,MODE_MAIN,i)))){
               ObjectCreate("Spike"+DoubleToStr(i), OBJ_TEXT, 0, Time[i], High[i]+340*Point); 
               ObjectSetText("Spike"+DoubleToStr(i), "Spike", 24, "Impact",  Purple);
            }  

Market direction.

The market holding direction can be changed by an utmost condition or a 5-wave structure where price gets outside the BB at least twice. A spike back reinstates the holding direction against its wick.

Culinary Tract: After the U comes a T and an I which kicks in the final leg / Wave 5.

It’s just a conclusion.

Now I’m just gonna have to make a new Hedger with the name, Quick Feet and use the switch back around the hourly 8 EMO as a trigger in case the wave count got screwed up.

But There’s Just One Thing

I’m so Swanscombe, I’m so Strood.

Today I could had made funds for an 85-inch Samsung + a Retro Console PC by buying at the open, instead I have been watching all day my draw down growing ever larger from 24% to 42% and only cashing in a chump change of $220.

Pitifully mishandled this Decisive move knowing that Friday was the largest daily candle going back several years.

I already know that the last swing would be a swing in excess of 100 pips.

I have suspected that price would get outside the 30-sample BB.

But there’s just one thing.

Where’s the confirmation of the turn?

If we go back to the previous two examples, there’s something precious hidden in the charts.

After 2 consecutive closes on the other side of the 8-EMO, the buy level (short cover) presented itself as 10 pips lower than the second hourly close over.

We need to see something similar happen for the cover level to show itself as this second example. 2 closes below the 8-EMO and 10 pips above the second close is the get out of long / go short level.

btw, after 4x stretch on the downside the market managed a 3.6x stretch on the upside

What’s In a Decision?

Send me a stranger, right now.

Ett Hundra?

Decisive moves. Let’s start pulling on this thread.

Sample size of 3.

Say true things.

Thesis: after a decisive move you’ll see one or more addotional legs until the last swing distance exceeds 95 pips (plus a No Break Extension – extra 40 pips may or may not be in the cards). This would represent the finishing wave structure, quasi the decisive move kick starts a terminal Wave structure that ends up culminating in a capitulation. Gaps are signs of impulse waves.

Figeroa 1: the second swing up went from 9998 to 1.0094

Figeroa 2: the next swing went from 9873 to 9728

Figeroa 3: the second swing went from 9901 to 1.0006

I guess the wave count dilemma never really was one in the ligth of this highlight. As you can see, a gap down is not necessarily a bearish thing (especially when gapping into the 8-hour EMA), it is simply a re-balancing act. A good lesson this was, I hope I shall remember it going forward. The difference could be money bags vs body bag.

What’s in a bird?

I saw the sign, La Isla Bhagavad Gita & I opened up my flies. I saw the sign.

Meet The 300

The score.

I started marking up decisive moves. 90 pips or more within 2 hours. Yes, 190 qualifies.

Normally it would be like, decisive move, market staying overbought / oversold and no bow back beyond 32 pips – see the fractal to fractal move right after the RedOrange shaded part.

 if (High[i]-Low[i+1]>900*Point && Close[i]> iBands(symbol,0,30,2,0,PRICE_MEDIAN,MODE_UPPER,i)){
       ObjectCreate("PERJES"+DoubleToStr(i), OBJ_RECTANGLE, 0, Time[i+1], Low[i+1], Time[i], High[i]);
         ObjectSetInteger(0,"PERJES"+DoubleToStr(i),OBJPROP_COLOR,clrLimeGreen);
   }
  if (High[i+1]-Low[i]>900*Point && Close[i]< iBands(symbol,0,30,2,0,PRICE_MEDIAN,MODE_LOWER,i)){
       ObjectCreate("PERJES"+DoubleToStr(i), OBJ_RECTANGLE, 0, Time[i], Low[i], Time[i+1], High[i+1]);
         ObjectSetInteger(0,"PERJES"+DoubleToStr(i),OBJPROP_COLOR,clrOrangeRed);
         ObjectSetInteger(0,"PERJES"+DoubleToStr(i),OBJPROP_BACK,1);
   }

Recap. I mentioned 0.9736 being the next stop and that would put price at 4x stretch from the mean.

Check.

I was guessing to see 3x step out of the BB. There were only 2.

4x stretch is about what the market can do with “normal” levels of volatility – but this market is not at all normal.

Price already has swung to the other side all the way to a 2.375 stretch.

What’s going on? What is the wave structure here?

Nothing seems to work out. Must take things one day at a time.

I called the run to the CAP a Wave 3. A 300 move is final. Does this mean that this Wave 5 up is a right shoulder?

The biggest changes are on the weekly chart.

Ever since the megaphone there has not been a sequence of more than 2 weeks closing above the lower 2std 14-sample Window Envelope (Magenta) until now. Price was also closing above last week’s pivot and the Oversold neckline. 224 pips range talks of rising volatility. Stochastic embedding is lost, the touch of the 21EMA (White) would be the next logical move. So the match of or a beat of the Wave 3’s high would be logical to see from a Wave 5.

There should be a serious re-balancing first, and I am looking at 0.9845-50 as suspect, but after a couple of closes above the 20DEMA, the momentum should flip back up.

As an alternate count would call this current move up a Wave 4. This run up did bot manage the last swing high and this may result in a gap down.

I have seen Wave 1s before falling short of the Overdrive band and also seen the first leg of a Wave 4 violating the Overdrive.

If you connect the low ow Wave 1 and the low of Wave 3, that vector would hit the next projection bunch down at 0.9479 in 18×4 hours = 3 days.

A 9x stretch from the mean would mean 0.95 or a bit lower. It would make sense to improve on the reversal divergence after a major acceleration made by Wave 1: an RSI2 at closing still below 12.5, but way higher than that 3.8 reading at the end of Wave 3. Not at all madness.

Getting Gigli With It

These boobs were made for stalking & that’s just what you’ll do. One of these days they’re gonna bounce all over you.

Am I gonna put out any content with it? Good question. Can’t just leave all of this talent on the shelves to waste. So for all the haters & the hooters, here it is:

There are new naked emperors out there ripping off the FTMO scam shuffled in on YouTube with an extra hot chick. Fidelcrest or something.

Popping up all over the place these are.

All you need to do is pay a monthly fee to participate. What they promise is not what you get.

Who’s paying whom? Minor detail. Why get lost in it?

As for the boots part, here I am, walking like a dirt cheap.