TOS – Buy To Sell To

What would I say about this ThinkOrSwim Routine of mine?

It was made for trading Eur/Usd.

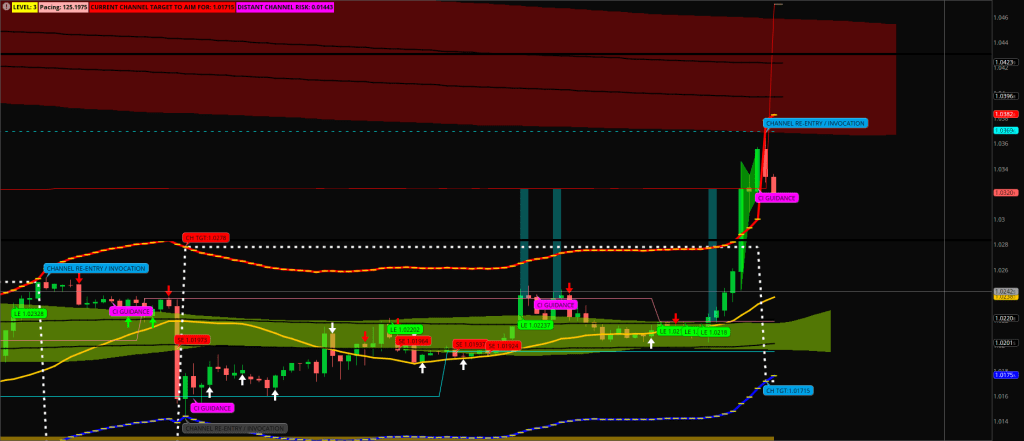
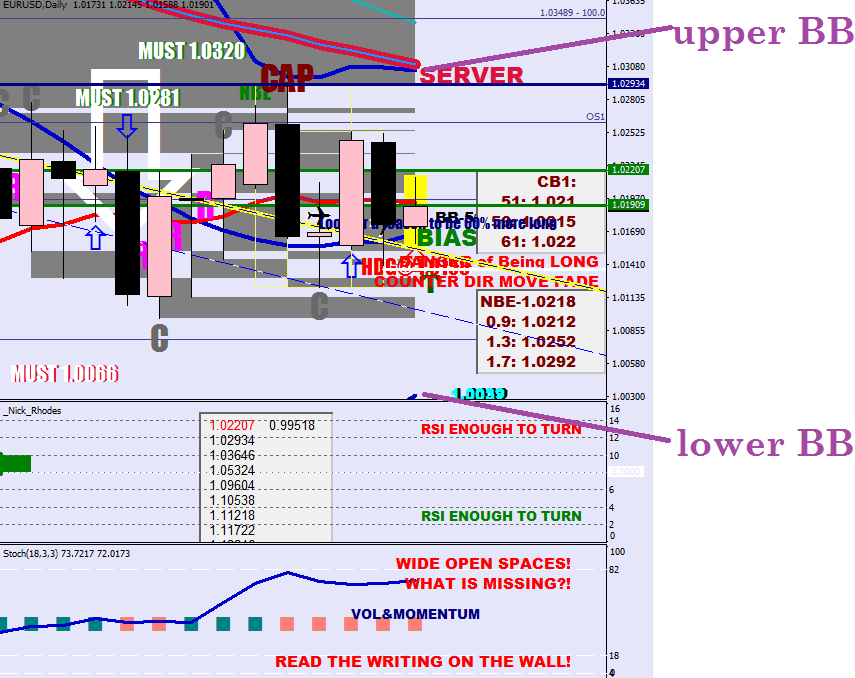
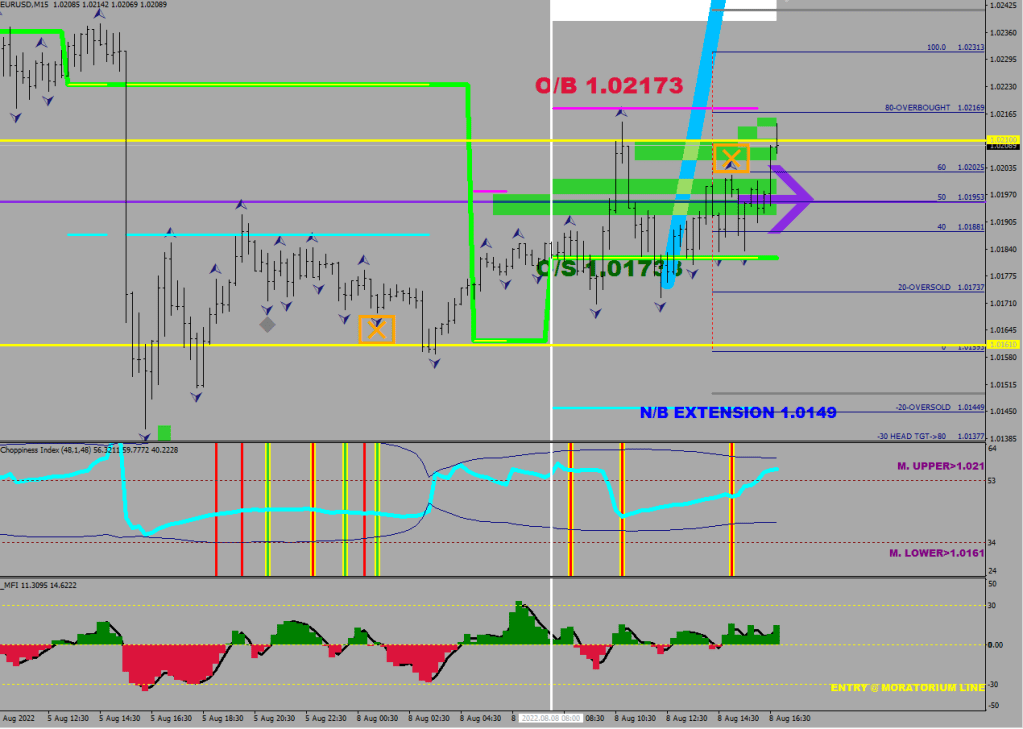
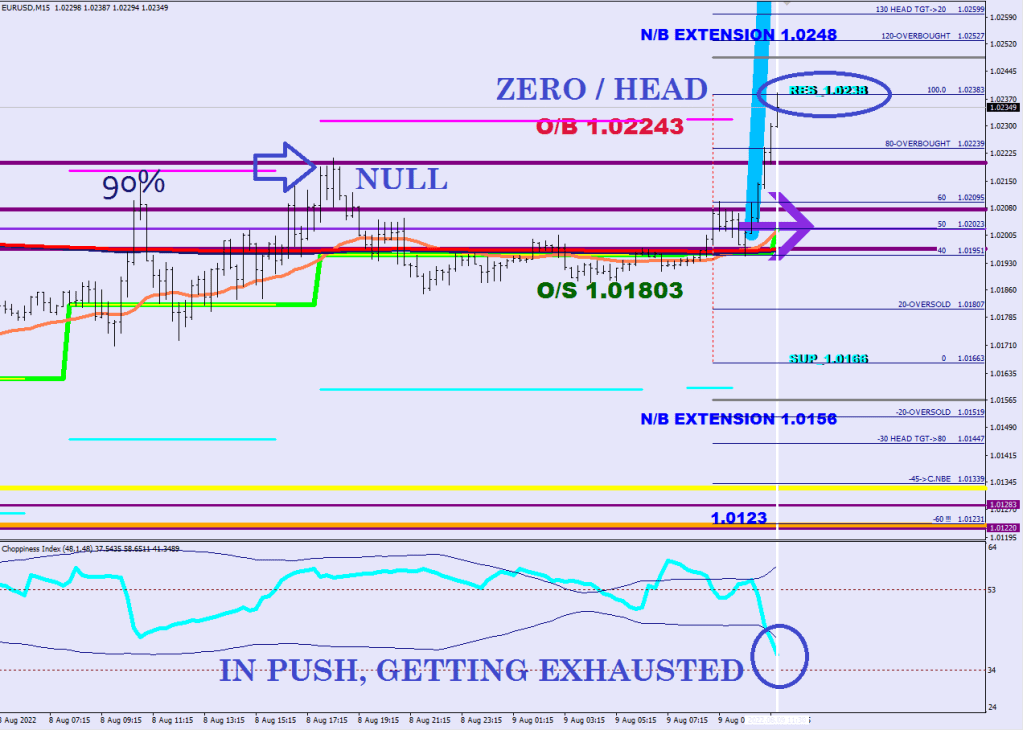
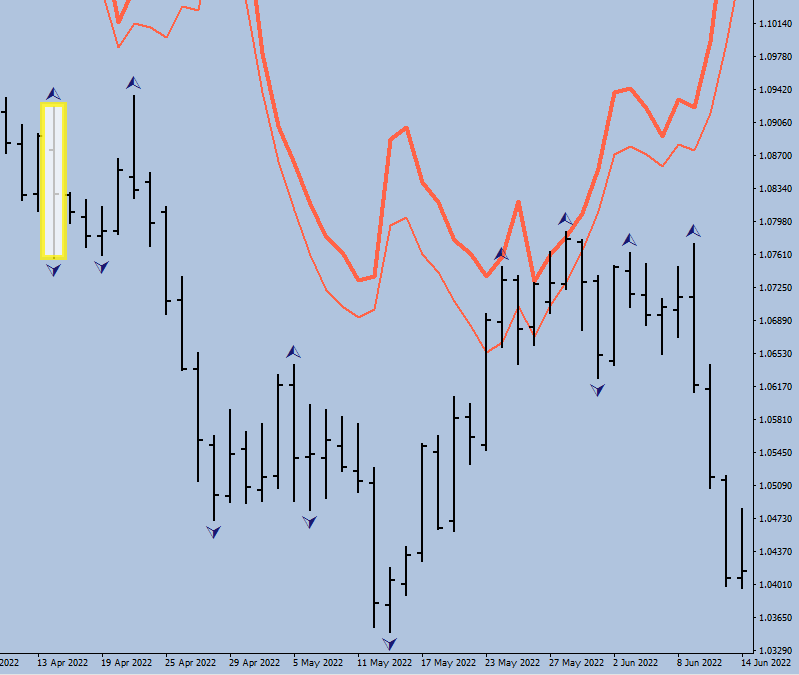
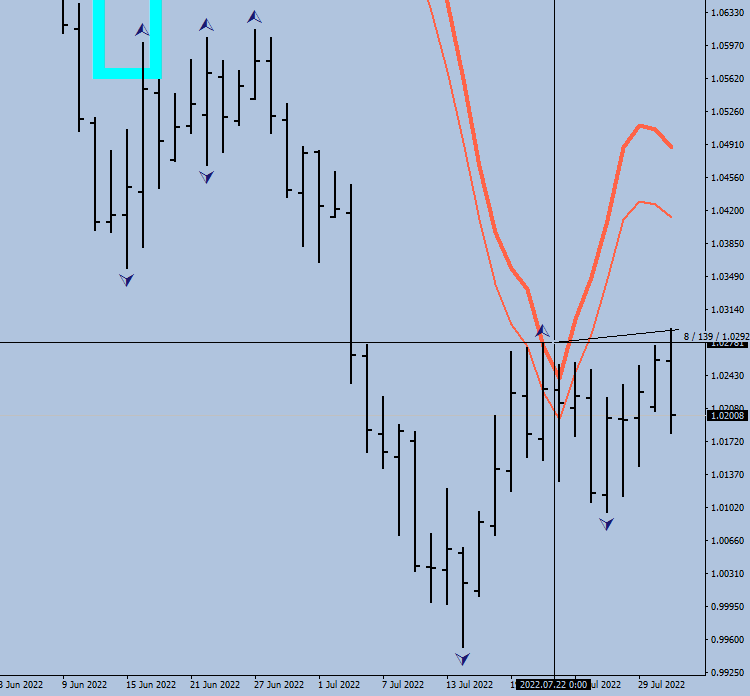
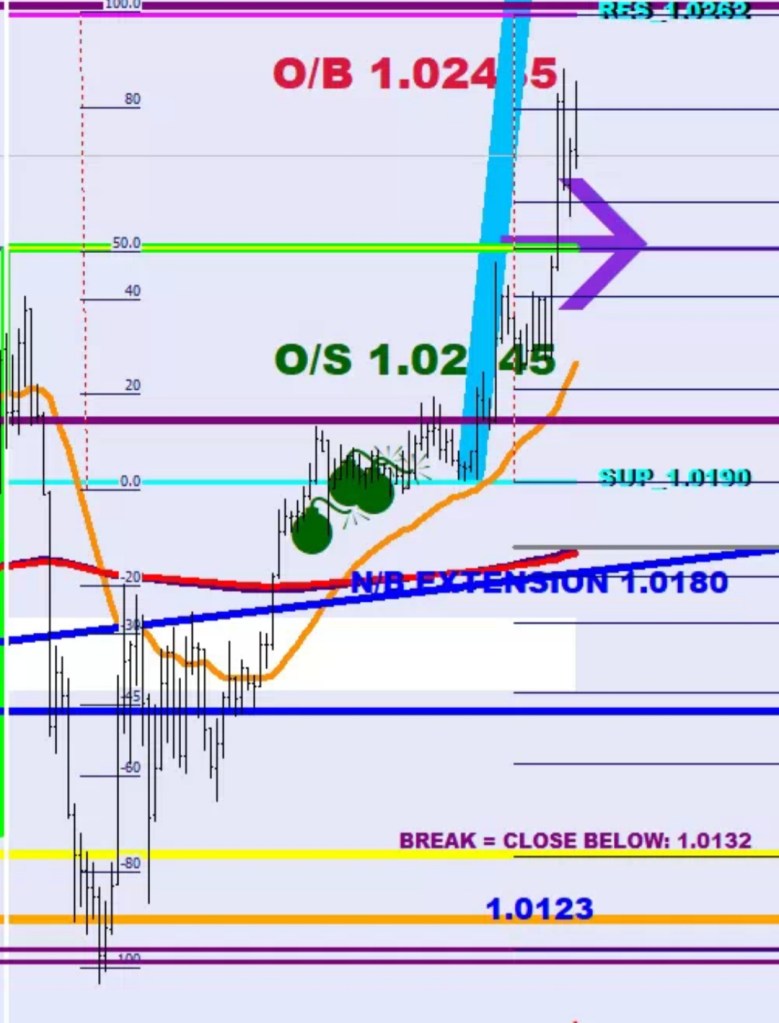
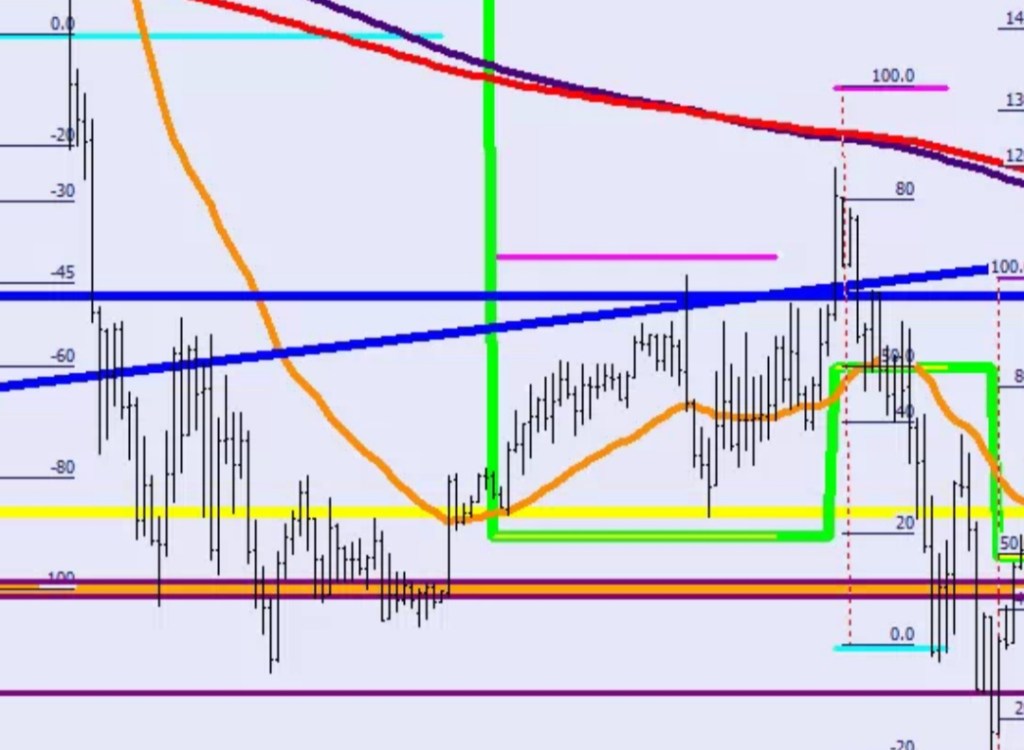
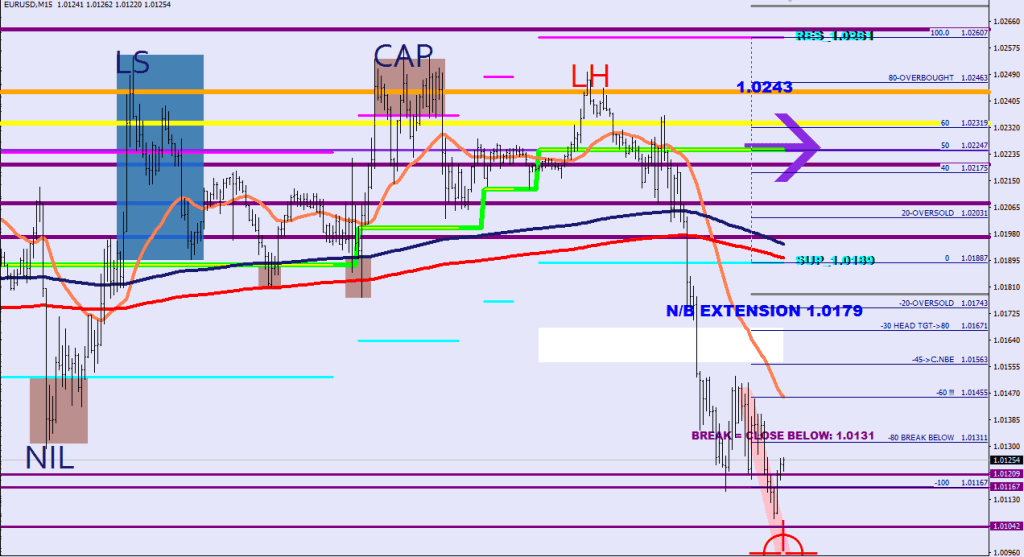
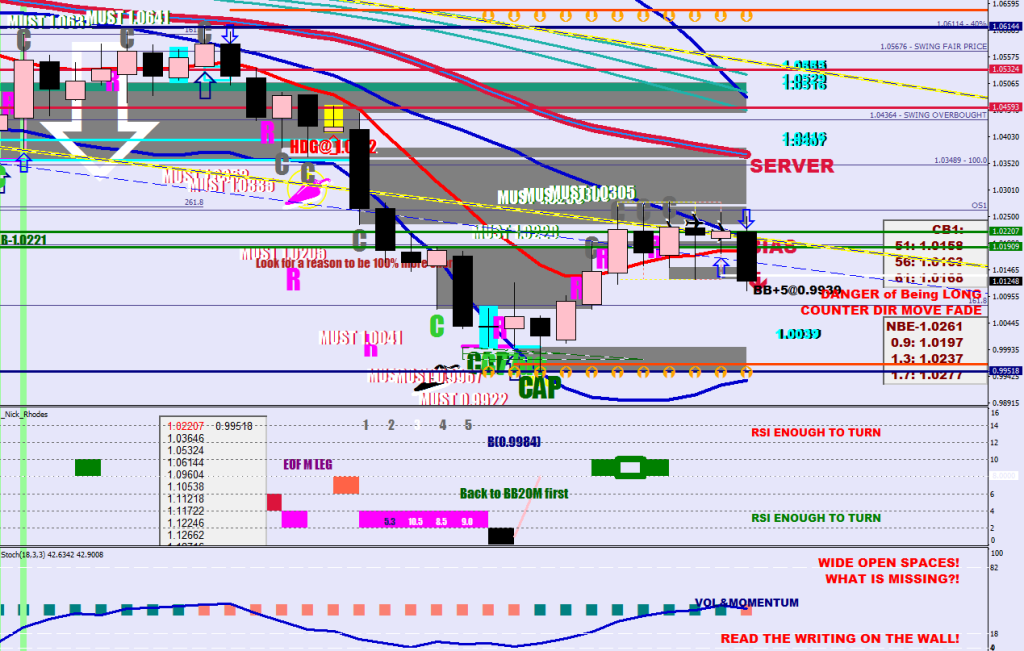
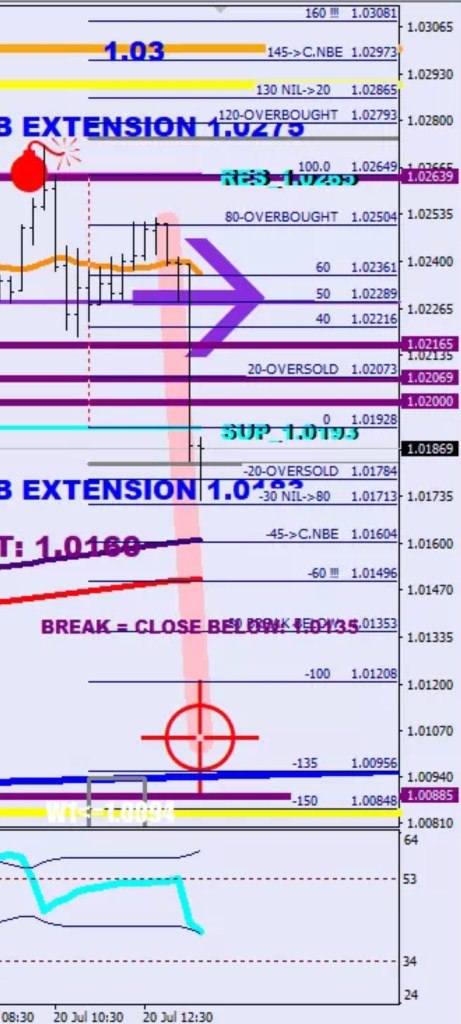
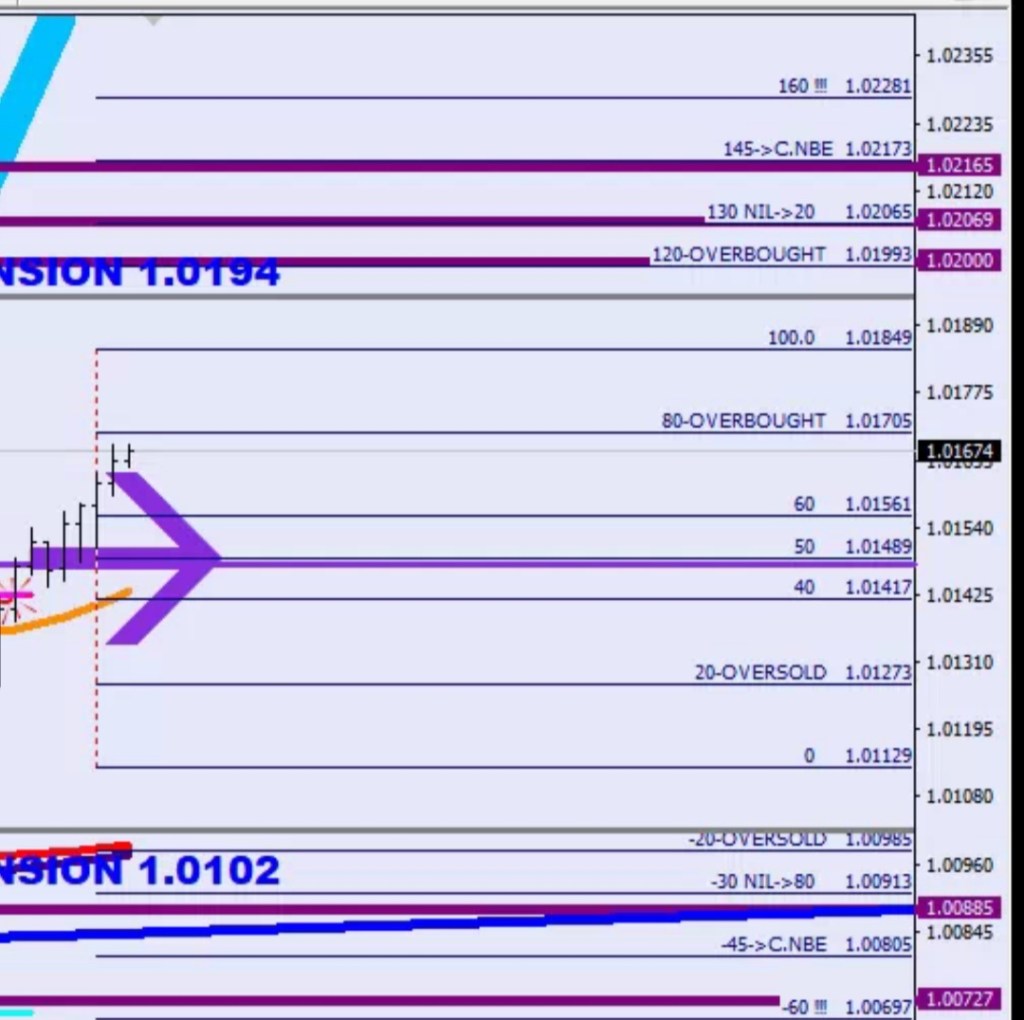
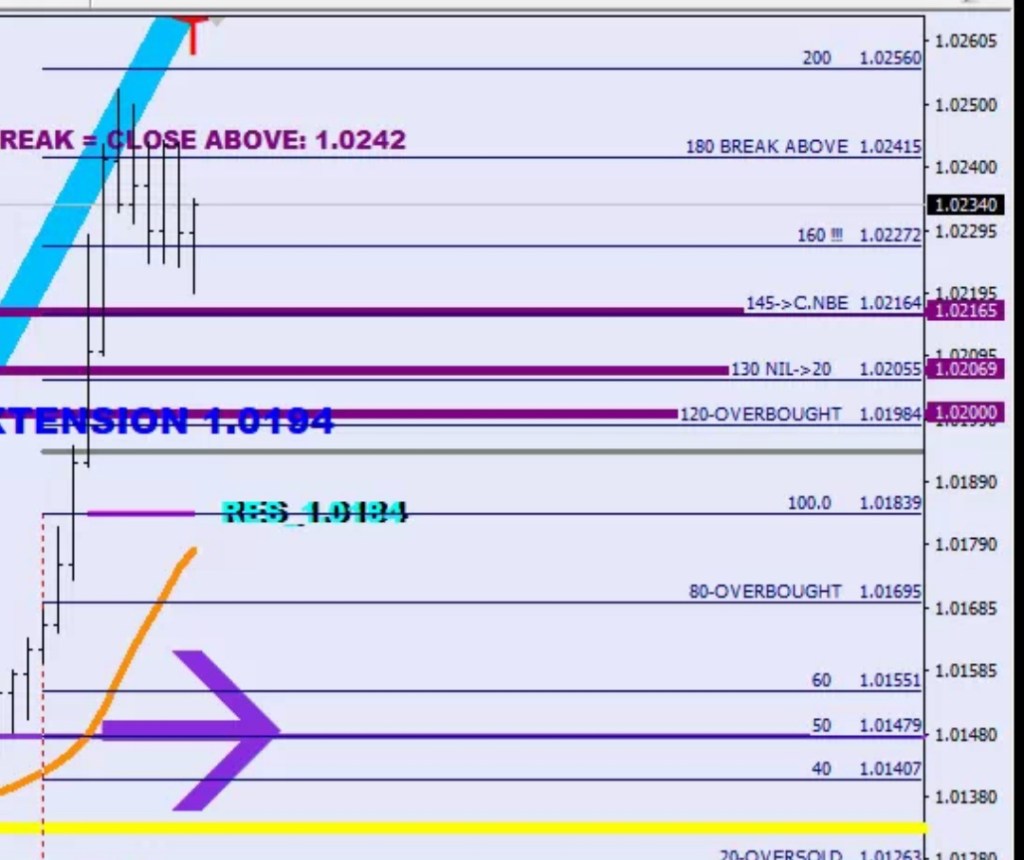
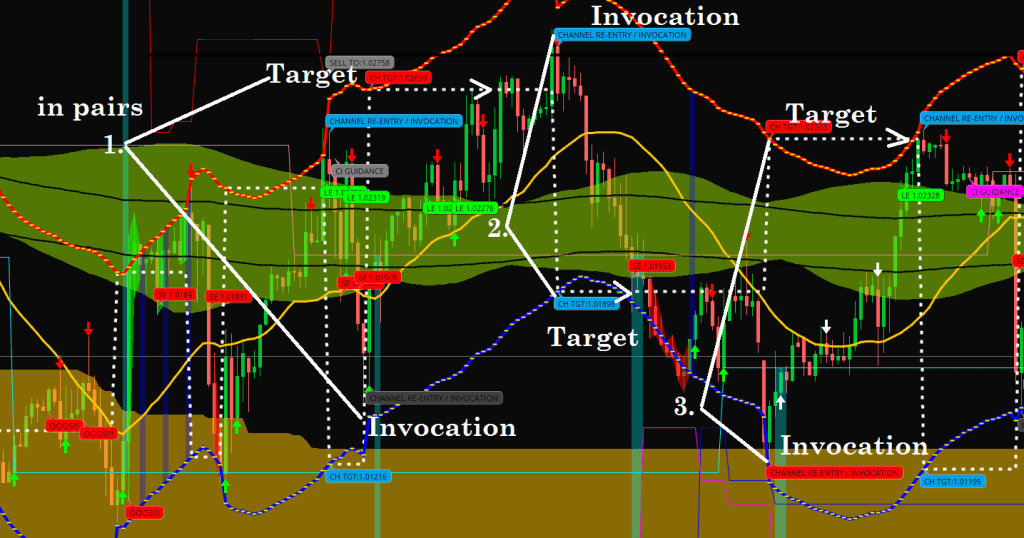
It displays a channel around the 36EMA (1H) based on zigzag crossbacks inside the channel and displays a projection at the other end that was made by a zigzag crossback at the other end with some additional displacement (slack) and projects this level out into the future (white dash). Invocation -> Channel Target.

The routine plots some fractal energy future exhaustion levels (thin lines) based on statistical, instrument dependant data.

It has some crossback arrows as well in red, green and white colors. The idea is the current & the next candle. If they show a follow-through combination, initiate in that direction on a pullback.

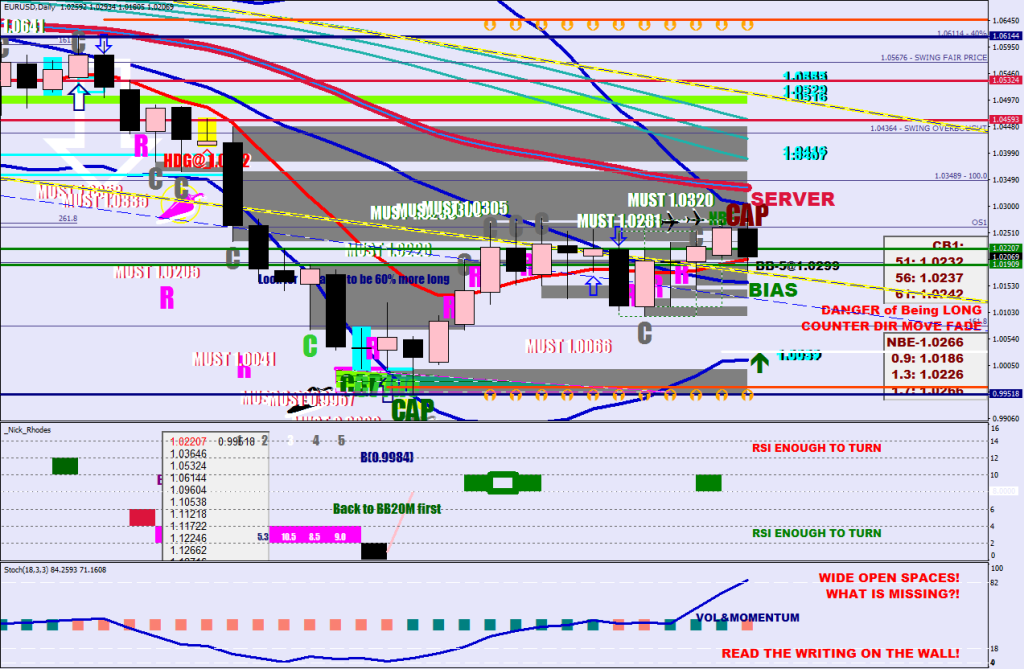
The Lema clouds and the comfort levels shaded blocks are not part of the routine.

I am very generous with this one, as on MT4 (implemented in the routine called CloseLines 60-60) I have not been able to replicate the accuracy of the zigzag routine nor the aim.

# Buy To Sell To by Achilles Dent ~ 2013-2014 

input length = 36;
input price = close;
input reversalAmount = 0.6;
input showonlytoday = yes;
input displace = 1.13;

def ZZG =  reference ZigZagHighLow(price, price, reversalAmount, 0, 1, 0);

def SLK = reference StochasticSlow(80,  20,  60,  1,  high,  low,  close,  1).SlowK;


def ZZG2 =  if showonlytoday and !IsNaN(close(period = "DAY")[-12]) then Double.NaN else reference ZigZagHighLow(price, price, reversalAmount, 0, 1, 0);

def zzSave = if !IsNaN(ZZG) then price else GetValue(zzSave, 1);
def chg = (price / GetValue(zzSave, 1) - 1) * 100;
def isUp = chg >= 0;

def flipu = if isUp == yes and isUp[1] == no then 1 else 0;
def flipd = if isUp == no and isUp[1] == yes then 1 else 0;

def EMA = ExpAverage(price, length);

def upval = if flipd then high[1] - EMA[1] else if flipu[22] != 1 and Sum(flipu, 22) < 2 then upval[1] else upval[1] * .9;

def upval2 = if flipd then high[1] - EMA[1] else upval2[1];

def dval = if flipu then EMA[1] - low[1] else  if flipd[22] != 1 and Sum(flipd, 22) < 2 then dval[1] else dval[1] * .9;
def dval2 = if flipu then EMA[1] - low[1] else dval2[1];

def EMAP = if upval > 0 then EMA + upval * displace  else EMAP[1] ;
def EMAP2 = if upval2 > 0 then EMA + upval2 * displace  else EMAP2[1] ;
def EMAD = if dval > 0 then EMA - dval * displace  else EMAD[1];
def EMAD2 = if dval2 > 0 then EMA - dval2 * displace else EMAD2[1];

def ema2 = if EMAP > .02 then EMAP else Double.NaN;

def ema3 = if EMAD > .02 then EMAD else Double.NaN;

plot ema44 = if EMAP2 > .02 then EMAP2 else Double.NaN;
ema44.SetLineWeight(4);
ema44.SetDefaultColor(Color.RED);

plot ema4 = if EMAP2 > .02 then EMAP2 else Double.NaN;
ema4.SetLineWeight(2);
ema4.SetPaintingStrategy(PaintingStrategy.DASHES);
ema4.SetDefaultColor(Color.YELLOW);

plot ema55 = if EMAD2 > .02 then EMAD2 else Double.NaN;
ema55.SetLineWeight(4);
ema55.SetDefaultColor(Color.BLUE);

plot ema5 = if EMAD2 > .02 then EMAD2 else Double.NaN;
ema5.SetLineWeight(2);
ema5.SetPaintingStrategy(PaintingStrategy.DASHES);
ema5.SetDefaultColor(Color.YELLOW);

input TF = {default "1 HOUR",  "78 MIN",  "4 HOURS", "DAY", "WEEK", "MONTH"};
def CI = ( ( Log(Sum(TrueRange(high(period = TF), close(period = TF), low(period = TF)), 14) / (Highest(if high(period = TF) >= close(period = TF)[1] then high(period = TF) else close(period = TF)[1], 14) - Lowest( if low(period = TF) <= close(period = TF)[1] then low(period = TF) else close(period = TF)[1], 14))) / Log(10)) / (Log(14) / Log(10))) * 100;
input TFS = {default "DAY", "WEEK", "MONTH"};

def  slkf =  reference StochasticFull(77, 22, 9, 0, high, low, close, 1, "SMA").FullK;
def diff = 100 - (75 - (slkf - (88 - CI))) * .8;

def dhi14 = Highest(high(period = "DAY"), 14);

def dlo14 = Lowest(low(period = "DAY"), 14);

def dei80 =  dhi14 - ((dhi14 - dlo14) / 100 * 19);

def dos20 = dhi14 - ((dhi14 - dlo14) / 100 * 79);

def top = (dei80[2] - dos20[1]) * .7 + dos20;

def bot =  (dei80[2] - dos20[1]) * .3 + dos20;

def ave = (top + bot) / 2;

plot dcr = if Crosses(if showonlytoday and !IsNaN(close(period = "DAY")[-12]) then Double.NaN else diff, 62, CrossingDirection.BELOW) and CI > 34 and high < ema4 then high else Double.NaN;
dcr.SetPaintingStrategy(PaintingStrategy.ARROW_DOWN);
dcr.SetLineWeight(4);
dcr.AssignValueColor(if close > ave then Color.RED else Color.WHITE);

plot ucr = if Crosses(if showonlytoday and !IsNaN(close(period = "DAY")[-12]) then Double.NaN else diff, 34, CrossingDirection.ABOVE) and low > ema5 then low else Double.NaN;
ucr.SetPaintingStrategy(PaintingStrategy.ARROW_UP);
ucr.SetLineWeight(4);
ucr.AssignValueColor(if close < ave then Color.WHITE else Color.GREEN);

AddChartBubble(if showonlytoday and !IsNaN(close(period = "DAY")[-8]) then Double.NaN else flipd, high, "CHANNEL RE-ENTRY / INVOCATION", if (SLK > 70) then CreateColor(0, 162, 232) else Color.DARK_GRAY, yes);
AddChartBubble(if showonlytoday and !IsNaN(close(period = "DAY")[-8]) then Double.NaN else flipd, ema5, Concat("CH TGT:", ema5), CreateColor(0, 162, 232), no);

AddCloud(if high[1] > ema44[1] and close < ema44 then ema44 else Double.NaN, ema5, Color.BLUE, Color.BLUE);


AddChartBubble(if showonlytoday and !IsNaN(close(period = "DAY")[-8]) then Double.NaN else flipu, low, "CHANNEL RE-ENTRY / INVOCATION", if (SLK < 30) then  Color.RED else Color.DARK_GRAY , no);
AddChartBubble(if showonlytoday and !IsNaN(close(period = "DAY")[-8]) then Double.NaN else flipu, ema4, Concat("CH TGT:", ema4), Color.RED, yes);

AddCloud(if low[1] < ema5[1] and close > ema5 then ema4 else Double.NaN, ema5, Color.BLUE, Color.BLUE);

def aim = if flipd then ema5 else if flipu then ema4 else aim[1];

def cmem = if flipu or flipd then 0 else if Crosses(aim, close, CrossingDirection.ANY) then 1 else Double.NaN;
def cmemh = if cmem != cmem[1] then cmem else cmemh[1];

plot chaim = if aim > .02 then aim else Double.NaN;
chaim.SetStyle(Curve.SHORT_DASH);
#chaim.AssignValueColor(if cmemh > 0 then Color.BLACK else Color.WHITE);
chaim.AssignValueColor(Color.WHITE);
chaim.SetLineWeight(4);

AddLabel(aim > .02, Concat("CURRENT CHANNEL TARGET TO AIM FOR: ", aim), if aim < close then Color.RED else Color.GREEN);

def distance = (ema2 + ema4) / 2 - (ema3 + ema5) / 2;

def dc = Crosses(high[1], ema2[1], CrossingDirection.BELOW) or Crosses(high[1], ema4[1], CrossingDirection.BELOW);
def uc = Crosses(low[1], ema3[1], CrossingDirection.ABOVE) or Crosses(low[1], ema5[1], CrossingDirection.ABOVE);

def stup = if dc then high[1] + distance / 2 else stup[1];

plot stupper = if showonlytoday and !IsNaN(close(period = "DAY")[-20]) then Double.NaN else if stup > .02 then stup else Double.NaN;
stupper.AssignValueColor(if close > EMA then Color.RED else Color.DARK_RED);

def LEMAU = ExpAverage(high, 36 * 23);
def LEMAL = ExpAverage(low, 36 * 23);

def prevdmove = (high(period = "Day")[1] - low(period = "Day")[1]) / ((high(period = "Day")[1] + low(period = "Day")[1] + close(period = "Day")[1]) / 3) * 100;

AddChartBubble(if showonlytoday and !IsNaN(close(period = "DAY")[-8]) then Double.NaN else stupper[1] != stupper[2] and stupper < LEMAU, stupper[1], Concat("SELL TO:", stupper), if prevdmove < 1 then Color.RED else Color.GRAY, yes);

def stdn = if uc then low[1] - distance / 2 else stdn[1];

plot stlower = if showonlytoday and !IsNaN(close(period = "DAY")[-20]) then Double.NaN else if stdn > .02 then stdn else Double.NaN;
stlower.AssignValueColor(if close < EMA then Color.MAGENTA else Color.PLUM);

AddChartBubble(if showonlytoday and !IsNaN(close(period = "DAY")[-8]) then Double.NaN else stlower[1] != stlower[2] and stlower > LEMAL, stlower[1], Concat("BUY TO:", stlower), if prevdmove < 1 then Color.MAGENTA else Color.GRAY, no);

AddChartBubble(if showonlytoday and !IsNaN(close(period = "DAY")[-8]) then Double.NaN else CI[2] < 34 and CI[3] > 34, close[2], "CI GUIDANCE", if prevdmove < 1 then Color.MAGENTA else Color.GRAY, no);

def stdn2 = if uc then stdn[1] else stdn2[1];

plot stlower2 = if showonlytoday and !IsNaN(close(period = "DAY")[-20]) then Double.NaN else if stdn2 > .02 then stdn2 else Double.NaN;
stlower2.SetDefaultColor(Color.BLUE);

AddCloud(if high > ema4 then high else Double.NaN, low, Color.GREEN, Color.BLACK);
AddCloud(if low < ema5 then high else Double.NaN, low, Color.RED, Color.BLACK);
AddCloud(if high > ema4 then high else Double.NaN, low, Color.GREEN, Color.BLACK);
AddCloud(if low < ema5 then high else Double.NaN, low, Color.RED, Color.BLACK);

AddLabel(high > ema4, "ABOVE CHANNEL BUYING!!!", Color.GREEN);
AddLabel(low < ema5, "BELOW CHANNEL SELLING!!!", Color.RED);

AddLabel(yes, Concat("DISTANT CHANNEL RISK: ", if AbsValue(close - ema4) > AbsValue(close - ema5) then AbsValue(close - ema4) else AbsValue(close - ema5)), Color.MAGENTA);

input TF2 = {default "4 HOURS", "DAY", "WEEK"};
def price2 = hl2(period = TF);
input length2 = 88;

def realPart = fold indexR = 0 to length2 with accuR = 0 do accuR + GetValue(price2, indexR, length2 - 1) * Cos(2 * Double.Pi * indexR / length2);
def imagPart = fold indexI = 0 to length2 with accuI = 0 do accuI + GetValue(price2, indexI, length2 - 1) * Sin(2 * Double.Pi * indexI / length2);
def phase1 = if AbsValue(realPart) > 0.001 then ATan(imagPart / realPart) else (Double.Pi / 2 * Sign(imagPart));
def phase2 = if realPart < 0 then phase1 + Double.Pi else phase1;
def phase = if phase2 < 0 then phase2 + 2 * Double.Pi else if phase2 > 2 * Double.Pi then phase2 - 2 * Double.Pi else phase2;

def "Sine Wave" = Cos(phase);
def "Lead Wave" = Cos(phase + Double.Pi / 4);
def ZeroLine = 0;


def support = if "Lead Wave" crosses above "Sine Wave" then low else support[1];
def resistance = if "Lead Wave" crosses below "Sine Wave" then high else resistance[1];
plot s = support;
plot r = resistance;

AddCloud(if low < r and close > r then stupper else Double.NaN, r, Color.CYAN, Color.CYAN);
AddCloud(if high > s and close < s then s else Double.NaN, stlower, Color.CYAN, Color.CYAN);

AddCloud(if low < s and close > s then stupper else Double.NaN, s, Color.CYAN, Color.CYAN);
AddCloud(if high > r and close < r then r else Double.NaN, stlower, Color.CYAN, Color.CYAN);
Understand that zigzags can be taken back (since fractals can be too) and use it responsibly. CI Guidance means energy exhaustion.

Yours, Sincerely

Follow the pendulum.

A NIL++ on the negative side is aiming for a 90 print on the positive side (thin red lines).

Similarly, a NIL++ on the positive side is aiming for a 10 print on the negative half.

A NIL+ is aiming for a NIL+ (purple lines) if nothing else manages to stop it.

A NIL+ to a PONR (point of no return) segment is where Left Shoulders come from if they get to swing back to the middle of the same core range (50%).

-100 is at 1.0073, lots of 200 lines in that area.

This NIL++ to 90% move I would consider finished, yet it fell short of the green 50% line of the same range, so it does not currently qualify for an LS.

I am of the opinion that although price seems to be stuck between the 9EMA and the 20SMA, the momentum is down and we’ll see the lower BB tagged first.

What could flip back the momentum up is if there was a daily close below the S20 followed by 2 daily closes back above. A 3-day procedure. Currently the day to day, constant closings above the S20 to me indicates a distribution. Yes, the BIAS is up – being above the 20SMA, which may end up making the kick start difficult.

People, I am looking for a new job, putting together a portfolio of web works in the coming weeks. Could you possibly help?

http://macdulio.42web.io/

Music? Of course. Sorry.

A NULL is a match of a previous Zero level & missing the cue. A Head is between a 0 and an outside 17 pips (between ZERO and the NBE (No Break Extension). A Hat can go a little further and fiddle around a bit, but would likely not reach into the area starting at NIL+ (40%).

Wheel Of Torture

Introducing the wheel of the Range for the first time.

Now, follow what is happening with the NIL+ (40% to 55% extra)

The pendulum has been swinging from NIL+ to NIL+ and no one is stepping up to make a head at a 0 or a 100.

Now you printed a NIL++ (60% beyond the range), bears could take a stand at 0 (Head) and a second stab at a 20% oversold level (Lower High) to get things moving down, they have the ball. By the way, the Lower High does not have to be lower than the Head i.e. if the range does not get a new consolidation axis in the meantime.

NiL+ = full swing
-> NiL+ – one step shy (white field)
or
-> failure at the overbought end
or
-> failure at the oversold end
Min. 50% for an LS to print

Fractals In The Know

Small earthquakes, major bankruptcies, let’s get back to what matters.

In continuation to the CI Moat & The Bear

An outside day takes out the low and the high of the previous day. Both upper and lower fractal.

The one exception to the 10+ pips beat necessary is when the last fractal was an outside day. In this case you may see even less of a beat.

The two daily closes above the S20 flipped the momentum back up temporarily.

The last 3 turns cost back to back / two CAPsize attempts. Shy of the BB so far.

The green NBE is meant to say that it’s ok to sell the No Break Extension level.

///2 closes above 20
   if (iMA(symbol,0,9,0,MODE_SMA, PRICE_CLOSE,i)<E44[i] && Close[i]>iMA(symbol,0,20,0,MODE_SMA, PRICE_CLOSE,i) && Close[i+1]>iMA(symbol,0,20,0,MODE_SMA, PRICE_CLOSE,i+1) && Close[i+2]<iMA(symbol,0,20,0,MODE_SMA, PRICE_CLOSE,i+2)) cap[i]=1;
   

Wherever I lay my fractals, that’s my home.

The idea behind shining dark like a black diamond, Jamie – if you need a friend- is that if a party is eager to make a move they would step in front of the line just at or a little beyond the zero line (a head/hat suspect). I use 17 pips extra as a filter (I promise you I will.).

///fractals in the know
if (iFractals(symbol,0,MODE_UPPER,i) && High[i]<NBEU[i]+170*Point && High[i]>NBEU[i] && NBEU[i]!=EMPTY_VALUE && High[i]>iMA(symbol,0,32,0,MODE_EMA, PRICE_OPEN,i)+50*Point
   && iHigh(symbol,0,iHighest(symbol,0,MODE_HIGH,6,i))==iHigh(symbol,0,i) && !(High[i]>iMA(symbol,0,366,0,MODE_EMA, PRICE_MEDIAN,i) && High[i]<iMA(symbol,0,484,0,MODE_EMA, PRICE_MEDIAN,i))
){
   EU[i]=High[i]+60*Point;
}

if (iFractals(symbol,0,MODE_LOWER,i) && Low[i]>NBED[i]-170*Point && Low[i]<NBED[i] && NBED[i]!=EMPTY_VALUE && Low[i]<iMA(symbol,0,32,0,MODE_EMA, PRICE_OPEN,i)-50*Point 
&& iLow(symbol,0,iLowest(symbol,0,MODE_LOW,6,i))==iLow(symbol,0,i)
){
   ED[i]=Low[i]-60*Point;
}

The black diamond has a first target at the middle of the range (green grin) and a second target at the oversold level. Why?

The stage 2 aggression is stepping in at the overbought level of the current range and stage 3 is attacking it at the oversold.

Based on the above, a left shoulder is not a step up, it is a dropped ball, a double start. Penalty for not getting over the point of no return. 40-70% extra beyond the range. The point I’m making here is that I no longer think that an LS is a requirement for a tutn. Often present, but not always.

Home, Rome – what’s the difference?

Wherever I roam, my head gets stepped on.
I’m fine, but I’m just thinking of the blockwurst.

In the know, in the snow – what’s the diffrtence? It will all blow over.

Lovers in the blow. I know, I did not even have to say it. You figured out this one by yourself.

xtension fills

Headed for the next continuation divergence up?
13 pips

Psar-Scared

All those trendlines drawn with high hopes for naught.

Understanding The Range #11

In the world of convenience, 11 comes after 7.

Over the rainbow, over the bought.

An example of a 100/200 failure above. 100 meaning an extra Range distance down, the 200s are automatically plotted 2x Range distances made by previous ranges (within the sample).

Price comes back to the Overbought level of the range that gets drawn in the future.

Another example of a 100/200 failure from a couple of days ago. Not quite as clean, but ultimately did the same thing – failed back to a future overbought level (of the 2nd consolidation range). Look for the -100 on the bottom left and the 80 up on the right.

The fun part is that a failure does not change the market ditection, but bucks the trend as long as the lasso can reach.

Now, what about this Malcolm in the Middle?

This was a liquidity grab, look at the sequence at the bottom: there was a Zero print followed by a buy at the future oversold level. It resulted in an ABC move printing 180 (overbought of the extension Range) on A and 180 on C.

On the chart you see a lower low being made, but relative to the Range, this second leg fell shy by 20%. An impulse bottom.

Where was a Left Shoulder/Butt Cheek at all? I could not see one.

If you want this to be a bottom and an IHS, that would come handy. You want bottoms to be spankable. You want the power of love to be overwhelming.

Beethoven

I don’t usually engage in blog articles that are rubbing in, but I do like to show you the world and what else is out there.

So I do appreciate that everyone is trying their butt off to be making coherent moves in the market. It is ridiculously hard. No matter how intelligent you are, if you are not understanding the true mechanics, then your conclusions would not be right either.

In short, this Elliott Beethoven decided that there would be a higher high, he would go short 20 lots, cover 10 lots at twice the length of his risk (1 to 1), then cover 5 more lots at the lower horizontal line and ride 5 more lots for a home-run to below the last low and beyond. At least this is what he said in his recruitment video for future paying members.

-200 is at 1.00447

I, on the other hand have identified the Left Shoulder, the CAP (a bit more complex than a head) and the Lower High when price returned to the overbought level for a Kiss Goodbye. I was not looking for a higher high, so I ended up participating instead of watching from the sidelines.

Thanks to my understanding of the range, I would be looking for a Left Shoulder, then a Head/Cap and the KGB to fully reverse my position. I also understand that price has to first paint a new range, as it went beyond the point of no return.

Enthusiasm is one thing, intelligence is another, but knowing the right answers is like playing in a different league entirely.

Just like earlier, when the first 8 days failed to to touch the E-44, the momentum flipped negative on day 9 by default.


///fizzle out
 if (High[i+8]<E44[i+8] && High[i+7]<E44[i+7] && High[i+6]<E44[i+6] && High[i+5]<E44[i+5] && High[i+4]<E44[i+4] && High[i+3]<E44[i+3] && High[i+2]<E44[i+2] && High[i+1]<E44[i+1] && High[i]<E44[i] &&
   cap[i+8]>0 && cap[i+7]>0 && cap[i+6]>0 && cap[i+5]>0 && cap[i+4]>0 && cap[i+3]>0 && cap[i+2]>0 && cap[i+1]>0) cap[i]=-1; 
   

Quoting Ira Epstein, “why would you do anything before the reports come out?” – “I think they are going to be fighting a battle right here for the next 3 days.”

Except, the 9th day had arrived. Intention is one thing, experience is another. Learn to trade with the range.

Understanding The Range #7

Lasr entry of the series about comfirmations & story line.

License to Ill

The confitmation to the LS is a return to the 50% line of the range (from now on in green).

Ferry have no Mersey

The confirmation of the head in place (new direction on) is an hourly close on the other side of the 89-121 band.

I’m at work currently, will add pictures later.

So what is the game here played then?

A continuum. There are positive and negative syne waves. The hourly E-89 to E-121 is the bridge that cannot be crossed without a license. The buerocracy dictates that there would be two steps to attain the stamp for crossing. A left shoulder is the petitioning office. They accept the case by letting price return to the consolifation mean. Their open hours are from 45% to 70% outside the current range.

The stamp duty is paid to the Head. This is a Zero line that raises the water level temporarily to ideal for the ferry to cross (& then ypu can go out with the high tide ~ pull back to oversold). A draw bridge made out of water. Oh, mercy, mercy me.

C’mon, gimme props for making 7 blog entries about NILs without mentioning Holgerson anywhere.

Here’s an example on how to apply this knowledge in practice about the Mersey the LS and the H.

There was a long trade to be had from the Band to the Zero level. There was a short trade to be had from the zero level.

Now, what to make of this move from -35 back to 135? It was certainly unexpected. All I can think of is if I was tasked with plunge protection, I would be buying below the E121H (Red line).

Here are 2 examples for a NIL+ not becoming an LS (no tie back to the fair price).

30% – may be a tender thing at first

Understanding The Range #6

Let’s talk NIL+.

A left shoulder is a NIL+ against a prevailing direction effectively choking it / matching it. Obviously the first move coming off a head print would not likely qualify for an LS.

I have cited point of no return a number of times in my columns.

Relative to the consolidation range, I put the NIL+ range from an extra 45% to 65%. Something going beyond 80% will have exceeded the point of no return.

About the NIL+ to -NIL wrapping. The wrapping takes place around the current Zero level (this can be a 0-Cyan or a 100-Magenta) as this level becomes the anchoring axis of the mini pendulum swing(s). -NIL is meant to say “mirror” swing, and it happens towards the inner side of the range.

Whichever current NIL level gets exceeded by 10+ pips would be marking a breakout underway.

Love is Minecraft,

But where’s your resolution?

Understanding The Range #5

There’s an old Tennessee saying:

Fail me once, fail me… I can’t get failed again!

I know that OBGYN and fish can co-exist consentually.

Subtle things.

Napoleon Dynamite reminds us that the can’t get leg that tagged the daily 20 SMA, would be good for a head if only we could trade in the multiple fails at 300 for an LS. Also, if we could credit a move down to 30 with going oversold during low volatility, this tagging of the overbought level would be the perfect short entry.

Don’t mind me, just thinking out loud.

Understanding The Range #4

So what happened?

There was a break above the NIL+ by 10+ pips. Next target could had been the 300 level at 1.02069, but we had a failure at 1.0199 which was a 300 level of a previous range and the subsequent reaction went to the overbought level of the senior range.

I wasn’t certain if the first pull back to the zero after the LS print counted as a head, for there was no new consolidation / range adjustment.

Now I know that it was true love.

We are looking for a left shoulder again then.

45% is at 1.0217. 60% at 1.0228

After the left shoulder price would have to go oversold (1.0126), consolidate thrn tag a fresh Zero (100 / top of the range).

Remember, the full reversal is a 2-step process.

Rather strong move for an LS.
Another day, another LEMA.

The next 300 level is 1.02639.

No left shoulder yet.