Captain America

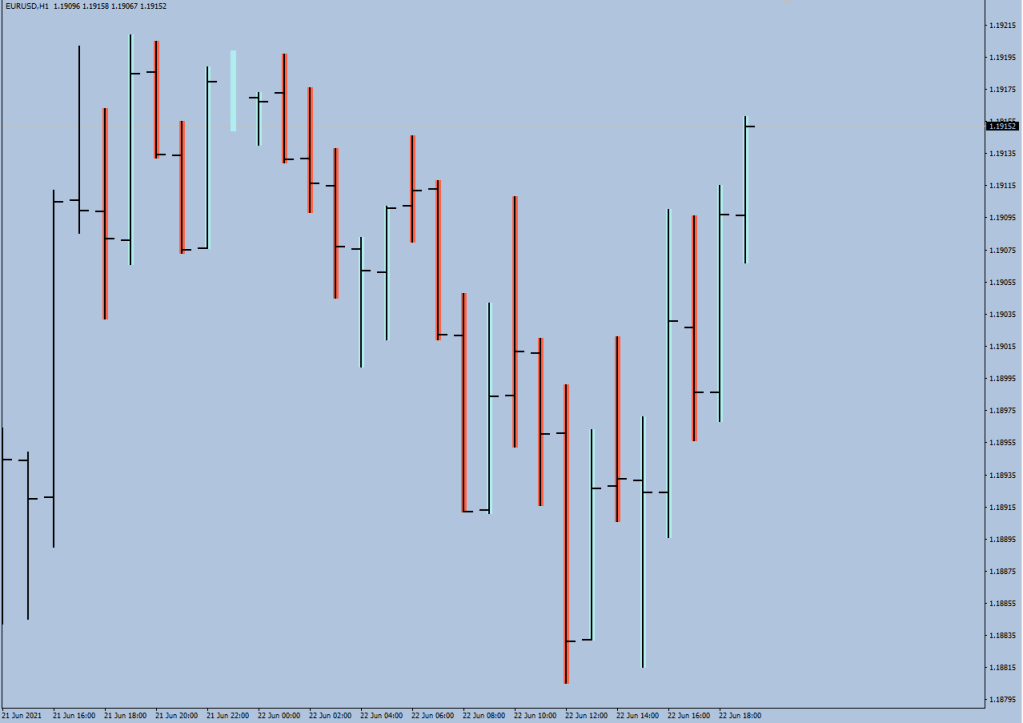
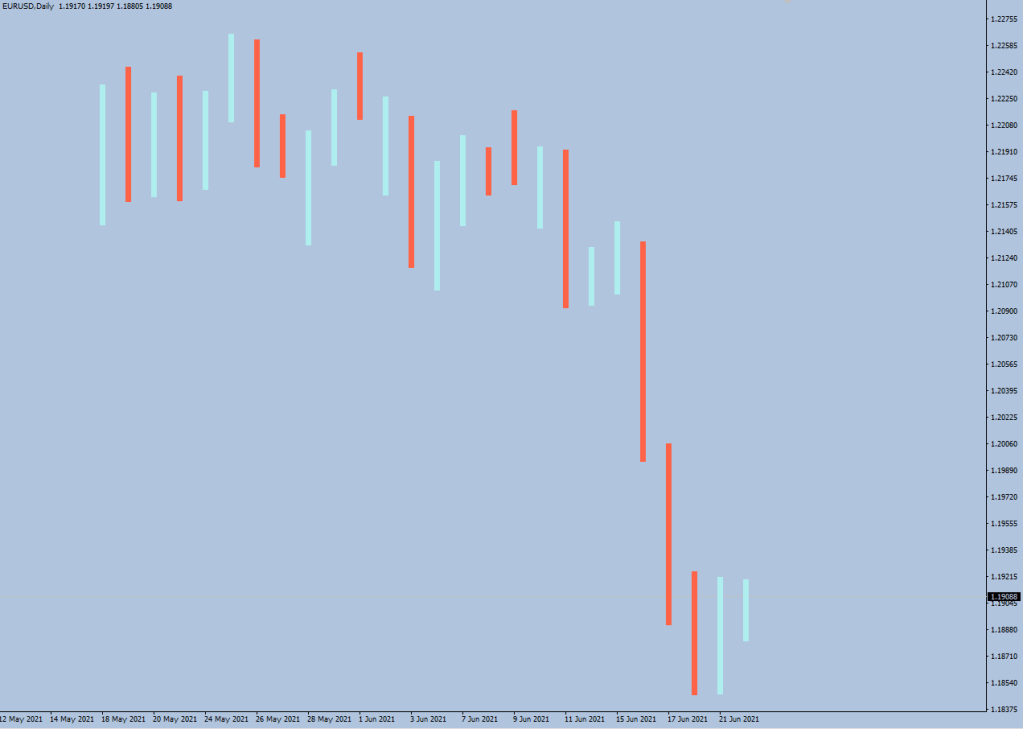
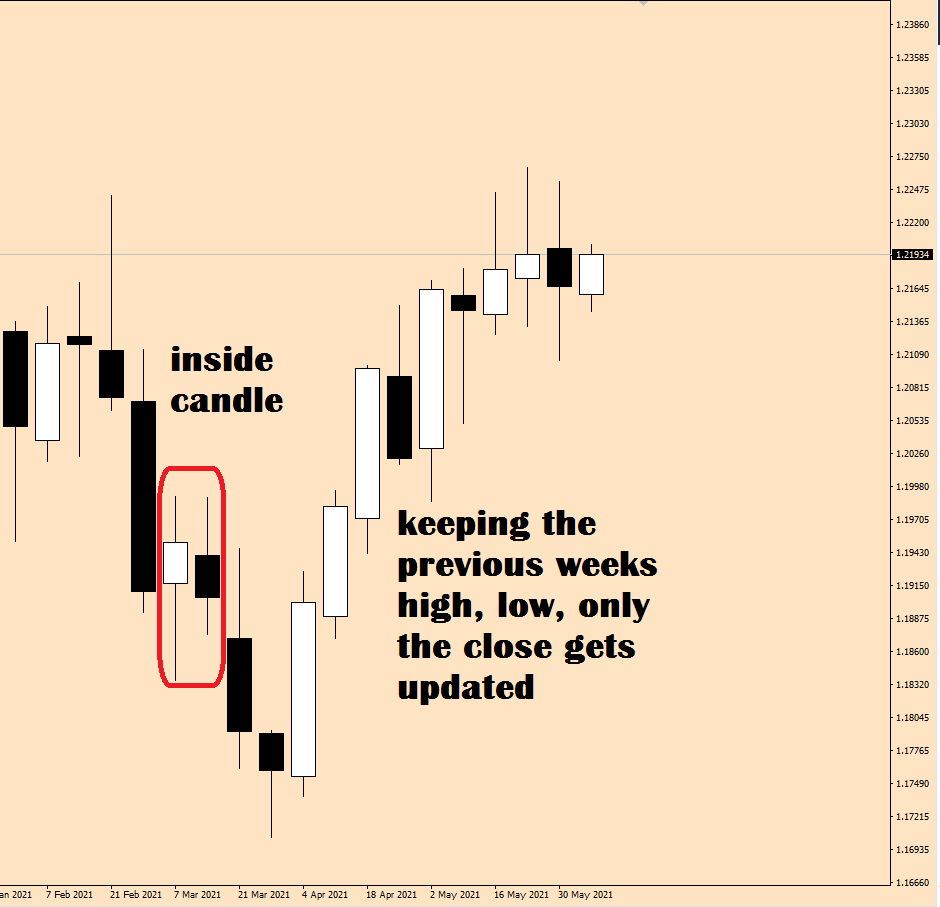
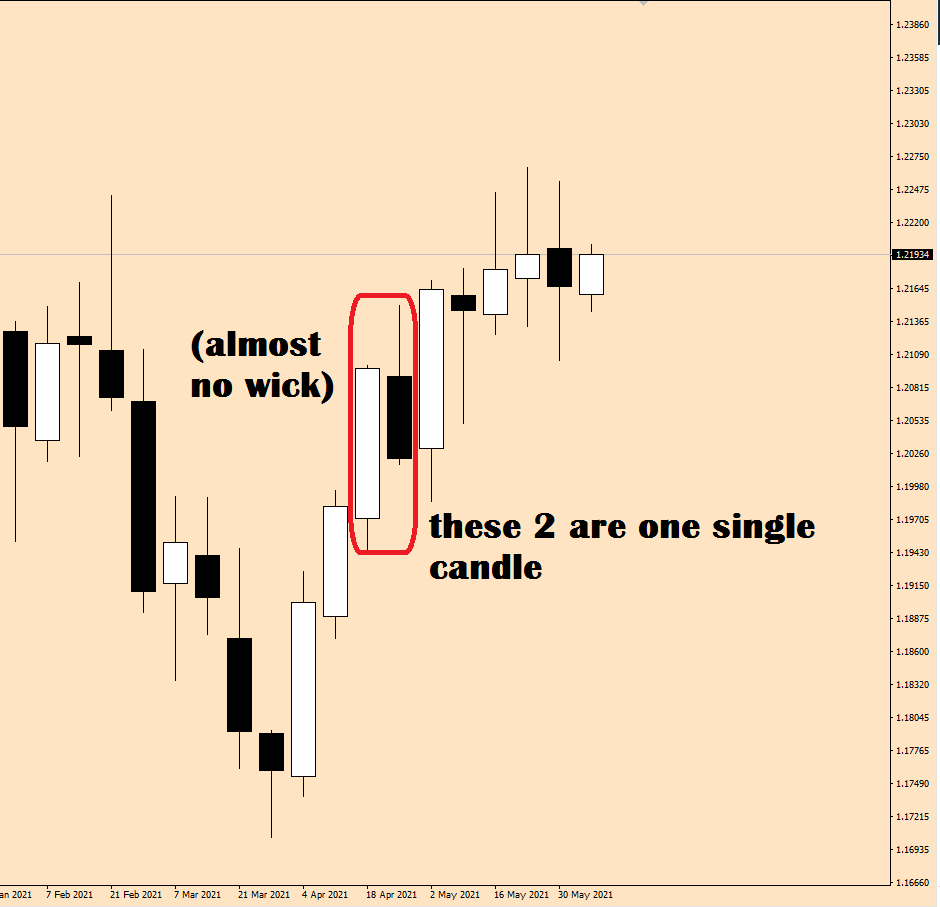
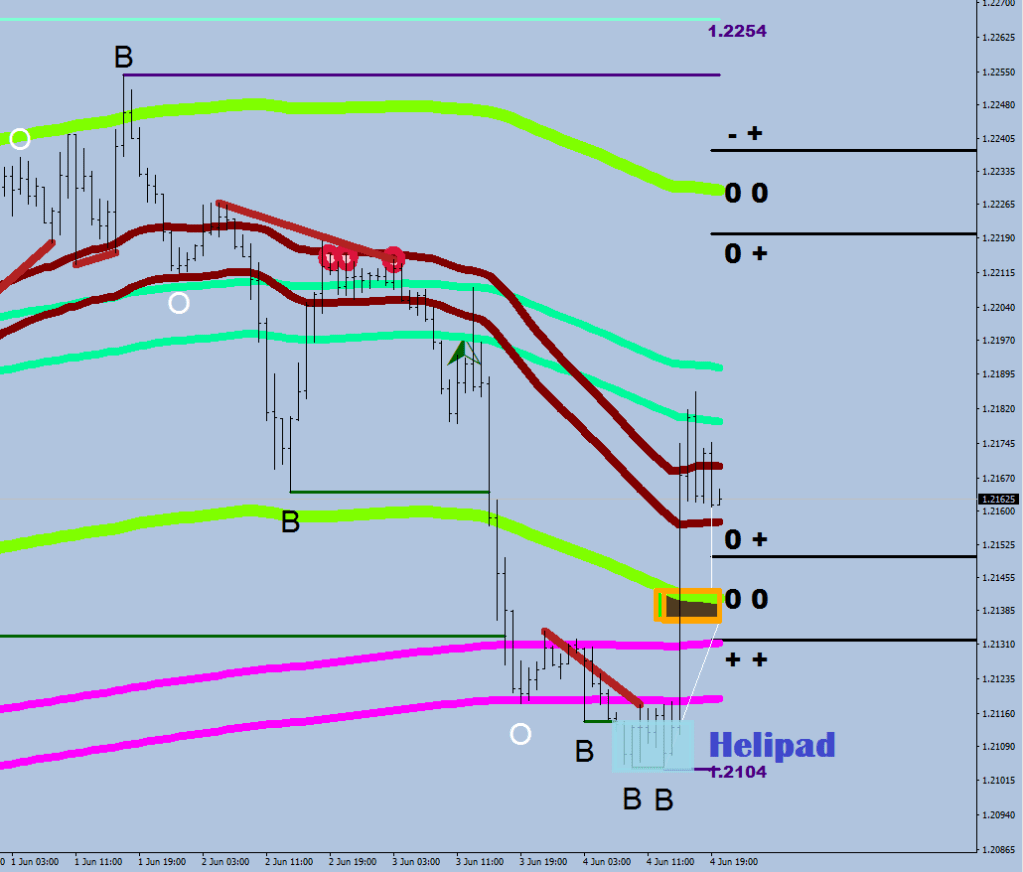
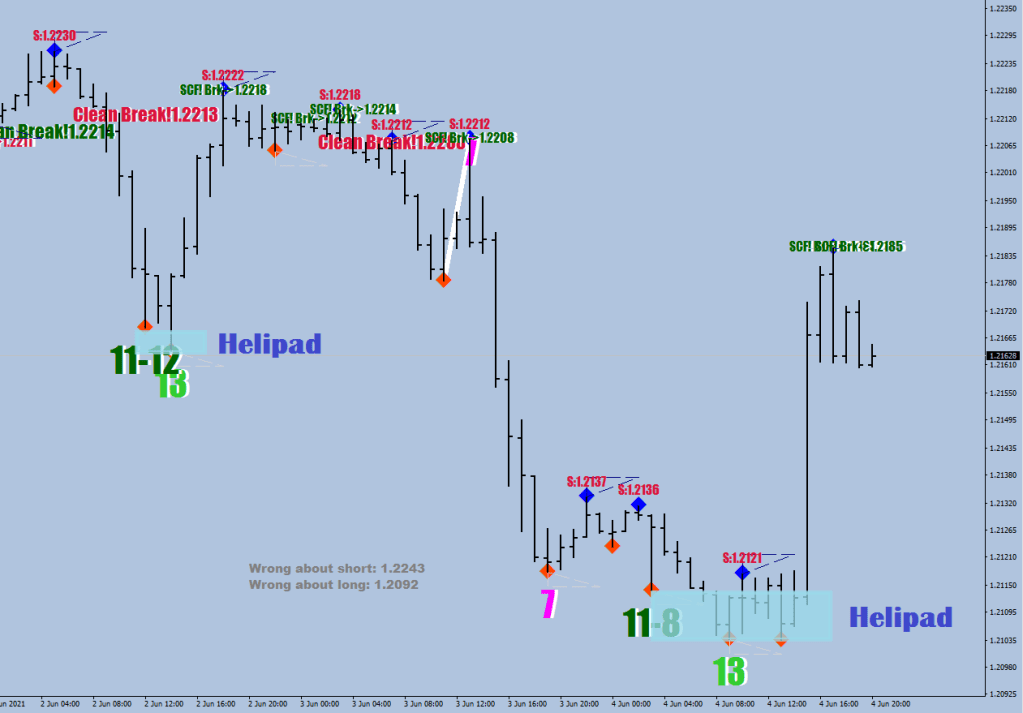
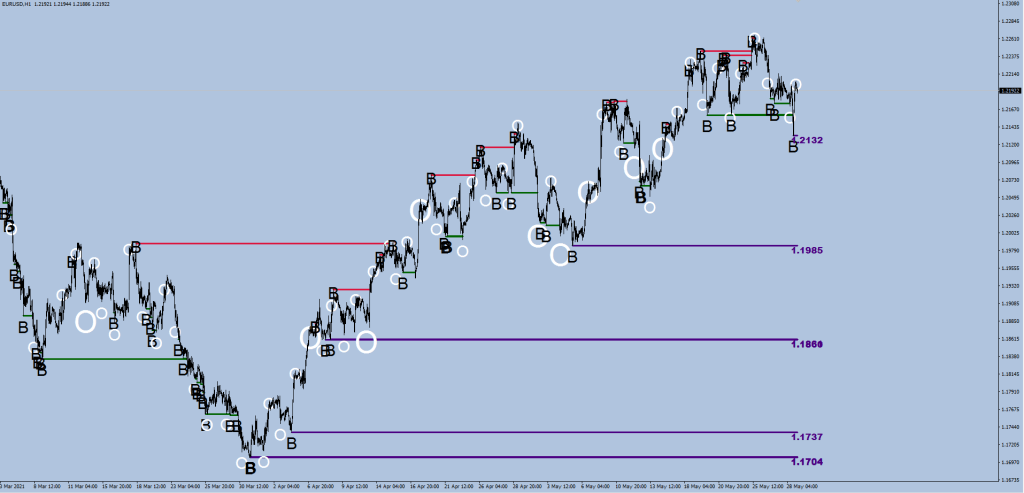
What is the similarity in the following two pictures?

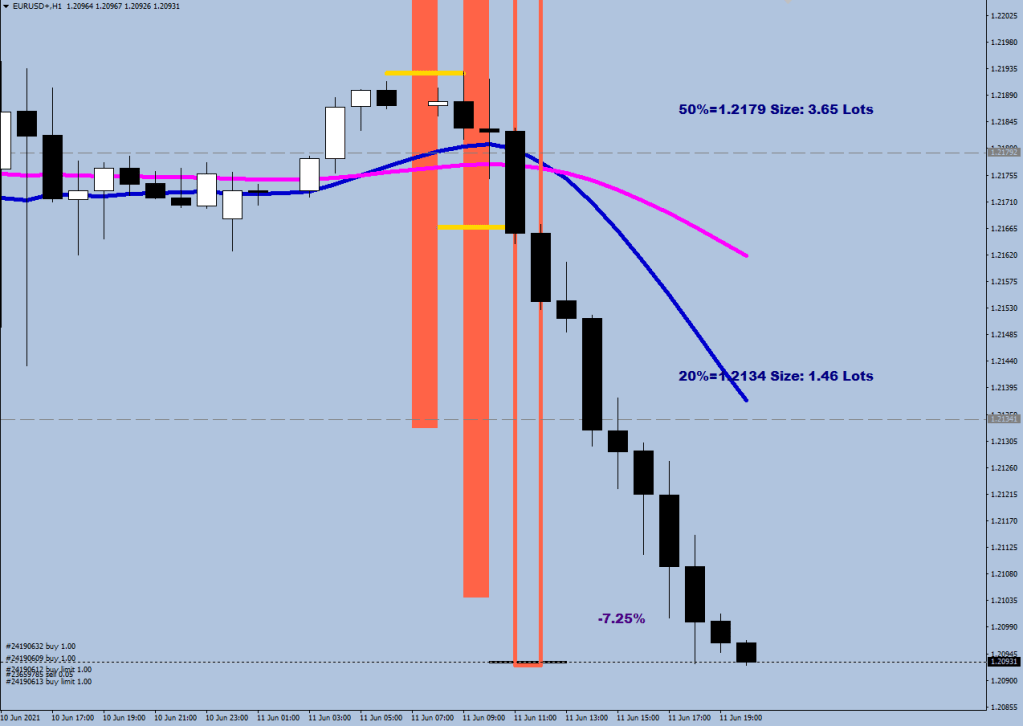
There is a green line, good. Parabolic move? Define parabolic, Mr. Captain America!

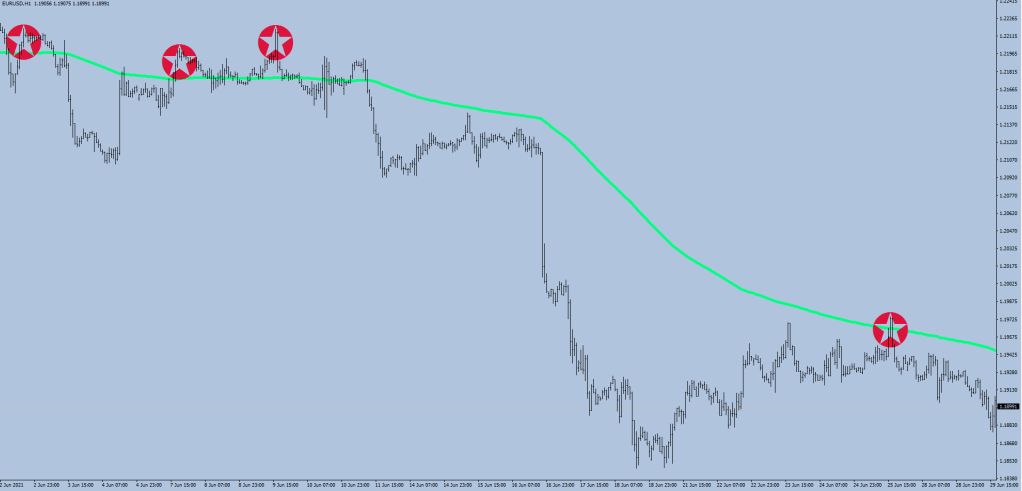
That’s right, that’s bright.

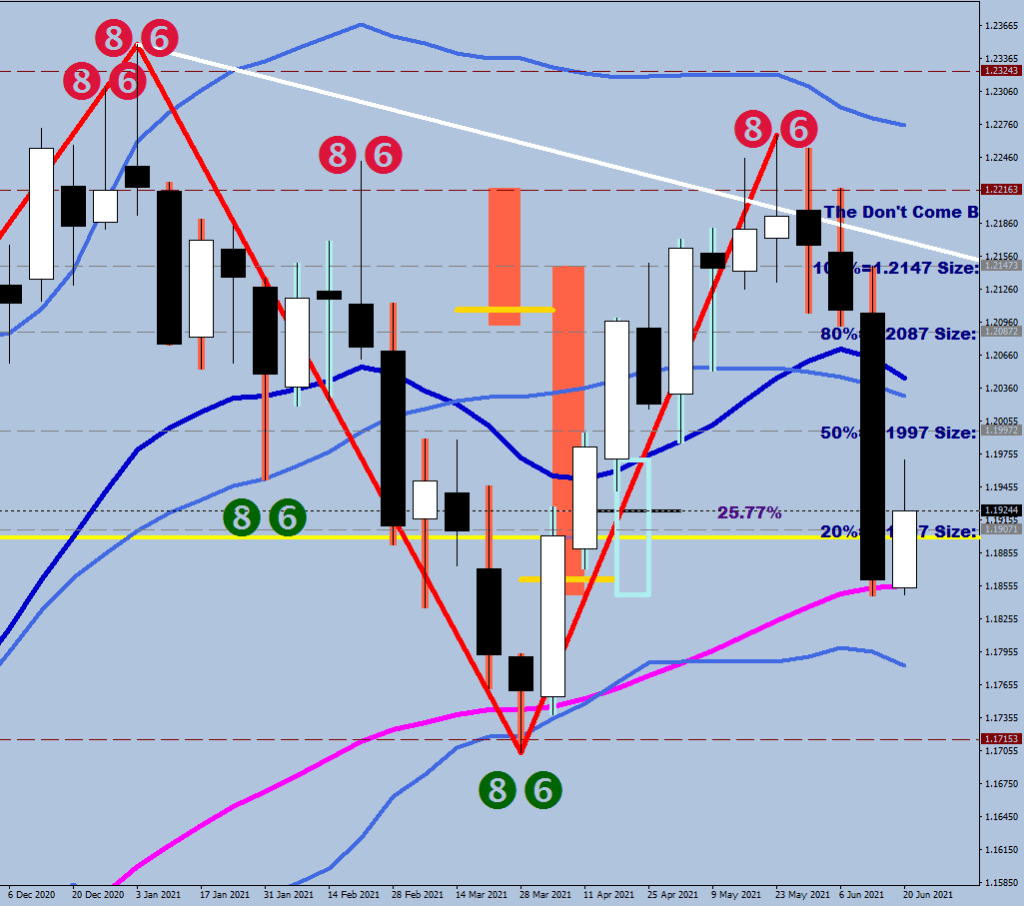
High[i]>High[i+1] && High[i]>High[i-1] && i>0 && High[i]-380*Point<iHigh(symbol,0,iHighest(symbol,0,MODE_HIGH,2,i+4)) && High[i]>iMA(symbol,60,207,0,MODE_EMA, PRICE_LOW,i) && High[i]-250*Point>iHigh(symbol,0,iHighest(symbol,0,MODE_HIGH,2,i+4))

See what I did there? I quantified the distance I want to see between this high over the mean: not less than 25 pips but not more than 38 to the last step down. I’m a quant: a quant quantifies things.

Do you buy doughnuts by the dozen? Milk by the liter? Do you measure the time with something? Everybody is a quant on this bloody planet.

Why do they have to Mystify things?

In Europe people measure things. We have functioning penis-enlargement economy.

The unofficial, Italian currency of appreciation is Un Ereccione.

I have been trying to get you to start measuring things, I swear, and to count, all the way to three.

The RSI2 once it hits the floor, it starts skewing. The Sign Of Strength during this lop sided event qualifies with a 77+ reading.

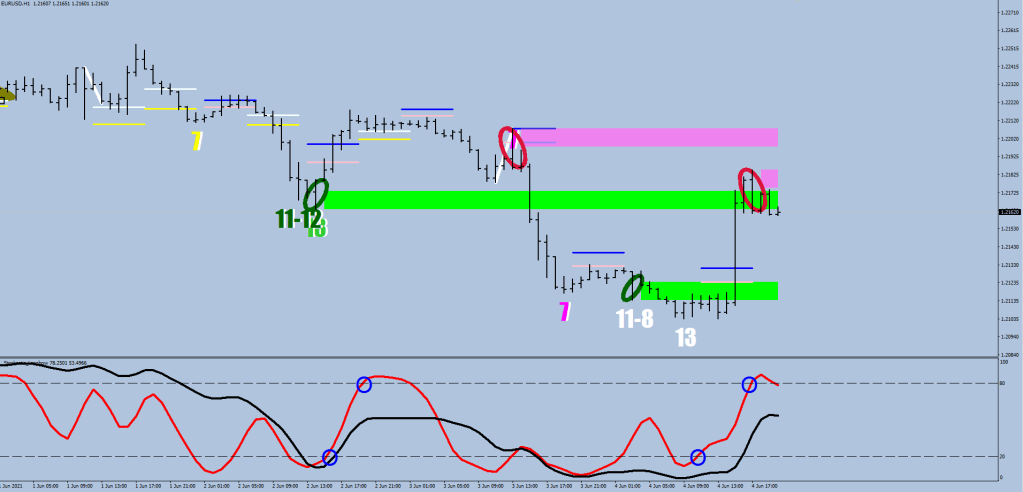
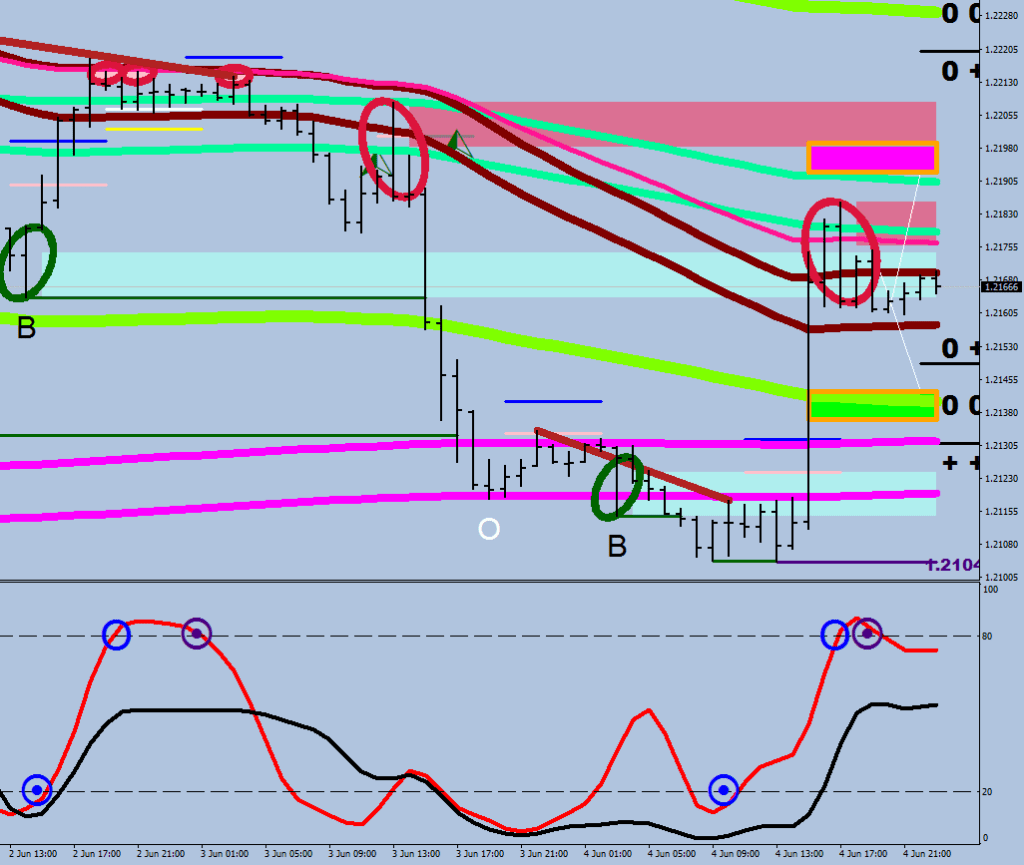
Pay attention to the SOS only after the correction is over with. Count. Captain America (now part of the Fractals Blobified routine) = parabolic move => you’re gonna see 3 waves down.

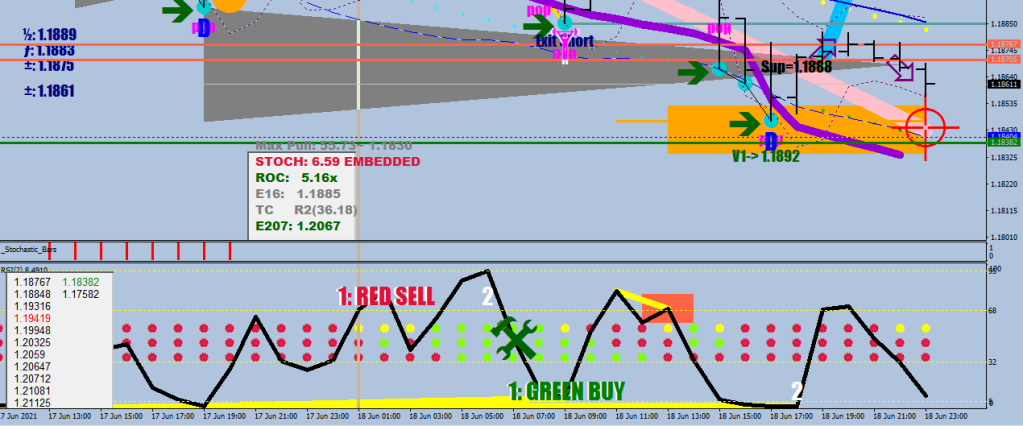
& for last, what’s the play after a 5 Wave down followed by SOS?

Buy the SOW (sign of weakness) and afterwards buy the ABC beats, i.e.:

Why? Because the weekly music is still Green – only Capt. America put up some fight temporarily.

Never Trust A Single Time Frame

There is a reason I made the Candle Fabricator routine.

Let’s look at what the “86 filter” was capable of picking up on with these and similar premises:

///in order to this week to be the swing low, the week has to make a lower low and 
/// it has to close up by 85 pips and be black
/// or it as to close up by 50 pips, the previous week has to be black and the current low has to be below the previous close by 85 pips 
/// you want to see a tomato wick for a bottom

It looks good, doesn’t it? But what about the current low?

Be a fox and think outside your socks.

If you combine the last two weeks as a bi-weekly candle, it would fulfill the criteria of a long wick at the bottom.

As you can see the original premises already had the idea of reaching beyond the restraints of a single time frame by combining the last two weekly candles to measure a wick that is larger than 85 pips.

This current example needs a little more finesse.

(Close[i+1]<Open[i+1] && Close[i+1]-Low[i]>850*Point && Close[i+1]-Low[i]>550*Point && i>0 && Low[i+1]<Low[i+2] && Close[i-1]-Low[i-1]>460*Point) 

I myself said that it was not a valid low. And it wasn’t until the next week printed and my vision along with my filters had to be re-adjusted to spot Jon and his Wick.

Rather different picture now, isn’t it? Do you still trust candles of a single time frame? I urge you to re-consider!

The slanted contoured lines are the 60 and 100 pip displacements of the 86 terminal for 1/2 and full hedging points – without more numbers on the screen. Pointer over the object, you can read the rest. Those orders should always be there, just in case. ColorBlinD has the last word, and sometimes the last two words. Maybe you can catch me with your brain.

Let’s do some traffic for Brian Hazard as well…

ColorblinD Ashi

From the series, “there’s nothing sacred on this blog”.

“There are two kinds of people, as there are two kinds of candles. Monchiki and Nunchaku. One cannot quote themselves, learn this for once and all, Mr. Nial Fuller.” (Achilles Dentaku)

A candle can either close above the halfway mark of a given time slice or below it.

#property copyright "Copyright © 2021, Macdulio" 
#property link      "https://forexfore.blog" 
#property description "There are two kind of candles"
#property description "in this world."
#property description "Adjust colors for"
#property description "Monchichi and Nunchaku"
#property description "if you dare."
#property strict;
#property indicator_chart_window
#property indicator_buffers 4
#property indicator_color1 Tomato
#property indicator_color2 PaleTurquoise
extern int lookback = 25;
double HighBuffer[],HighBuffer2[];
double LowBuffer[],LowBuffer2[];

int init()
  {
  
        SetIndexBuffer(0,HighBuffer);
   SetIndexBuffer(1,LowBuffer);   
   SetIndexStyle(0,DRAW_HISTOGRAM,STYLE_SOLID,4,indicator_color1);
   SetIndexStyle(1,DRAW_HISTOGRAM,STYLE_SOLID,4,indicator_color1);
  
  
          SetIndexBuffer(2,HighBuffer2);
   SetIndexBuffer(3,LowBuffer2);   
   SetIndexStyle(2,DRAW_HISTOGRAM,STYLE_SOLID,4,indicator_color2);
   SetIndexStyle(3,DRAW_HISTOGRAM,STYLE_SOLID,4,indicator_color2);
 
  
//----
   return(0);
  }


int start()
  {
    ArrayResize(HighBuffer, Bars); 
  ArrayInitialize(HighBuffer, EMPTY_VALUE);   
      ArrayResize(LowBuffer, Bars); 
  ArrayInitialize(LowBuffer, EMPTY_VALUE); 
     ArrayResize(HighBuffer2, Bars); 
  ArrayInitialize(HighBuffer2, EMPTY_VALUE);   
      ArrayResize(LowBuffer2, Bars); 
  ArrayInitialize(LowBuffer2, EMPTY_VALUE); 
  
//--------------------------------------------------------------------


for (int i = lookback ; i >= 0; i--) {
   
 ///Monchici
     if (Close[i]>(High[i]+Low[i])/2) {HighBuffer2[i]=High[i]; LowBuffer2[i]=Low[i];}
//Nunchaku     
     else {HighBuffer[i]=High[i]; LowBuffer[i]=Low[i];}

}
//----
   return(0);
  }
//+------------------------------------------------------------------+

Filter ideas:

  • eliminate inside candles
  • don’t mark up shaven candles (no wicks)
  • exclude candles that do not expand the previous length by at least 5%

something like this:

Remember that scene at the pub in the Leaving Las Vegas, where the barman tells to Mr. Coppola Cage: “I can 86 you any time I want!”

I’m just saying regarding bottom picking.

Filters for example (on the downside): a lower low and a wick larger than 86 pips, or a distance of 85 pips between the last candle’s close and the current wick whilst the current wick is still in excess of 50 pips and the last candle closed lower than opened.

Implementation of the Helipad

There is still a debate between the Outlier – Beat and the Seven – Eleven for getting the pad’s location right.

Regardless, the ultimate answer of taking on a low risk, large sized holding would have to be a combination of a Sign of Strength / Sign of Weakness and the entries themselves would have steps derived from the volatility from the mean (see the Stretch Marker) – further on this later.

First, some definitions out of the way.

Sign of Strength = (hourly RSI2 HL2 > 85)

Sign of Weakness = (hourly RSI2 HL2 < 15)

I now have have a plot going on included in the Sochastic Longbow routine, besides the labels, there are the indication boxes (sparing actual RSI2 plots) and the second row is a 10-sample summation. I was considering to put the label “Fureza” on the upper one and “Interpretación” on the lower, but admittedly it is getting crowded there yet again.

   sum=0;
    
     for(int j=i+10;j>=i;j--)
     {
      sum+=dir[j];    
     } 
     

The distance from the mean gets rounded for a multiplier.

          if (Close[i]>iMA(NULL,0,207,0,MODE_EMA, PRICE_HIGH,i)) ExtATRBuffer[i]= MathRound(MathAbs((High[i]-iMA(NULL,0,207,0,MODE_EMA, PRICE_HIGH,i))/FMax*10000));
  else if (Close[i]<iMA(NULL,0,207,0,MODE_EMA, PRICE_LOW,i)) ExtATRBuffer[i]= MathRound(MathAbs((iMA(NULL,0,207,0,MODE_EMA, PRICE_LOW,i)-Low[i])/FMax*10000));
  else ExtATRBuffer[i]=1;

FMax stands for fluctuation maximum, and is a consant.

Since the market reached a 5x fluctuation maximum stretch (after the ROC label with the x after it) from the mean, my current multiplier for the displacement is 5.

Summa Summarum after the SOS signal, the displacement for the 1/2 size entry from the Eleven count is 5×4=20 pips and the full size displacement is 5×7= 35 pips (see the first image with the “Best Long after SOS” plot)

ObjectSetText("TEACHER"+8,"½: "+DoubleToStr(NormalizeDouble(wronglong-ExtATRBuffer[0]*40*Point,4),4),11,"Arial Black");

ObjectSetText("TEACHER"+9,"ƒ:  "+DoubleToStr(NormalizeDouble(wronglong-ExtATRBuffer[0]*70*Point,4),4),11,"Arial Black");

But teacher, there are things, there are things that I don’t want to learn…

The new company logo has landed…

Candle Fabricator

This is gonna be almost like a Klondike game, but you can actually make money with it.

Game rules:

  1. On Friday you must close your open position unless the market is closing on a weekly high / weekly low.

2. Over the weekend you must fabricate the two last candles. They would be the last weekly high/ low / close and the prior week’s 3 values unless there was a shaven candle (in this case you combine it with the following week) or an inside week – in this case the last candle would remain the one over, but the close would have to be rolled over to the next one.

3. The software derives the candle color from the relative close in the range.

4. If the last fabricated candle was red, you attempt to sell, if it was green, you attempt to buy in the following manner:

you wait till the price trips one of the play percentages and prints an hourly low / high beyond it. You place a buy / sell stop at the gray line thus likely sparing yourself the draw down bit that would come with a limit order.

5. If you don’t get a fill at that level, and price continues to another trip wire, so be it.

6. Sizing is to be calculated from the current equity and bet 20%, 50% or 80% of your maximum risk at the trip wire that is being courted with.

As an exercise, the current courting is happening around the 50% level, and so your sell stop order should be at 1.2179 (gray number on the right).

Yes, I was excited to make this routine a reality after inventing it during work. It took me 2 hours to code it and make the blog entry for it. Very satisfied, especially that I have made EAs that place limit orders in a similar fashion, you can generate/plug in the level, but they would only place the pending stop order out after the level aimed for gets exceeded first. Also, this system could be applied to any other instrument.

& now there is the ghost of the current weekly candle as well

Helipad, Full Length Wave

Let’s talk about the motivation for this article.

I missed out on 3k again today thanks to my devil dog, le fear unrationale.

I am 4.7 lots short by default. Taking on longs decreases the naked exposure, so it is strongly advised – at the right places.

Seeing that the market is making multiple beats, I scaled in. Had 4 lots at a time, bought 4x 0.5 more later on.

My trading career is about one single thing: learning to hold.

I got too complacent with the $423 gains yesterday, so today I was only doing things half heartedly. I took $230 and left another 3k on the table. This is what I need a partner in crime for: I know all the answers, but I do freeze in action, forget to ask the right question out loud and go passive too often. I was in the trade. All I had to do was to hold for a full length wave – more on this later.

What is a helipad?

A helipad is the area between the swing point and the first beat of the outlier (plots of OBB).

Routine

A helipad is the area between an Eleven and a Thirteen (plots of the Modified Modified Fractals).

R

Basically, as soon as you exceed 11 or the Beat, you can start accumulating for a full length wave. That expression again!

I reached inside my indicators and made this redux plotter – now called Stochastic Longbow.

The 9-sample stochastic D with 3 delay is the best measurement of a full length wave between 20 and 80 that I know of. Circles are plotted automatically.

There are some inside tricks to be had such as putting “0.9” for stop loss and have my auto trail stop relentlessly adjust the target level based on the current location of the E-89 until the push away happens and then the stop loss has to be put with a 0.2 to automatically lock in 3.5 pips and trail 32 pips behind the highest high achieved.

As for continuation on the upside, I don’t think so. Crossing back below the E-89H within 2 hours is how a new leg kicks in. Zero Three was activated I believe. I’m expecting serious downside here: the Zeros are not part of the leg count. 6 legs down with the first 3 coming from beyond the E-16L and the second 3 from beyond E-32 for a start. 9 or 9+12 legs if things get some good traction.

“I reached inside myself and found… Nothing to ease the pressure of my ever worried mind…”

The ins and outs of trading with stochastics:

The ones with the nipples (nippon-ken) are the ins, and the doughnut ones are the outs. Macdulio out.

Trust me, if you have to trust someone.

Kiss AMC

Since there is a lot of misinformation out there, I must do my part of correcting a few things in people’s thinking.

Of course this is about the “sticking it to the hedgies” and the “to the moon” mentality of the new found gamblers of Wall Street.

Regarding the run AMC experienced upon breaking above 20.

Those buying the call options, have to think about who is at the other side of their trade. Who has enough funds to be late to the party and still clean up everything?

The big banks. Seldom hedge funds. Selling options naked can be very costly.

But when a frenzy builds up and a break becomes imminent, Goldman Sachs and the likes buy the underlying asset to hedge their risk (they see the arriving orders, and can take actions accordingly) – and here is the important part: they overdo it, making the break have an even larger effect plus make some change with it as well.

The losers are keep on buying, adding to their position aiming for unattainable numbers. But Goldman has more than enough covers, and whilst they were aiding the move at its beginning, they are able to sell the calls / shares in the future for the additional demand covered, knowing full well that the price is going to peak, reverse and collapse swallowing the purchasing cost of the call options expiring out of the money from the retail.

What is important to understand here is that they have the upper hand every step of the way. They play along by giving you the fills, they make the break out happen, and they make the break out fail (wherever the demand drops below the frenzy level).

Kiss your AMC goodbye. Hodling is suicidal.

What was different about Game Stop is that they were not able to buy the underlying shares, for the demand exceeded the underlying float by an extra 40-50%, meaning there were no shares at all, regardless of how big of a bank you were. This squeeze was a lesson and they are not likely to fall in the same trap again.

Find a game where you can have an edge against the bank.

Virgo Beats & Naked Outliers

Virgin POC? How about one better?

If you see a purple line below the price, you are in an uptrend. Re-visiting a POC does not necessarily mean a reversal. Taking out some indigo does – after the ink has dried of course.

Lots of lines stacking up = donations are being collected for a field trip.

So, let’s pick the theme for this article. We built this city with Felicity – would do.

It would be low pay-grade to pitch a Naughty By Nature hit here based on the presence of the letter O and B. What? G.Y.N.? Like I said it in the beginning, we can do one better.

Let’s zoom in on what is going on here.

Based on the filters, there was a Beat-come-lately that very much looked like an outlier that was left without a beat. Looking left you could swear you were presented with a head when all the virgo beats got tackled in a single hour. You could even go as far as to say that there was no field trip attraction left with the off-beat O choking the prospects of the untouched Beat away.

Now, if you are curious about the applied filters, there’s truly nothing fancy.

(RSI2[i]>0.8  ||  RSI2[i+2]<1) 
iHigh(symbol,0,iHighest(symbol,0,MODE_HIGH,2,i))<iHigh(symbol,0,iHighest(symbol,0,MODE_HIGH,22,i))


(RSI2[i]>91 || RSI2[i]<86)
(High[i]-iMA(symbol,60,16,0,MODE_EMA, PRICE_MEDIAN,i)>260*Point || RSI2[i]<94)
!(High[i+1]<High[i+2] && High[i+3]<High[i+2])
iLow(symbol,0,iLowest(symbol,0,MODE_LOW,2,i))>iLow(symbol,0,iLowest(symbol,0,MODE_LOW,22,i))

The title of the routine? You know what? OBB. I could not think of anything better, pardon me.

Naked outliers, how significant are they? Let’s find out & include them in the shape of the Aquatic empire.

For more on Outliers / Beats & leg counts see my blog entries of late – rolling the credits now.

Flawa Mea

So, I figured why not make a balance of flowers indicator: grab the last five RSI readings, average them and if you get larger than 50, that’s green, less that’s red.

The second row is the same thing, but with half a dozen for a bouquet.

Still don’t believe in indicators? What are you using your eyes for if not to identify something that may indicate something you recognize? I make the charts translate themselves. This is what I do.

6 is expected to make a beat beyond the outlier fractal (often made by 5, sometimes by 6 itself) by 10,21 or 29 pips

That’s all for today, folks!

I was considering some nice, controversial stuff now that I am being boycotted by one of the forums I used to be posted at frequently. See, it is kind of liberating to have less restrictions, so I started planning for some self fulfilling entertainment.

Life is born from unprotected sex

Life is torn by sharing needle with your ex

& this was how far I got with my elaborate scheme.

Never seen anybody else do this. It was a break in the market profile. The support is not the 39, because that’s the largest number, the support is the difference between the 18 and the 27. Too large of a step.