I’m on the record for calling the Mastodon while it was printing.

No chest dangling here, I traded like a biach afterwards.
I went from the initial position of 9 lots long and 10.9 lots short to 9.5 lots long and 7 new lots of shorts by the end of the day, and wasted all of my short prior holdings covering them for chump change, like I always do. Don’t laugh, I only collected $420 today, bringing the month’s total to $5,576.60.
Now, the part where I gain some traction here (perhaps you can too) is drawing conclusions and making the necessary adjustments for the future.
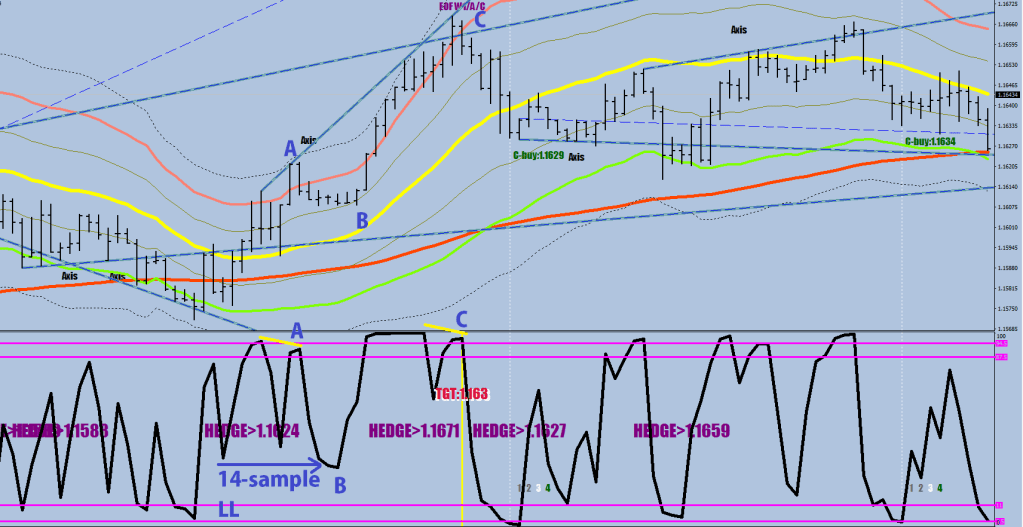
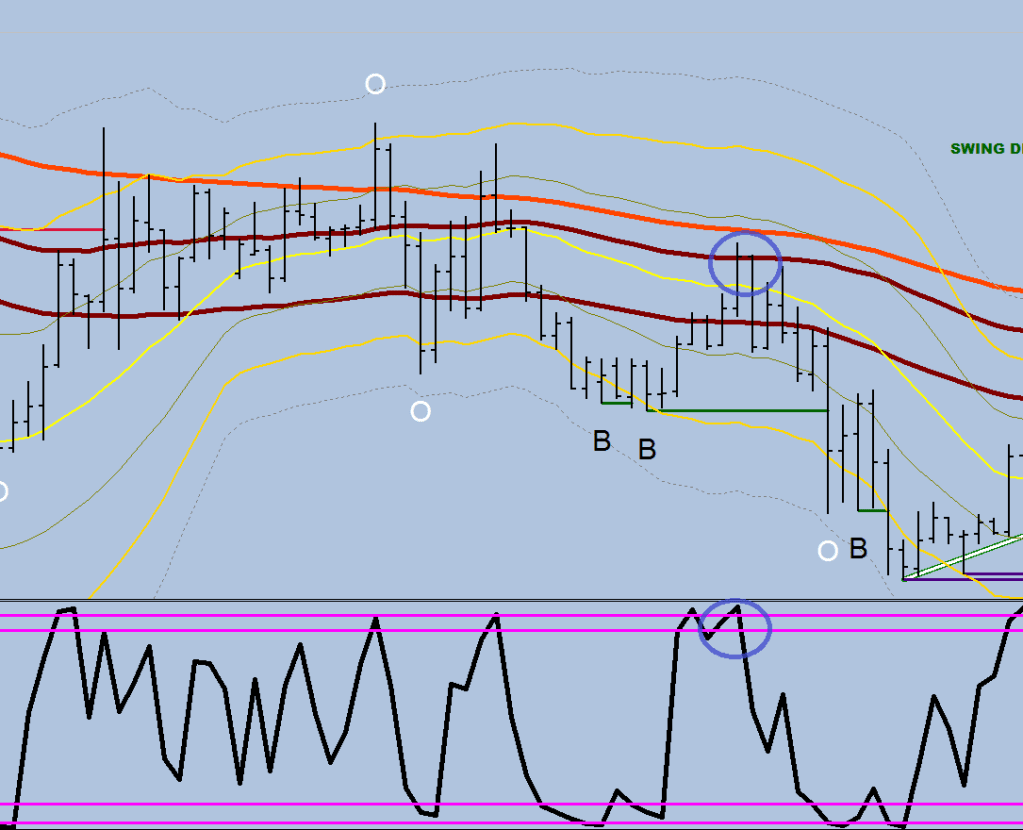
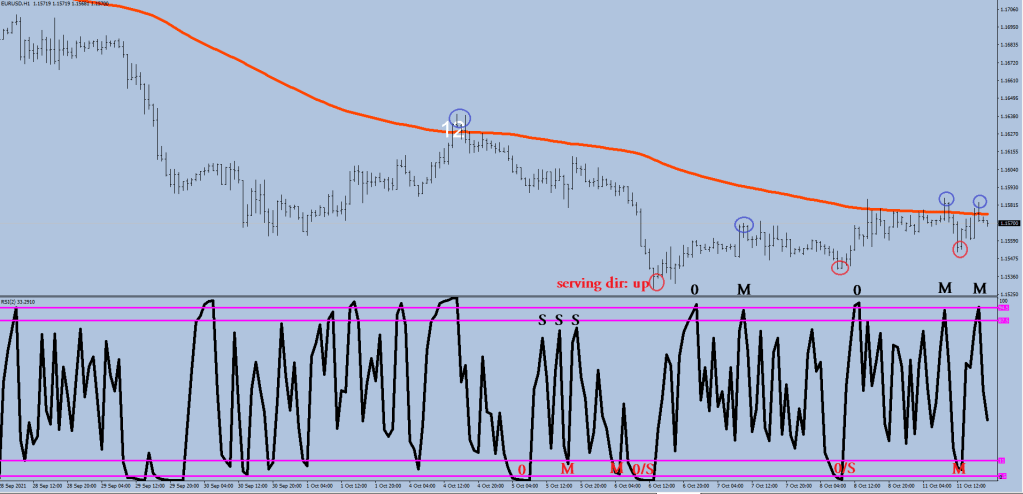
The first miss of the day was not knowing how important a break is at the M print that was not preceded by a zero.
What I already had right was graying out the zero to the downside if it settles above the E-67 band.
///////////zero on the bottom
if (RSI2[i+1]<2.5 && RSI2[i]>3 && RSI2[i+8]>3 && RSI2[ArrayMinimum(RSI2,6,i)]<=RSI2[ArrayMinimum(RSI2,5,i+7)] )
if (iHigh(symbol,0,iHighest(symbol,0,MODE_HIGH,12,i))-iLow(symbol,0,iLowest(symbol,0,MODE_LOW,2,i))>320*Point && Low[i+4]>iMA(NULL,0,67,0,MODE_EMA, PRICE_HIGH,i+4)
&& Low[i+3]>iMA(NULL,0,67,0,MODE_EMA, PRICE_HIGH,i+3) && Low[i+4]>iMA(NULL,0,67,0,MODE_EMA, PRICE_HIGH,i+4) && Low[i+5]>iMA(NULL,0,67,0,MODE_EMA, PRICE_HIGH,i+5)
&& Low[i+6]>iMA(NULL,0,67,0,MODE_EMA, PRICE_HIGH,i+6)
&& Low[i+7]>iMA(NULL,0,67,0,MODE_EMA, PRICE_HIGH,i+7) && Low[i+8]>iMA(NULL,0,67,0,MODE_EMA, PRICE_HIGH,i+8) && Low[i+9]>iMA(NULL,0,67,0,MODE_EMA, PRICE_HIGH,i+9) && Low[i+10]>iMA(NULL,0,67,0,MODE_EMA, PRICE_HIGH,i+10)
&& Low[i+10]>iMA(NULL,0,67,0,MODE_EMA, PRICE_HIGH,i+11) && Low[i+11]>iMA(NULL,0,67,0,MODE_EMA, PRICE_HIGH,i+11) && Low[i+12]>iMA(NULL,0,67,0,MODE_EMA, PRICE_HIGH,i+12) && Low[i+13]>iMA(NULL,0,67,0,MODE_EMA, PRICE_HIGH,i+13)
&& Low[i+14]>iMA(NULL,0,67,0,MODE_EMA, PRICE_HIGH,i+14) && Low[i+15]>iMA(NULL,0,67,0,MODE_EMA, PRICE_HIGH,i+15) && Low[i+16]>iMA(NULL,0,67,0,MODE_EMA, PRICE_HIGH,i+16) && Low[i+17]>iMA(NULL,0,67,0,MODE_EMA, PRICE_HIGH,i+17)
&& Low[i+18]>iMA(NULL,0,67,0,MODE_EMA, PRICE_HIGH,i+18) && Low[i+19]>iMA(NULL,0,67,0,MODE_EMA, PRICE_HIGH,i+19) && Low[i+20]>iMA(NULL,0,67,0,MODE_EMA, PRICE_HIGH,i+20))
ObjectSetText("Panaceadc"+DoubleToStr(i), "W1/A", 42, "Arial Black", clrRed);
}
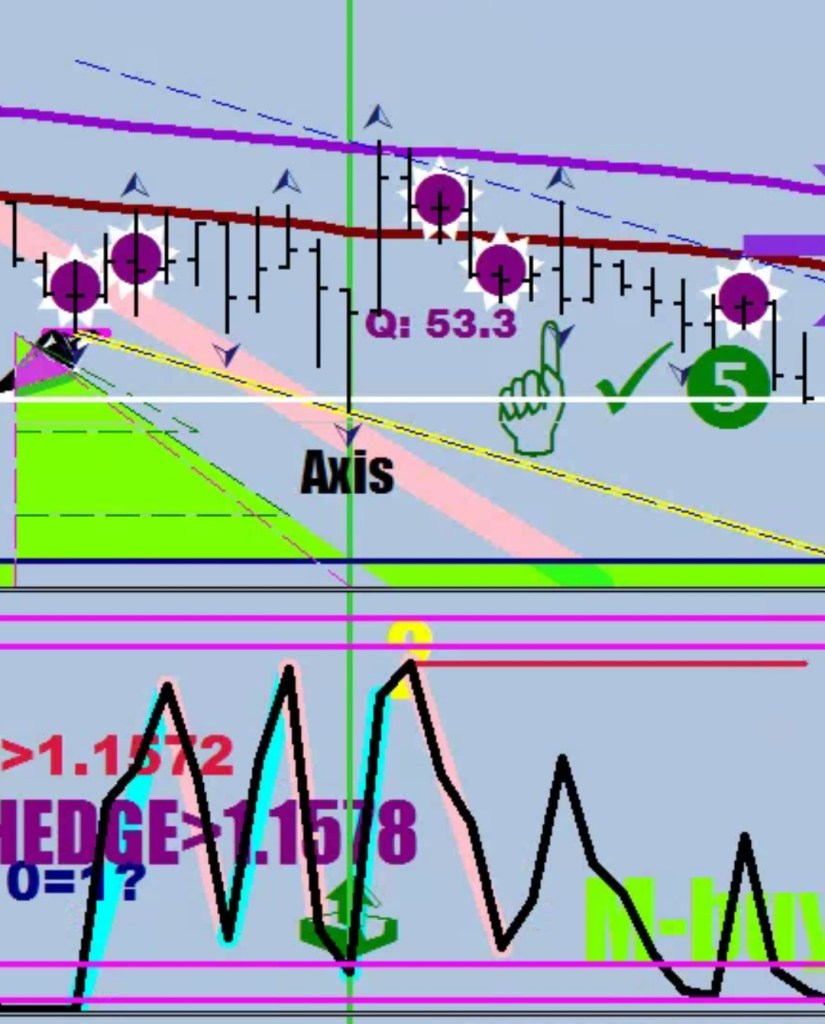
else ObjectSetText("Panaceadc"+DoubleToStr(i), "0=1?", 22, "Arial Black", clrDimGray);The Orange M had a level of importance that from now on it needs to be underlined.
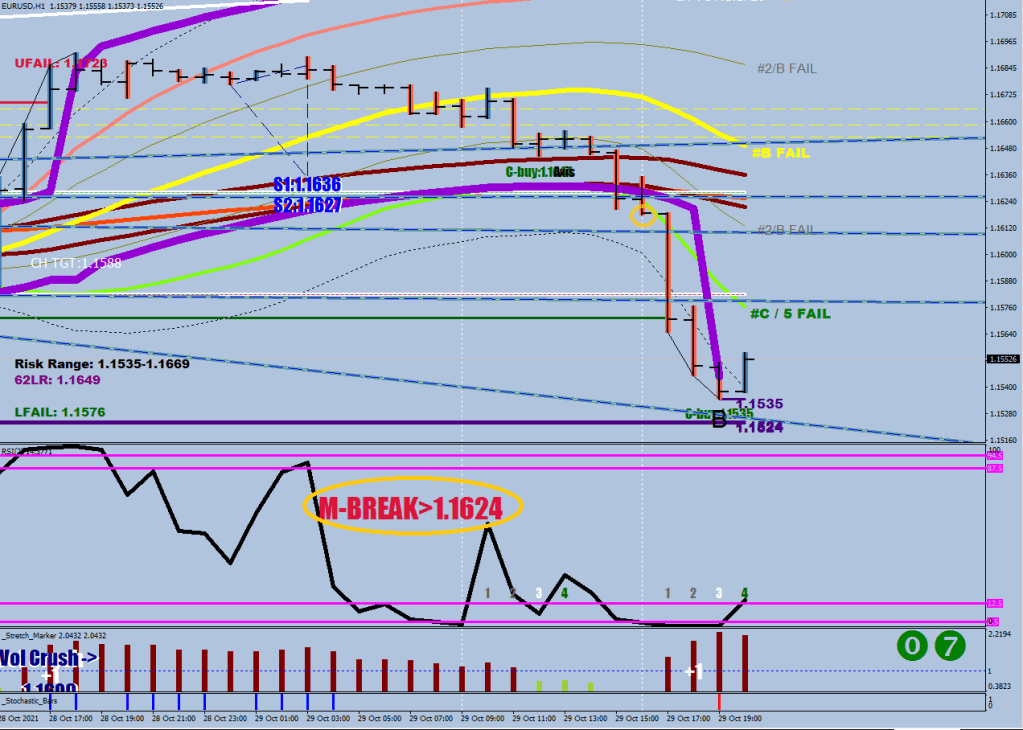
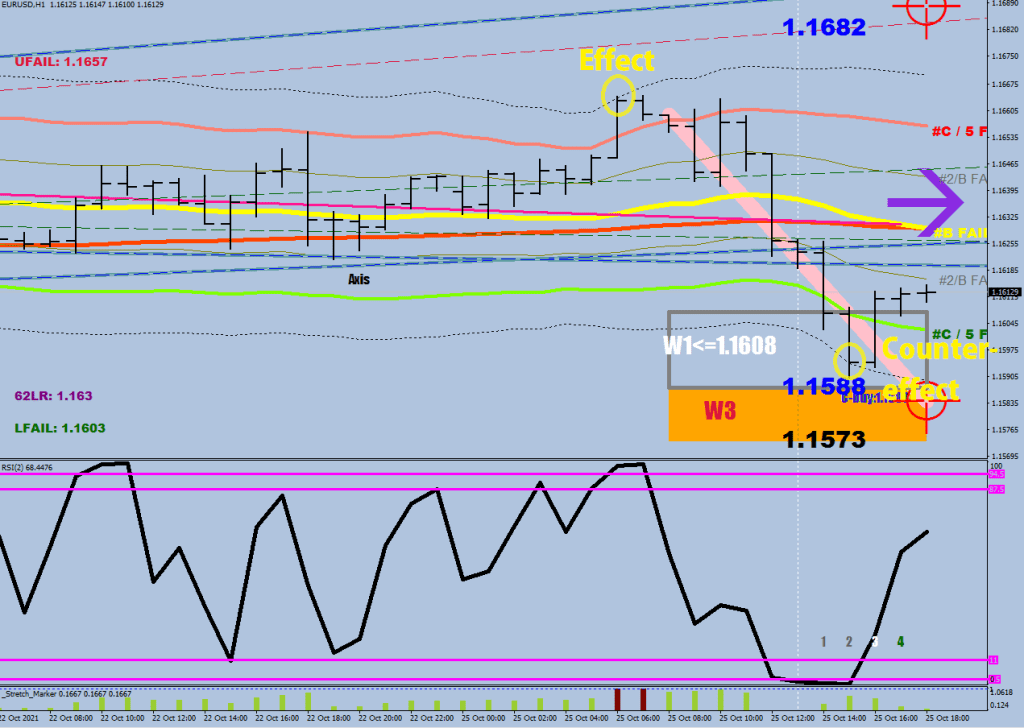
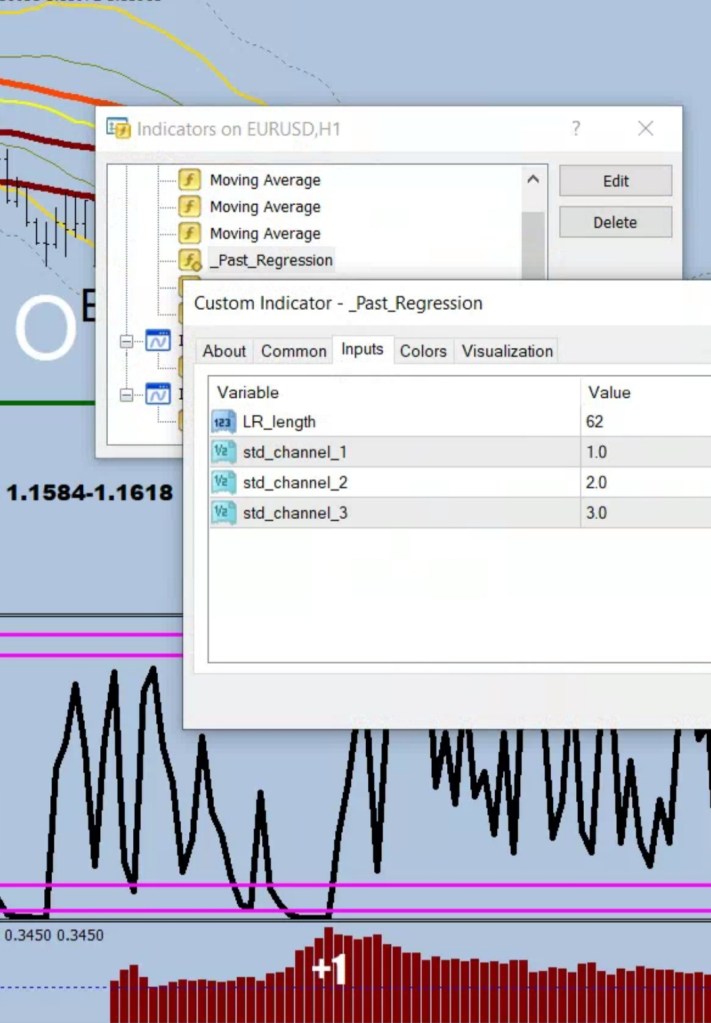
I circled the hourly close below that 20-pip displacement, which also happens to be a close below the 2-sd 62-sample Linear Regression line.
The filter obviously is the sheer lack of a valid lower zero print in the last 46 samples and the RSI2 a little more precise.
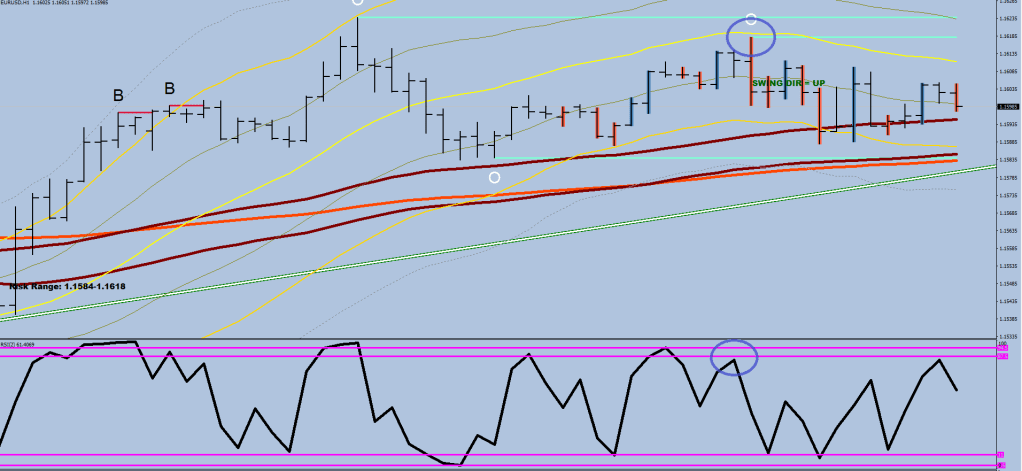
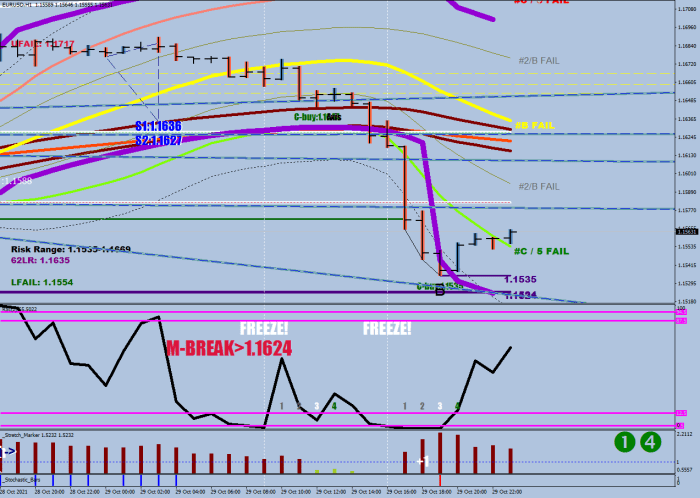
if (RSI2[i+1]<10 && !zerodn[i+1] && !zerodn[i+2] && !zerodn[i+3] && !zerodn[i+4] && !zerodn[i+5] && !zerodn[i+6] && !zerodn[i+7] && !zerodn[i+8] && !zerodn[i+9] && !zerodn[i+10] && !zerodn[i+11] && !zerodn[i+12] && !zerodn[i+13] && !zerodn[i+14] && !zerodn[i+15] && !zerodn[i+16] && !zerodn[i+17] && !zerodn[i+18] && !zerodn[i+19] && !zerodn[i+20] && !zerodn[i+21] && !zerodn[i+22] && !zerodn[i+23] && !zerodn[i+24] && !zerodn[i+25] && !zerodn[i+26] && !zerodn[i+27] && !zerodn[i+28] && !zerodn[i+29] && !zerodn[i+30] && !zerodn[i+31] && !zerodn[i+32] && !zerodn[i+33] && !zerodn[i+34] && !zerodn[i+35] && !zerodn[i+36] && !zerodn[i+37] && !zerodn[i+38] && !zerodn[i+39] && !zerodn[i+40] && !zerodn[i+41] && !zerodn[i+42] && !zerodn[i+43] && !zerodn[i+44] && !zerodn[i+45] && !zerodn[i+46])The second thing I had to correct was another filter, this time for the Four-counter, which was much too restrictive initially to pick up the second fresh zero-sequence-starter first hour, due to looking for a too high RSI2 reading in the last 10 samples.
if (RSI2[i+1]>2.5 && RSI2[i]<2.5 && RSI2[ArrayMaximum(RSI2,10,i)]>56.5)
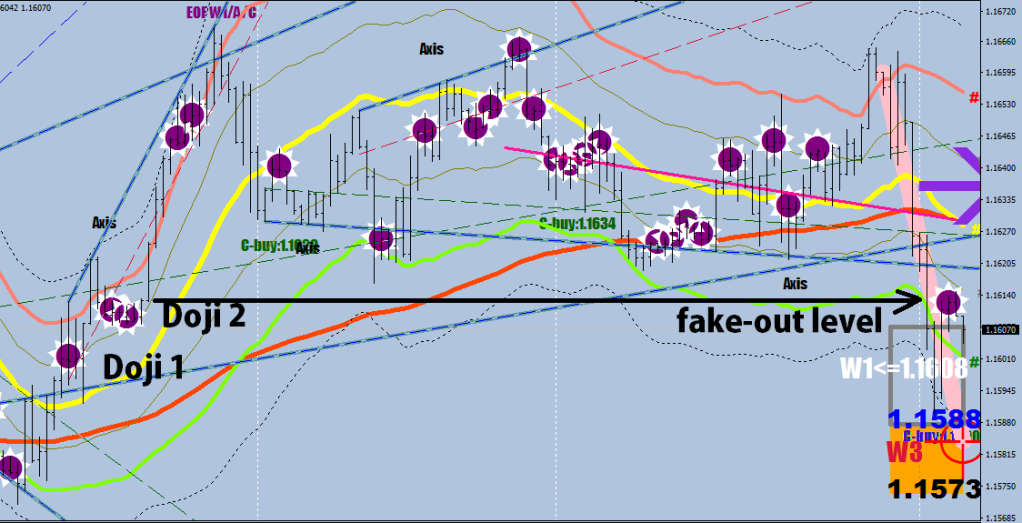
cdncounter[i]=0;That 4-count is there to remind me of the due inactivity: you need to let the market auction to play out in the following 3 hours, and only name your sell cover after the time was up (C-buy print on the chart.)
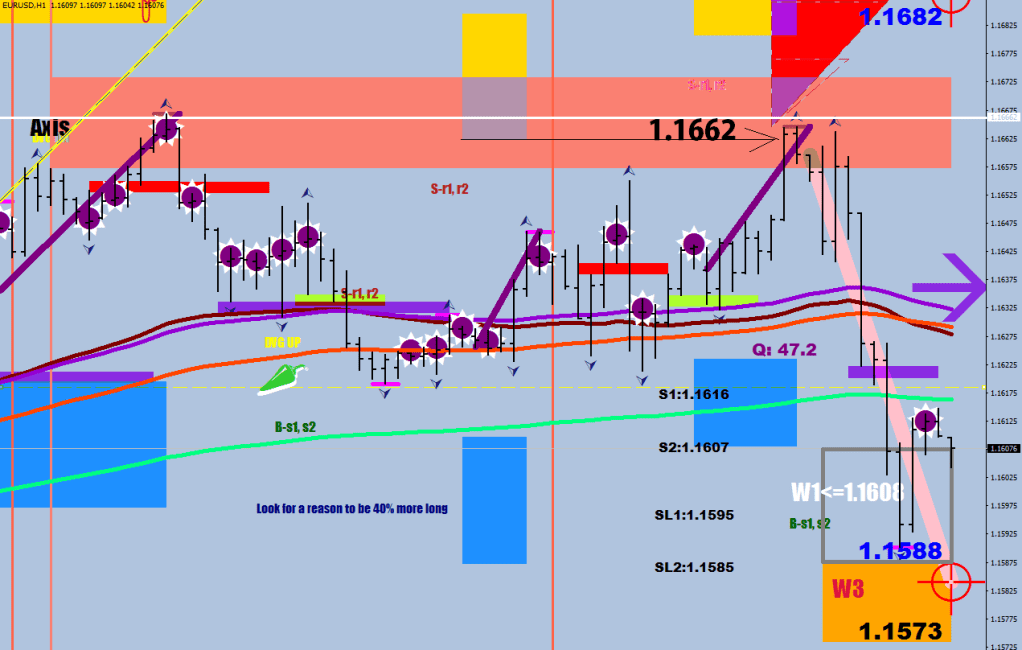
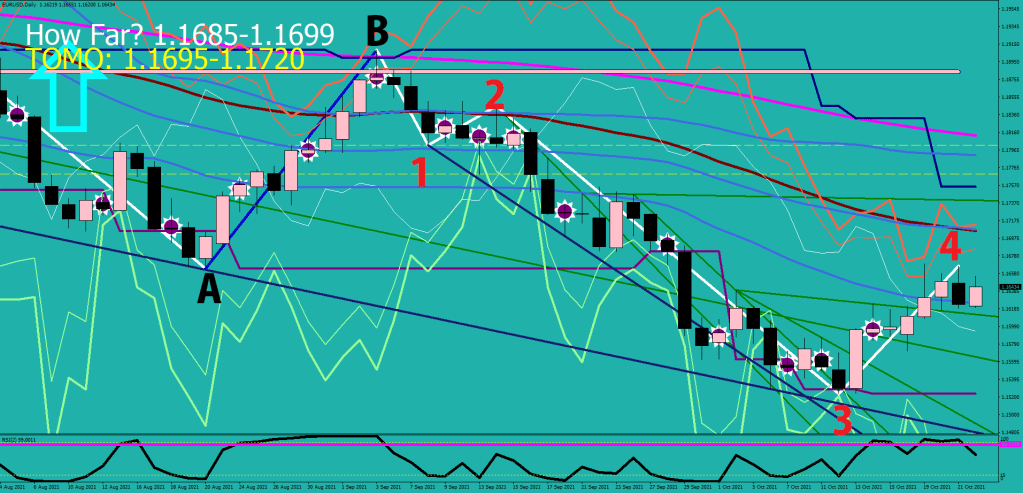
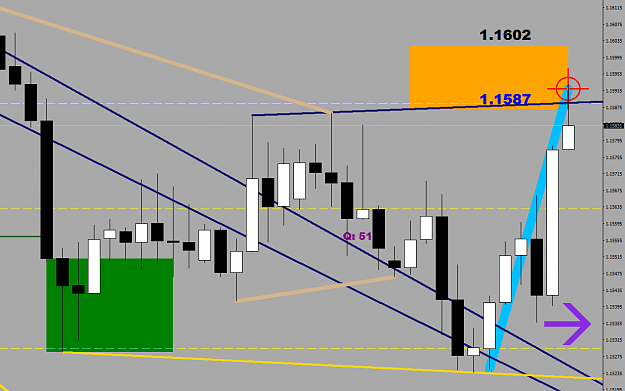
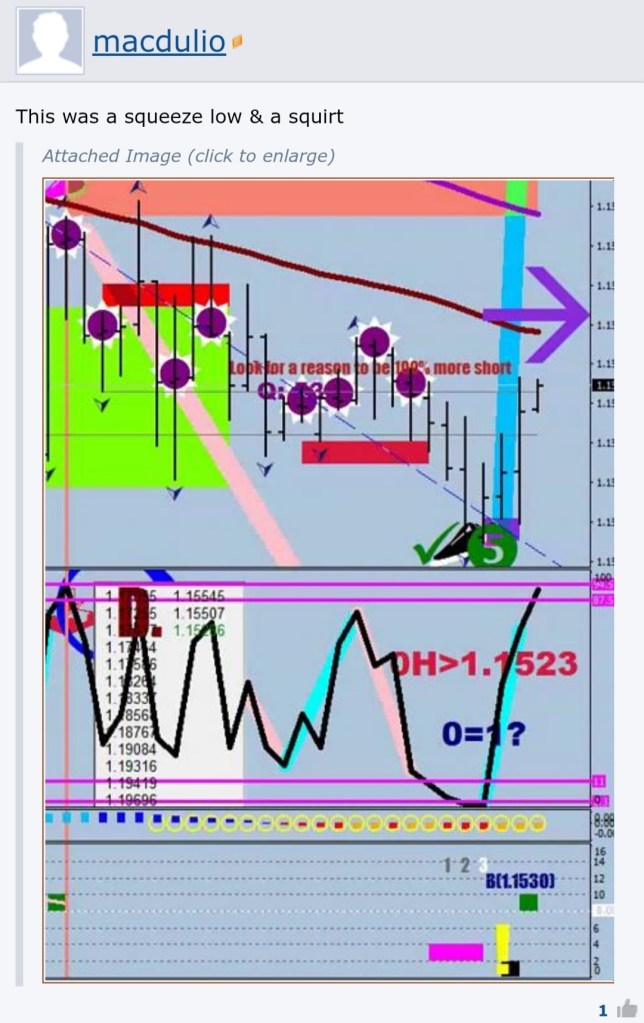
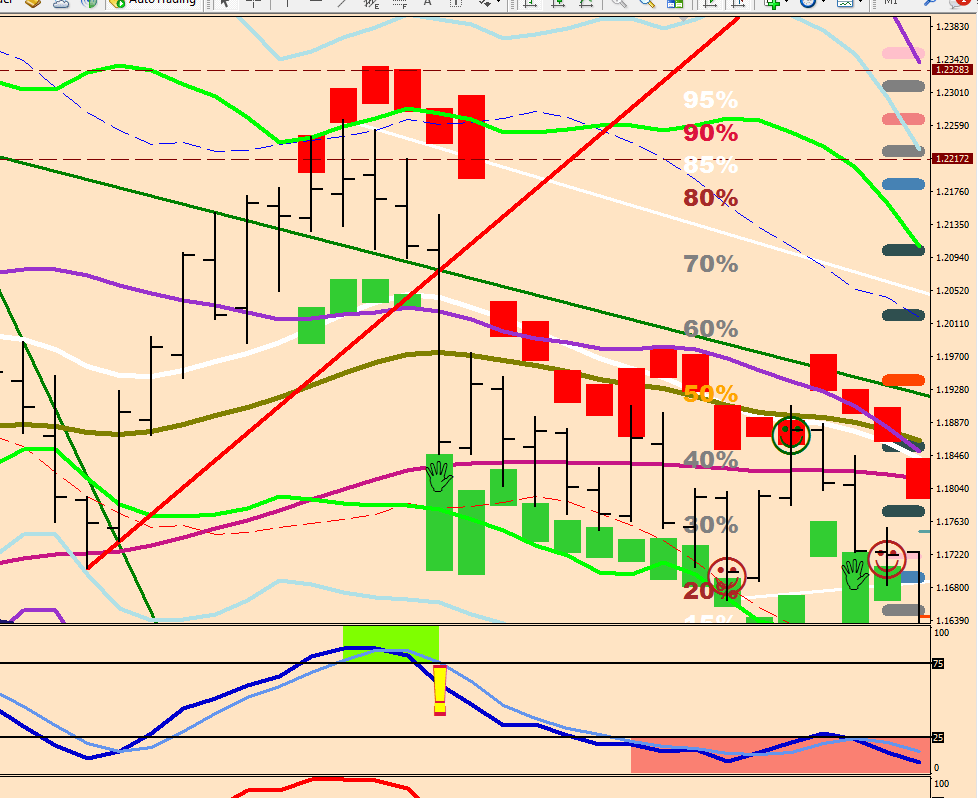
Now, let’s concentrate on the ellipses below for a guidance on what may happen next here.
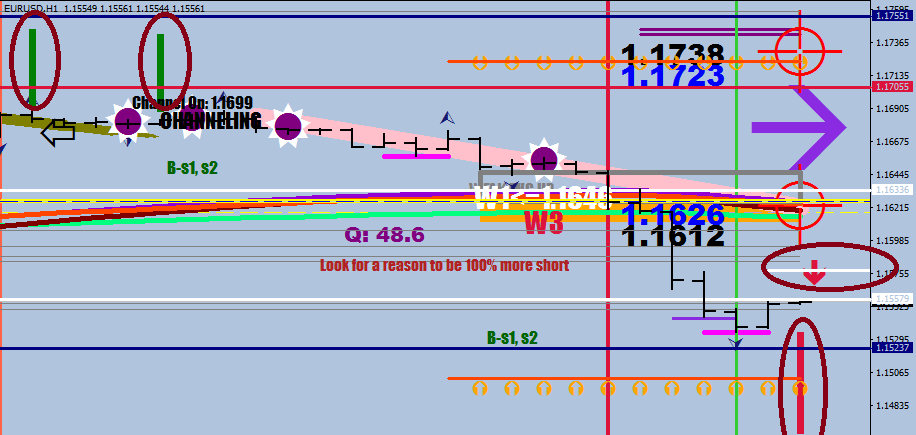
Volatility is rampant currently, one break out occurring after the other – that’s flag #1
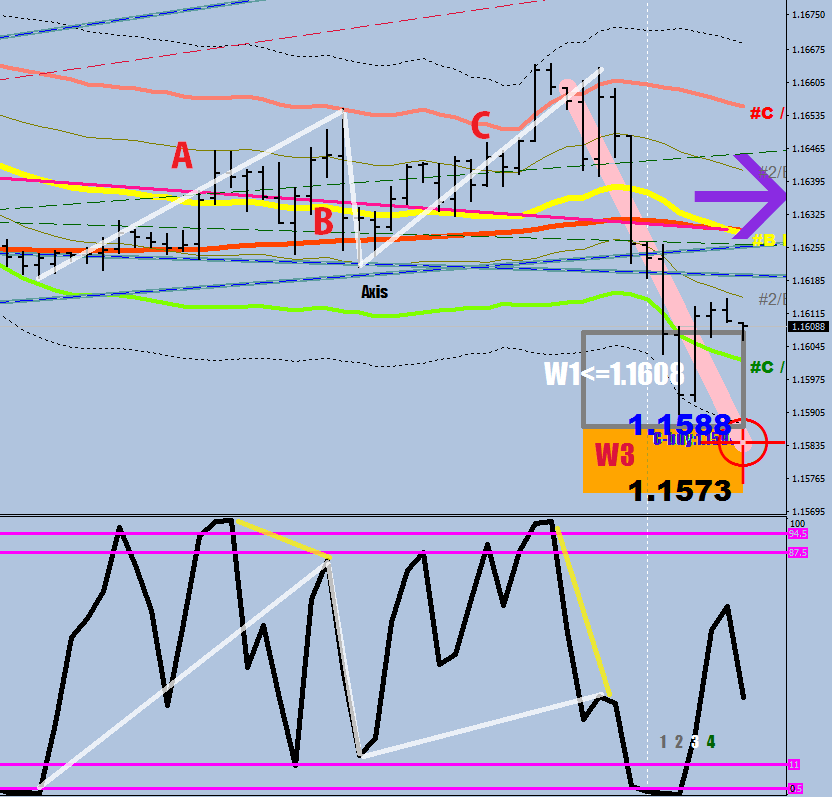
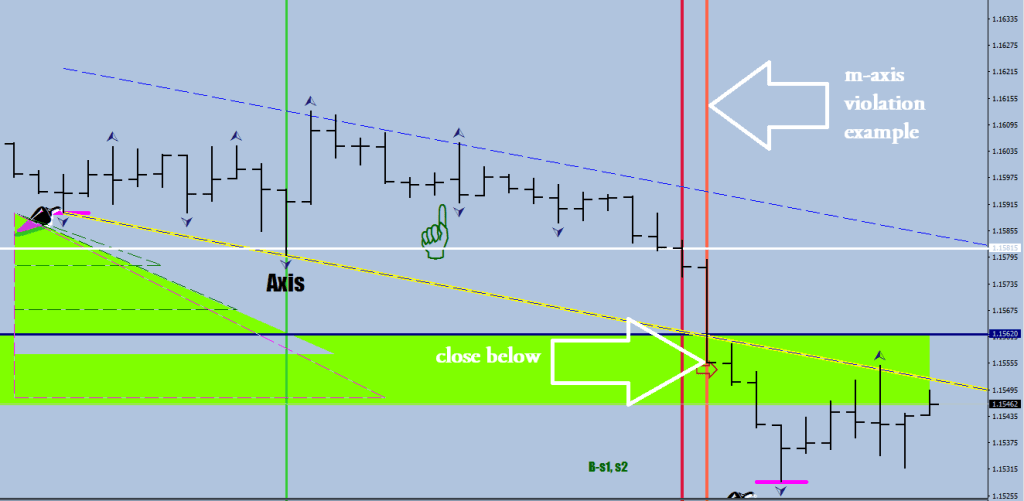
The vertical ellipses are there to call attention to a 4-hour move that comes with 50% increment from an already good sized 4-hour candle.
if (Period()==60 && iHigh(NULL,240,i+3)-iLow(NULL,240,i+1)>FSize*27*Point && iLow(NULL,240,i+1)<iLow(NULL,240,i+3) && iLow(NULL,240,i+1)-(iHigh(NULL,240,i+3)-iLow(NULL,240,i+1))*.5<iMA(NULL,0,52,0,MODE_EMA, PRICE_LOW,i)-FMax*5.5*Point && !(iClose(symbol,240,i+1)>iMA(NULL,240,52,0,MODE_EMA, PRICE_MEDIAN,i+1) && iLow(symbol,240,i+1)<iMA(NULL,240,52,0,MODE_EMA, PRICE_MEDIAN,i+1)) && iLow(NULL,240,iLowest(NULL,0,MODE_LOW,3,i))<iLow(NULL,240,iLowest(NULL,0,MODE_LOW,9,i+3))-250*Point){
           LowBuffer2[i*4]=iLow(NULL,240,i+1);
            HighBuffer2[i*4]=iLow(NULL,240,i+1)-(iHigh(NULL,240,i+3)-iLow(NULL,240,i+1))*.5;
The point is, the move is deemed significant and receives a projection line. The significant move of course can be at the end of a structure or at the start of it.
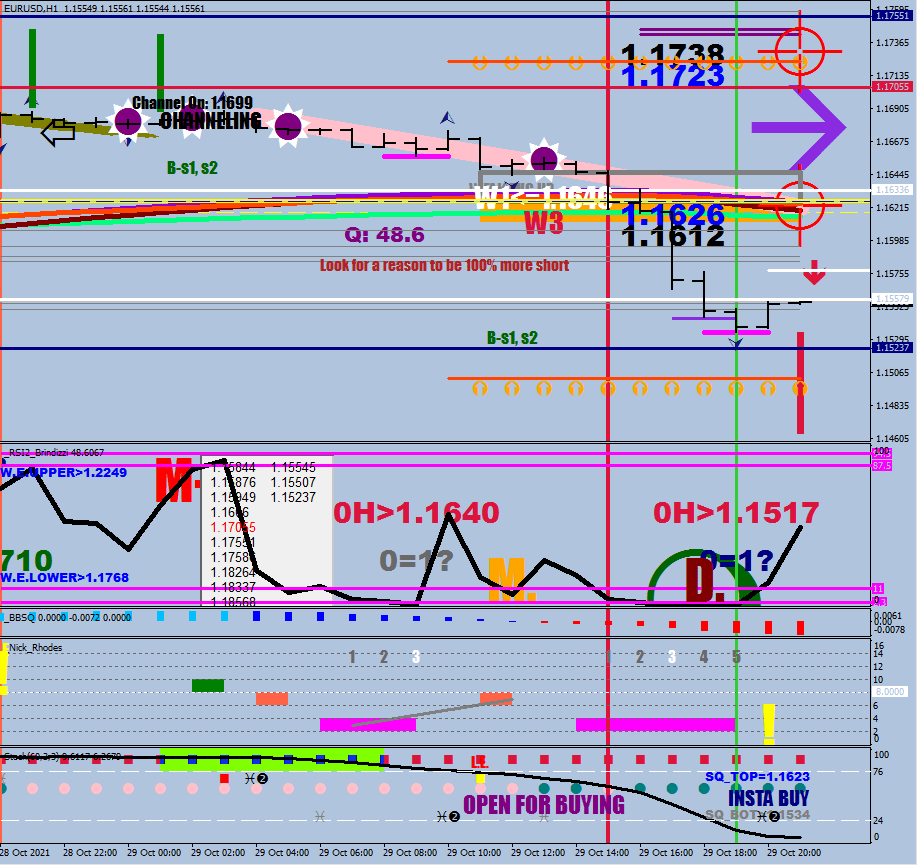
In our case, the upside channeling confirmation value was not hit at 1.1699, but the one on the bottom got called in at 1.1580 – the first evidence for further downside to come.
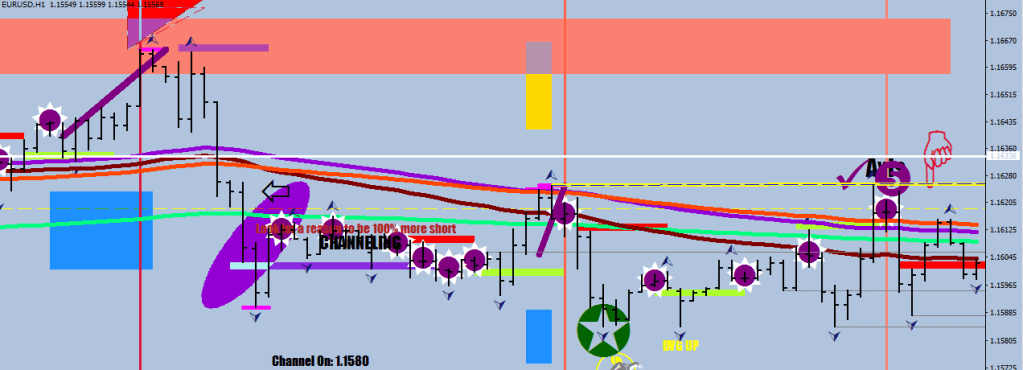
The second evidence is the horizontal ellipse, which is the hotstepper line borrowed from the Energy Bands (proprietary). Being below it is not a good omen.
The third evidence is the strength of the move & the projection down to 1.1462.
The fourth evidence is the impulsive looking wave structure, where the continuation divergence is about to kick in the next wave down.

It looks like wave 4 of Wave 3 is going to end by the close for this week. Wave 4 would only start after the taper of Wave 3 ends, and then there still would have to be a Wave 5.
The fifth element evidence is the sudden pause before the 1.1524 for a consolidation.
The only counter argument here would be a double bottom / higher low – but I do not see any rejection here for now.
Over & out.
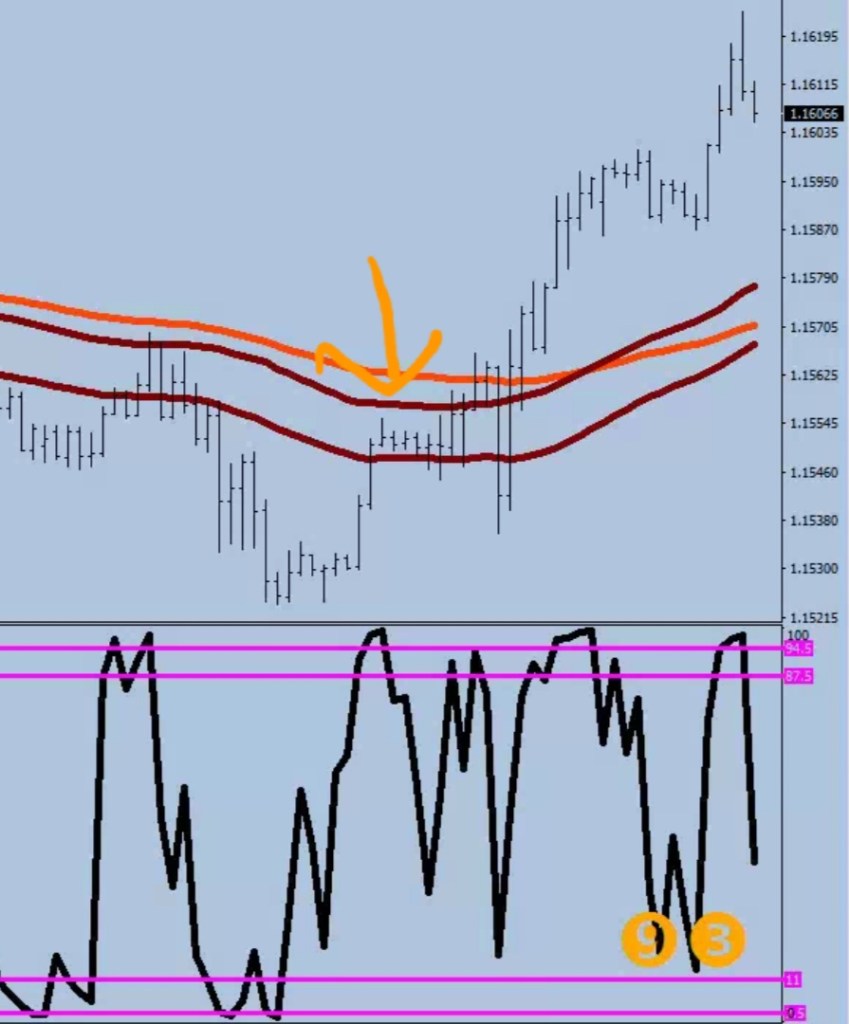
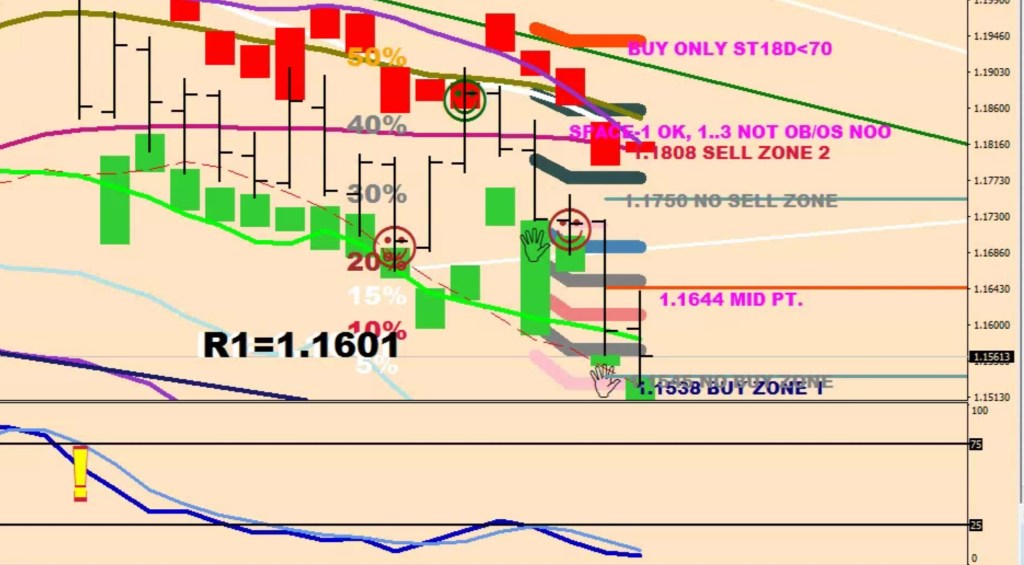
The sixth evidence is the strong rejection from the 20% level on the Comfort Levels: you are headed for a lower low, and the window envelope interrupted red would be down around 1.1450 next week.


Freeze – reminder
Ma Dalton (in Hungarian)

…