In the first part I gave you the #1 objective of a trader.
In this second one I’ll give you the second and the third most important rules of trading.
#2: yield to reversal divergences
#3: prepare for a sound barrier failure
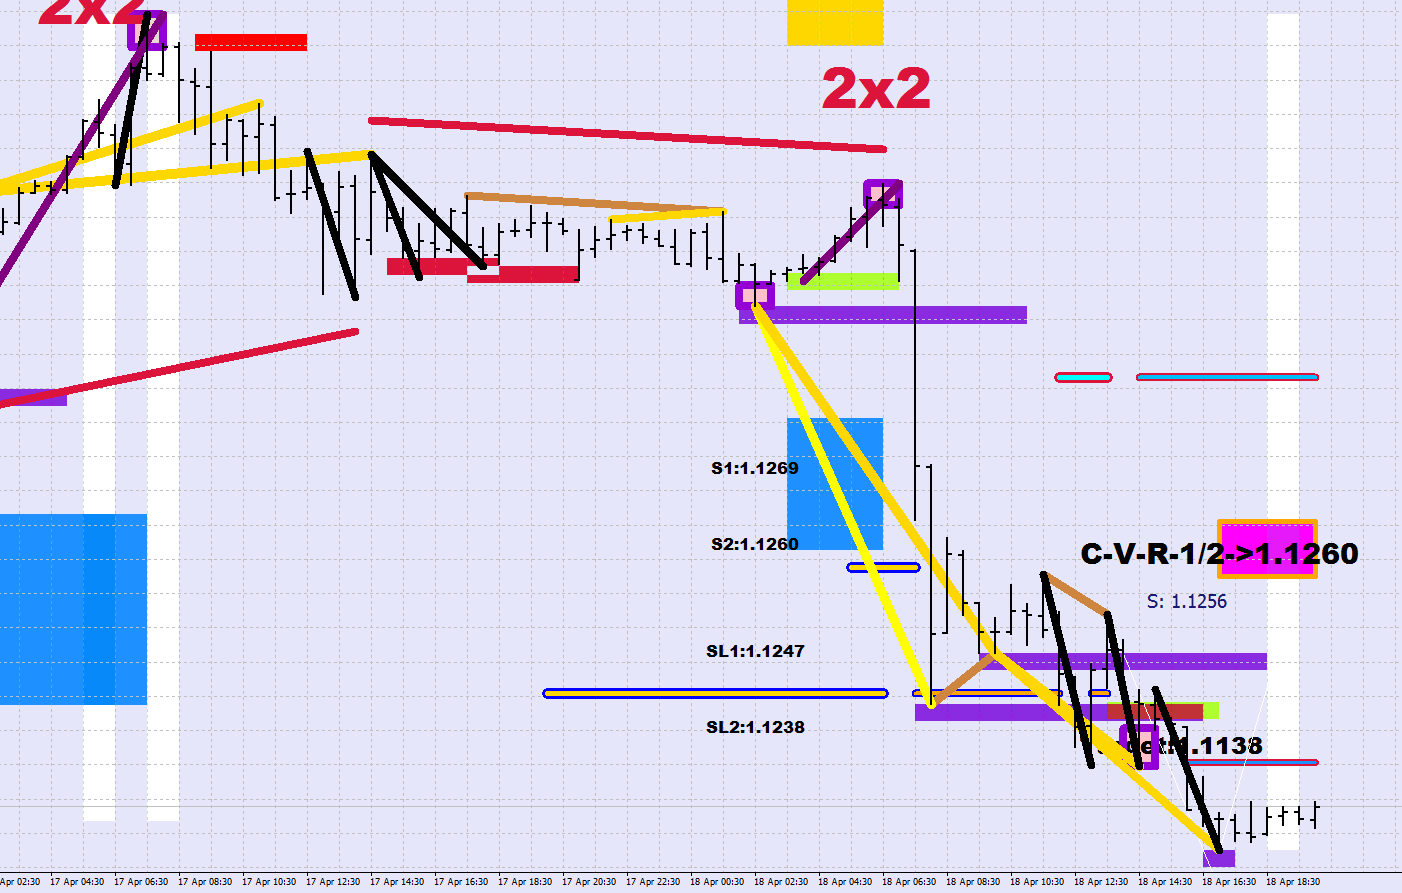
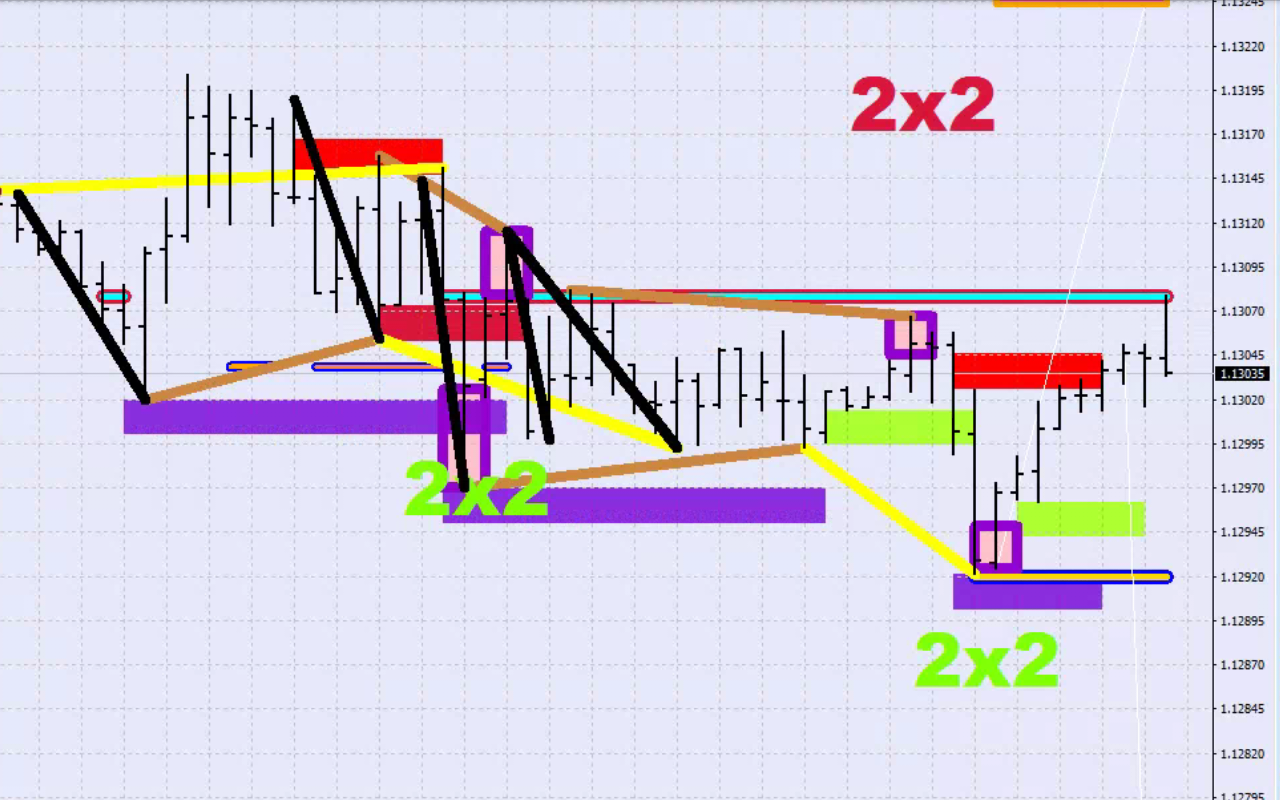
My all you can diverge buffet, God Awesome Indicator got an upgrade in the 1.7 version by including a search for the last 3 RSI2 divergences on the up and the downside. They are plotted in gold colour.
The yellow lines are stochastic reversal divergences.
The brown lines are stochastic continuation divergences and the red ones are as well but with a more serious sample bracket.
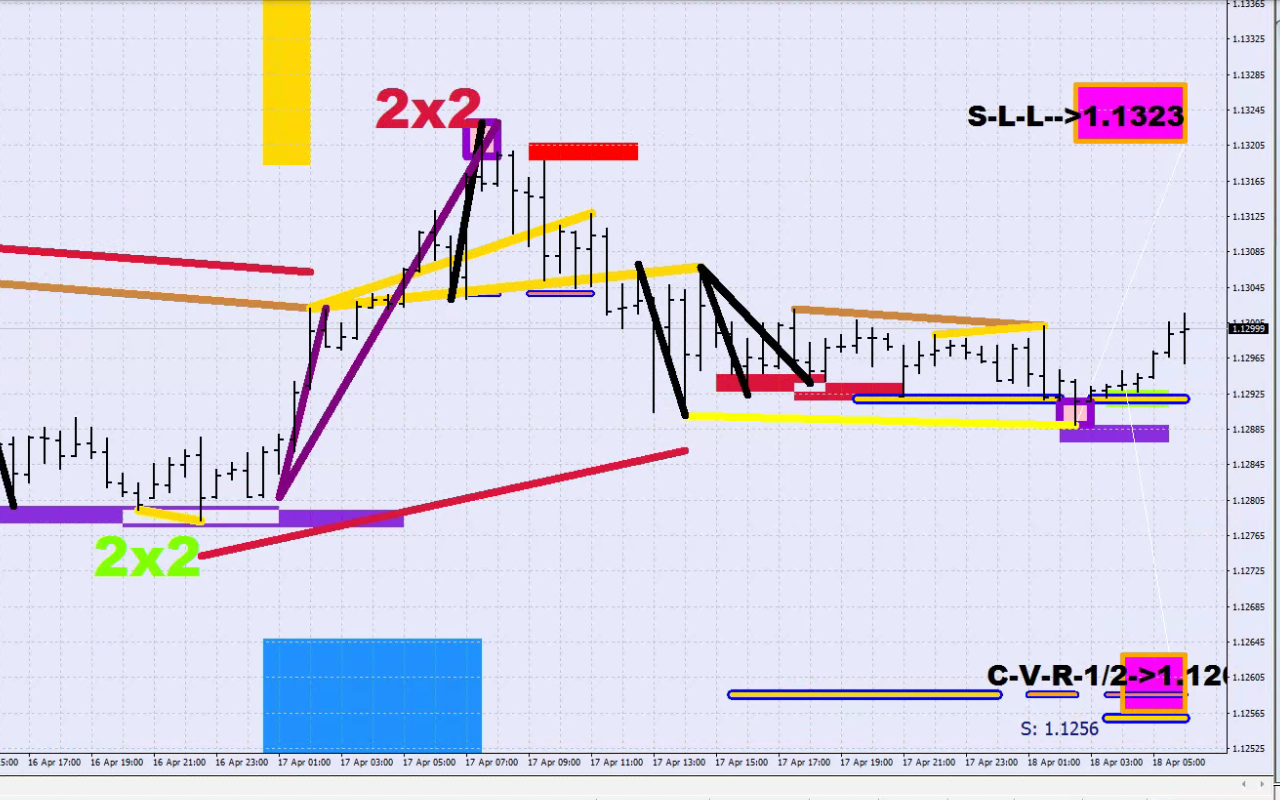
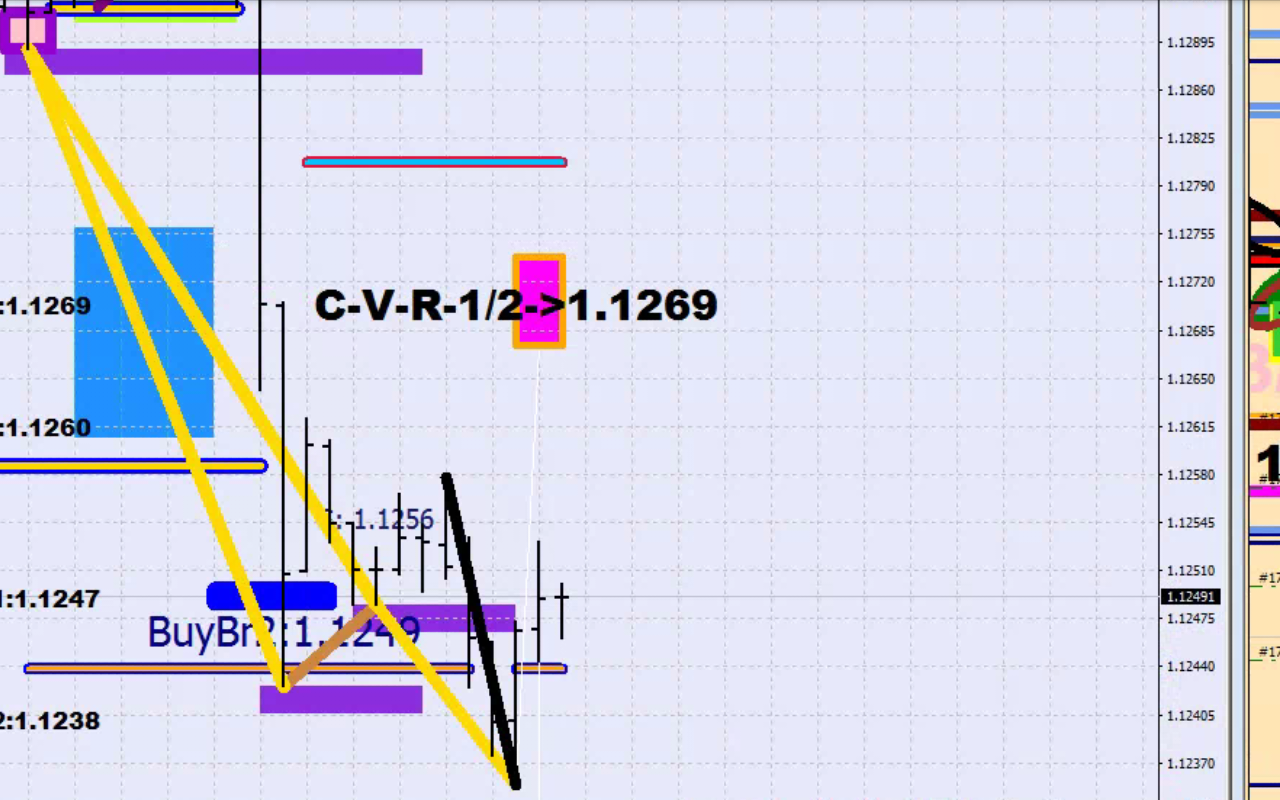
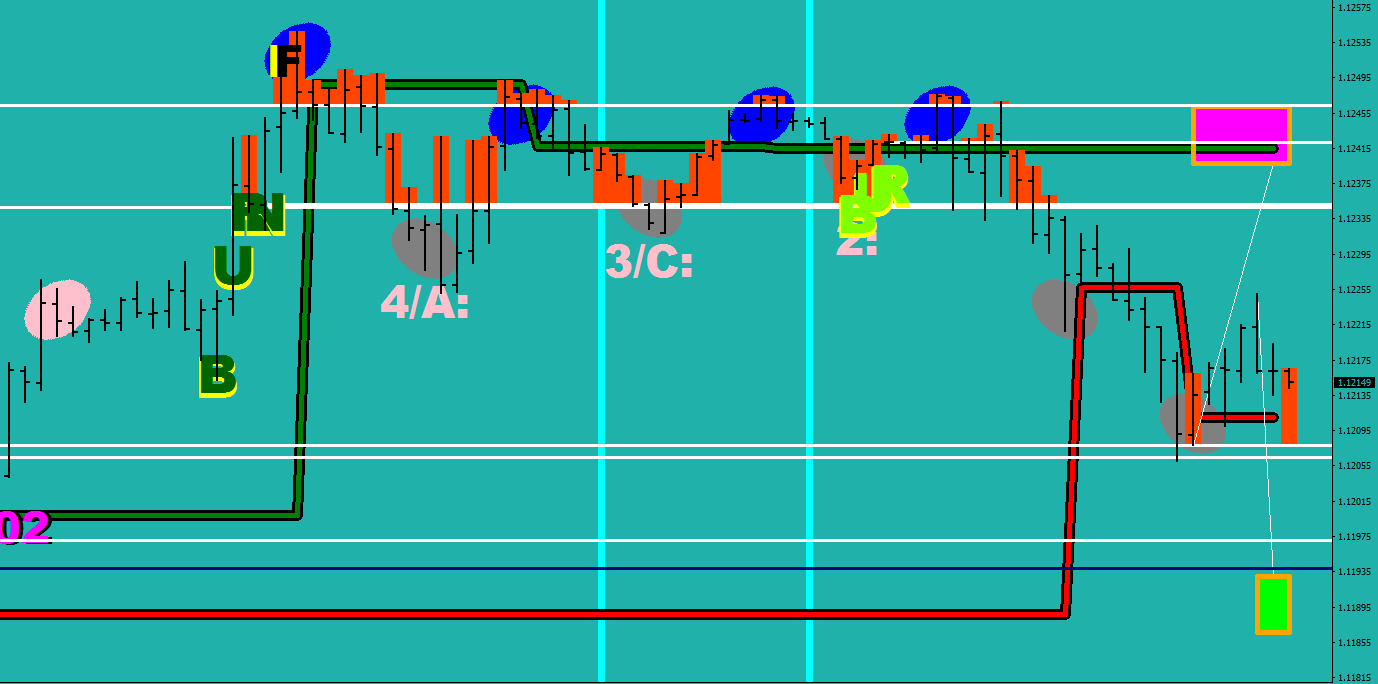
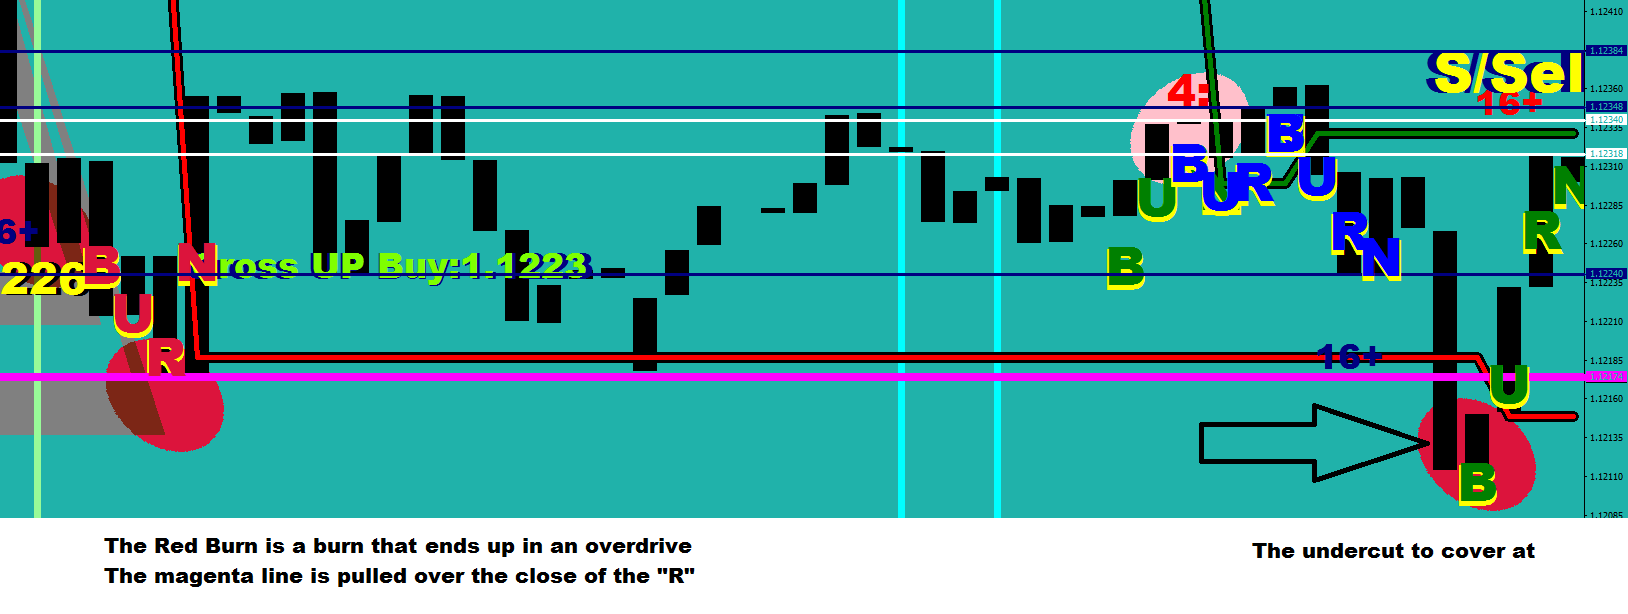
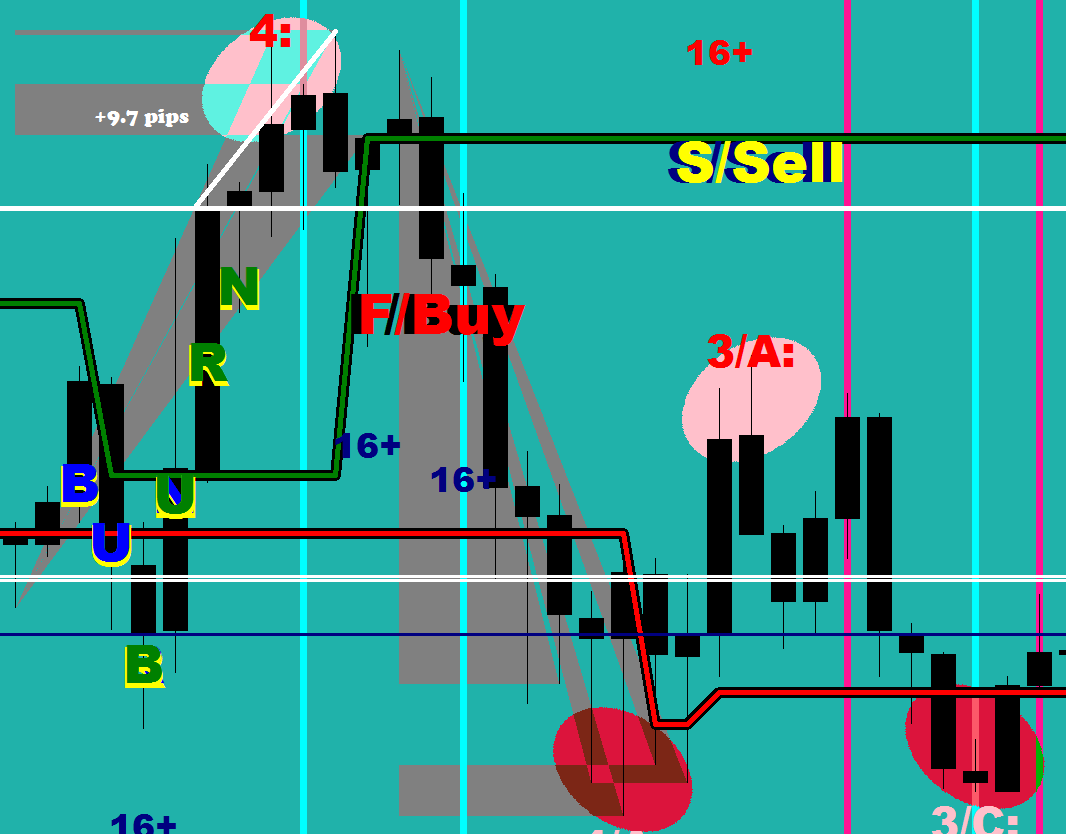
Why did I sell at the price level on the above image? Because price walked into the net of the last RSI2 divergence (after printing an RSI2 Sharpie at the bottom – purple square). See, price does not have to stop dead at the RSI2 divergence plot, it may exceed it by 1/2 fluctuation size which is 16 pips on the EUR/USD. Only upon exceeding that would I consider the divrgence failed. And if you look left there are additional untested RSI2 reversal divergences nearby. These 4 altogether (one is no longer plotted, the 4th – it has its end at the last upper sharpie) would make for a rather tall order to overcome.
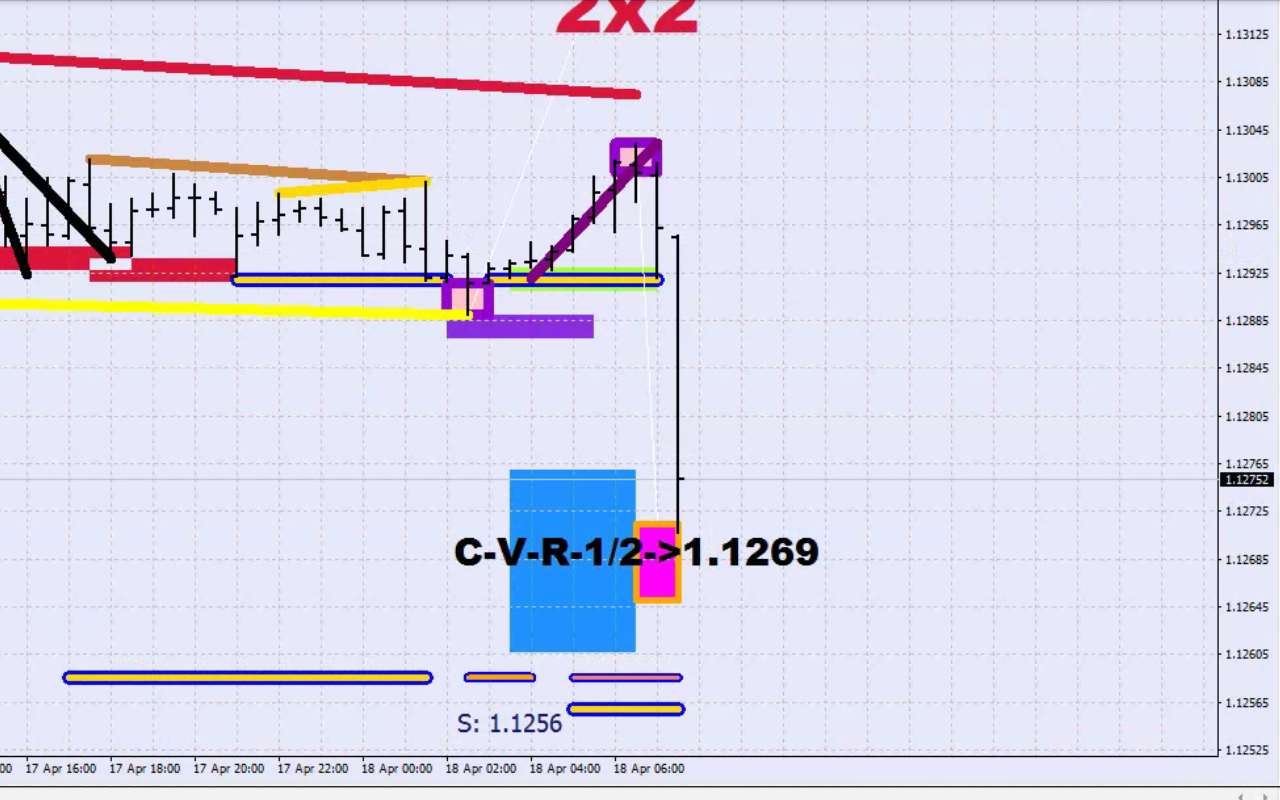
The sound barrier I referred to is the fluctuation size distance which is another plot of the same indicator – the white lines projecting the limitation of a move that does not mange to step outside of the fluctuation range (the box itself is from Fluctuation distance to Fluctuation maximum).
What is important here is gives you with high probability the extent of the move you could capitalize on and spells out a number as well. (I.e. CoVeR 1/2)
An RSI2 divergence can be considered as a root that is likely to yield the untrapped participant 3 pushes in their holding direction. Respecting this would be closing the holdings in the opposing direction and only reinstaging them upon breaking the divergence (by 20+ pips).
I have articles on the Blog about the Fluctuation size as well as about the features of the God Awesome Indicator.
Call me to say how much it would be worth to you to have a copy of it.
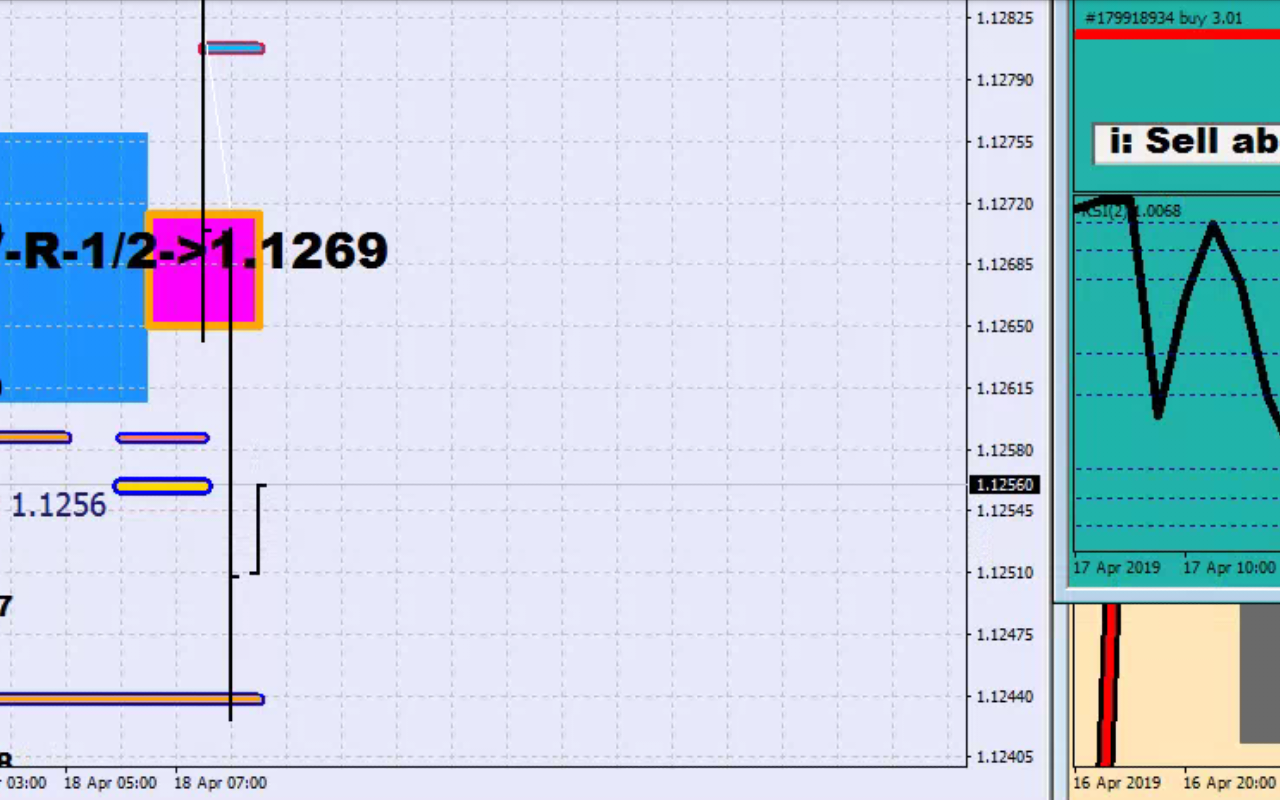
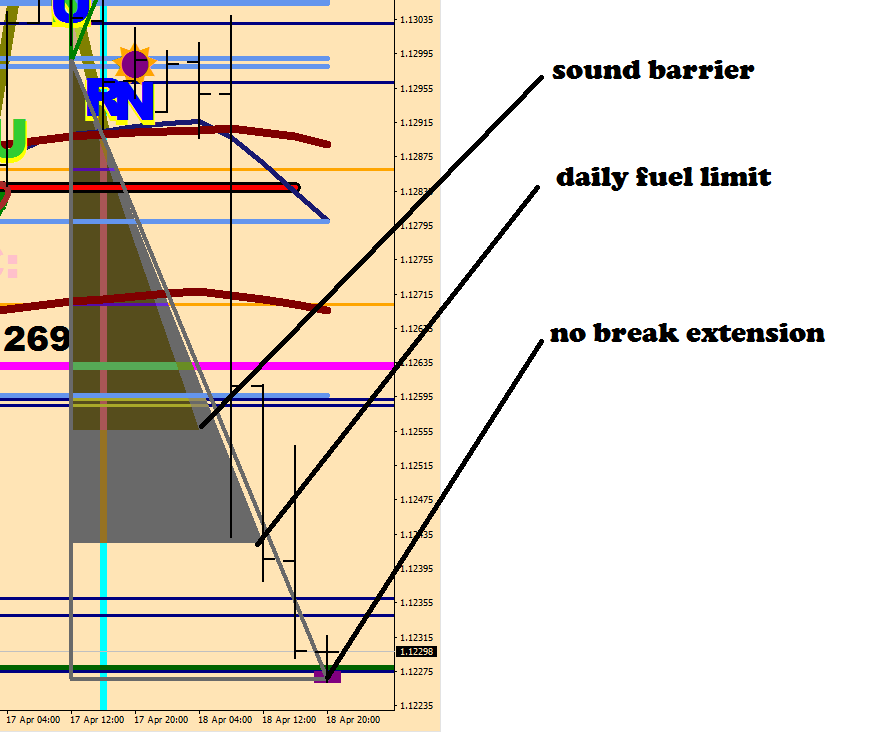
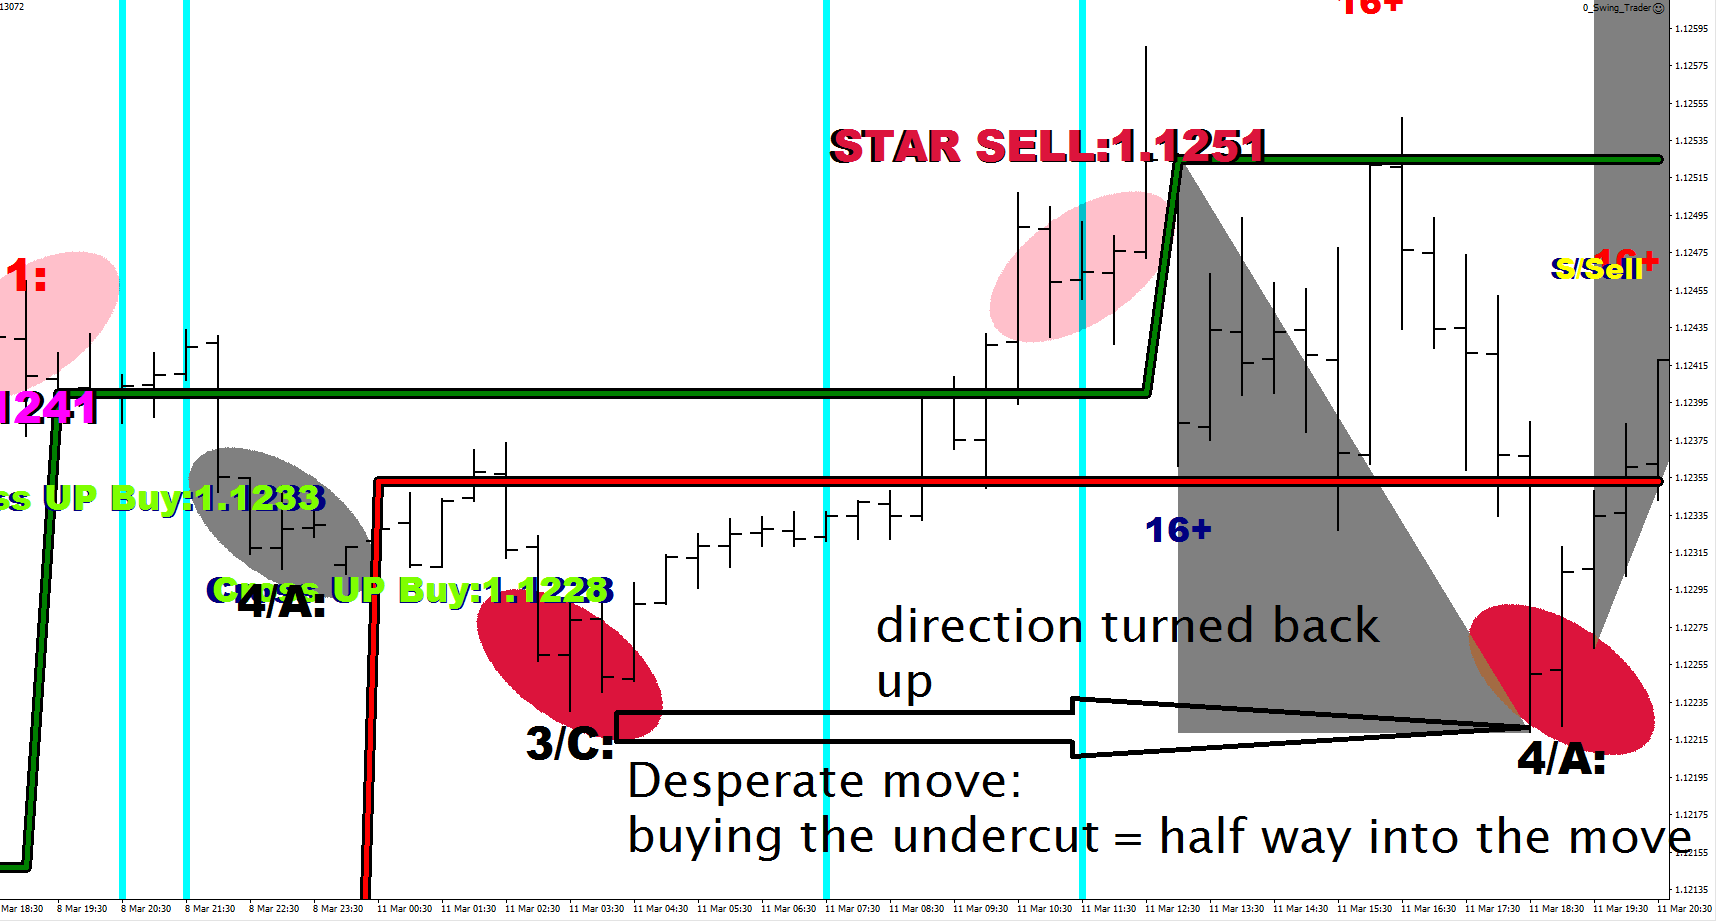
The bounce back up was contained in the box, and was a sell again. Daily fuel limit reached
An extension is a no break after a power move. 1/2 fluctuation size = 16 pips would be a no break. 43-16=27
The utmost condition is no more stars (overdrive) and RSI2 divergence = bet the farm now!
Let’s discuss one mistake I made today and the ways I invented in order to prevent committing the same mistake again.
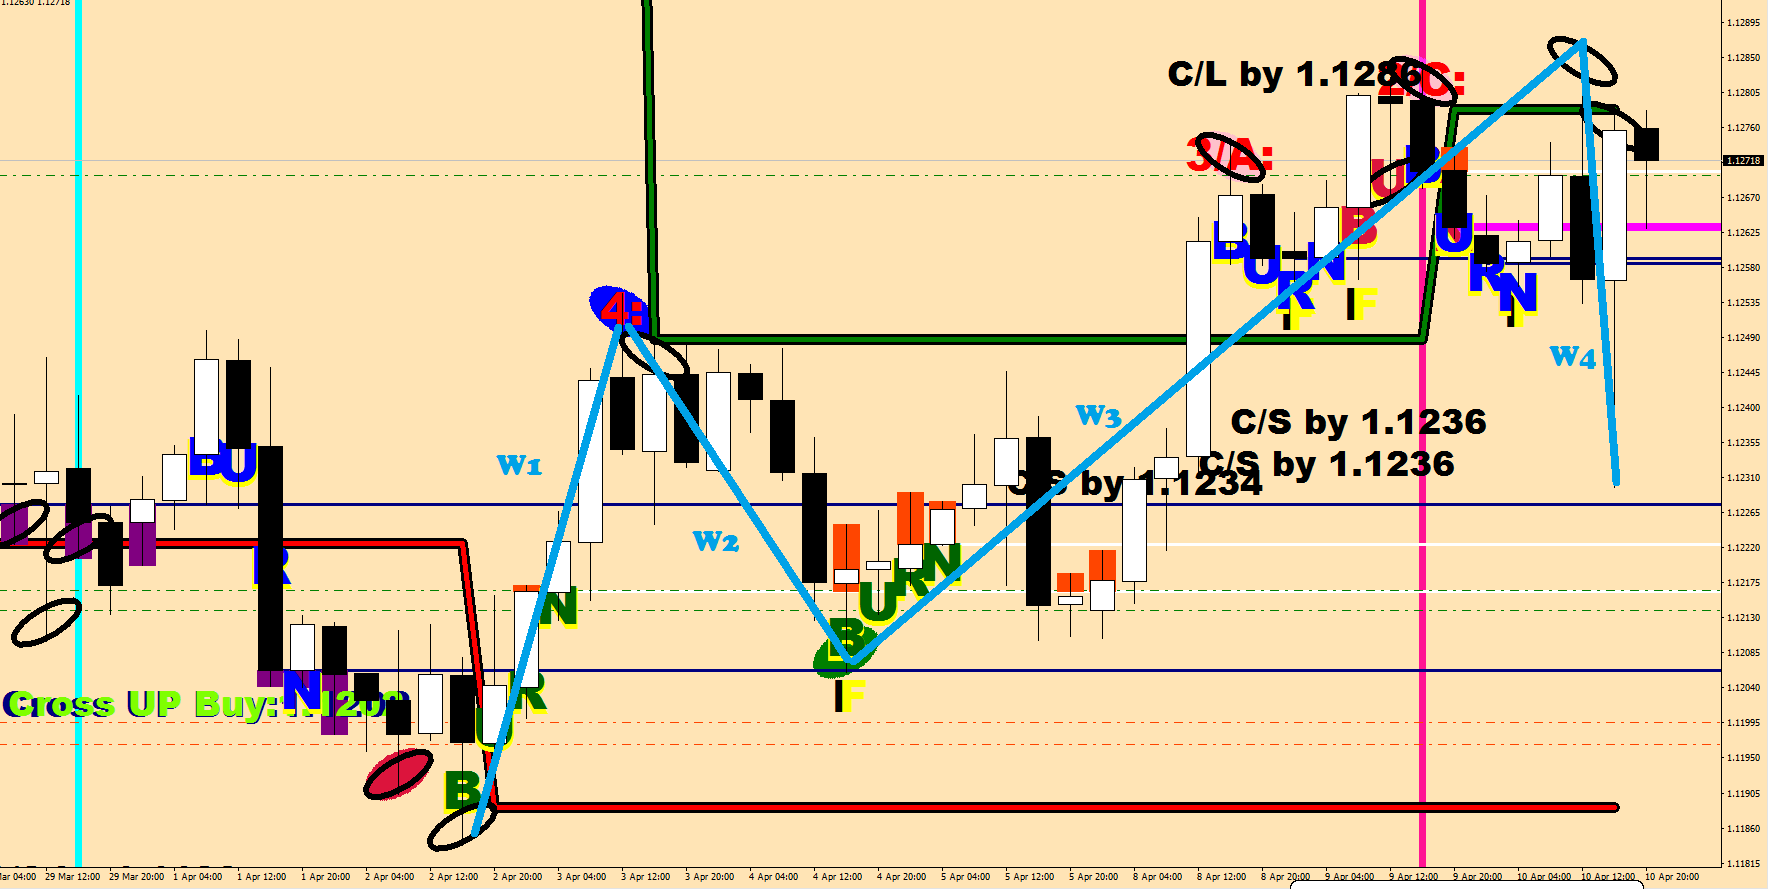
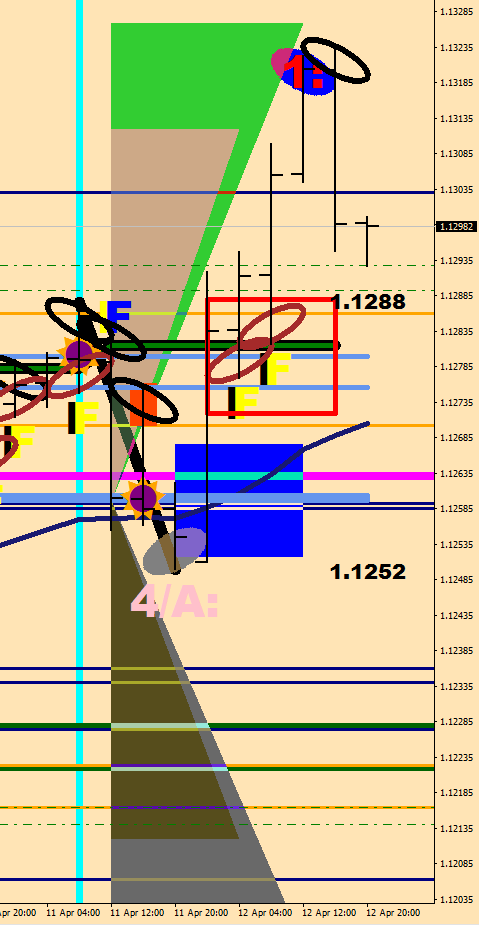
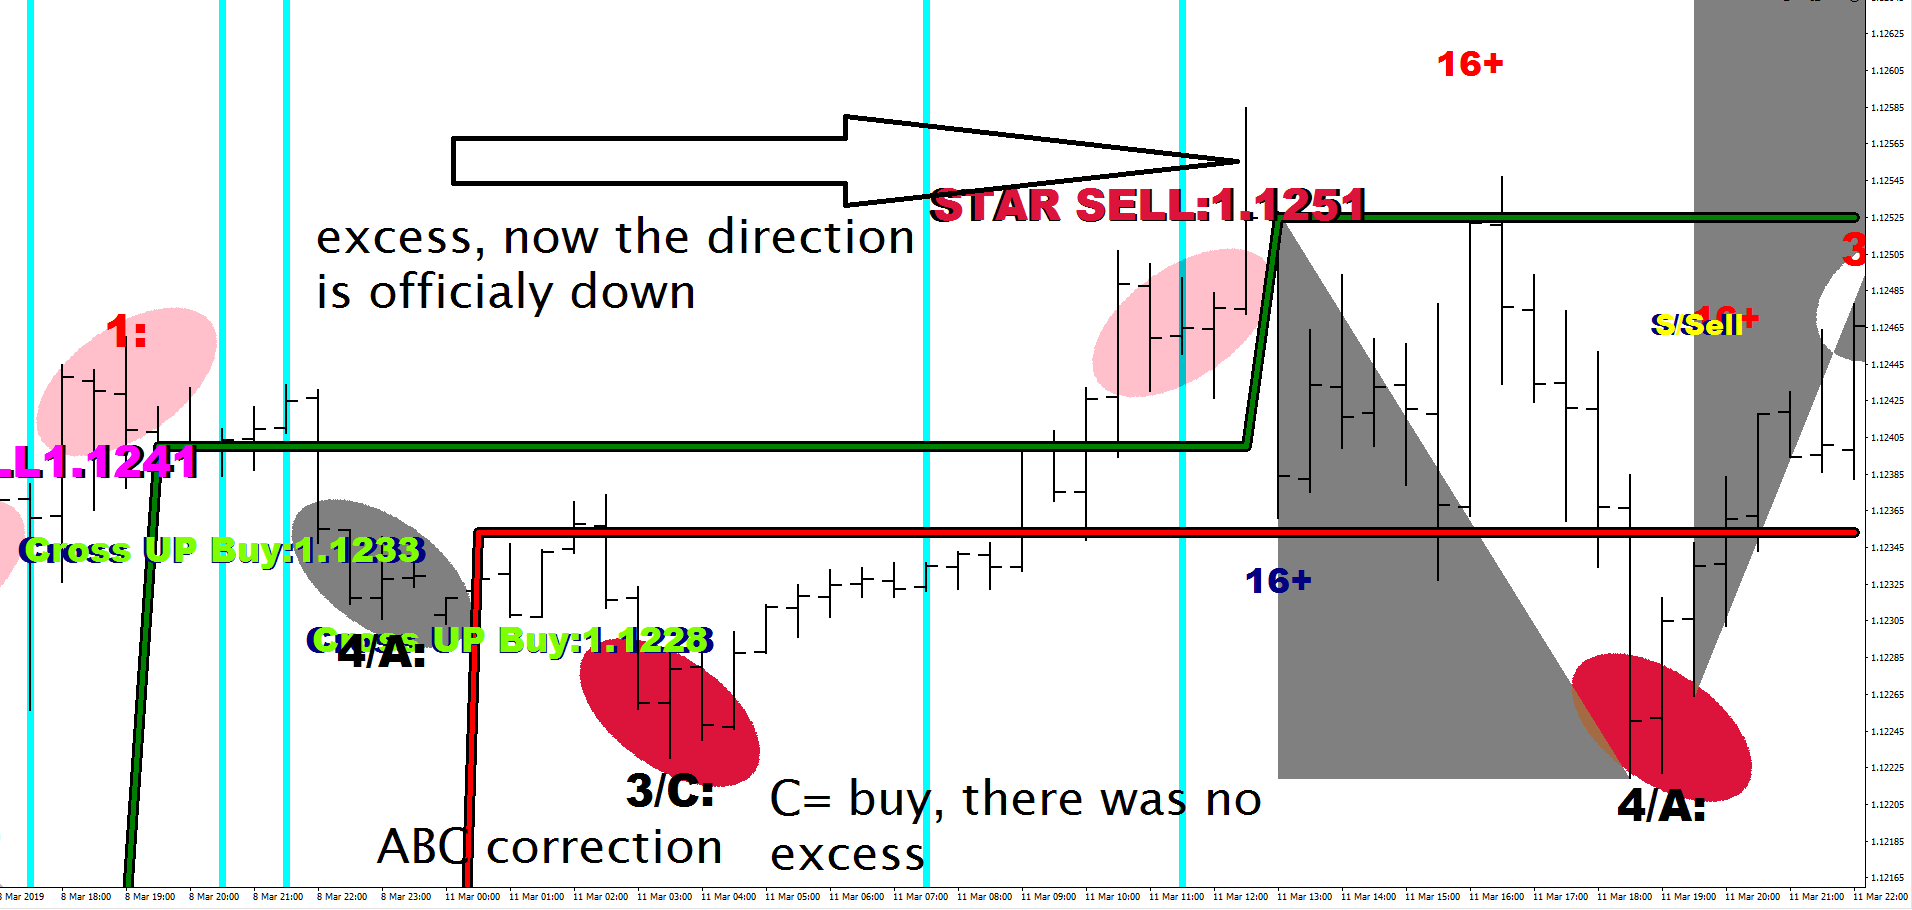
So I made this image the other day about the wave structure. That W4 did not seem right for it went down and back on the same candle. It was a liquidity break.
A liquidity break happens when the market is trying to find footing, trying to find orders. During a news event the participation dies off, so a “larger” stack would turn the price away.
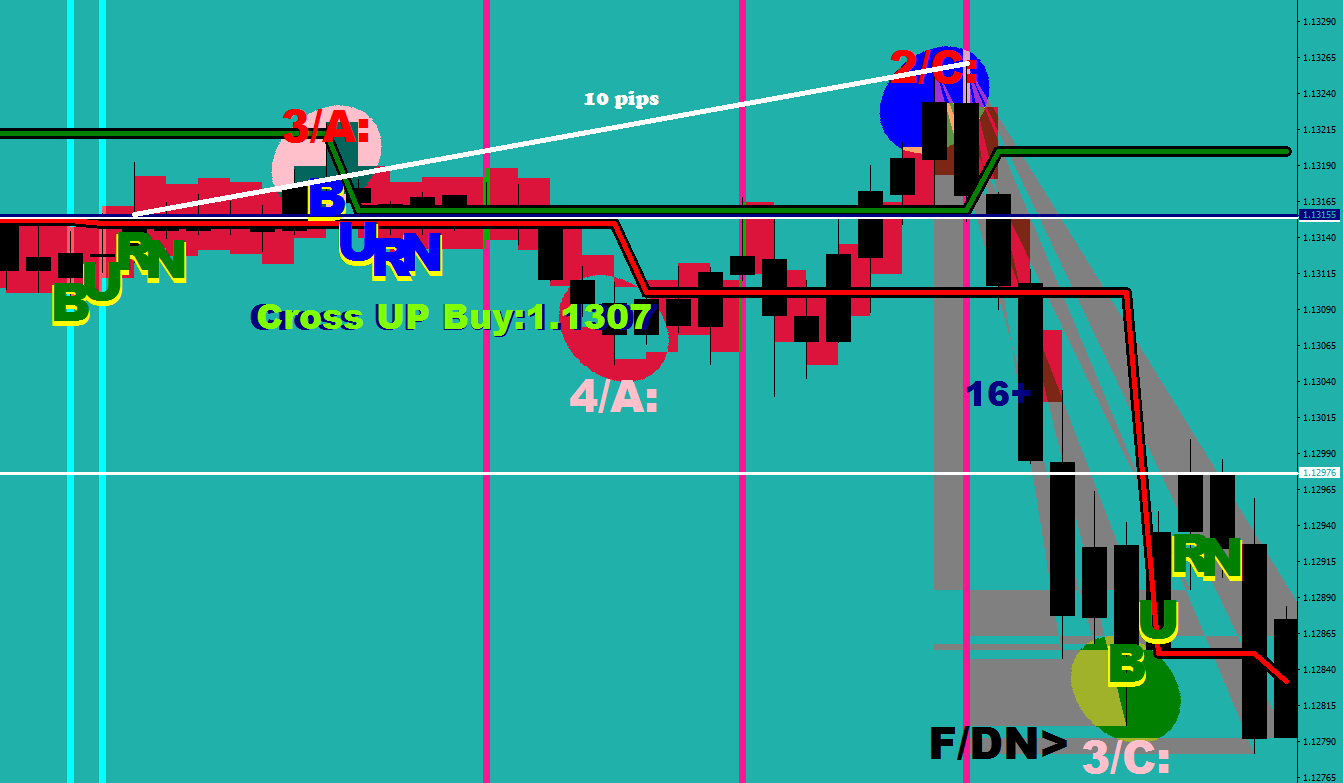
The Burns outlined the Cover Long level – with a displacement of 16 pips on the upside, and the Cover Shorts levels by a displacement of 20 pips on the downside – so this part was already in order.
As you can see, the Green Burns were the starting points of Wave 1 and Wave 3. The beginning and the ending of a move are not that different – this will come back later.
Now, let’s talk about the real Wave 4.
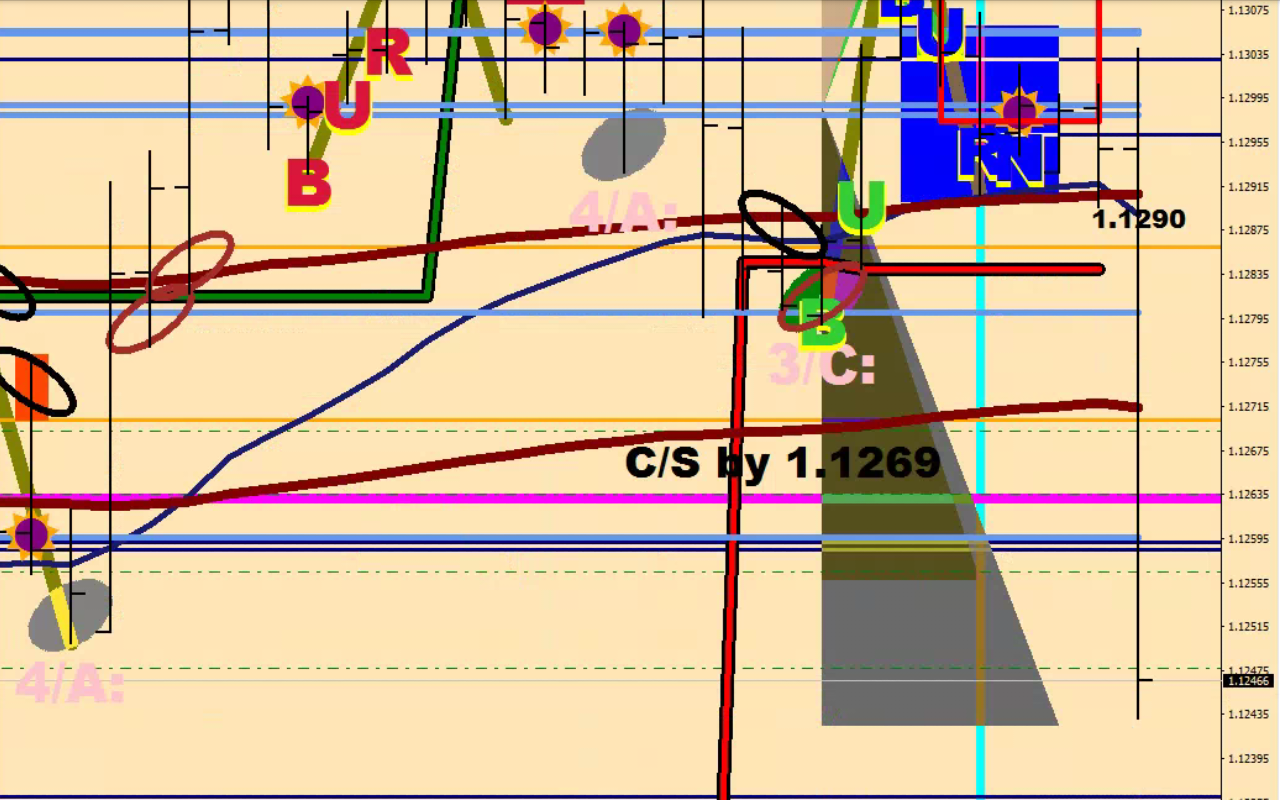
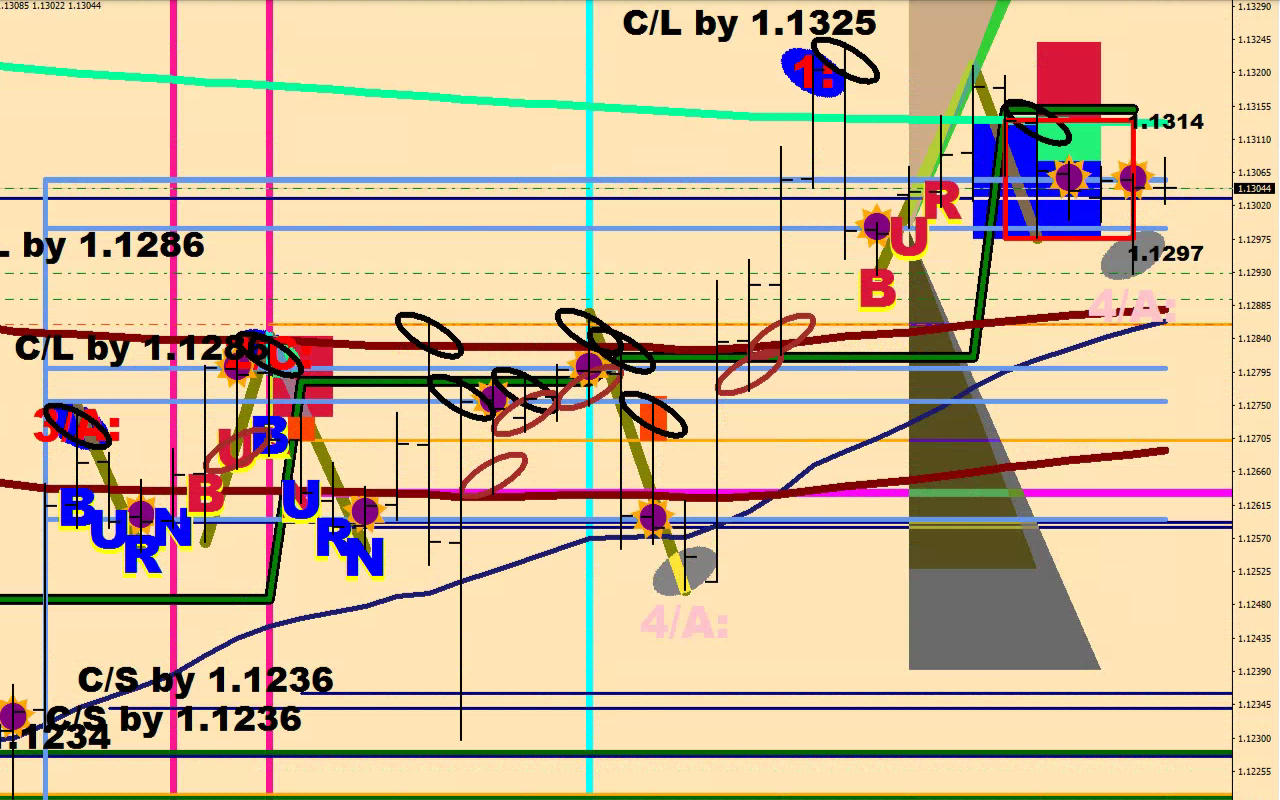
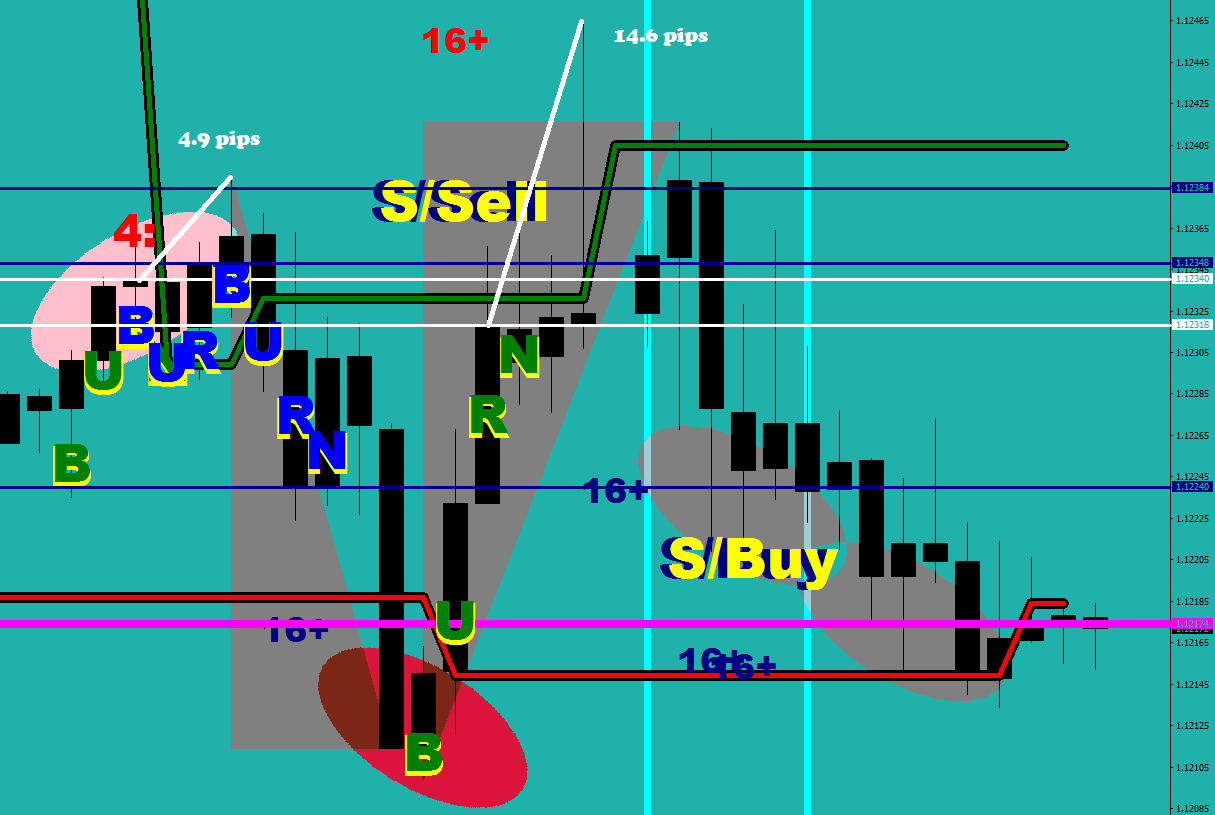
The most obvious thing on the image above is that the wave 4 found footing at the Green River. I have been saying out loud, that the Green River has the power to reverse a move, any move. What’s more is that usually the first leg would land on the closer end and the second would go to the further end.
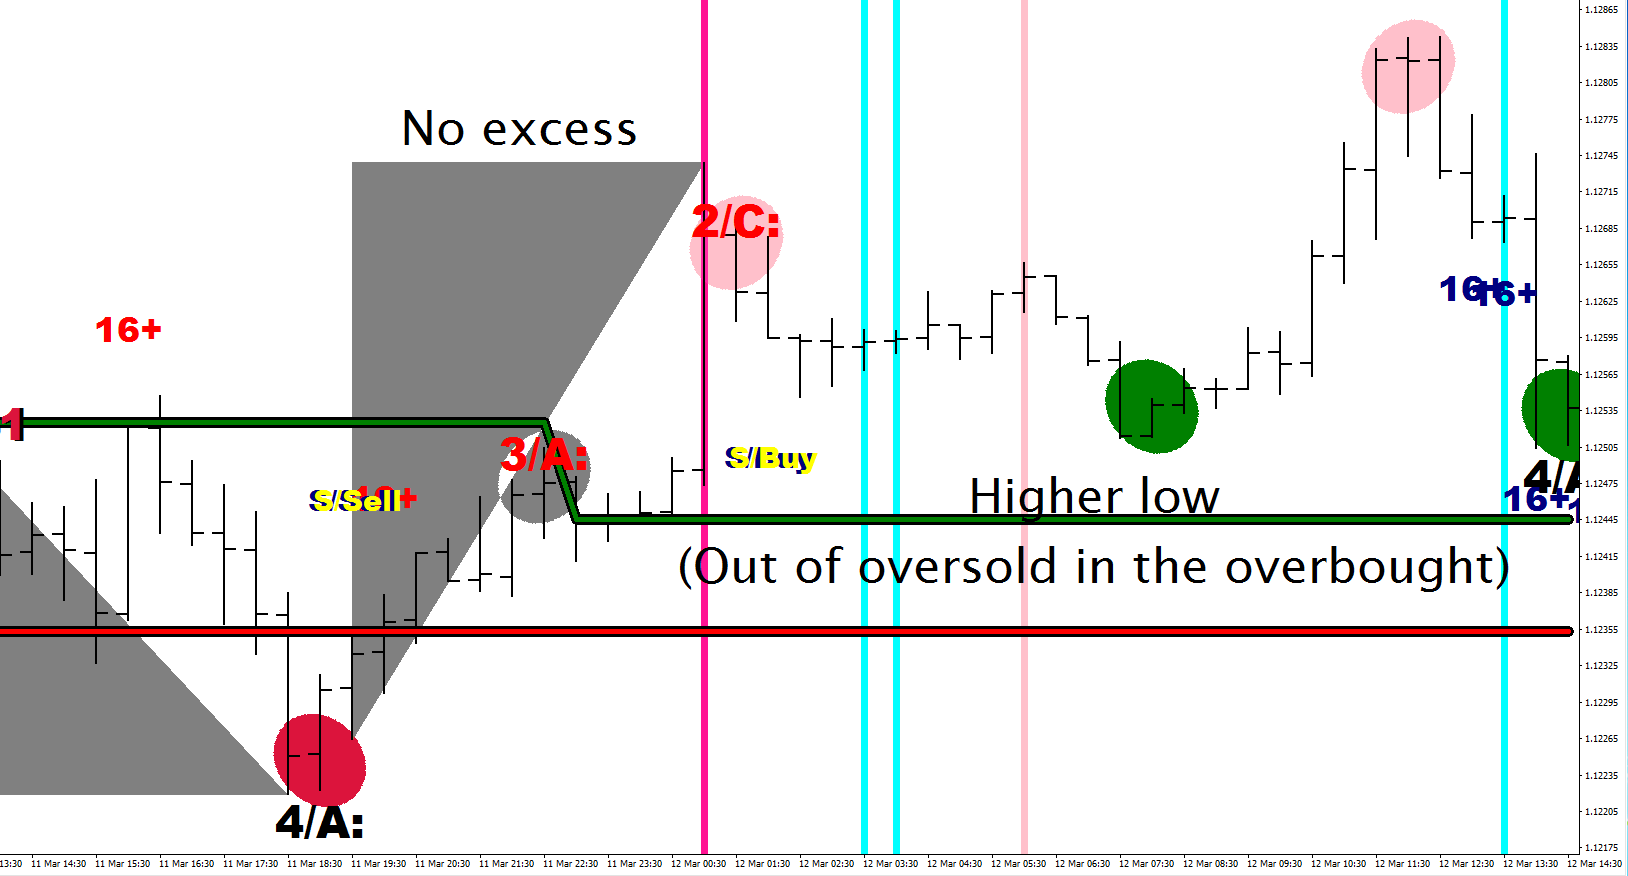
Dynamics: a subtle thing, but you could read this above as well: the SDU projection box on the upside was thrusted into, the SDD projection box on the downside was left untouched, and the SDU to the upside was blown right trhough (a sign of a starting move).
Of course there are the Green ellipse highlights of the lows by the Wishing on a Star, which mean buys as well as the green rectangle, which represents losing the oversold status (- which is now factored in the candle shading).
The blue arrows represent a right shoulder (for this was a Head and Shoulders reversal). There was a cross up warning earlier.
The 2 new added features are the on screen RSI divergences (in yellow) and the black, computer identified Terminal looking moves (based on 3-4 candle price behavior).
Let’s talk briefly about what happened afterwards.
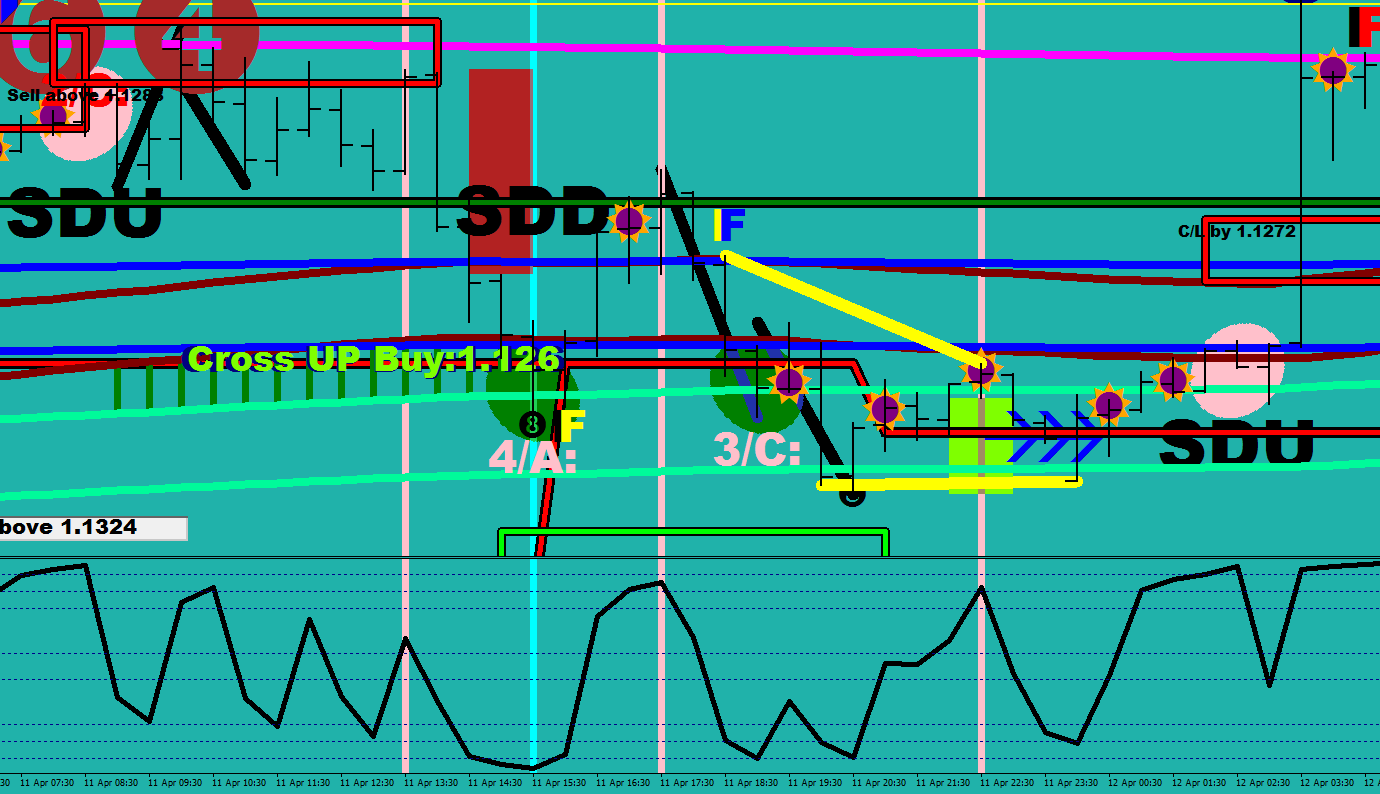
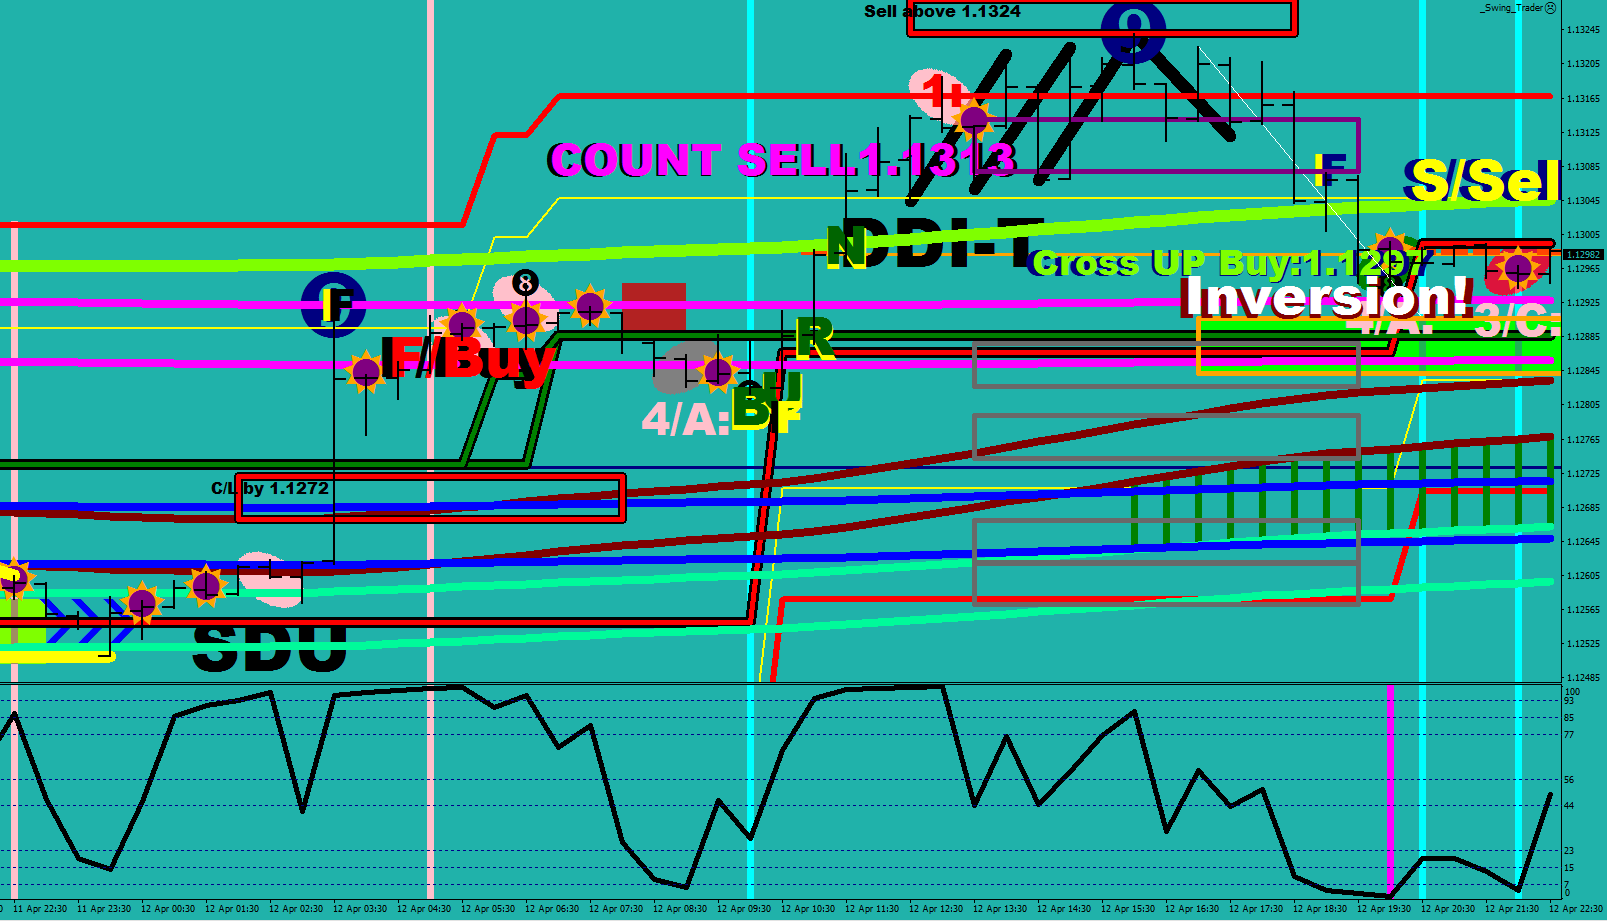
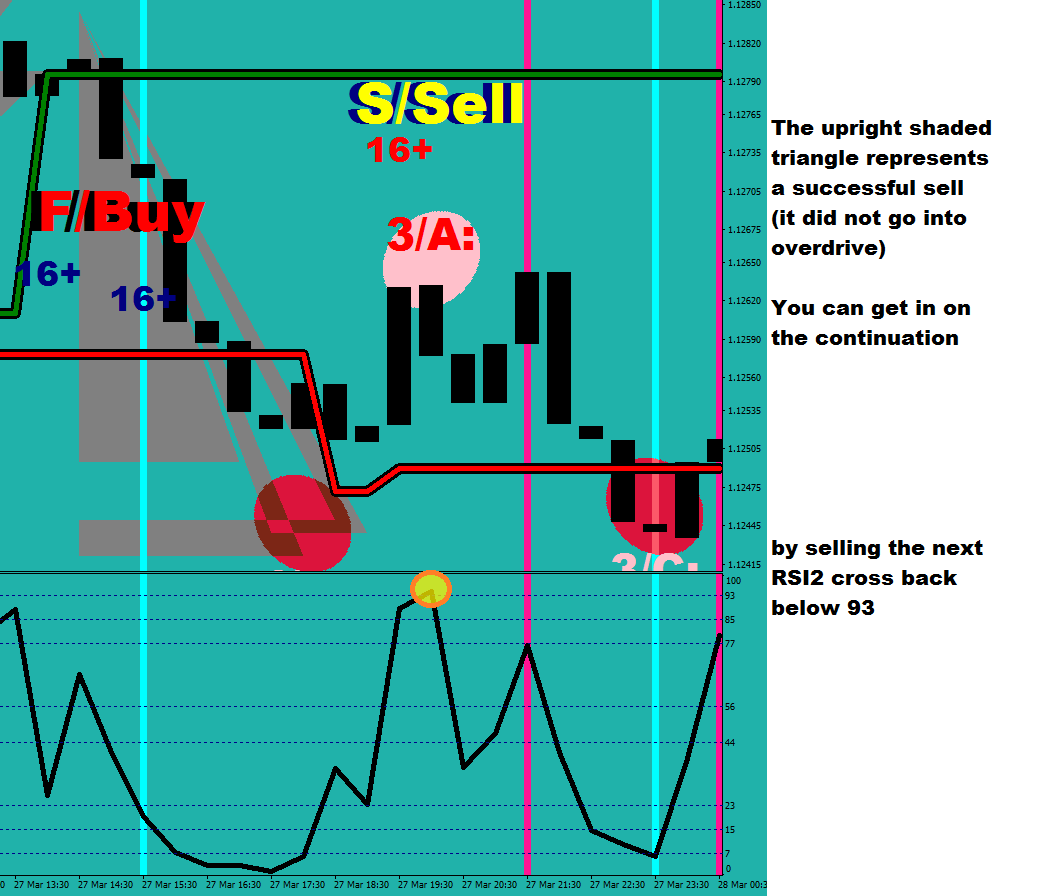
There was a Failed Buy (no liquidity/too fast run up) that represents a warning: Sell the next cross below RSI2 – 93. This means the first settled 30 minute value below 93 – after being above. If you look in line with the DDI-T print, you shall find it. (I just noticed that the price actually spiked into the DDI-Ts projection box).
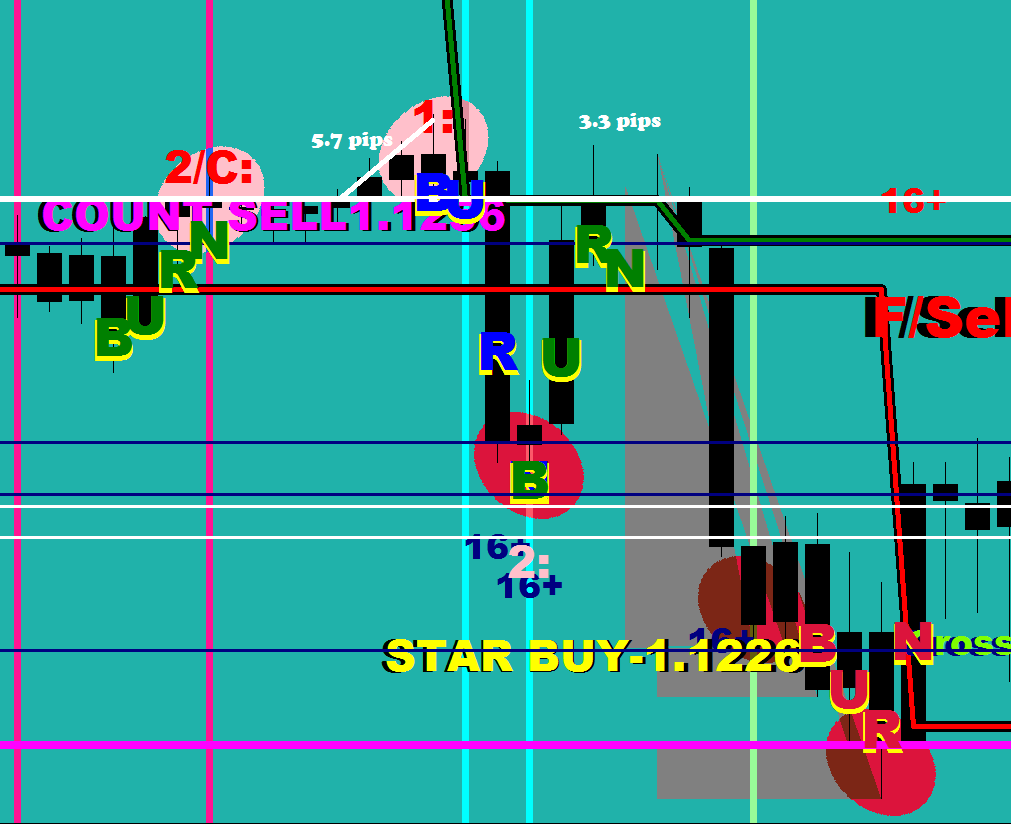
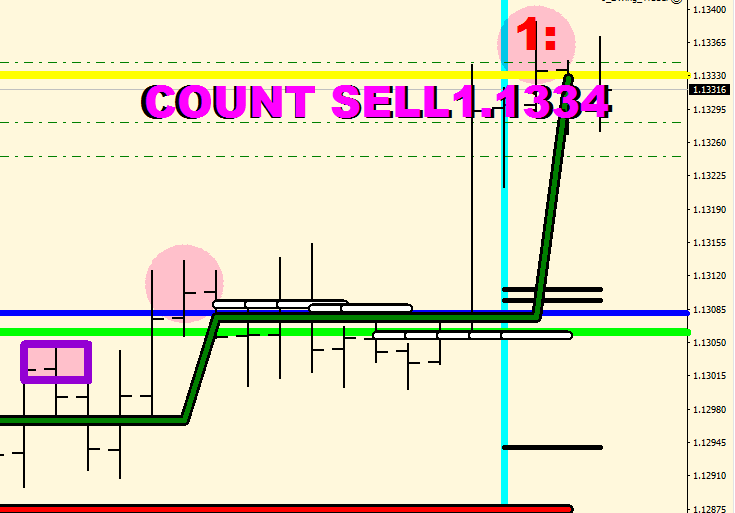
The last wave (I would argue that the whole Wave 5 was an ABC up) got kicked off with a Green Burn again. Price failed in the Bull Zone 1 where the Short Time Frame Bulls covered. There was a count sell, the red line got exceeded and there were 3 overlapping terminal lines – as well as a starting, – terminal looking – move to to kick off the move to the downside.
The Successful Sell would urge you to take a sell again on the cross below 93.
The green highlight box is 1 fluctuation size away from the swing above – white line connects it. There is an inversion of the overbought and the oversold lines – this may mean the market embedding – which of course would mean counter trend to the upside, since this is still an embedded oversold market.
If I had to pick a buy zone, it would be the spark zone with the green sticks.
My personal mistake was the wrong wave count and complacency: 235% gains in 2 weeks does not exactly make you being on your tip toes wanting to hedge – the 82% balance to equity ratio and the late night combo made me turn off the Auto Trading (and the auto hedging with it), for at 80% half hedge would kick in and at 70% another half, and overnight a mere wrist move at the broker would push the ratio below 80 even if the price did not proceed further. There was no disaster coming out of this, but I missed out on plenty of monies as a result (i.e. my usual daily 20% and only made 5%).
Another, in your face screen plot from yesterday is yet another way of plotting the daily fuel limits. Now they are two triangles projected from the weight and the fuel overbought/oversold areas are the two flat ending lines of the triangles. The coloring has a path of least resistance logic which is based on the number of near term 4h dojis above versus below.
The 4-h overbought embedding may sustain as long as you do not get 2 opens below the overbought line which is going to be adjusted to the new swing high soon (during the Sunday open). The way not to lose the embedding to the upside at all is by taking out the high in the first 4 hours.
If it loses the embedding, then these 5 waves to the upside were all she wrote.
Risk is just as relative as everything in life. You have the
illusion of having time, but you don’t.
You sit up for the notion of setting stop losses, and
thinking that your capital is protected. It isn’t. To hold a position into the
weekend carries an enormous risk for instance, and it can cost you all of your
risk capital if things take an unexpected turn.
The earlier you realize that all of the money is at risk
that you put in on a bootleg brokers account, the better off you would be.
I opened an account with a Russian broker once – when I was merely
trying to open a demo to find out what their spreads were like. I got a phone
call later that was almost threatening: “You opened an account with us, we are
waiting on your next move” – they told me. I would never expect that they would
care to pay you out any gains even if your account would show them to exist.
Who are you going to turn to for justice? Your mommy? Whom are you going to sue
in case of an offshore broker say on the Marshall Islands?
You would find that despite all of your efforts, having a
pending order placed for a hedge with the broker – to eliminate the event that
you go offline, i.e. during a power outage or if the internet provider goes
offline, your safety isn’t assured.
One of the brokers I have an account with goes offline during
the morning hours quite frequently and does not even feel like they have to
apologize for it. I guess the attitude is that people would blame their cell
phone connection / provider. But I have multiple accounts with other brokers
and I can see that they are on; plus I can log into my home computer remotely
and look at the terminal’s journal where it would say “unable to connect”.
Other times your app would come back with “common error”. Anything can happen
when the market is open even in the matter of minutes, let alone when you are
unable to make any changes for hours.
One time I had to phone up the broker when an account went
into red lining (margin call, not margin cut) – they claimed that they sent out
an email – which I never saw (blaming a French vote taking place during the
weekend), and arbitrarily they took away the leverage on a Friday, which meant
the 1:300 became 1:50 and the account that was fine got rendered into being
under margin call when you are unable to hedge. I had to get them to temporarily
re-apply the hedge so to be able to take on a hedge, but as you can read out of
this, there are a lot of ifs, and ultimately this poses another risk factor
that can cost the account itself. Brokers have the tendency to utilize men made
chaos to turn it into a payday for themselves.
So, what is the answer to all these? You need to choose the
broker well. You mustn’t use stop losses unless you feel like volunteering for
losses. You need to have a hedging system in place instead, that can save your
ass, and all of these would account for nothing if do not manage to develop close
to perfect senses to what market you are in and be able to anticipate /
acknowledge turns incredibly well.
Brokers sometimes do not acknowledge your stops either. I
read someone’s story that when the Euro peg was released by the Swiss Bank, and
they moved against each other by 42%, he got stopped out from his USD/CHF
position with a 10% loss, and was happy with his broker. Others were not as
fortunate, and their brokers did not cut their losses until losing 25-30% on
the same trade.
Is this an impossible quest then? Not, but it would
certainly cost you anything you are willing to give and more. If you are lucky,
then you come across somebody like me, whom can spare you losing everything,
for I have been through it all, and I managed to learn and develop things for
it.
Now, let’s compare quickly the average Joe putting on these
perceived risk/reward trades trying to catch the big fish with someone who has
a philosophy of “getting some”.
If you listen carefully, you may end up understanding how
Capitalism works.
Exhibit A, your so called proactive trader gets very good at
his/her game and manages to make some money by the end of the month, in the
neighbourhood of 5-10% relative to their deposit size. He constantly volunteers
for losses.
Exhibit B, the frequent hedger guy does not get every turn
right, and may get called into partial / half / oversized / full hedge,
starting from 15% relative draw down, but in return, always ends up making
something, very often is holding counter positions that takes away some or all
of the risk, has control over when to take a loss, and his objective is to gain
equity faster than it is moving away from him. He makes money every day, but to
be able to pull out funds, he would have to get very good at recognising and
catching the turns – and be not afraid to take smaller losses if that prevents
further draw downs. Mr. B can make on his high leveraged account (1:500)
50%-100% gains per week. If things go well, he can take out all of the gains
biweekly or so. His risk went to zero relative to the risk capital on the
second week of trading: he got his capital back. Now all he has to do is to
repeat the same thing 25-50x more that year, without forgetting to take out at
least some of the gains when the account has no holdings (open positions).
There is a size limit that despite of greed the account should not exceed,
which derives from the broker imposed maximum lot size. Once the broker can
deny you the ability to hedge, you would lose your edge and you do not want
that.
You can also begin understand now that in Capitalism,
production, even money production should become more and more efficient over
time, and the overall risks would drop further, for the risk capital’s increase
would fall short from the increase of the wealth.
A relevant comment from my pal, Dutch:
Had a run in with a binary broker out of Nicosia, Cyprus
years ago. Ran $500 to $43,800 in 45 days. Asked for my money. NO response.
Finally, called them. Bunch of Russian gangsters but FUCK them. Told them they
had 72 hours to get me my money or me and my crew of ex-Marines would board a
plane, first to Brussels to lodge complaint with any regulatory body. Then, we
were flying down to Cypress for a man-to-man conversation and the outcome would
NOT be pleasant in the slightest. Got my money in 48 hours. Nothing worse than
waiting for a wire out of some fucking Bulgarian bank.
To understand the story of the market, the very first thing to do is to ditch the single-line moving averages and start using double lines instead – and the correct sample sizes.
Using my LEMA 30N indicator would be perfect for this.
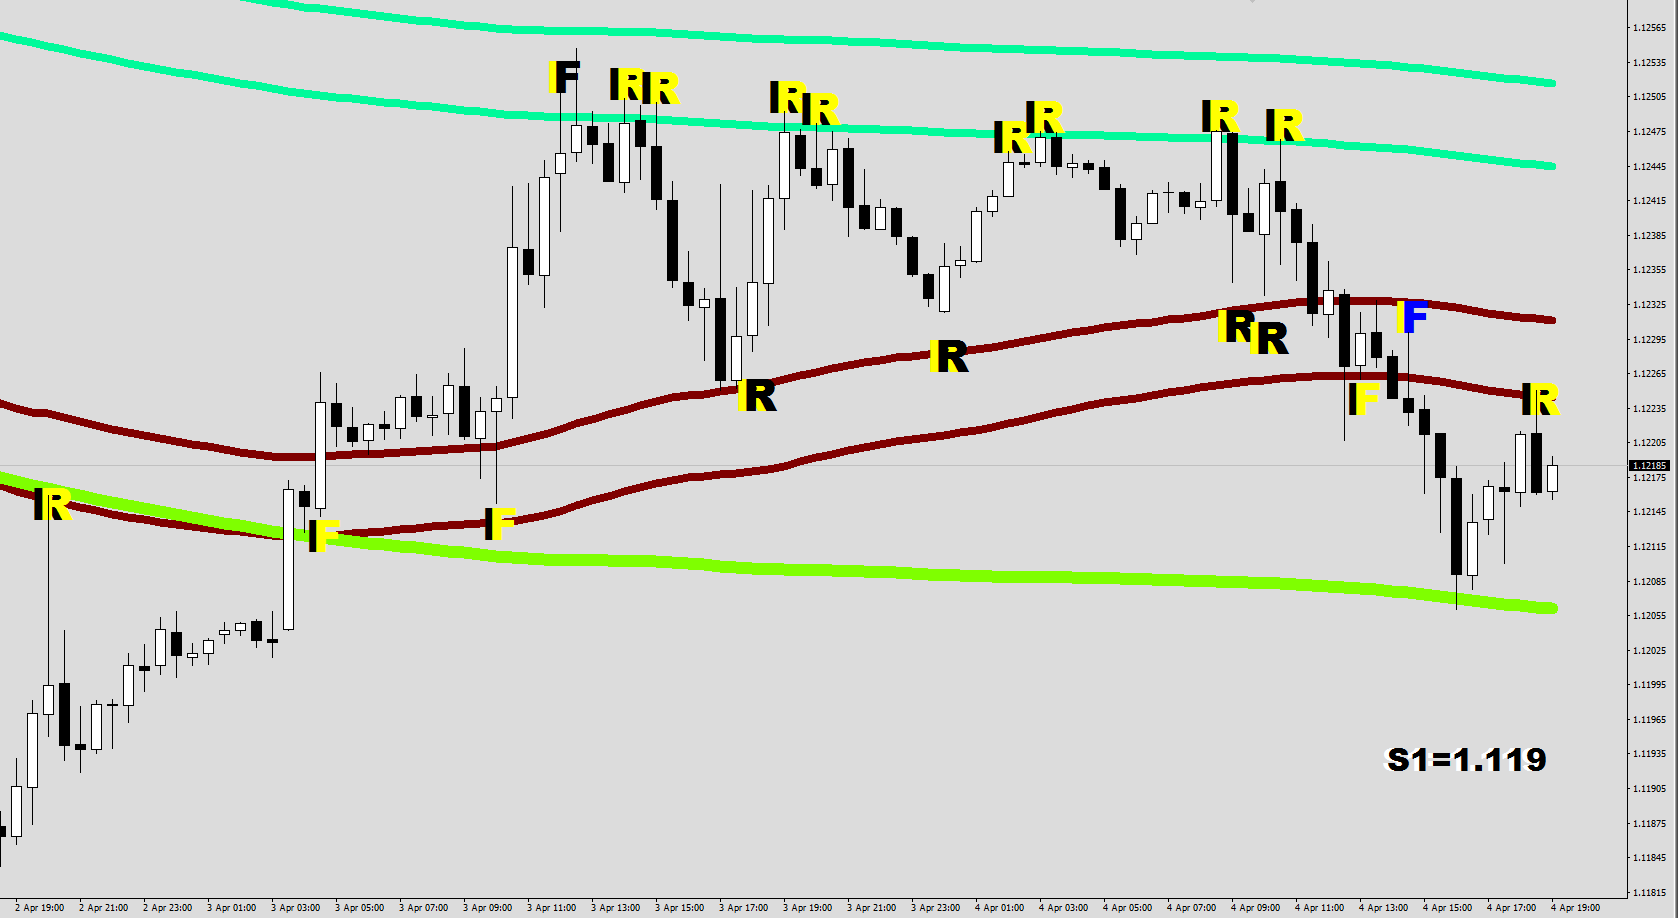
See, you have to be able to decide if you saw a Failure or a Ricochet. With a single line this becomes very uncertain.
With one EMA plotted on the highs and the lows, you can start calling the turn-aways at the closer line as Rebounds / Ricochets and the turnarounds at the further line as Failures. (You may pick your tolerance, but the ones I went with – for the purpose of the screen plots – up to 3 pips beyond and falling within 2 pips of the actual line.) It is not because an F cannot be under/over cut, but it certainly should give you more confidence that the base would be holding up for a while, and to give you a suggestion for the trading direction: away from the F.
Ricochets simply make price Relapse having to make a part or all of the progression Repeated.
Now, let’s sort out quickly what happened at the Lower Guard Rail – which is at 1x Fluctuation Maximum Measured from the Green River above.
Was that a Failure or a Ricochet?
It was a quick dip into Bear Zone 1 from the neutral. The weak handed / short term bears cover in this area, making it potentially a very bad location to go short at. I would call this a Failure of penetrating into the Bear Zone.
Following the same, “in the vicinity of” logic with the BURN lines, the following can be said:
You want to initiate your shorts just above the white line (the green, overbought line is there to fine-tune), and only for up to 8 pips above the line. After that you would need another white line to be crossed for your next entry position.
Similarly, your covers would be just under a white line, preferably 2 white lines out. (When two lines are much too close to each other, they should be counted as one).
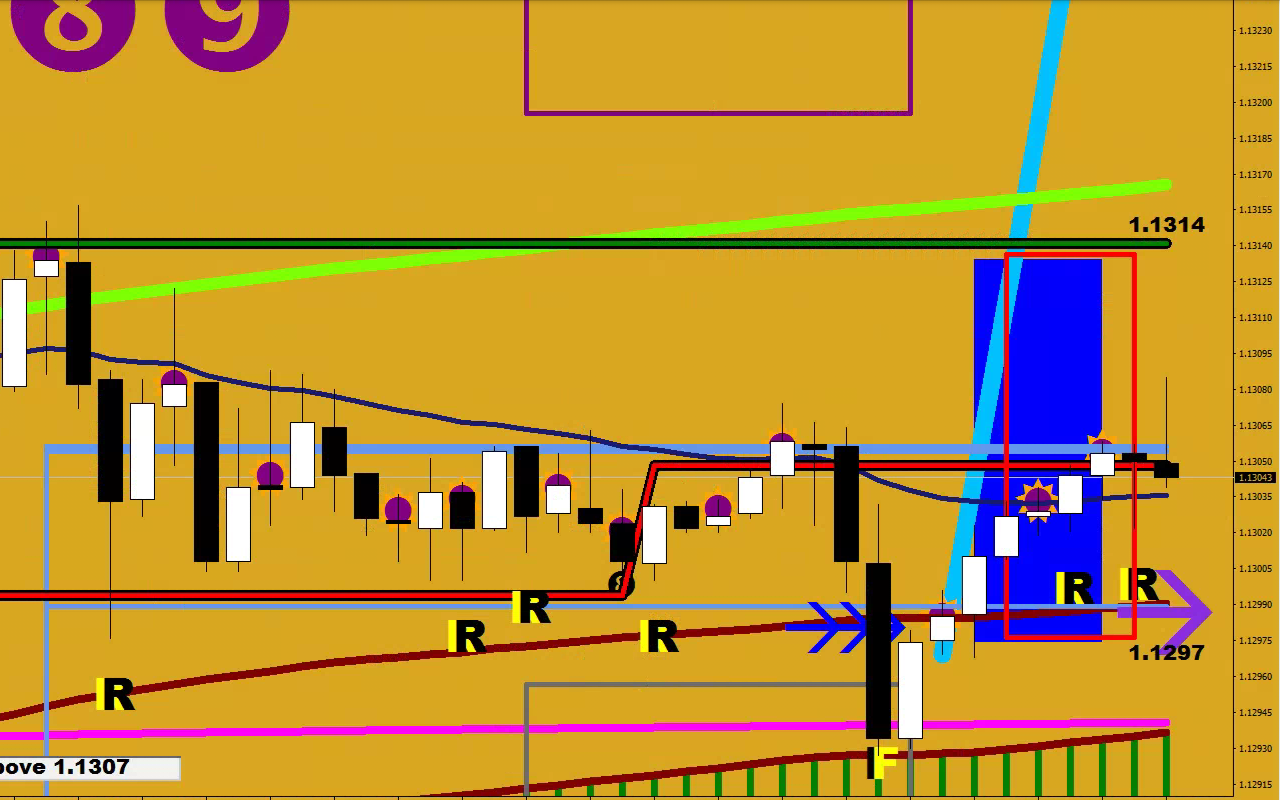
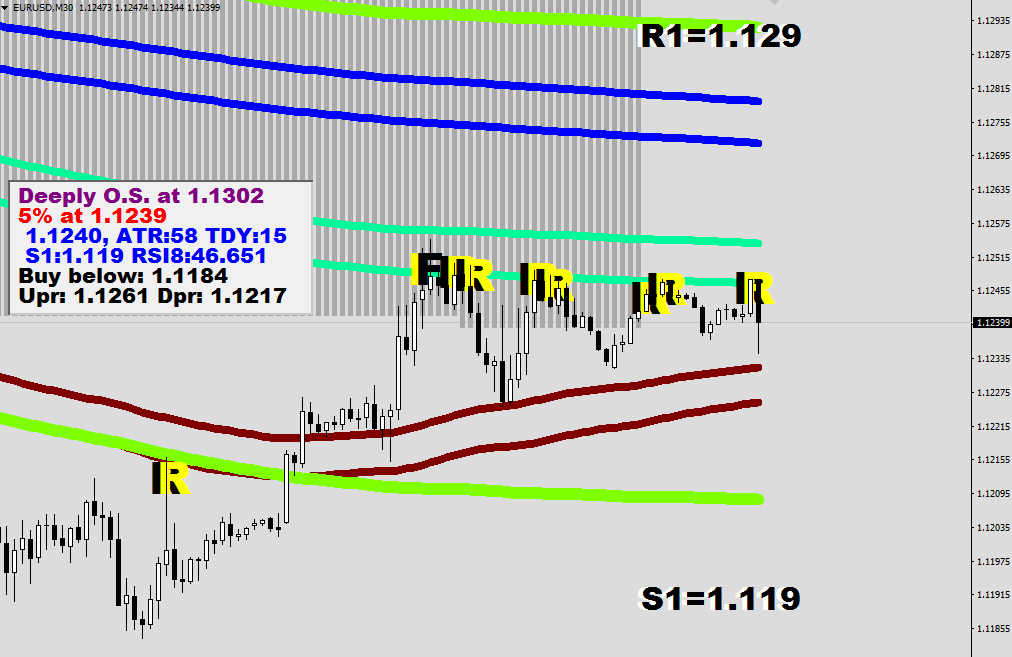
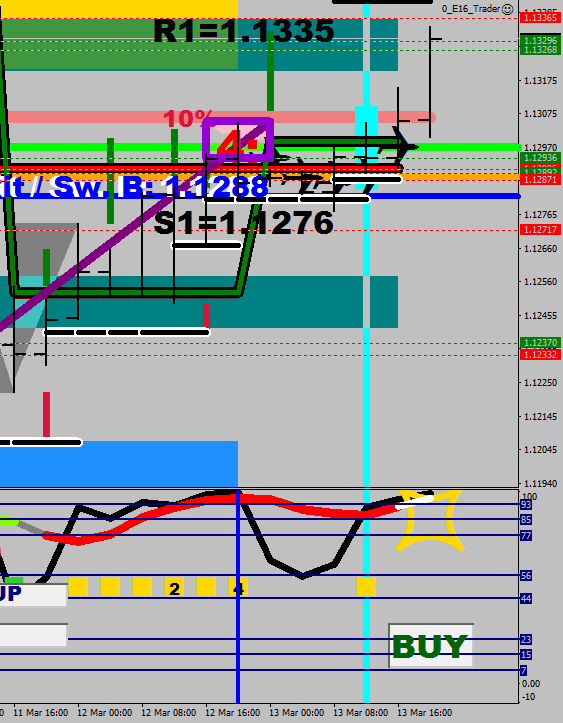
So, why did this consolidation in the Spark Zone (which is between Mr. Maroon and the Green River) played out to the dark side after the area putting on a squeeze?
Well, it is one thing eyeing the Blue Pair, and noticing the direction going in and the R1 resistance plotted above along with the Upper Guard Rail.
The answer is in the market type. The market is long term embedded oversold, that you can figure out with my Comfort Levels indicator.
To quote myself, in the Embedded Oversold Market the Longs Fail and the Shorts Prevail.
So now you have the right music on.
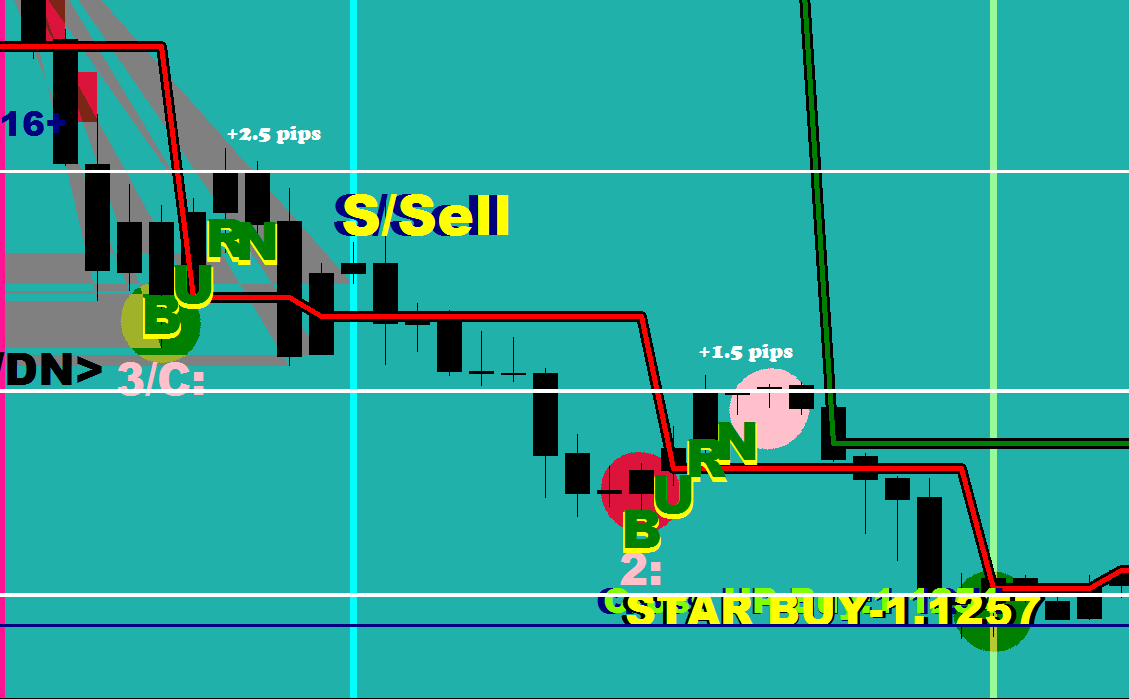
You can see that there was a BUR(N) just printed to keep you to the right side of the market, along with the Blue Ellipses that mean “short” by Wishing on a Star indicator.
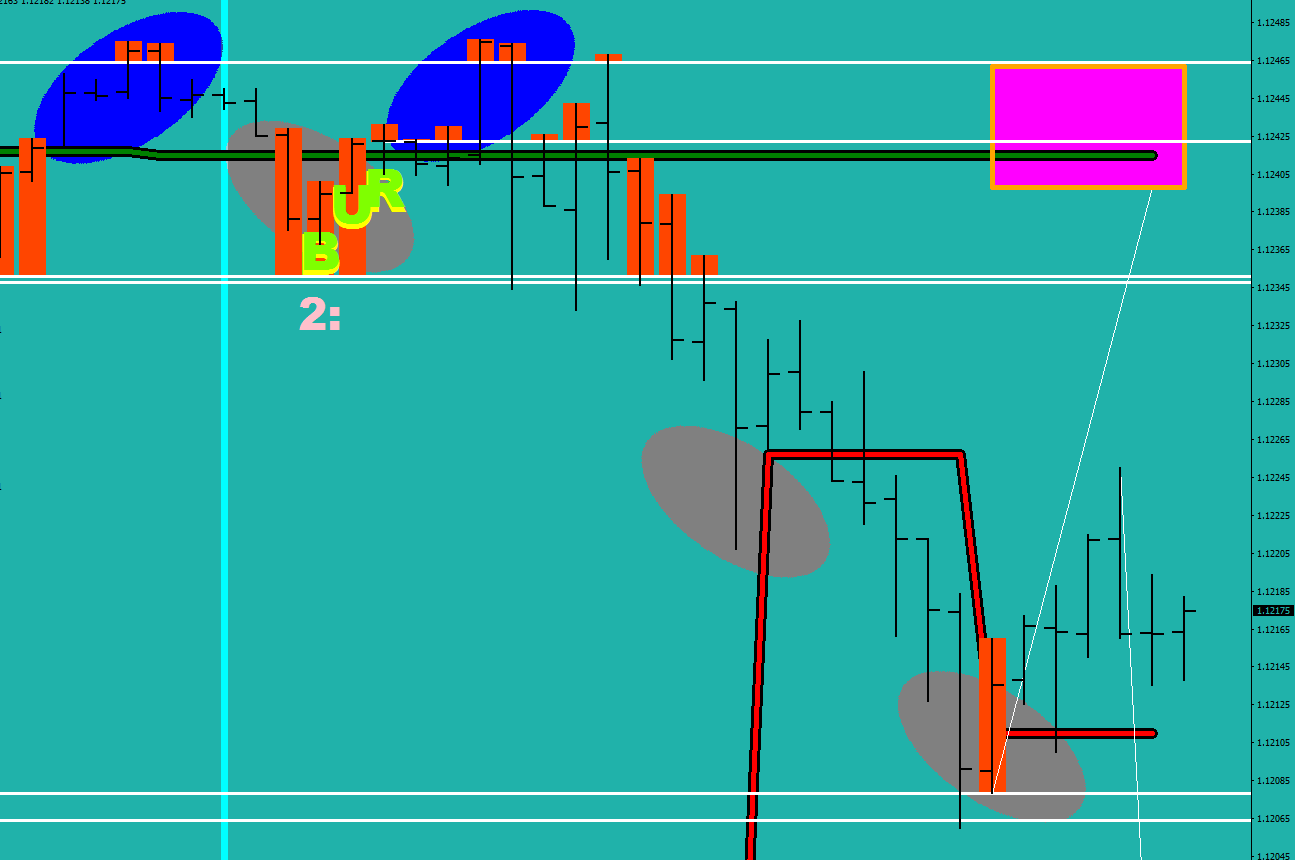
I actually did the very things that would make for a good text book:
I sold just above the freshly printed white marker 1/2 size and added another 1/2 upon a move above the next white line.
On the first, 30-minute break candle I covered both, one somewhere on route achieving more than $500 (10% relative to base account size), and the other half pretty close to the next white line (almost 20% gains in twenty minutes – I’m trying to teach the thinking here, this is not about bragging.)
There is more in the way of signs to be had in getting the direction right.
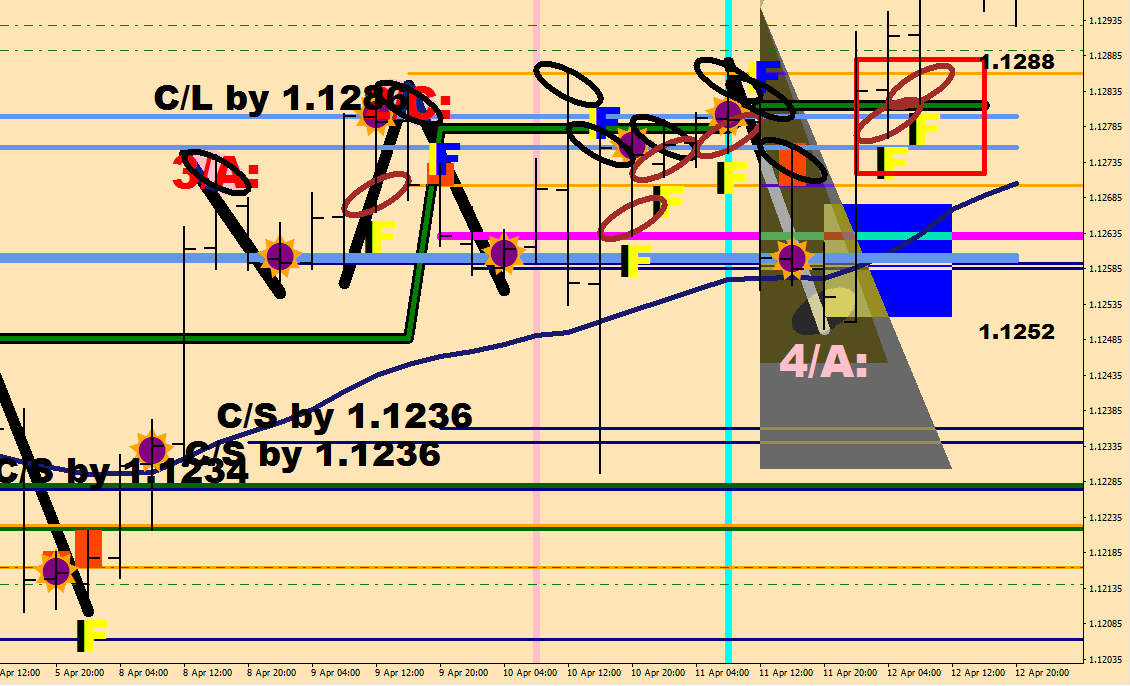
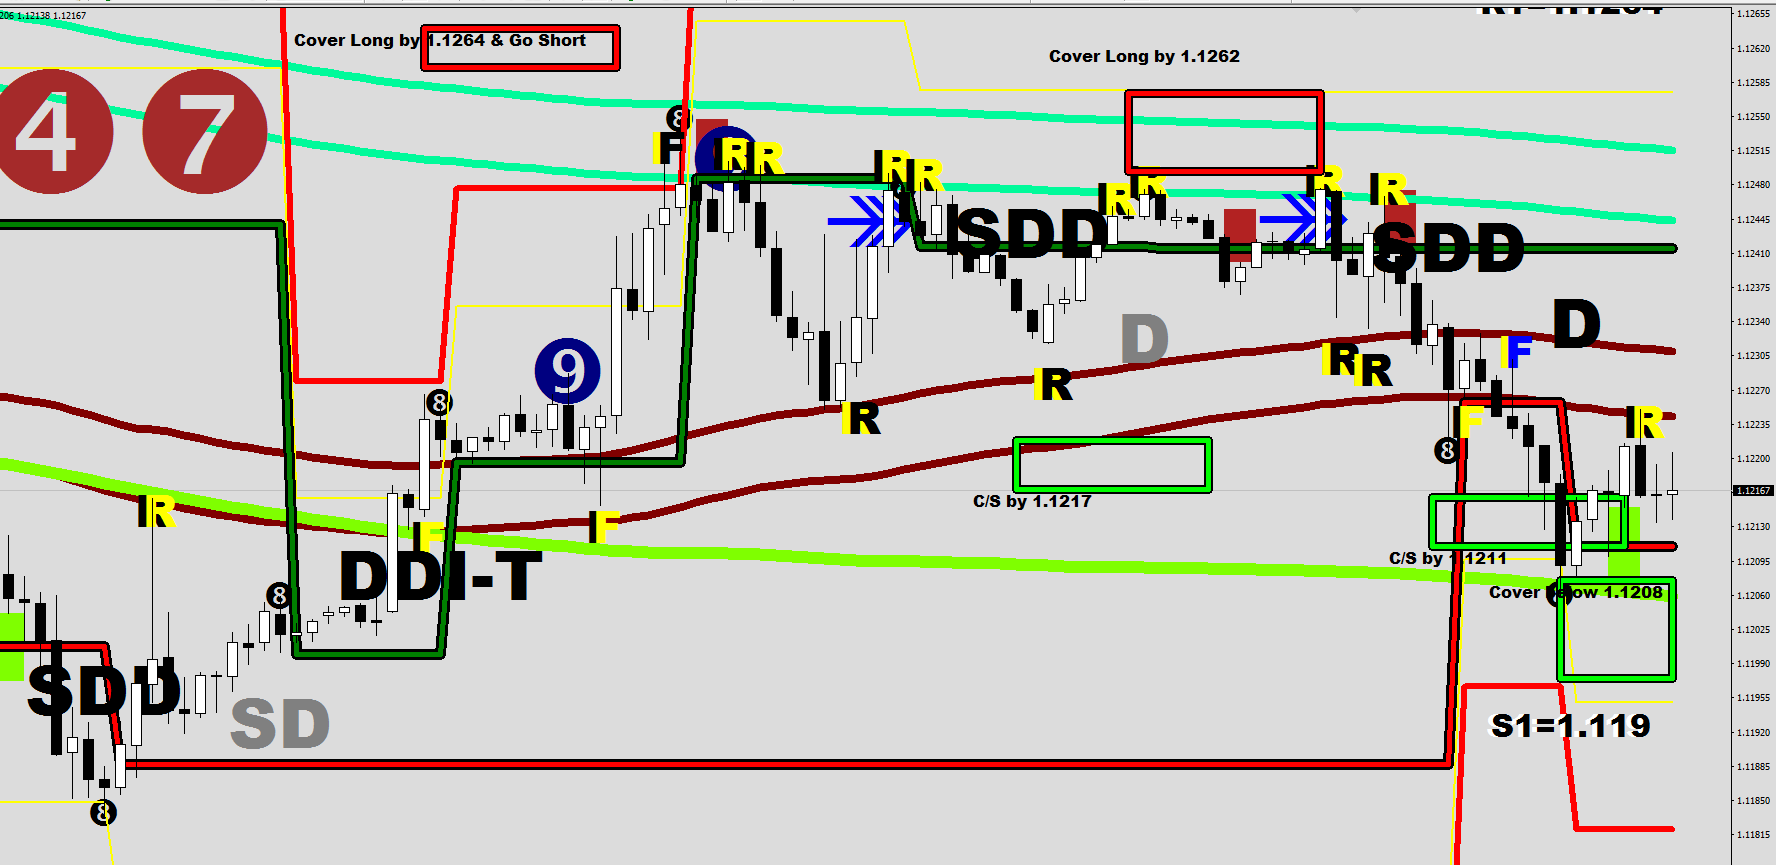
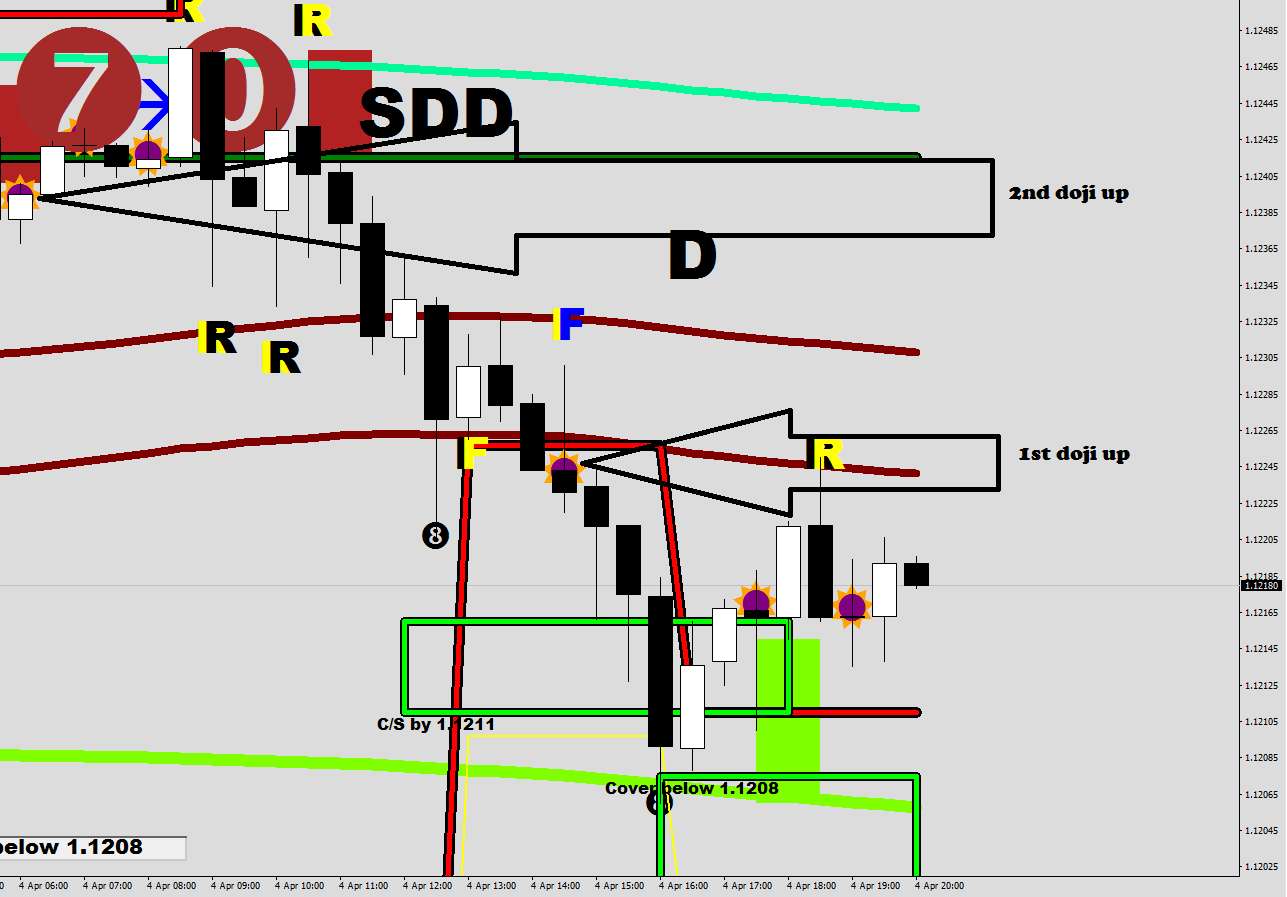
If you were to plot the 88 Luftballons in “thrusts only” mode, you would see the thrust boxes.
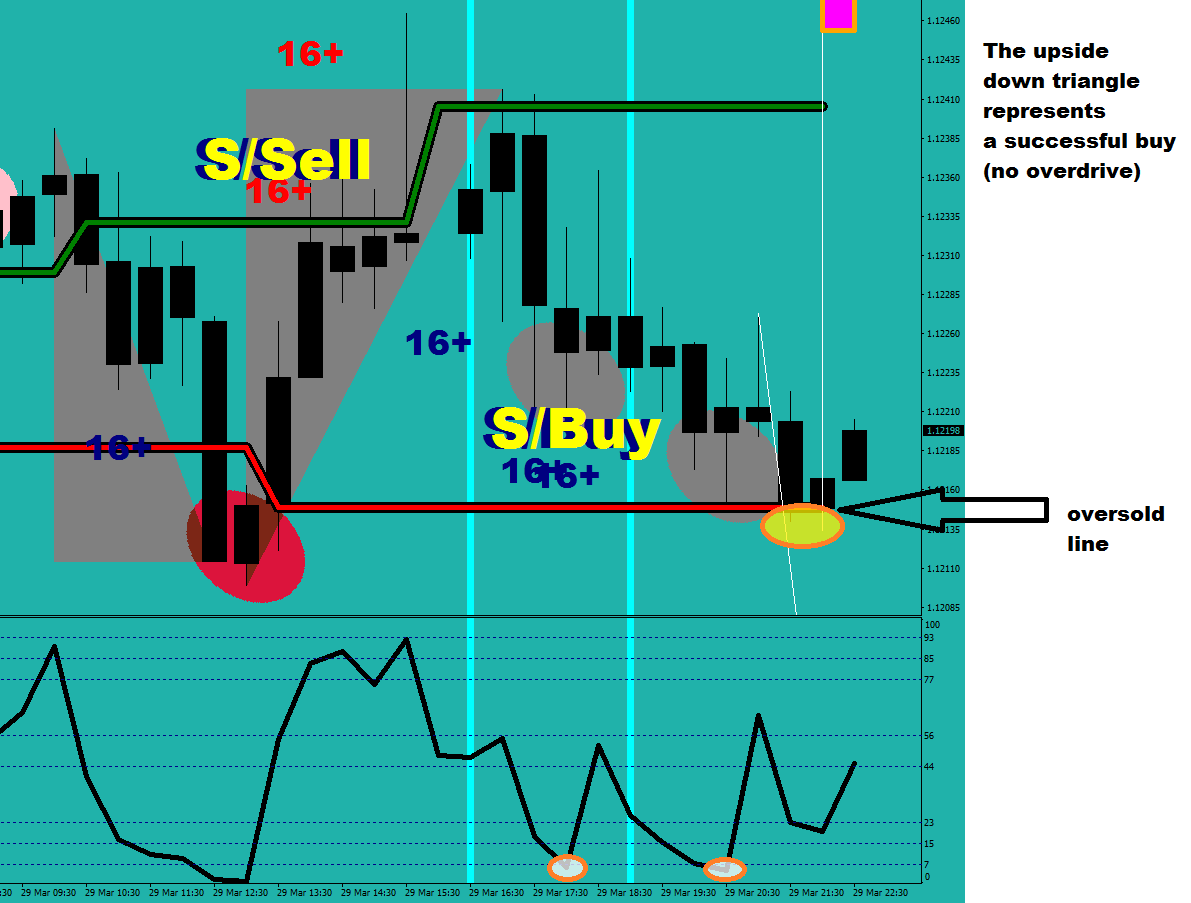
The first, DDI-T prompt’s red target box was called off by the F failure at the Green River high. The SDD (Screw Driver Down) had a projection box as well, but an R, Ricochet at Mr. Maroon put a stop to playing out immediately. There was a D, that was grayed out because of its location, and price never made it to those heights again. On the downside you had another SDD printed, and since price spiked into it (and even exceeded it a little), some of the downside force was taken away.
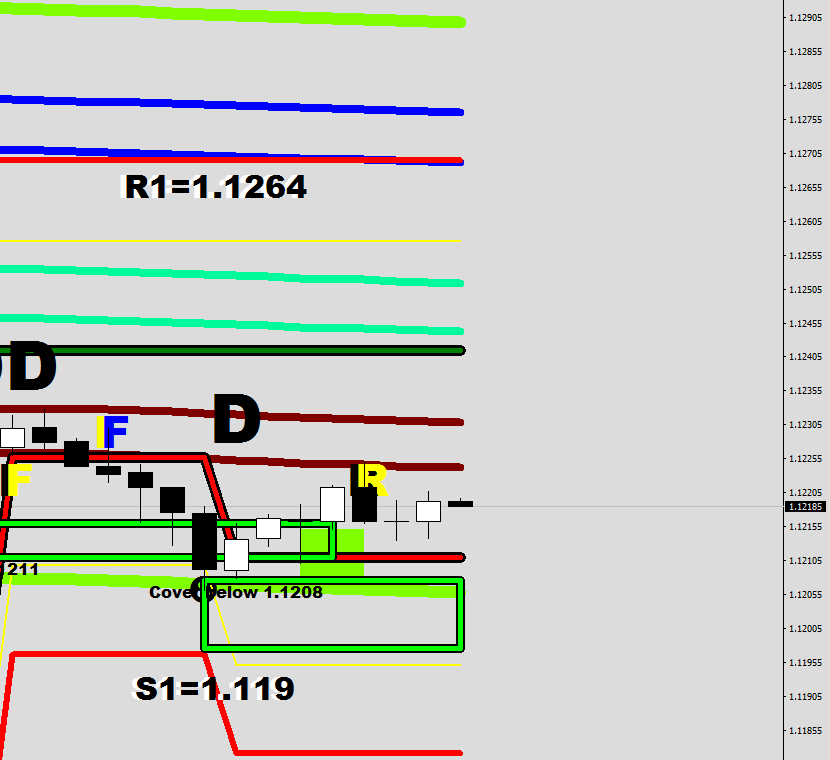
As you can see, that box has a Cover by 1.1211 print at the low (was plotted real time with the SDD print), and as intelligent that routine is, the next projection box, that was a D (Driven) condition to the downside had an additional Cover Below print with 1.1208, but this time at the top of the projection box. (It was spiked into basically immediately.)
So, where are we at now? In an Embedded Oversold Market. The LEMAs have bearish configuration still. Yet, the short term memory is that the bears covered for now and there was a Ricochet at Mr. Maroon. Price is out of the oversold. It has to adjust the overbought level.
The Maroon Fake out – Fake out pair (with the second F in blue) is the cap of the move for now. A brake above it, and you can be headed towards R1 that is now at 1.1264 – the Blue Lema (the 30-minute one) just started coasting into place.
The second doji up is at 1.1239 – right below the current overbought level. This is where I set my long targets to.
I would like you to take a journey with me. A journey to the
unknown, unexplored, to the unexplained. I can assure you it would be
worthwhile.
Liberating would be an understatement.
I have broken every imaginable record before I managed to
become profitable. (All the records I have not broken should be re-examined for
credibility / authenticity.)
In this world of mine, there is no volunteering for losses.
There is no hard work of hand drawing unlimited useless trend lines. There are
no moving average crossovers, for there is but one moving average in the
classic sense.
The idea is not to be right all the time, but to make money
every day.
This book is about Forex, about retail trading, and is fine-tuned
to EUR/USD. I shall show you the 3 genders of hedging and my implementations.
I will teach you about the market models I’m using.
I will help to start making EAs on MT4, to be able to exploit edges and to manage open trades.
About the Author
My trading venture started with opening an ING account back
in 2009. I started with buying and holding NASDAQ / technology stocks. I was
trading UNG for a period of time (and learnt of contango this way). Soon after
I opened a TD Ameritrade account, and qualified for LEVEL2 trading. I was
trading S&P futures, and moved on to triple leveraged ETFs of the RUSSELL
2000.
In 2010, my “stock trading” resulted me wanting to lose the
burden of the Wash Sale Rule, and switched my accounting method to Mark to
Market. I bought and sold $18 million (face value) that year using my own money
with the two main accounts.
I had one options account that I used to trade weekly
options with.
I only paid for two subscriptions in my life. One was a
stock picker service, the other was Options Line Backer (iron condors).
I started developing my own indicators on ThinkOrSwim
basically as soon as I had it – in 2009.
I moved to Europe in 2013. I got caught up in the Forex
mania almost immediately.
One broker I knew personally started me down the path of
developing on MT4.
One hedge fund had me on their trading floor the next year.
I met some people wanting “grey boxes and black boxes”. I tried a few brokers.
I started writing automated routines in the summer of 2016.
About this Book
The objective of this book is to provide the retail person
with enough knowledge and examples about the reality of trading and to
ultimately encourage them into wanting to find their own path of developing
automated routines.
I intend to hand out the keys to the right thinking as well
as to the understanding of how to do things.
A different disclaimer
Trading is the hardest thing I have ever encountered. It is
a never ending challenge, where you cannot stop standing on your tip toes. It
is a love at first sight and a struggle for life.
I am looking for people with similar thinking, similar
intentions for a joint venture.
This is the essence of what 10 years of trading, 6 years of
Forex trading, 9 years of indicator making and 3 years of heavy duty automated-trading-routines-development
and testing has yielded me.
Plus the core question that has occupied most of my brain
capacity all along.
“How much is there to know about trading”?
I was prepared to make changes, to reconsider or even to
start from scratch, whatever it would take to find answers.
I found my way, my path. There is simply nothing like I have
built out there, and this comes as no surprise knowing my commitment, the
sacrifices I have brought.
My life’s work for 18.5 cents a page. A free starter kit of
indicators for anyone willing to read from me, to learn from what I have got to
teach.
You are gonna love the way you come to, I guarantee it! (Macdulio’s Warehouse)
To make a purchase simply send your payment to one of the following email addresses:
If you wish to pay in US Dollars ($25), Paypal me to macdulio@yahoo.com
If you wish to pay in GBP (£20), Paypal me to gaborszentes28@gmail.com
You shall receive the Word Document file via email along with the starter package of indicators:
BetterVolumeChartBars, Fractals Modified, Comfort Levels 4H, LEMA 30N, ATR Limit CI, 15-min ATR Targets, Projected Distance & Projected Distance Lines Fitted and I would include the Dojis as well in this package plus the Broker Auditor.
Like I promised, this would be the best spent 20 Pound note in your life.
Sell above a burn to the upside above white line & target a lower low
Sell failure/ricochet at Mr. Maroon
Sell after a successful sell
Cover upon undercut of a Red Burn (overdrive)
Cover upon successful buy, preferably in the oversold
1)
2)
3)
4)
5)
The Triangles and the corresponding labels, the overbought/oversold lines, the BURN plots (along with the R lines) are all part of Wishing On a Star V1.2 (the indicator) which is available for a price (haven’t figured it yet).
MR. Maroon is included in the LEMA30N – part of the package coming with the purchase of the E-book, “Computer Aided Trading” to be released in the following days.
As an insight, a burn plot goes something like this –
– but it would not be worth as much if I did not figure a way to start plotting while the 3rd candle is being printed (real time) – and of course, I did.
The oversold/overbought levels are adjusted to my modified fractals idea.
Green Burns were exceeded by – stats
The minimum closest drop was 18.4 pips measured from the R’s entry line.
Yesterday (The first unofficial forward testing day) the EA opened a short at 1.13132 at 1:58 AM server time. I closed it out manually at 6%, but if I did not, it would not have touched it at least till 1.1232, and with the opened size and the 81 pips it would had meant 45% gains for a day. Not bad from an auto trading routine. The best robot I have seen advertised on LinkedIn (on a real account) made 100% in 10 months. Just to compare.
Little quotes here and there from the song at the end of the page.
One spark among the embers…
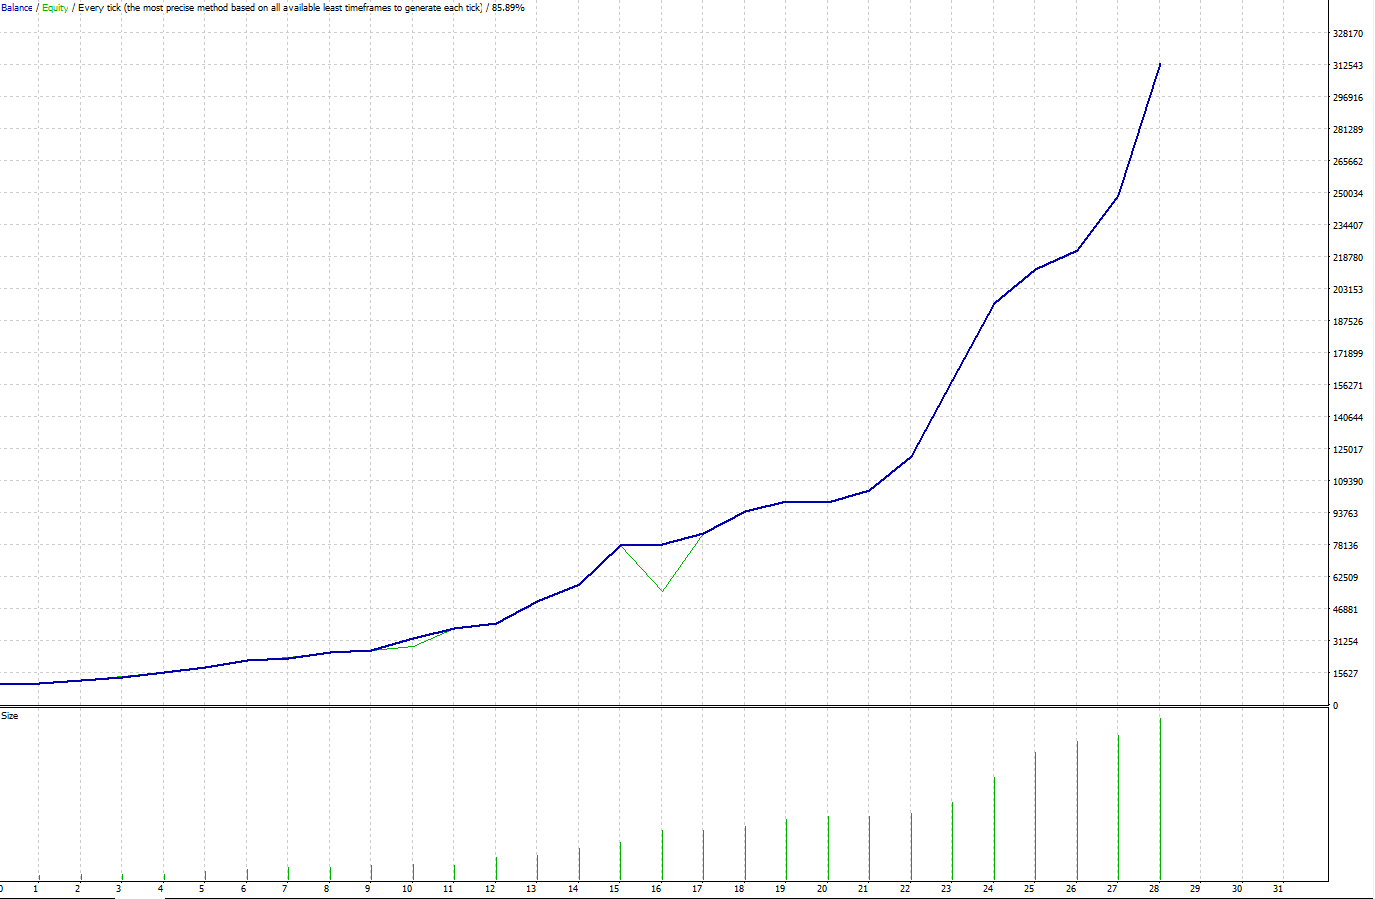
What is wrong with the following back test?
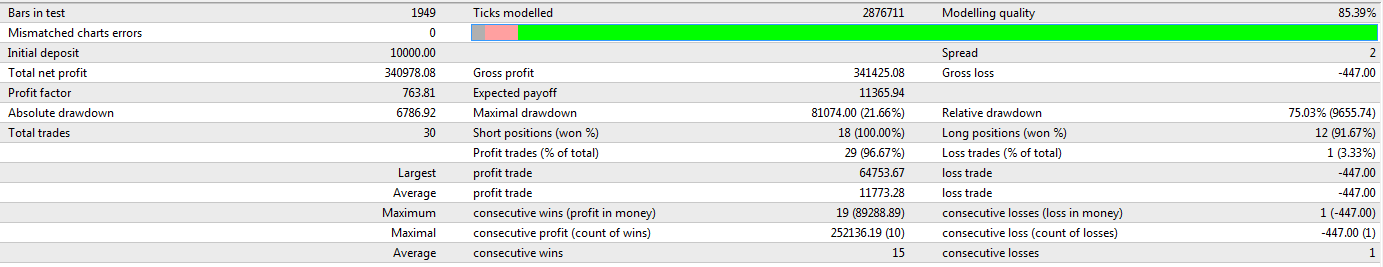
There is an interesting profit factor number coming up on the following image…
Is the problem that it only made 3,034% gains in 2 months?
That’s right, but why?
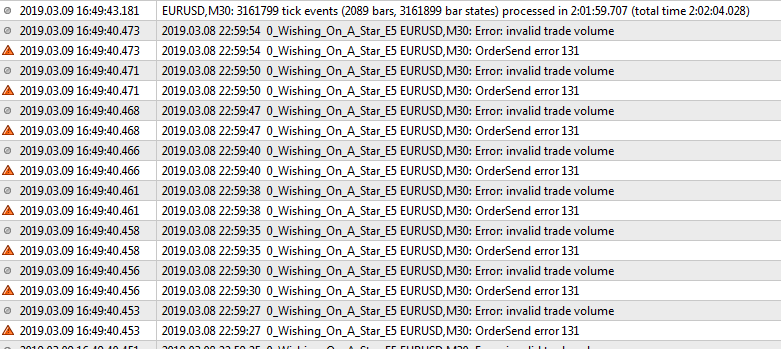
One voice against surrender
Why could it not open any more trades, what was wrong with the trade volume size?
One dream that’s worth defending…
See the entry of the Maximum Lot Size? That is what this broker imposed as a limitation. You can find out in a second what a broker forgets to communicate out of deception.
You could buy my book for instance in a month or so for £19.99 – the best 20 Pound note you will ever spend – and after I have your email I could send you a small indicator package that would include the Broker Auditor routine that I made.
One love that’s never-ending…
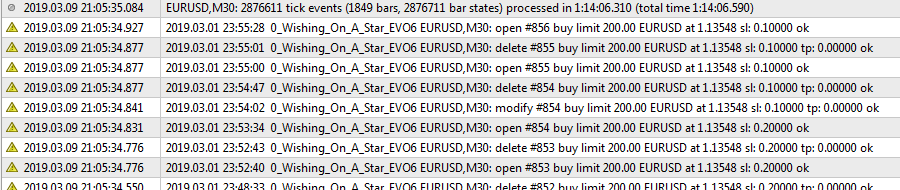
So, let’s run that test again!
First Trade: 8th of January, 2019
Last Trade: 1st of March, 2019
Is this much more? 3410%? No, but this was about knowing your working parameters, your limitations correctly. And as a side effect, when the maximum lot side gets reached, the EA would not simply stop working entirely.
Now I can speak of an EA, one EA as “My EA”. It had to go through 6 Evolutionary steps to be a stand alone, all encompassing Automated Trading Mogul with Full Hedging Capabilities, multiple Cropper Routines and Smart Trail stops in one single Program.
One thing I’m extra proud of is the time outs, when there are no positions open give you plenty of opportunities for withdrawal.
30 round trip trades on 40 trading days is very manageable.
This is my only EA that was specifically designed for the extremes, an embedded, trending market and not opportunistic trading, in a nut shell.